Embed Size (px)
Citation preview
October 15-18, 2013 Chris Gaston, Ph.D. 1
Matching market signals to the Canadian wood products value chain ─ a disaggregated trade model approach
Chris Gaston, PhD
Forest Sector ModellingLillehammer, Norway
TM
2Chris Gaston October 2013
Overview
• Some context for evolving wood attributes• Forintek Trade Model (1998 and 2006)
• Model description• Base-line forecasts• Scenario analyses
• Application to VCO Network (2013/14)• Model expansion
– Countries– Lumber categories– Logs
3Chris Gaston October 2013
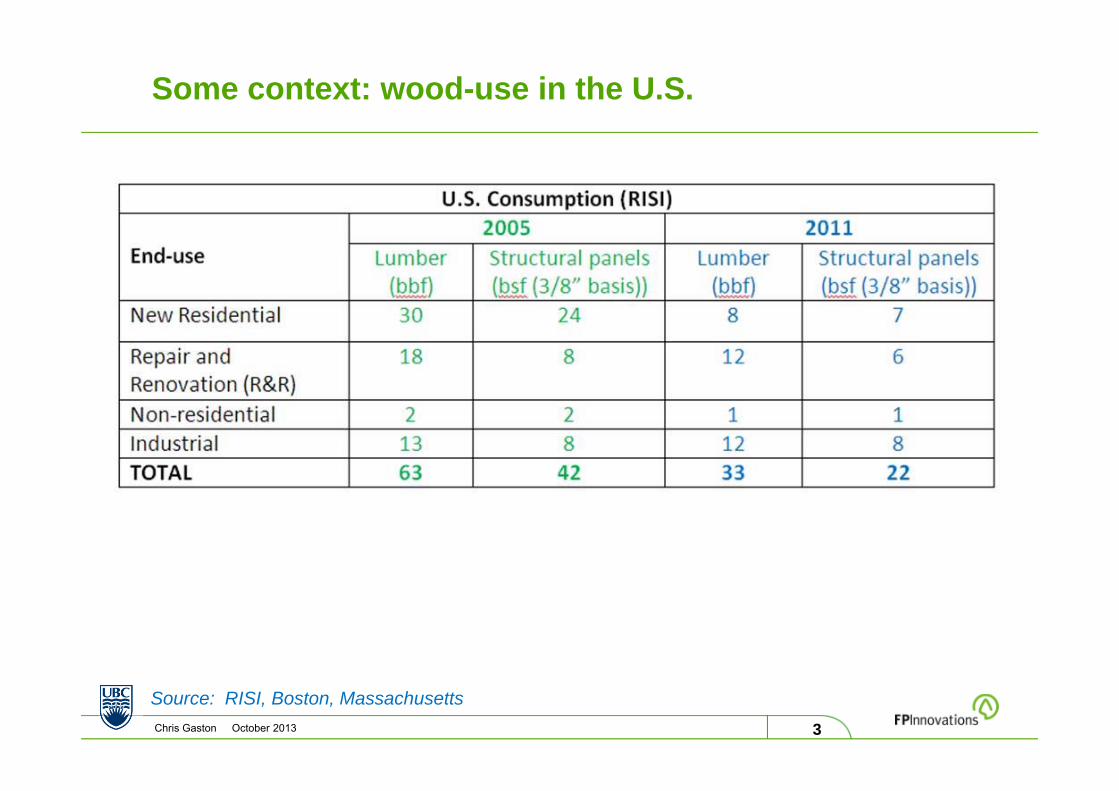
Some context: wood-use in the U.S.
Source: RISI, Boston, Massachusetts
4Chris Gaston October 2013
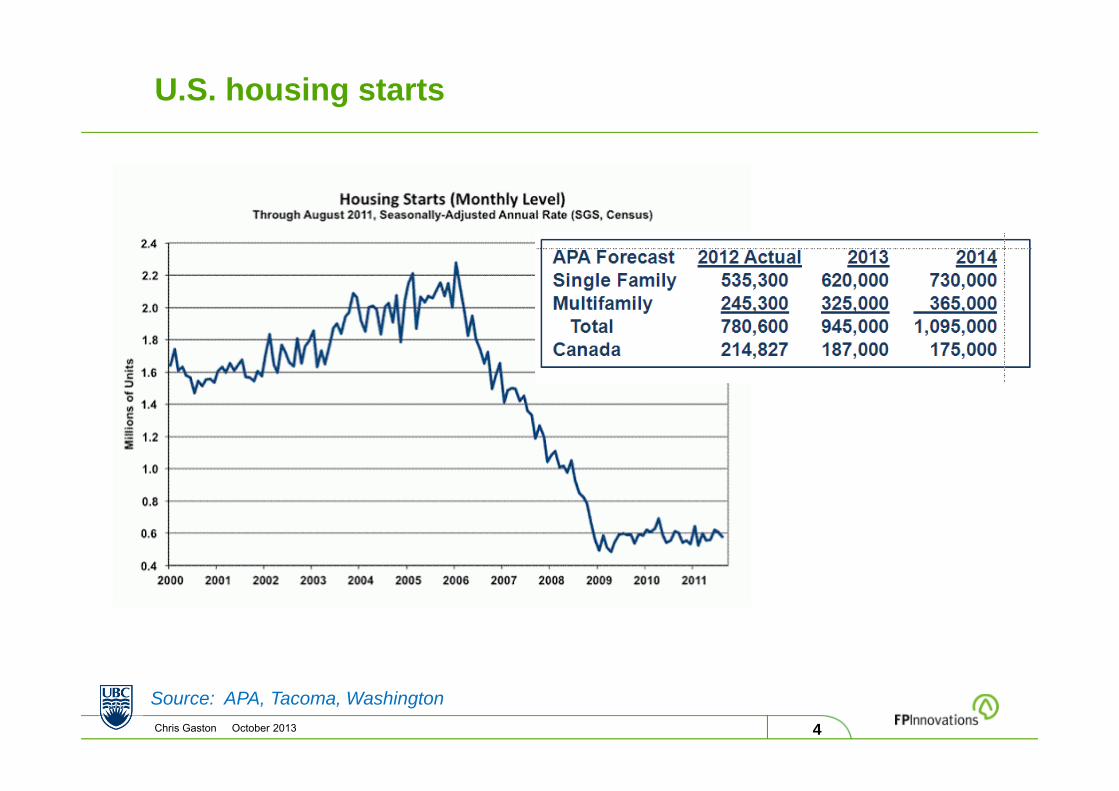
U.S. housing starts
Source: APA, Tacoma, Washington
5Chris Gaston October 2013
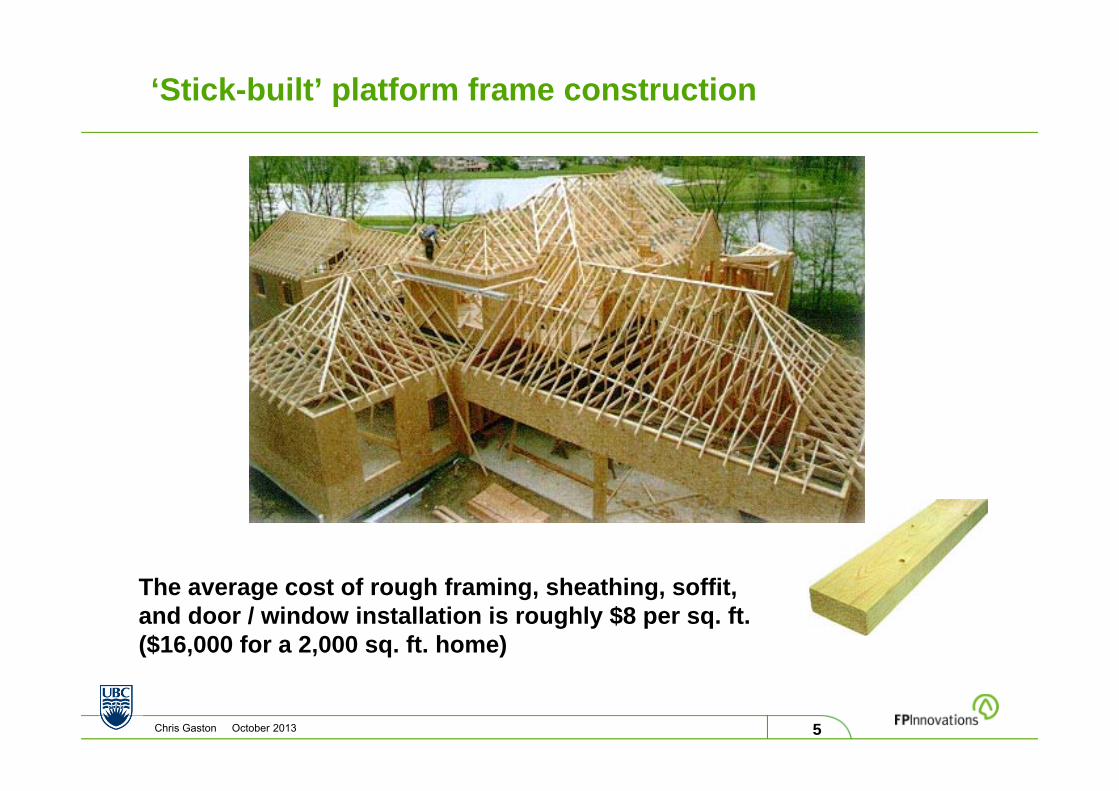
‘Stick-built’ platform frame construction
The average cost of rough framing, sheathing, soffit, and door / window installation is roughly $8 per sq. ft.($16,000 for a 2,000 sq. ft. home)
6Chris Gaston October 2013
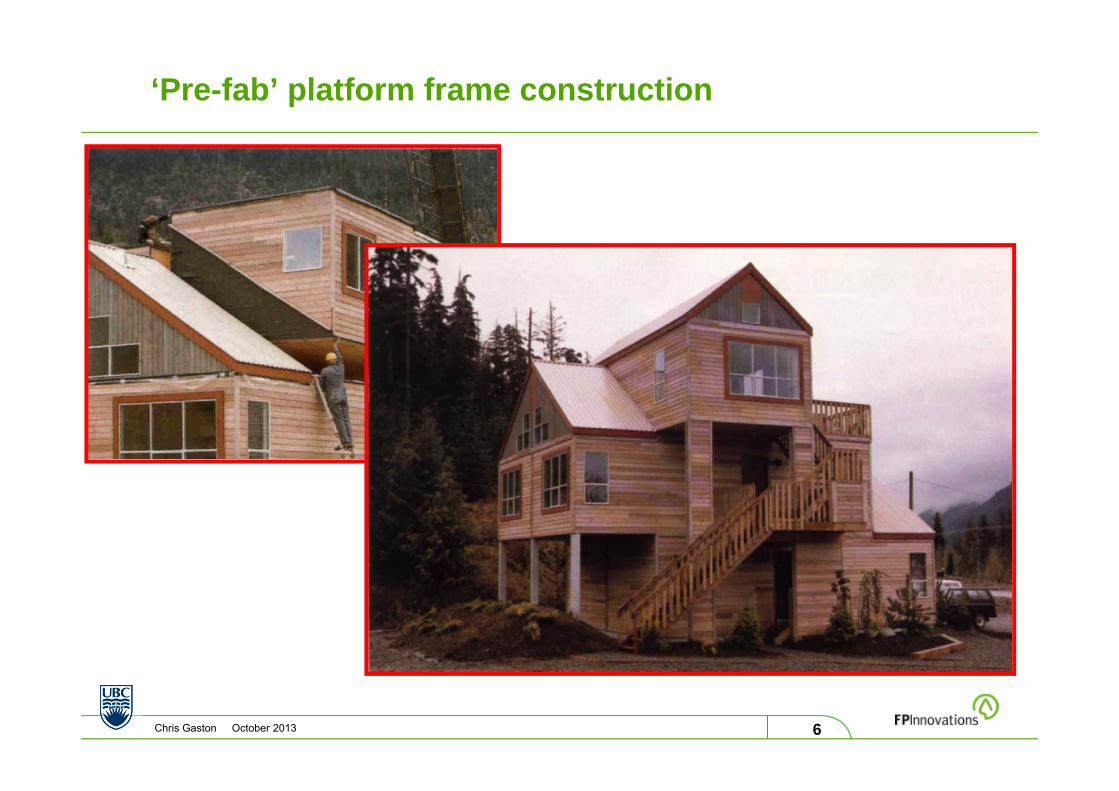
‘Pre-fab’ platform frame construction
7Chris Gaston October 2013
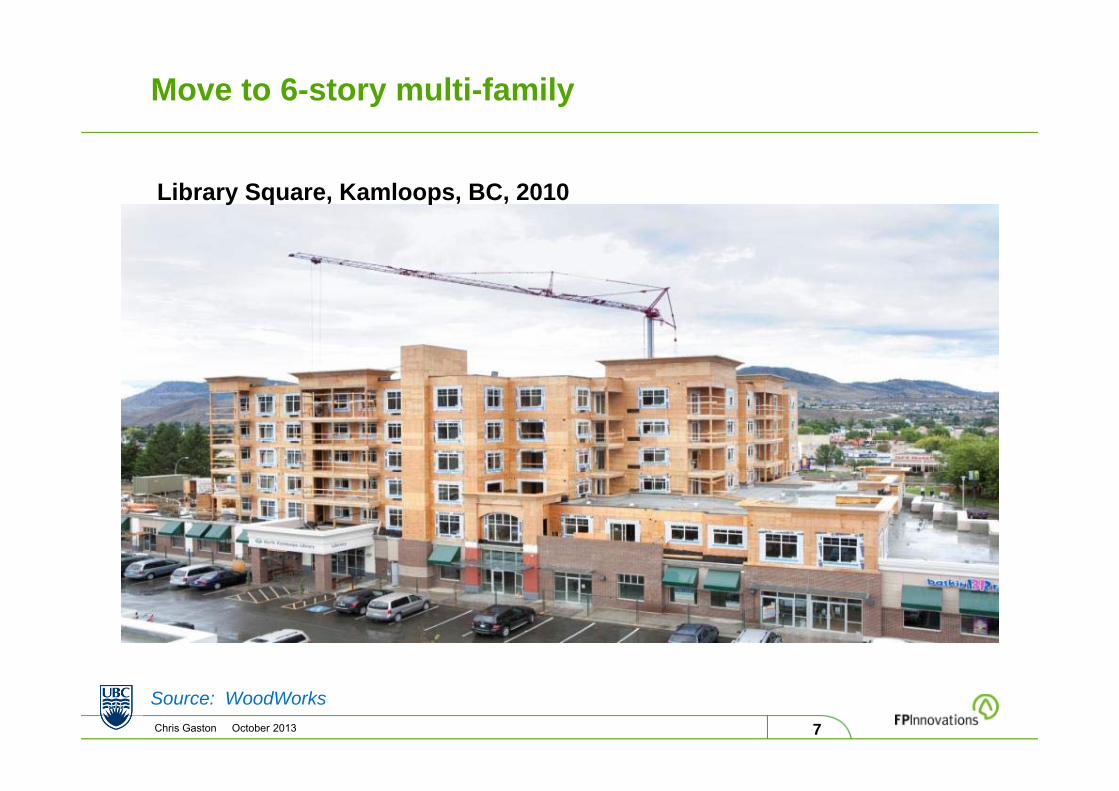
Move to 6-story multi-family
Source: WoodWorks
Library Square, Kamloops, BC, 2010
8Chris Gaston October 2013
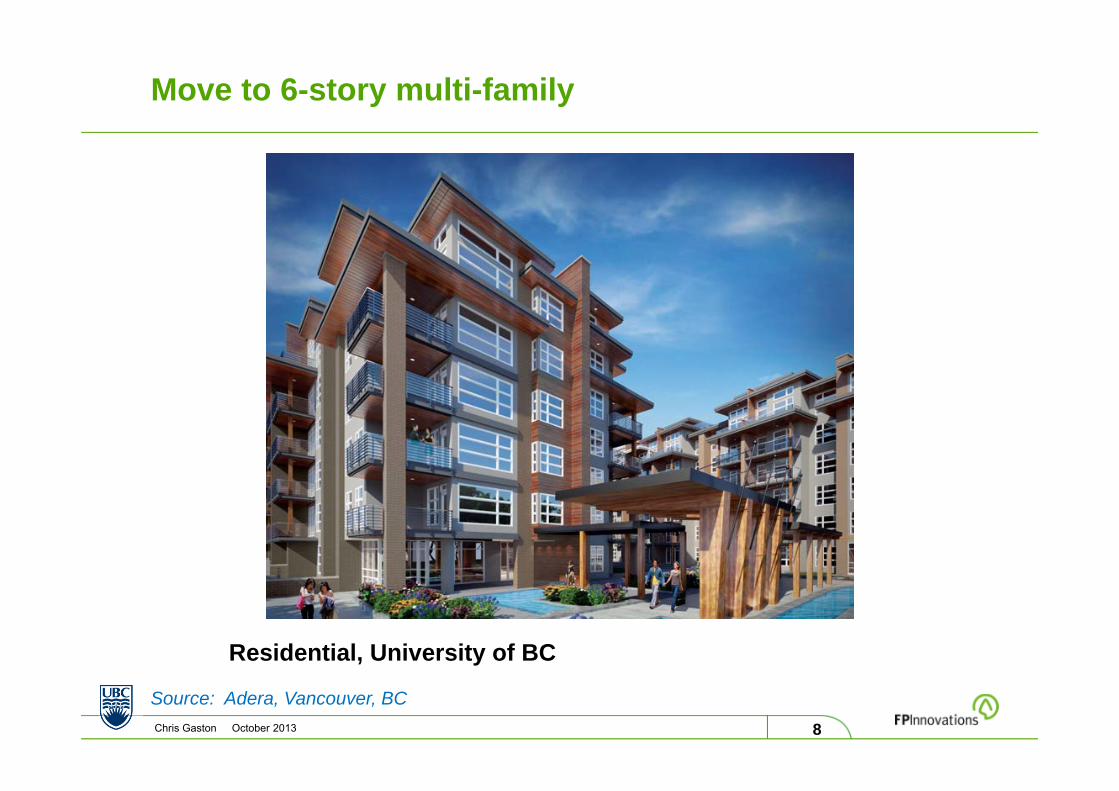
Source: Adera, Vancouver, BC
Residential, University of BC
Move to 6-story multi-family
9Chris Gaston October 2013
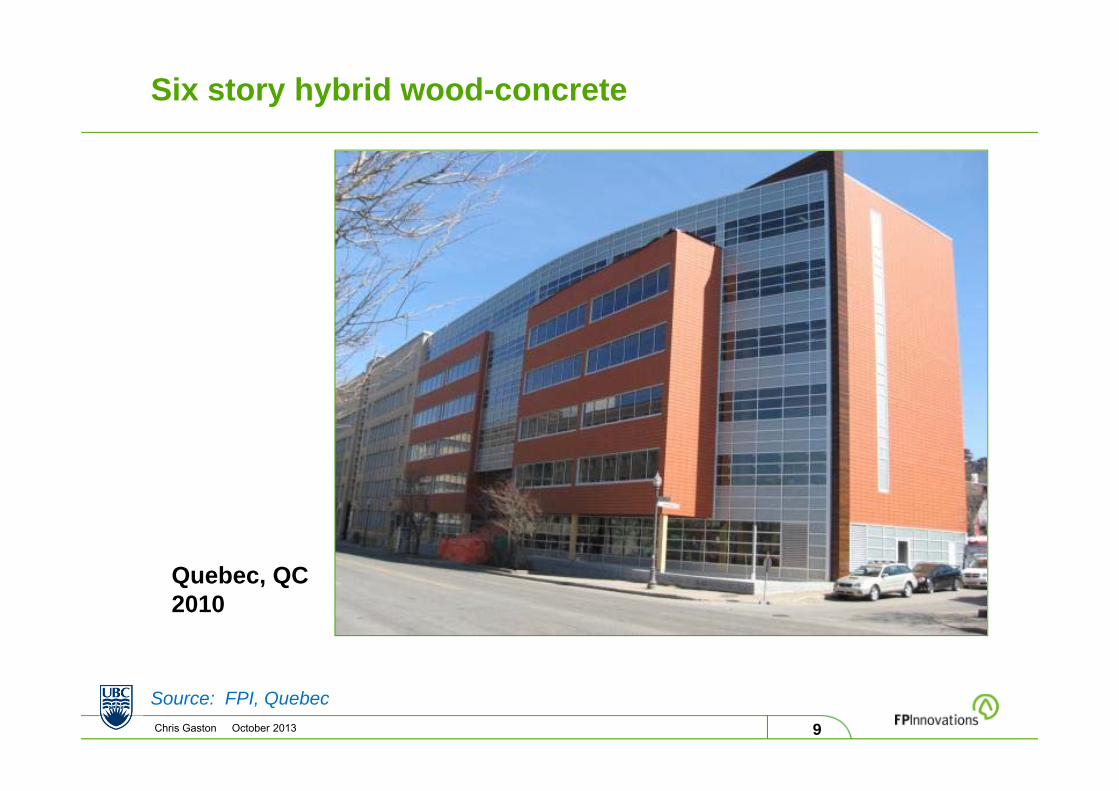
Six story hybrid wood-concrete
Source: FPI, Quebec
Quebec, QC2010
10Chris Gaston October 2013
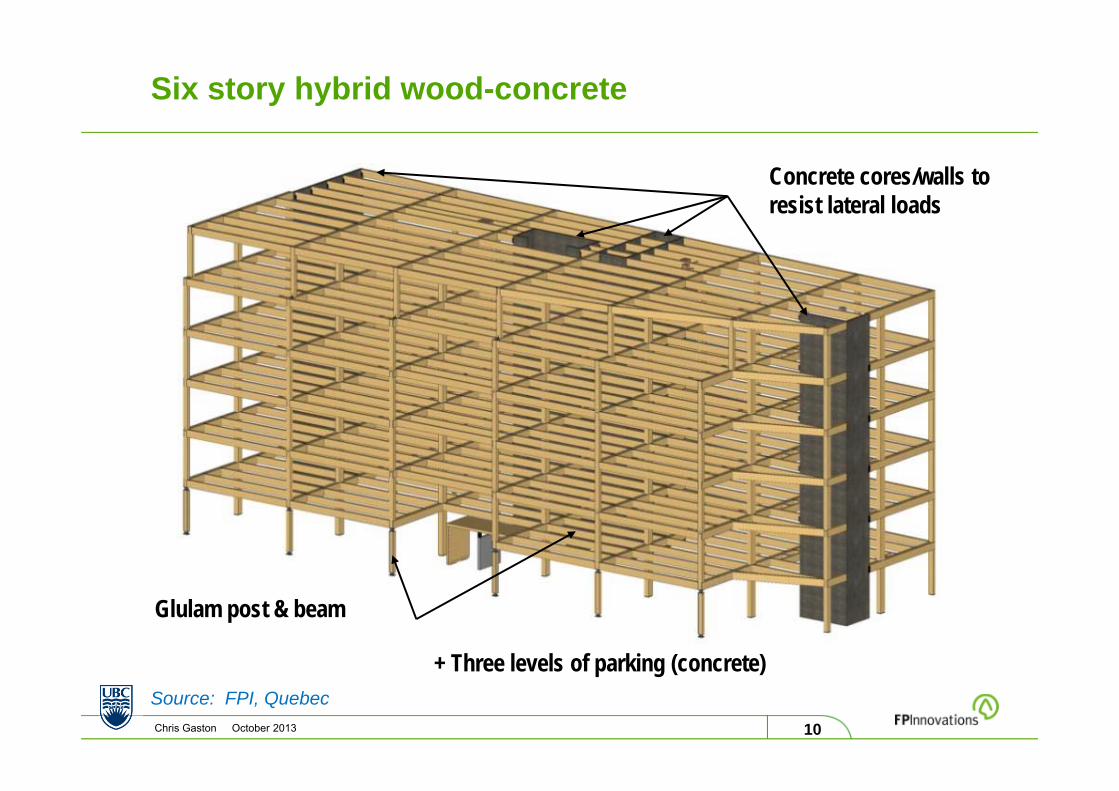
Six story hybrid wood-concrete
Source: FPI, Quebec
Concrete cores/walls to resist lateral loads
Glulam post & beam
+ Three levels of parking (concrete)
11Chris Gaston October 2013
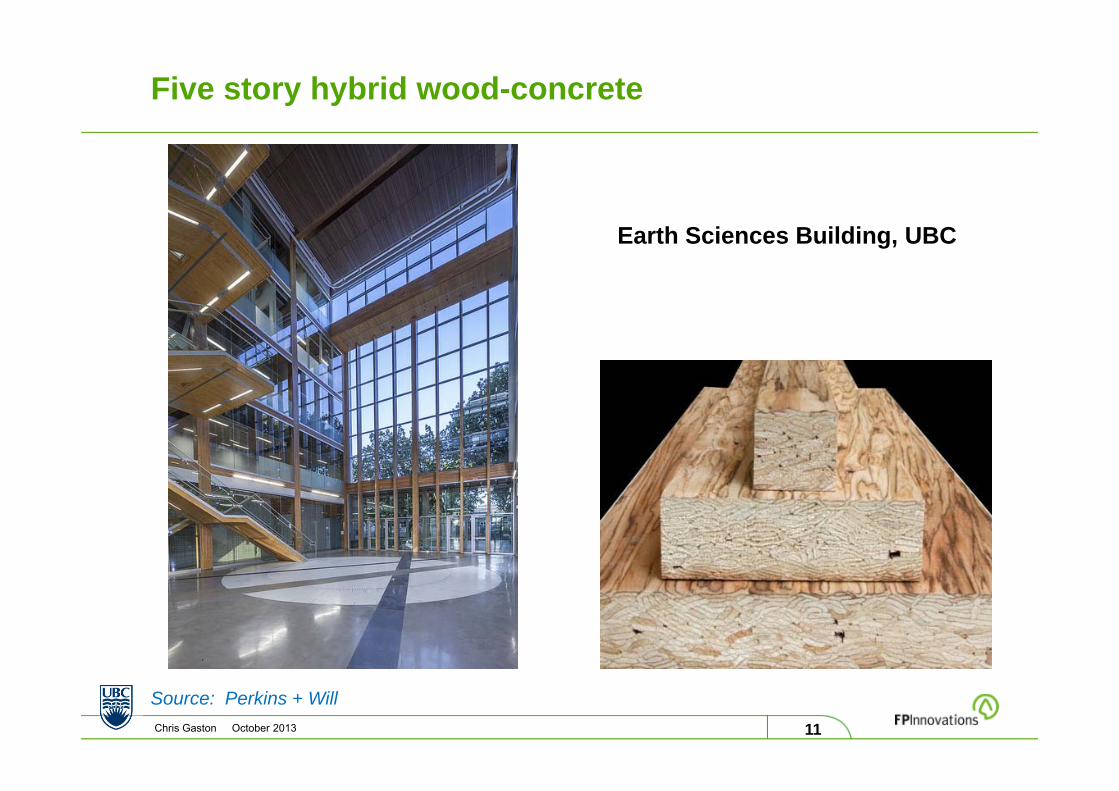
Five story hybrid wood-concrete
Source: Perkins + Will
Earth Sciences Building, UBC
12Chris Gaston October 2013
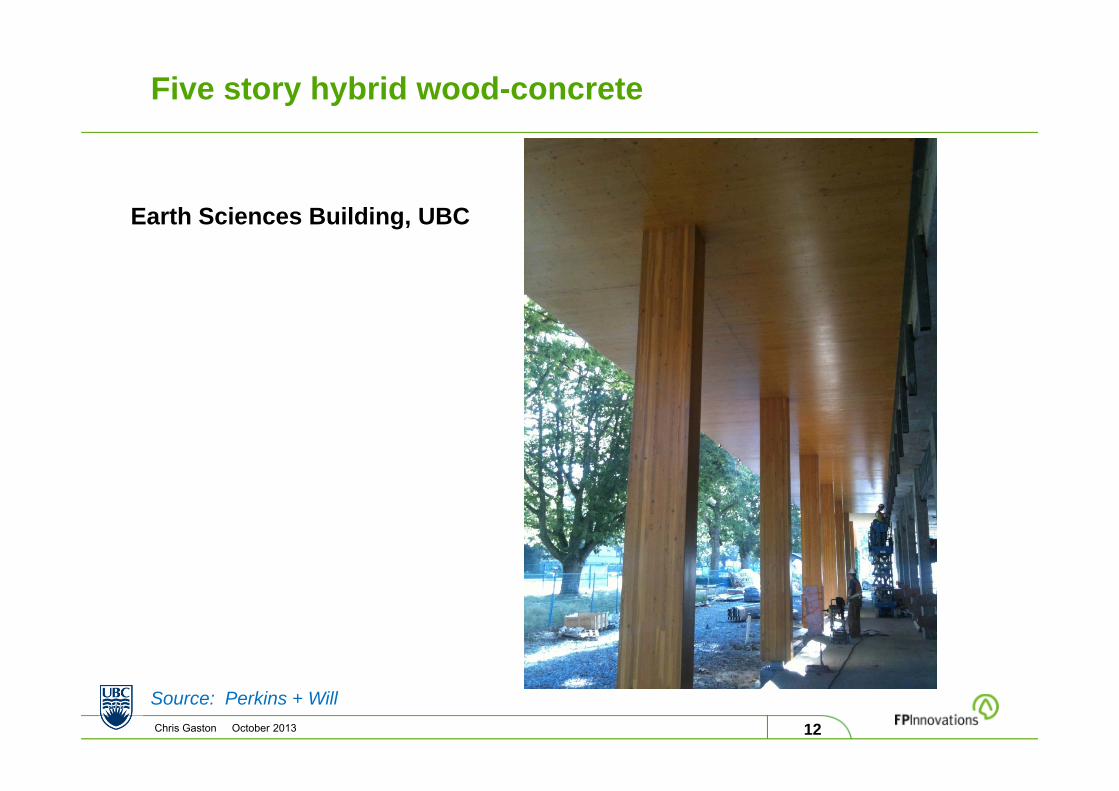
Five story hybrid wood-concrete
Source: Perkins + Will
Earth Sciences Building, UBC

13Chris Gaston October 2013
‘Tall Buildings’
Source: Michael Green Architecture
Wood Innovation Design Centre, Prince George, BC

14Chris Gaston October 2013
‘Tall buildings’
Source: Michael Green Architecture
“We are in a unique moment in architectural and building engineering history when shifting world needs has asked us to question some of the fundamentals of how we have built for the last century and how we will build in the next.”
Michael Green
15Chris Gaston October 2013
The Forintek Trade Model
Source: Gaston, et al., 2006
16Chris Gaston October 2013
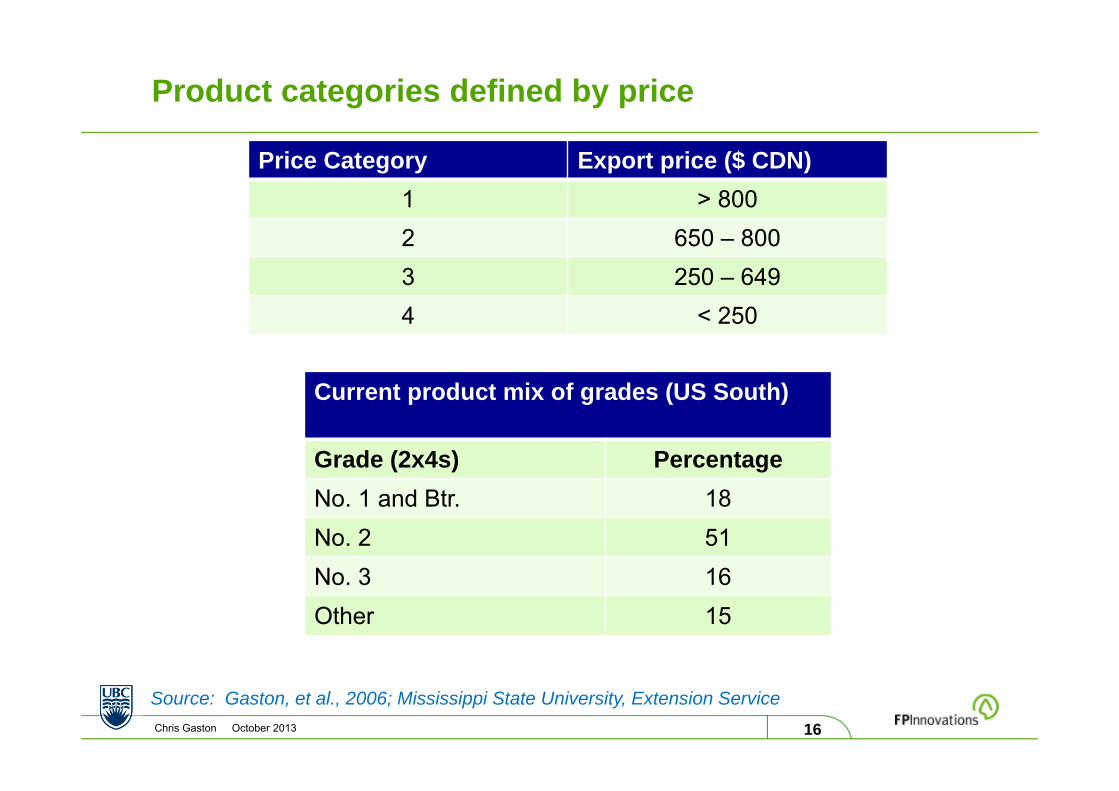
Product categories defined by price
Source: Gaston, et al., 2006; Mississippi State University, Extension Service
Current product mix of grades (US South)
Grade (2x4s) PercentageNo. 1 and Btr. 18No. 2 51No. 3 16Other 15
Price Category Export price ($ CDN)1 > 8002 650 – 8003 250 – 6494 < 250
17Chris Gaston October 2013
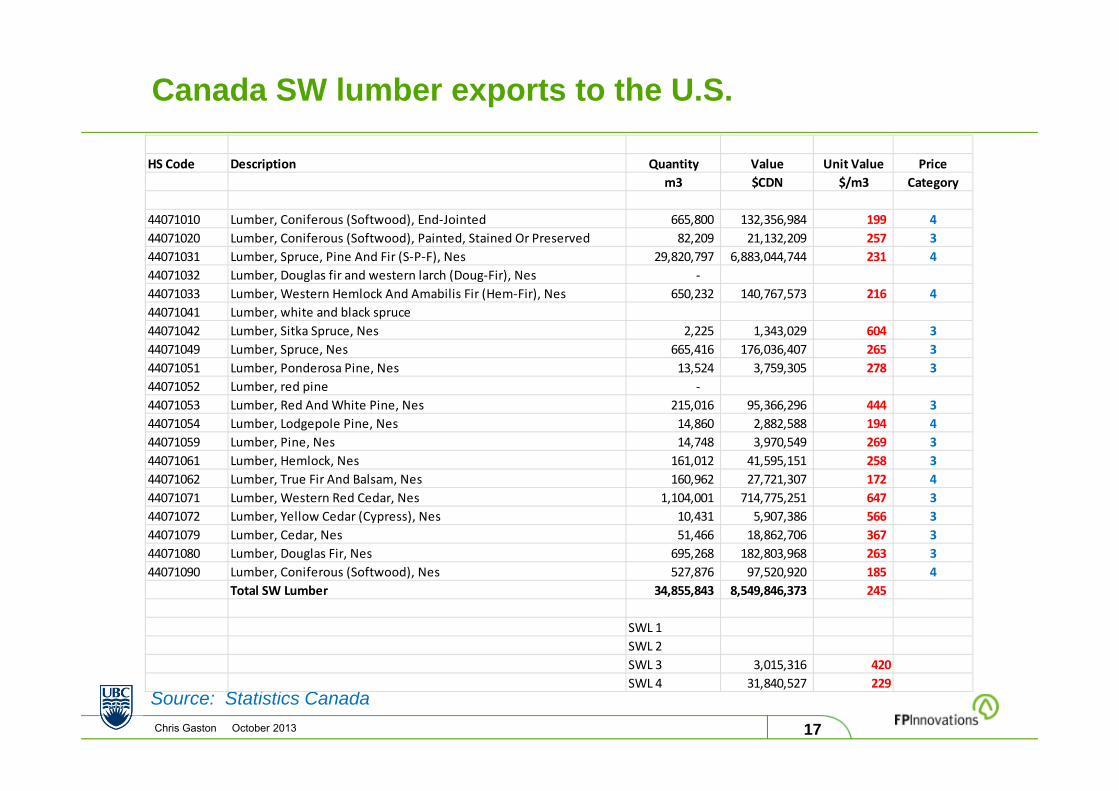
Canada SW lumber exports to the U.S.
Source: Statistics Canada
HS Code Description Quantity Value Unit Value Pricem3 $CDN $/m3 Category
44071010 Lumber, Coniferous (Softwood), End‐Jointed 665,800 132,356,984 199 444071020 Lumber, Coniferous (Softwood), Painted, Stained Or Preserved 82,209 21,132,209 257 344071031 Lumber, Spruce, Pine And Fir (S‐P‐F), Nes 29,820,797 6,883,044,744 231 444071032 Lumber, Douglas fir and western larch (Doug‐Fir), Nes ‐ 44071033 Lumber, Western Hemlock And Amabilis Fir (Hem‐Fir), Nes 650,232 140,767,573 216 444071041 Lumber, white and black spruce44071042 Lumber, Sitka Spruce, Nes 2,225 1,343,029 604 344071049 Lumber, Spruce, Nes 665,416 176,036,407 265 344071051 Lumber, Ponderosa Pine, Nes 13,524 3,759,305 278 344071052 Lumber, red pine ‐ 44071053 Lumber, Red And White Pine, Nes 215,016 95,366,296 444 344071054 Lumber, Lodgepole Pine, Nes 14,860 2,882,588 194 444071059 Lumber, Pine, Nes 14,748 3,970,549 269 344071061 Lumber, Hemlock, Nes 161,012 41,595,151 258 344071062 Lumber, True Fir And Balsam, Nes 160,962 27,721,307 172 444071071 Lumber, Western Red Cedar, Nes 1,104,001 714,775,251 647 344071072 Lumber, Yellow Cedar (Cypress), Nes 10,431 5,907,386 566 344071079 Lumber, Cedar, Nes 51,466 18,862,706 367 344071080 Lumber, Douglas Fir, Nes 695,268 182,803,968 263 344071090 Lumber, Coniferous (Softwood), Nes 527,876 97,520,920 185 4
Total SW Lumber 34,855,843 8,549,846,373 245
SWL 1SWL 2SWL 3 3,015,316 420SWL 4 31,840,527 229
18Chris Gaston October 2013
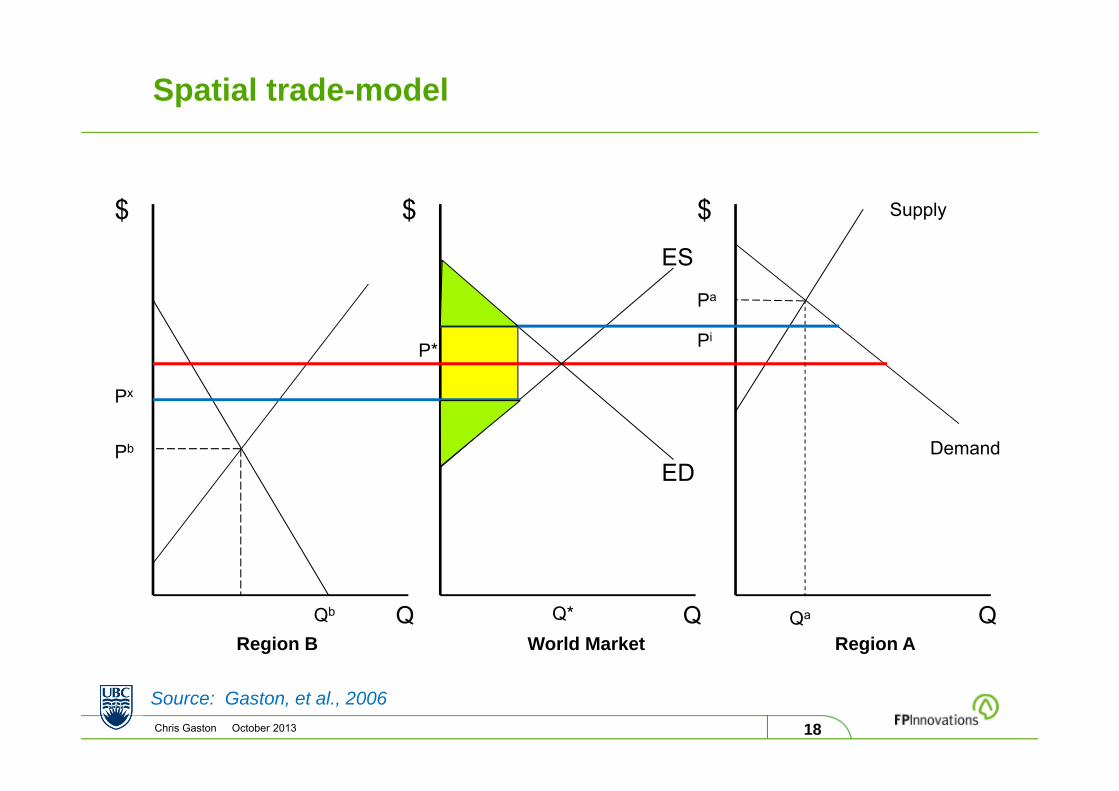
Spatial trade-model
Source: Gaston, et al., 2006
$
Q
$
Q
$
Q
ES
ED
Region B World Market Region A
Pb
Pa
Qb Qa
P*
Q*
Supply
Demand
Px
Pi
19Chris Gaston October 2013
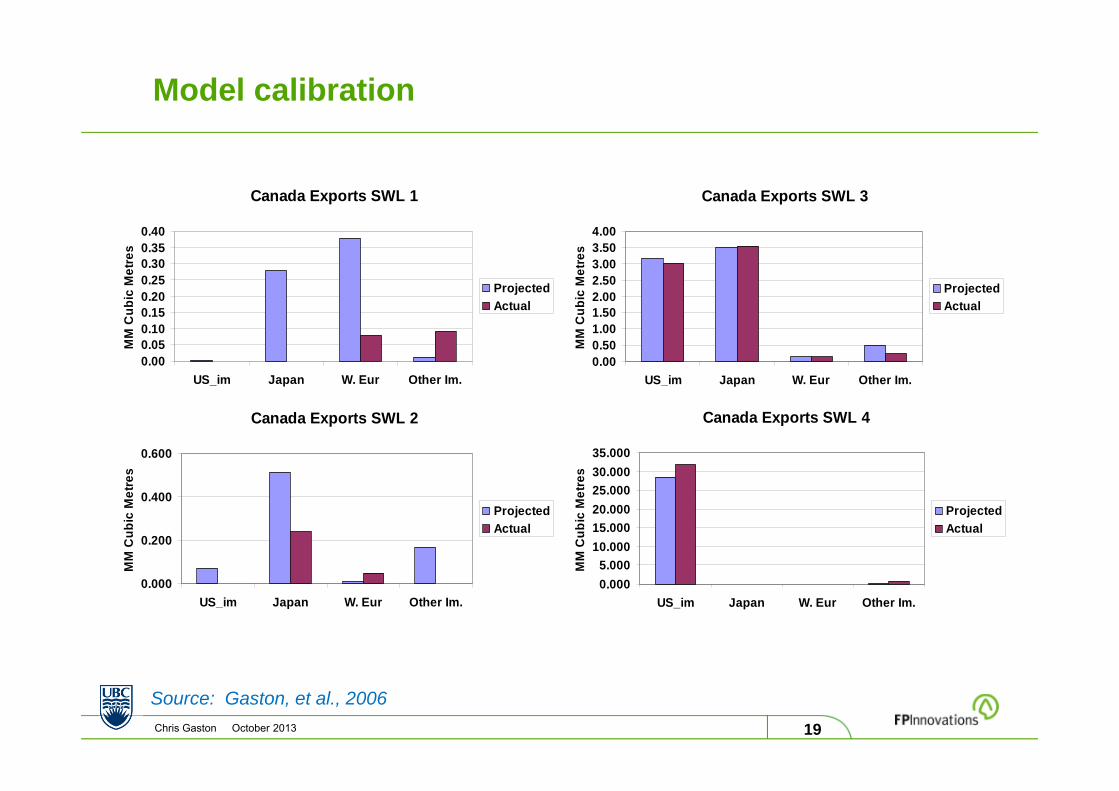
Model calibration
Source: Gaston, et al., 2006
Canada Exports SWL 1
0.000.050.100.150.200.250.300.350.40
US_im Japan W. Eur Other Im.
MM
Cub
ic M
etre
s
ProjectedActual
Canada Exports SWL 3
0.000.501.001.502.002.503.003.504.00
US_im Japan W. Eur Other Im.
MM
Cub
ic M
etre
s
ProjectedActual
Canada Exports SWL 2
0.000
0.200
0.400
0.600
US_im Japan W. Eur Other Im.
MM
Cub
ic M
etre
s
ProjectedActual
Canada Exports SWL 4
0.0005.000
10.00015.00020.00025.00030.00035.000
US_im Japan W. Eur Other Im.
MM
Cub
ic M
etre
s
ProjectedActual
20Chris Gaston October 2013
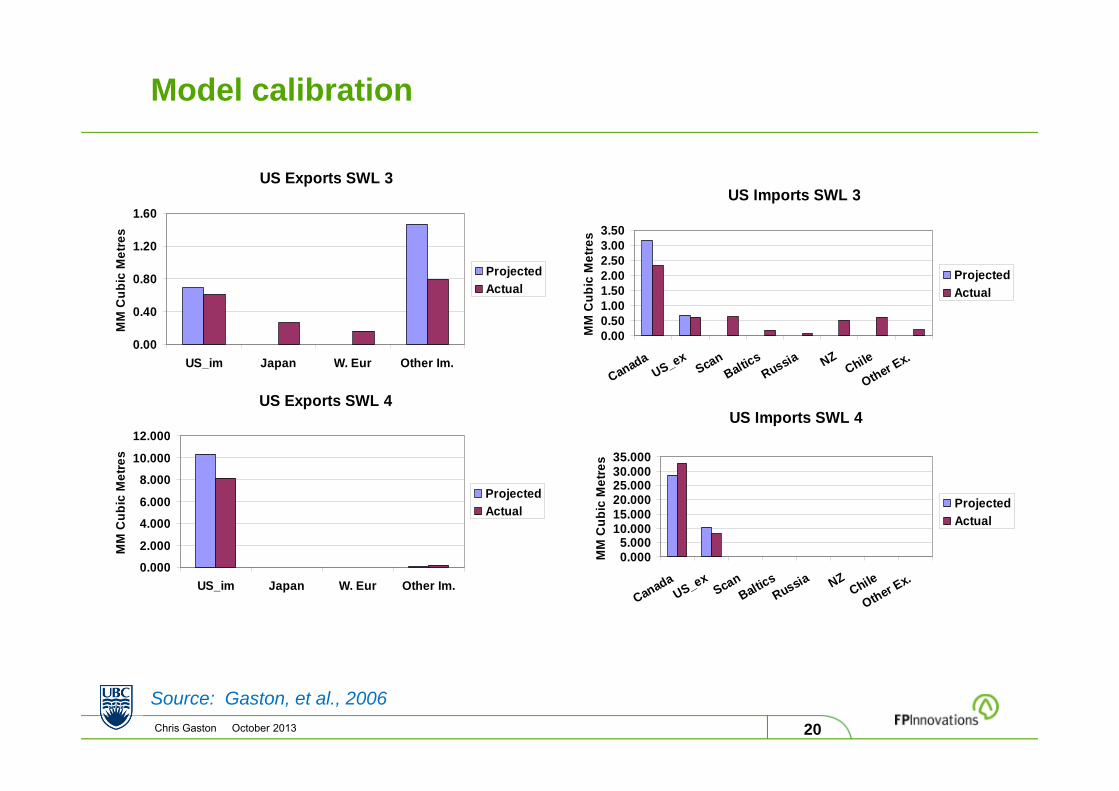
Model calibration
Source: Gaston, et al., 2006
US Exports SWL 3
0.00
0.40
0.80
1.20
1.60
US_im Japan W. Eur Other Im.
MM
Cub
ic M
etre
s
ProjectedActual
US Exports SWL 4
0.0002.000
4.0006.000
8.00010.000
12.000
US_im Japan W. Eur Other Im.
MM
Cub
ic M
etre
s
ProjectedActual
US Imports SWL 3
0.000.501.001.502.002.503.003.50
CanadaUS_ex
ScanBaltic
sRussia NZ
Chile
Other Ex.
MM
Cub
ic M
etre
s
ProjectedActual
US Imports SWL 4
0.0005.000
10.00015.00020.00025.00030.00035.000
CanadaUS_ex
ScanBaltic
sRussia NZ
Chile
Other Ex.
MM
Cub
ic M
etre
s
ProjectedActual
21Chris Gaston October 2013
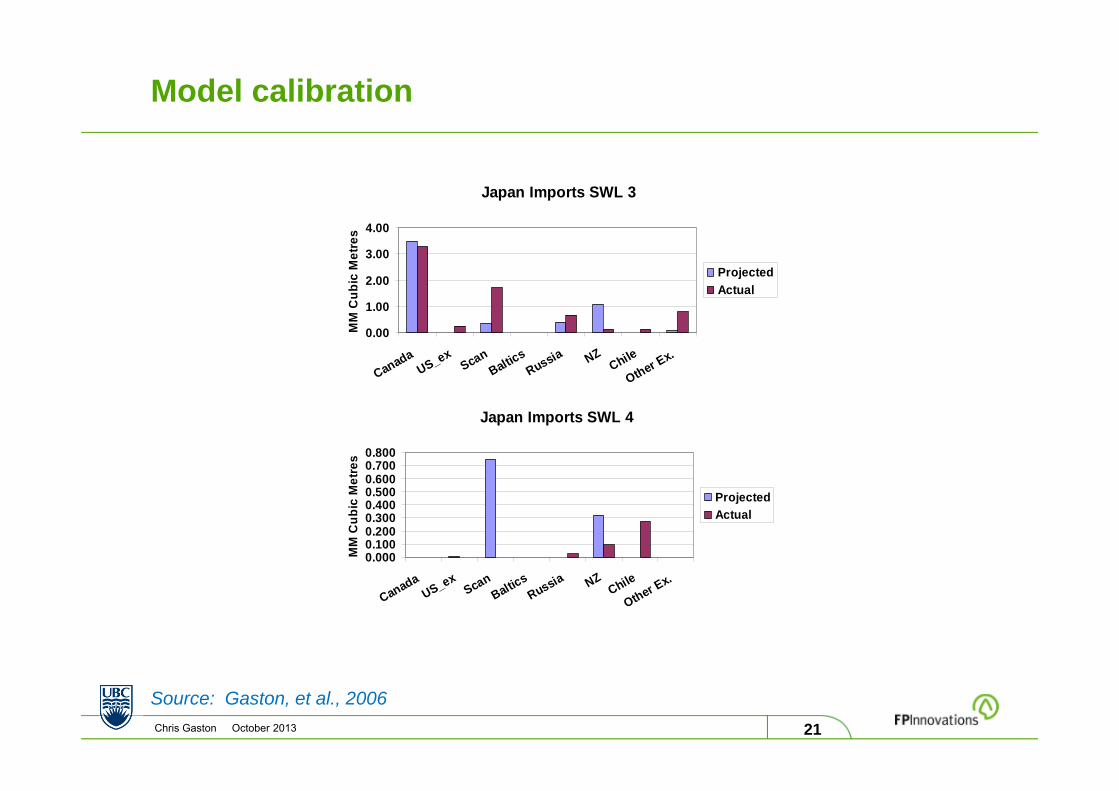
Model calibration
Source: Gaston, et al., 2006
Japan Imports SWL 3
0.00
1.00
2.00
3.00
4.00
CanadaUS_ex
ScanBaltic
sRussia NZ
Chile
Other Ex.M
M C
ubic
Met
res
ProjectedActual
Japan Imports SWL 4
0.0000.1000.2000.3000.4000.5000.6000.7000.800
CanadaUS_ex
ScanBaltic
sRussia NZ
Chile
Other Ex.
MM
Cub
ic M
etre
s
ProjectedActual
22Chris Gaston October 2013
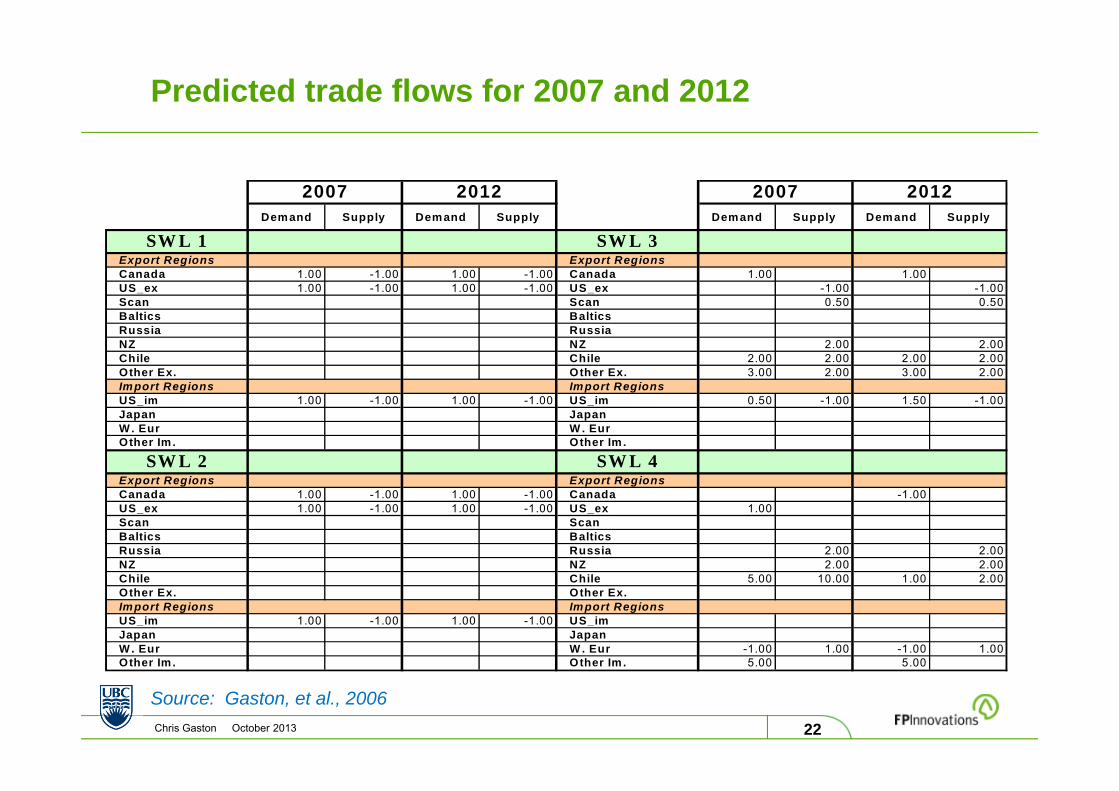
Predicted trade flows for 2007 and 2012
Source: Gaston, et al., 2006
Demand Supply Demand Supply Demand Supply Demand Supply
SW L 1 SW L 3Export Regions Export RegionsCanada 1.00 -1.00 1.00 -1.00 Canada 1.00 1.00US_ex 1.00 -1.00 1.00 -1.00 US_ex -1.00 -1.00Scan Scan 0.50 0.50Baltics BalticsRussia RussiaNZ NZ 2.00 2.00Chile Chile 2.00 2.00 2.00 2.00Other Ex. Other Ex. 3.00 2.00 3.00 2.00Import Regions Import RegionsUS_im 1.00 -1.00 1.00 -1.00 US_im 0.50 -1.00 1.50 -1.00Japan JapanW . Eur W . EurOther Im . Other Im .
SW L 2 SW L 4Export Regions Export RegionsCanada 1.00 -1.00 1.00 -1.00 Canada -1.00US_ex 1.00 -1.00 1.00 -1.00 US_ex 1.00Scan ScanBaltics BalticsRussia Russia 2.00 2.00NZ NZ 2.00 2.00Chile Chile 5.00 10.00 1.00 2.00Other Ex. Other Ex.Import Regions Import RegionsUS_im 1.00 -1.00 1.00 -1.00 US_imJapan JapanW . Eur W . Eur -1.00 1.00 -1.00 1.00Other Im . Other Im . 5.00 5.00
2007 2012 2007 2012
23Chris Gaston October 2013
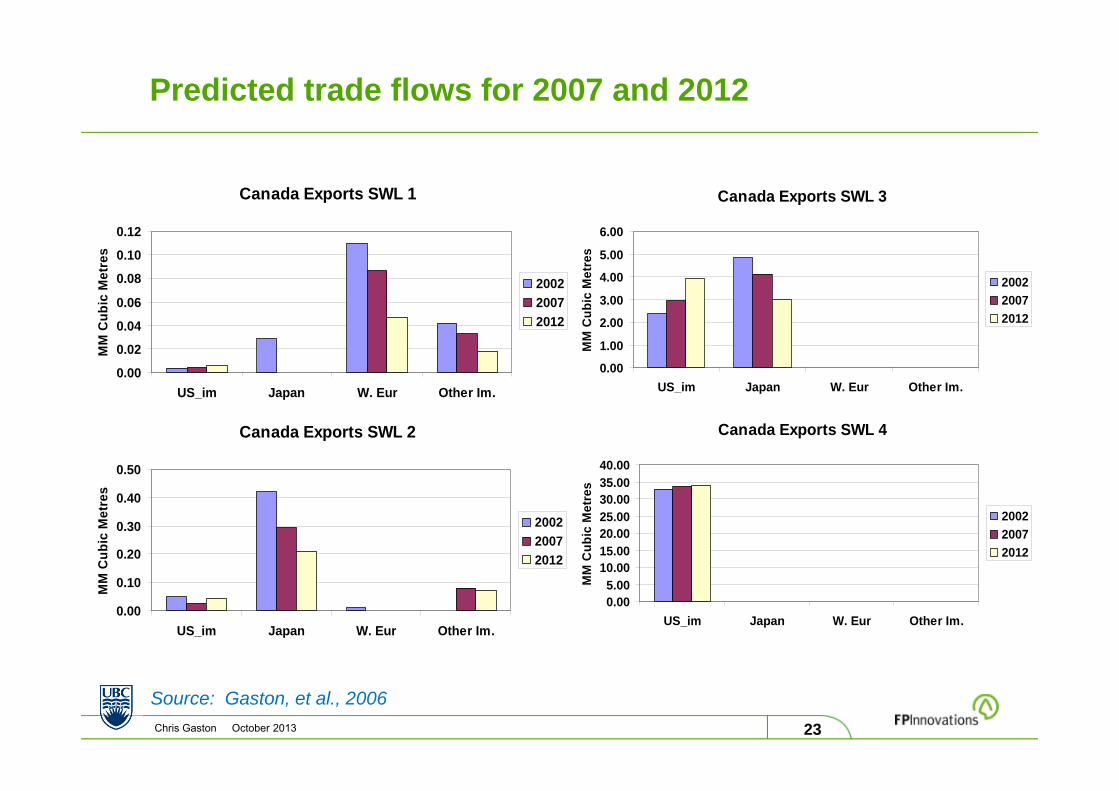
Predicted trade flows for 2007 and 2012
Source: Gaston, et al., 2006
Canada Exports SWL 1
0.00
0.02
0.04
0.06
0.08
0.10
0.12
US_im Japan W. Eur Other Im.
MM
Cub
ic M
etre
s
200220072012
Canada Exports SWL 3
0.00
1.00
2.00
3.00
4.00
5.00
6.00
US_im Japan W. Eur Other Im.
MM
Cub
ic M
etre
s
200220072012
Canada Exports SWL 2
0.00
0.10
0.20
0.30
0.40
0.50
US_im Japan W. Eur Other Im.
MM
Cub
ic M
etre
s
200220072012
Canada Exports SWL 4
0.005.00
10.0015.0020.0025.0030.0035.0040.00
US_im Japan W. Eur Other Im.
MM
Cub
ic M
etre
s
200220072012
24Chris Gaston October 2013
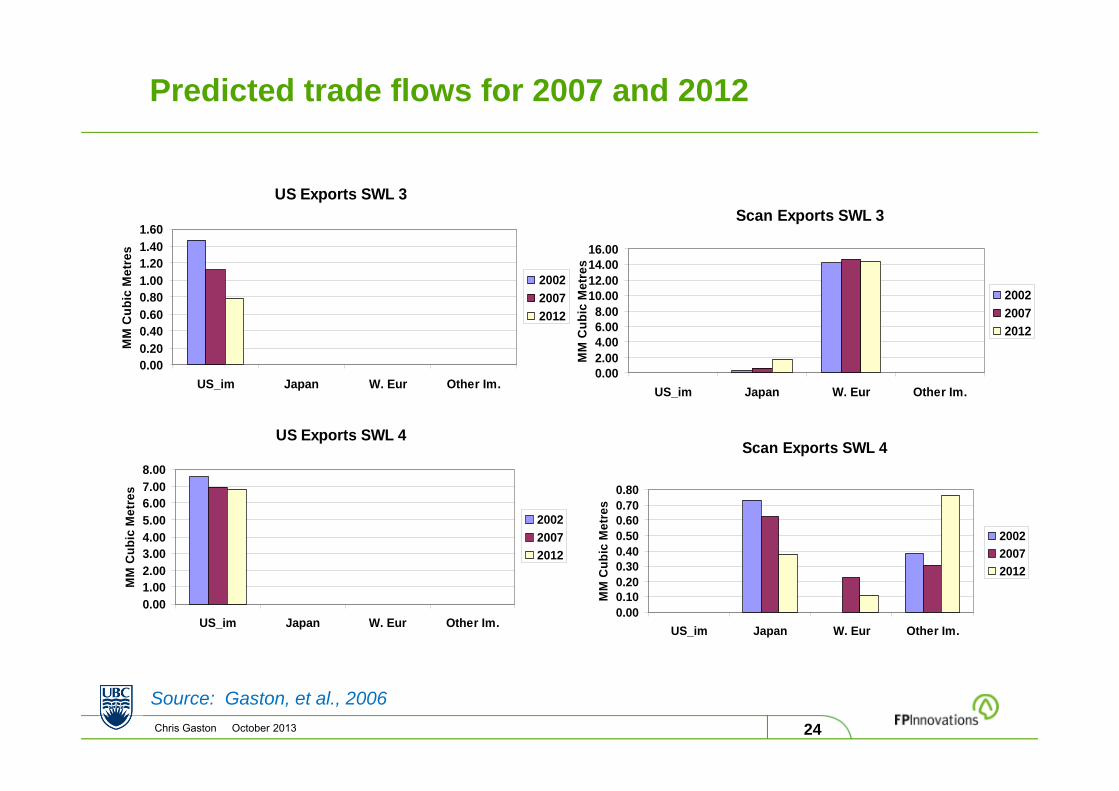
Predicted trade flows for 2007 and 2012
Source: Gaston, et al., 2006
US Exports SWL 3
0.000.200.400.600.801.001.201.401.60
US_im Japan W. Eur Other Im.
MM
Cub
ic M
etre
s
200220072012
US Exports SWL 4
0.001.002.003.004.005.006.007.008.00
US_im Japan W. Eur Other Im.
MM
Cub
ic M
etre
s
200220072012
Scan Exports SWL 3
0.002.004.006.008.00
10.0012.0014.0016.00
US_im Japan W. Eur Other Im.
MM
Cub
ic M
etre
s
200220072012
Scan Exports SWL 4
0.000.100.200.300.400.500.600.700.80
US_im Japan W. Eur Other Im.
MM
Cub
ic M
etre
s
200220072012
25Chris Gaston October 2013
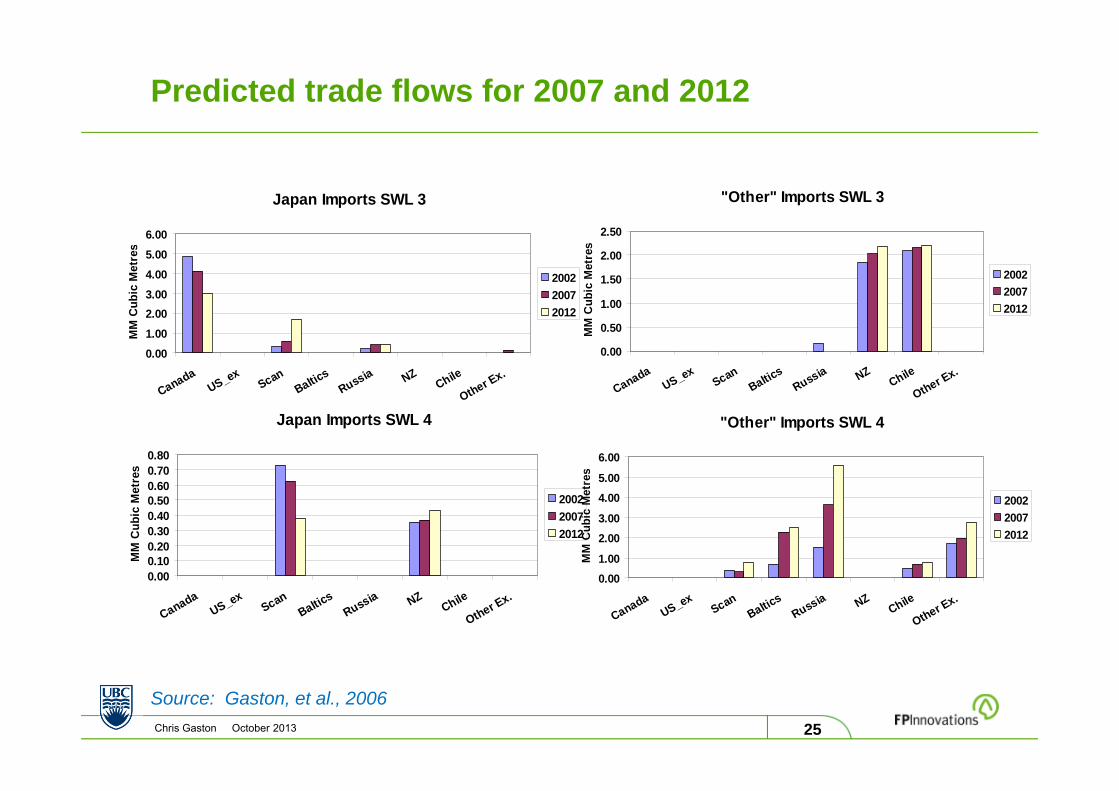
Predicted trade flows for 2007 and 2012
Source: Gaston, et al., 2006
Japan Imports SWL 3
0.001.002.003.004.005.006.00
CanadaUS_ex
ScanBaltics
Russia NZChile
Other Ex.
MM
Cub
ic M
etre
s
200220072012
Japan Imports SWL 4
0.000.100.200.300.400.500.600.700.80
CanadaUS_ex
ScanBaltics
Russia NZChile
Other Ex.
MM
Cub
ic M
etre
s
200220072012
"Other" Imports SWL 3
0.00
0.50
1.00
1.50
2.00
2.50
CanadaUS_ex
ScanBaltics
Russia NZChile
Other Ex.
MM
Cub
ic M
etre
s
200220072012
"Other" Imports SWL 4
0.001.00
2.003.00
4.005.00
6.00
CanadaUS_ex
ScanBaltics
Russia NZChile
Other Ex.M
M C
ubic
Met
res
200220072012
26Chris Gaston October 2013
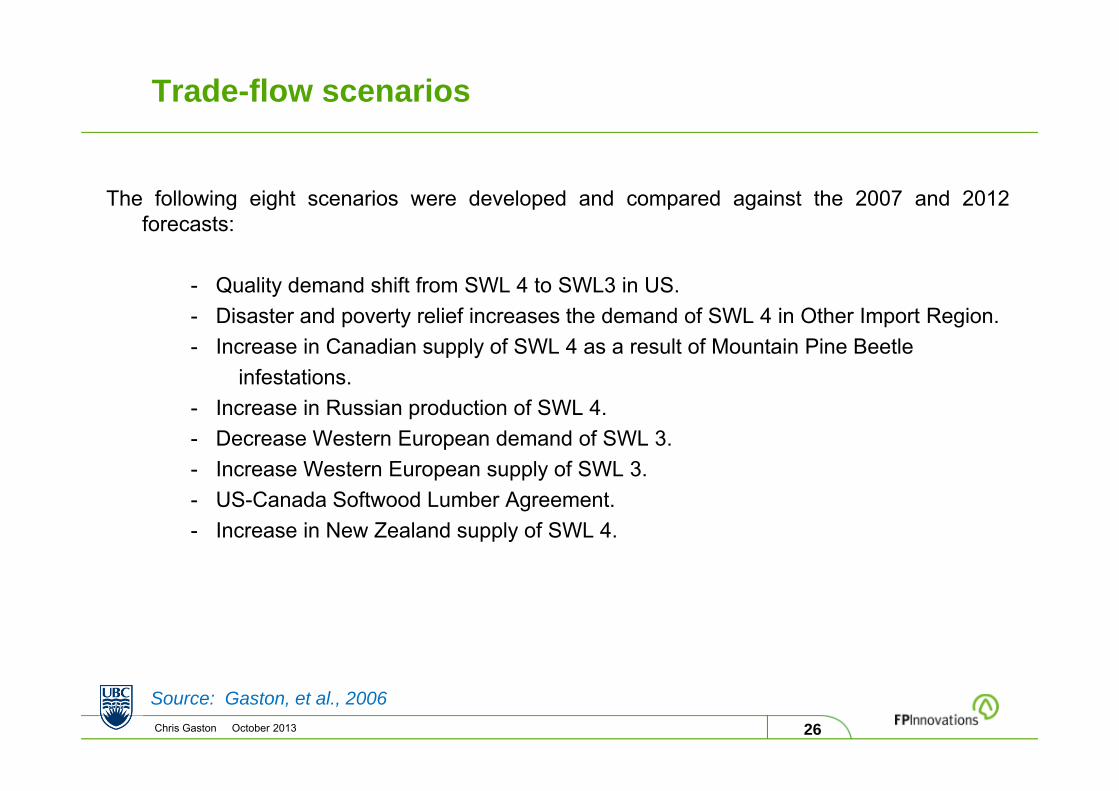
Trade-flow scenarios
Source: Gaston, et al., 2006
The following eight scenarios were developed and compared against the 2007 and 2012forecasts:
- Quality demand shift from SWL 4 to SWL3 in US.- Disaster and poverty relief increases the demand of SWL 4 in Other Import Region.- Increase in Canadian supply of SWL 4 as a result of Mountain Pine Beetle
infestations.- Increase in Russian production of SWL 4.- Decrease Western European demand of SWL 3.- Increase Western European supply of SWL 3. - US-Canada Softwood Lumber Agreement.- Increase in New Zealand supply of SWL 4.
27Chris Gaston October 2013
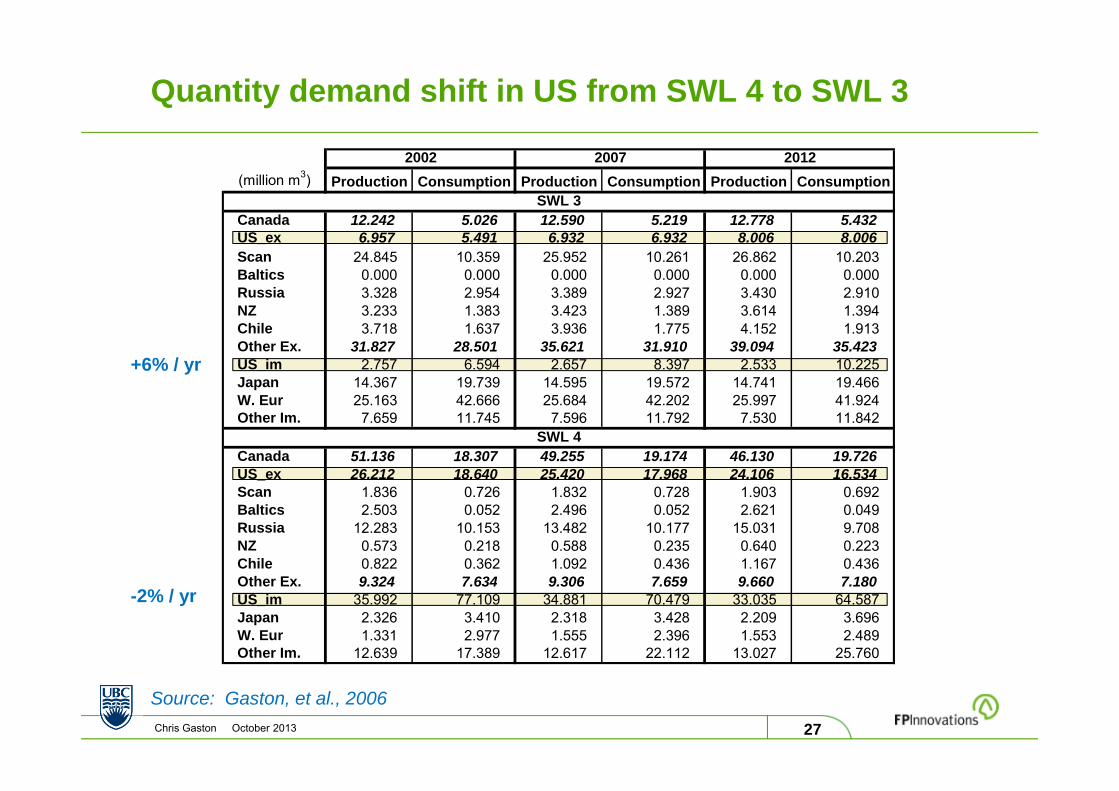
Quantity demand shift in US from SWL 4 to SWL 3
Source: Gaston, et al., 2006
+6% / yr
-2% / yr
(million m3) Production Consumption Production Consumption Production Consumption
Canada 12.242 5.026 12.590 5.219 12.778 5.432US_ex 6.957 5.491 6.932 6.932 8.006 8.006Scan 24.845 10.359 25.952 10.261 26.862 10.203Baltics 0.000 0.000 0.000 0.000 0.000 0.000Russia 3.328 2.954 3.389 2.927 3.430 2.910NZ 3.233 1.383 3.423 1.389 3.614 1.394Chile 3.718 1.637 3.936 1.775 4.152 1.913Other Ex. 31.827 28.501 35.621 31.910 39.094 35.423US_im 2.757 6.594 2.657 8.397 2.533 10.225Japan 14.367 19.739 14.595 19.572 14.741 19.466W. Eur 25.163 42.666 25.684 42.202 25.997 41.924Other Im. 7.659 11.745 7.596 11.792 7.530 11.842
Canada 51.136 18.307 49.255 19.174 46.130 19.726US_ex 26.212 18.640 25.420 17.968 24.106 16.534Scan 1.836 0.726 1.832 0.728 1.903 0.692Baltics 2.503 0.052 2.496 0.052 2.621 0.049Russia 12.283 10.153 13.482 10.177 15.031 9.708NZ 0.573 0.218 0.588 0.235 0.640 0.223Chile 0.822 0.362 1.092 0.436 1.167 0.436Other Ex. 9.324 7.634 9.306 7.659 9.660 7.180US_im 35.992 77.109 34.881 70.479 33.035 64.587Japan 2.326 3.410 2.318 3.428 2.209 3.696W. Eur 1.331 2.977 1.555 2.396 1.553 2.489Other Im. 12.639 17.389 12.617 22.112 13.027 25.760
SWL 4
2002 2007 2012
SWL 3
28Chris Gaston October 2013
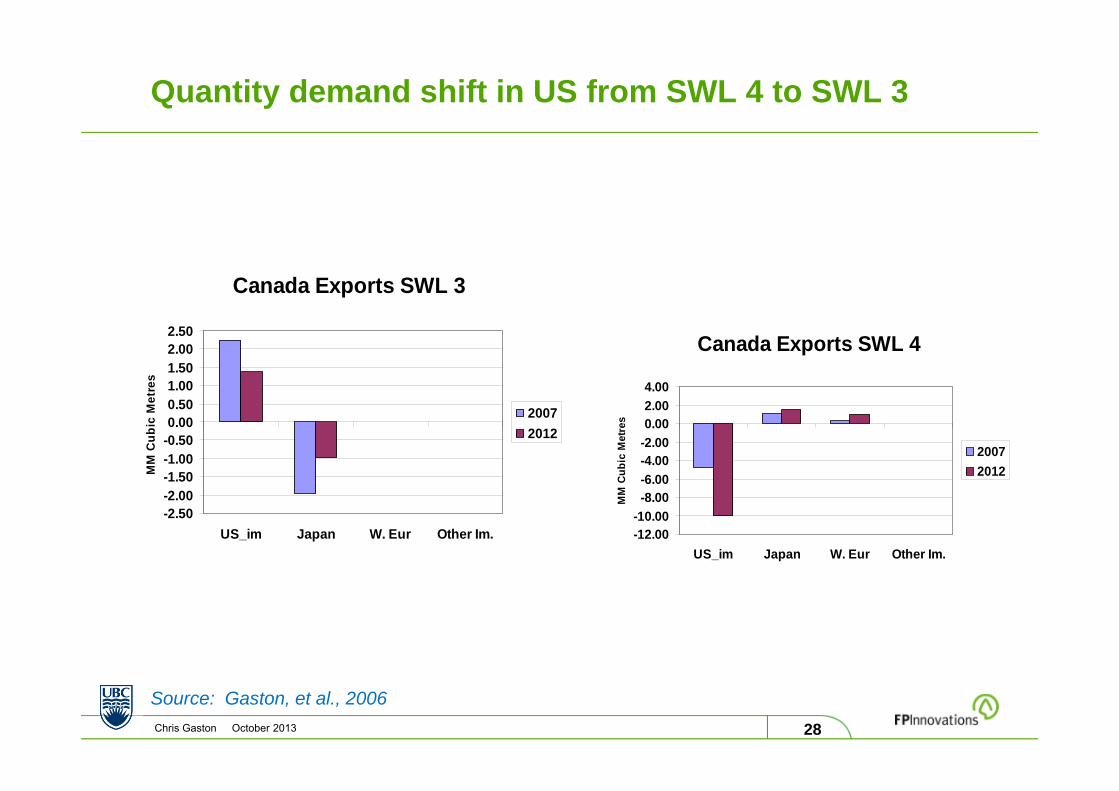
Quantity demand shift in US from SWL 4 to SWL 3
Source: Gaston, et al., 2006
Canada Exports SWL 3
-2.50-2.00-1.50-1.00-0.500.000.501.001.502.002.50
US_im Japan W. Eur Other Im.
MM
Cub
ic M
etre
s
20072012
Canada Exports SWL 4
-12.00-10.00
-8.00-6.00-4.00-2.000.002.004.00
US_im Japan W. Eur Other Im.
MM
Cub
ic M
etre
s
20072012
29Chris Gaston October 2013
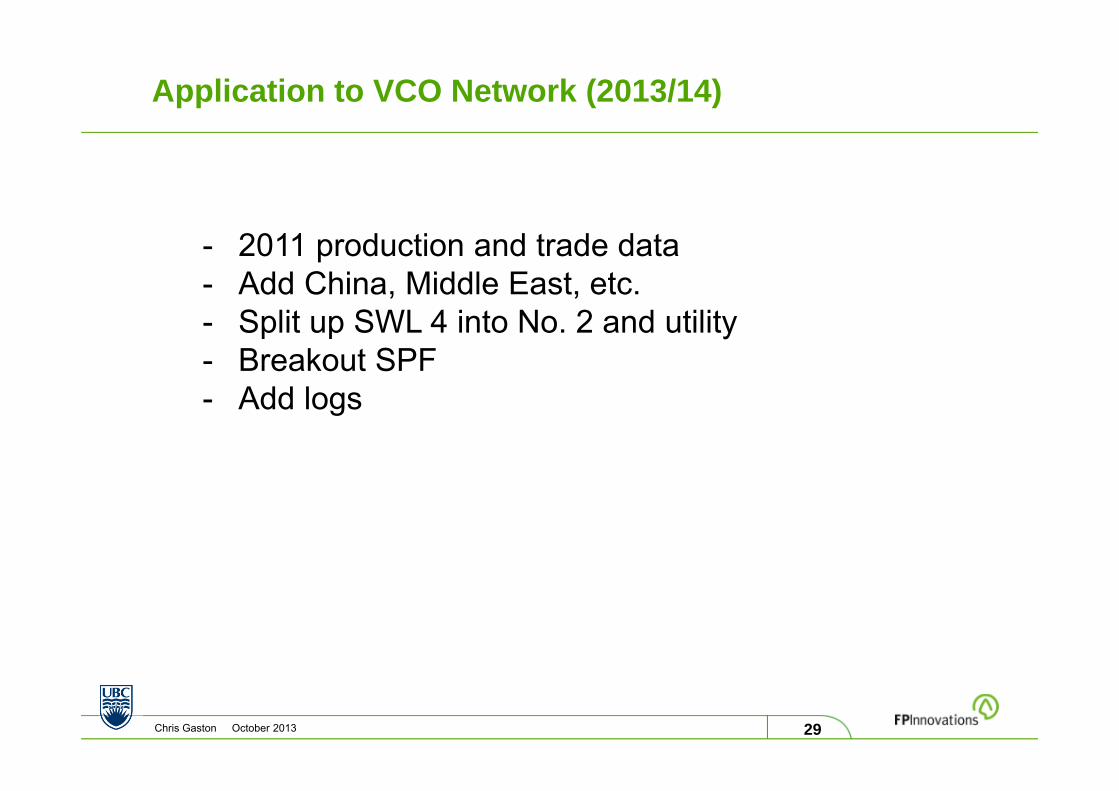
Application to VCO Network (2013/14)
- 2011 production and trade data- Add China, Middle East, etc.- Split up SWL 4 into No. 2 and utility- Breakout SPF - Add logs
30Chris Gaston October 2013
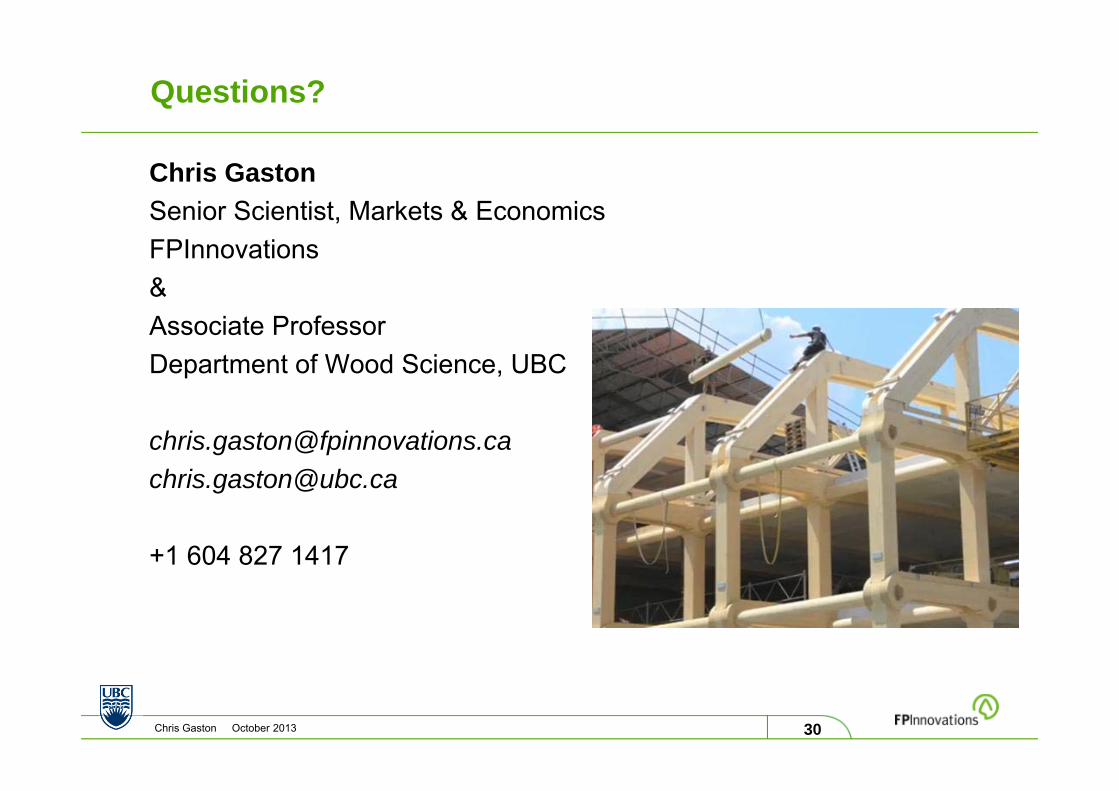
Questions?
Chris GastonSenior Scientist, Markets & EconomicsFPInnovations&Associate ProfessorDepartment of Wood Science, UBC
[email protected]@ubc.ca
+1 604 827 1417


![[Architecture eBook] Canadian Wood-Frame House Construction](https://img.pdfslide.net/doc/110x75/563db833550346aa9a917f04/architecture-ebook-canadian-wood-frame-house-construction-5661f565da5ed.jpg)