Embed Size (px)
Citation preview

,.....- .. __ ._.__ ._,.,- --,, .
1 'J?nA. '")51LL'---"-.'~-:.".L'~ .. .. __ j
by
')' Lambert' Tall
MATERIAL PROPERTIES OF STEEL

MATERIAL PROPERTIES OF STEEL
by
Lambert Tall
"~GLA80F~"\TORY LIBRARY
June, 1957
Fritz Laboratory Report No o 220Ao 28

t'
This study has been carried out as aStructural Research problem, CourseNo o CE 4049' being part fulfil~lnlenrt ofthe requirements for the degree o,fMaster of Scienc60
This report is submitted to Dr Q RoL Q
Ketter., Assistant Proressor o:f CivilEngineeringQ '
I SYNOPSIS
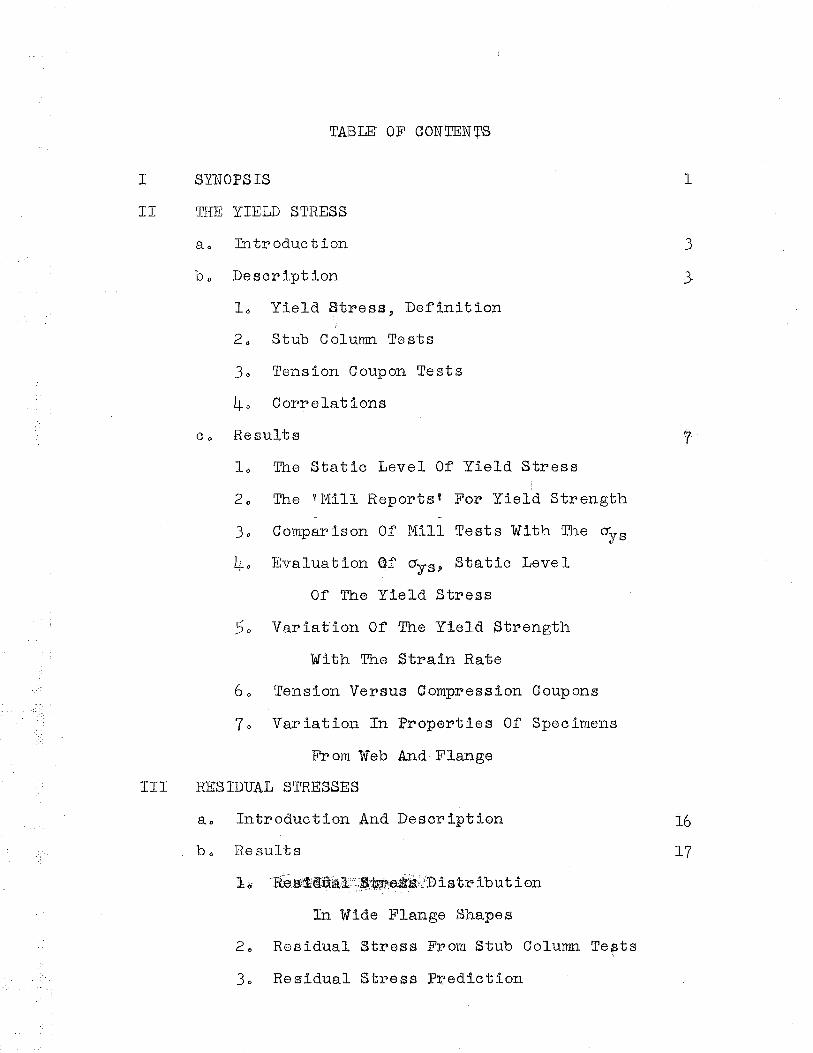
TABLE OF CONTEN~S
1
II THE YIELD STRESS
ao Introduction
b o Description
1 0 Yield Stress, Definition
20 Stub Column Tests
30 Tension Coupon Tests
40 Correlations
0 0 Results
1 0 The Static Level Of Yield Stress
2 0 The ~ Mill Reports t For Yield Strength
30 Comparison Of Mill Tests With The O'ys
40 Evaluation (If C1ys , Static Level
Of The Yield Stress
50 Variat'ion Of The Yield Strength
With The Strain Rate
60 Tension Versus C'ompression Coupons
70 Variation In Properties Of Specimens
From Web And Flange
III RESIDUAL STRESSES
ao Introduction And Description
be) Results
]~6" -' --rti!,2t~aUiifl:'~:·,:'$:.d'if;'~~:<D ist r ,1b u't ion, .•.••, ' • _',. ~.~. , I
;In Wide Flange Shapes
20 Residual Stress F~om Stub Column Te~ts
30 Residual Stress P~ediction
3
:>
i6
17·

20
20
Table Of Contents
IV OTHER MATERIAL PROPERTIES
ao Introduction And Description
b o Results
1 6 Young t s Mo"dulus, 'E
2 0 Compa.rison Of Coupon And Stub Column
Results For E
30 Strain Hardening Modulus, Est
40 The Ultimate ~trength Of A Tension Ooupon ~
5. Typical Strain~Strain Curve
V CONCLUSIONS AND DISCUSSION 24VI SUGGESTIONS 31
VIr AOKNOWLEDGMENTS 33
VIII REFERENCES 34IX APPENDIX 35
1 0 Nomenclature
2 0 Tables
3" Figures
"':
2
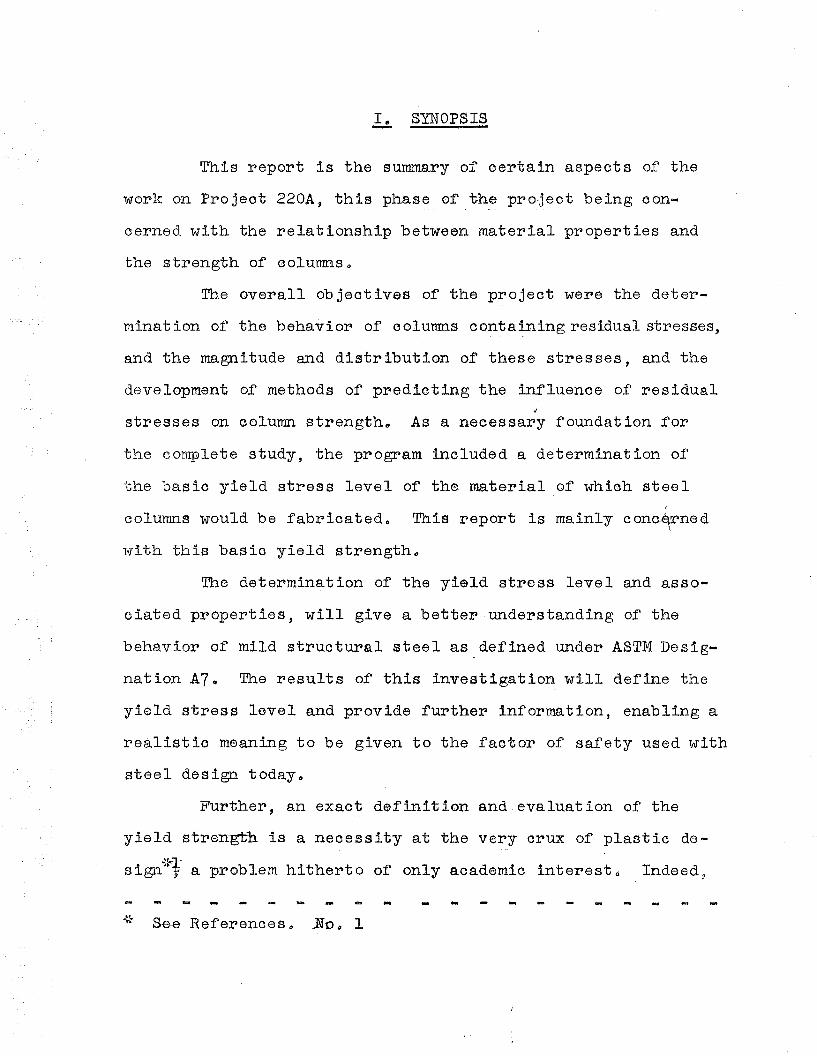
h SYJ.\fOPSIS
This report is the summary or certain aspeots of the
work on Project 220A, this phase of the project being oon~
c,erned with the relationship between ma.terial properties and
the strength of columns o
The overall objeotives of the project were the deter-
mina.tion of the behavior of' columns oontaining residual stresses,
a.nd the magnitude and distribution of these stresses, and the
development of methods of predicting the influence of residualJ
stresses on column strength o As a necessary ~oundation ~or
the complete study, the program inoluded a determination of
the basic yield stress level of the material of whioh steelI
columns would be rabricatedo This report is mainly conc~~ned'.
with this basio yield strength o
The determination 'of the yield stress level and assa-
eiated properties, will give a better understanding of the
behavior of mild struotural steel as derined urider ASTM Des1g~
nation A7. The results of this investigation will derine the
yield stress level and provide rurther inrormation, enabling a
realistic meaning to be given to the ractor of safety used with
steel design todayo
Further, an exact definition and.evaluation of the
yield stren~his a neoessity at the very crux o~ plastio de
sign~t-l a problem hitherto of only academic interest" Indeed,
-it- Se-e References o _No~ 1

to use
ap:pl~y
yle
220A o 28
is method e~fectively, it would be a retrogression to
tors or safety to a nominal undefined value of the
strength o
Methods and correlations used will be ShOWll 9 so that
the extent and trends in the variation of the strength of
eel will be apparent 0 The strength of "steel will be con
sidered with both its elastic and plastic properties o
Generally, however, the results will indicate, par-~-.
ticularl~y in the case of residual stress prediction, that a
eEtter sample of spec imen$ will have to be tested bef ore
B:Ctt):-l()rat~lti've conclusions may be draW"n o
220A0 28
-IIo THE YIELD STRESS
At first glanc~9 t~ere are enough levels of yield stress
to ~a,ti,L~fy even the most exacting connoisseur of definitionso
l't '!r\ffJttld appear that whiclt ever reasonable value be estimated at
r~ldom for use in design$ justification of it J to a" greater or
lesser degree 9 exists o ~,rther9 it is common knowledge that in~
crease in the speed o~ te~ting of a coupon ~il1 increase the
:Vie:td st,ress level» and tha't such a value has little use ~ unless
it is defined by a testing speed Q
It is the purpose or this chapter to consider the factors
t~llat have an influence on the yield stress, and to show how a" .
~pr1Jedictio,n of this value is possible from the mill reports o To
cle,d'llCe and substantiate the conclusions J the mill 'coupon .tests
were simulated under strict speed control in the laboratoryo
Further data were deduced from stub COlunrrl tests j using the-fUll
cross section(j' To make the study as complete as possible s dat~
from other investigations were included, where ~equiredo
(b)
10 Yield stress ~ definition
The following terms are relevant in describing the
Jt?ield strength or a steel couponj; see' Figure 10
=The ~pper yield point» 0UYj' the rirst stress in a material~
1,ess than the maximuDl atta.inable stress, at which an in=
crease in strain occurs without an increase in stress o
(ASTM derinition or Uyield point uo )
~The lower yield point~ aly » the low level of yield stress
immediately rollowing 0uyo
=The yield stress leve1 9 0y9 the stress during actual yielding 9
vij11ich remains fairl'y constant.9 provided the strain rate re~
111Et.in,s constan.to (ASTM definition of yield ~:rtrength~ the
ertres8 at which a ma'ter,ial exbibits a speci:fied I1miting
deviation from the propqrtionality of stress to straino )
=,The proportional limit!) ap~ the greatest stress 'w'hich a
!naterial is capable or developing without any deviation
.fr~)m proportionality of stre~s to s'tra,in {ASTM de.fini tiono }
0p is \Jery' closely equal to 0y for' a coupon, particul~lY
if the coupon is anne aledo This r~s not the case ror the
section as a whole o
=.AI1,so» where no definite yield stress level may exist 5f as is
'the case occasionally, an offset is used to define a value
for comparative purposes o
It is seen fr~~ the figure that a great variation in the magnitude
of the stress associated with the different terms does not existo
This [las le~d to" ·some confusion of termso
TJl~ E~11 defi~e. the, yield strength as t~e yield
~t~~~~~t the static level, that is, the value for cry when the
str~in rate is zero Q (Strain rate will be discussed at length
,ill section C<=6 0 ) In the past, until recently p both the upper ~d
tlle lower yj.eld points ha.ve been used ~s a ba.sis for the estima<=~ .. ,' -~.; -
tion of the y~eld stresso Indeed, it is common practice in test-
ing cou,pons to record. tIle yield as the reading indicated by the
i~ree U.fol·lowe'r U point~:r on the loa~ indicator dial,9 the actual
load Ilaving dropped o:ff somewhat'o Use of the static level is
perfectly logicalJj si~ce most structural loads can be consj_dered
as primarily static Q

220,$\028
~ stub Column Tests
A number of stub column. tes'ts fJ with mater.+al supplie~,
by di:f.ferent manu~acturers» were' ,conducted so that an evaluation
could be made or the" behavior of the full cross section of WF
shapes o The results obtained provided an important basi~ for
correlation of the yield streng~h with test coupon~9 and mill
test datao
The stress~strain curve pbtained from such a stub column
test is of immense use in colump strength predictions~ As shown
in Referenct; 2;; the overall str4 6ss-strain 'picture enables use of
tr16' 'tangent modulus concepto Further!J other relevant q.ata is
()bta,ined as show'n below 5J which may be interpre'ted immediately for
the fUll cross section~
'1 $ Young 0 s Modulus, E20 Proportional limit$ 0p30" The :maxirnum residual stress (crr=cry--ov)!J the
evidence of this being at;,_ the po~itl.on oft~e first yield line on the whitewash, orthe deviation from linearity or the loaddeformation diagramo With WF shapes 9 as~
rolled~ this yielding usually occurs atthe rl ange '/tips 0
40 The static yield level, 0ys.50 The· overall e.ffect of the residual. stresses
an the cross section~ as witnessed by thevknee'~ of the stress-strain curve Q
In general 'the speed o:f testing for these stub columns may
be regarded as static3" Increments were made.slowly and once
yielding had be,gun 9 care was taken that both strain and load had
stabilized before re,'adings were recorded" The tests were con~
ducted in either a 59000S000 pound capacity hydraulic or a 8oo~ooo
poun.d capacity screw~type mechanical universal testing machirJ.6o

:20/Ao 28 ~6
~ Tension Coupon Tests
These tests covered a wider range or shapes than did the
stub column tests j due to both their ease of testing and economyo
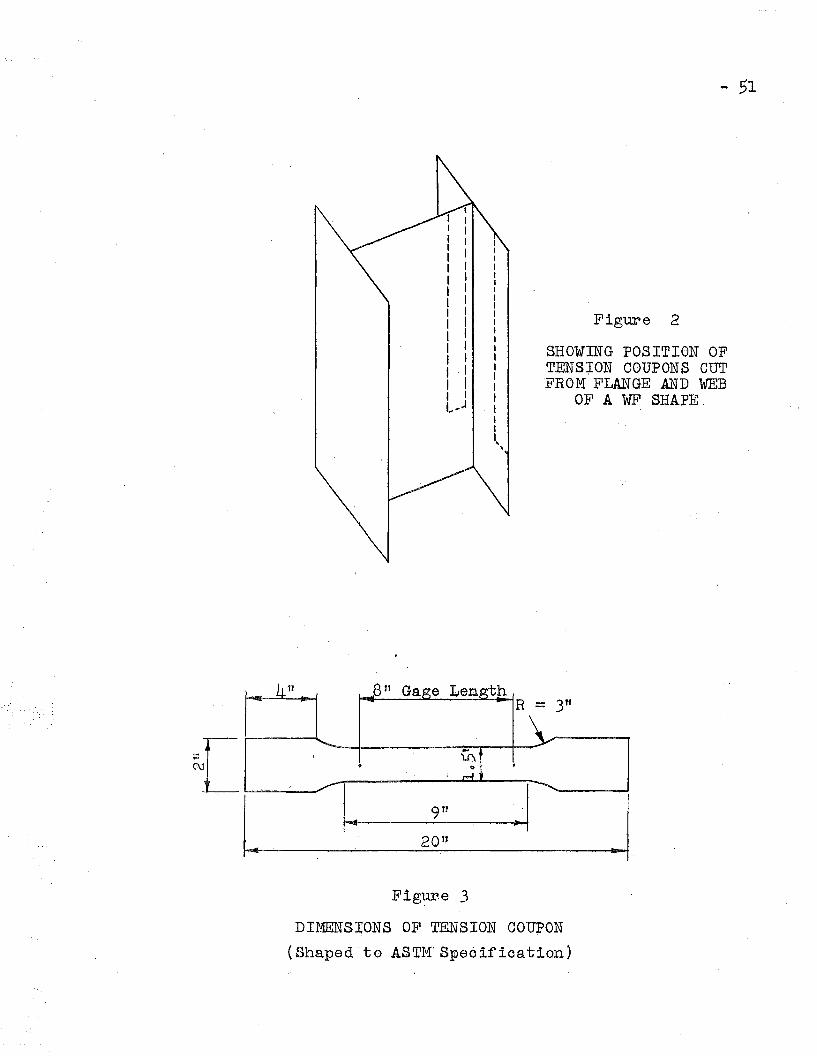
The coupons' were cut .from the w~b ~d ;flange as shown in
Ji'igLlre 2:J and then shaped to ASTM standards:i (see Figure 3)0 The
coupons w~re all tested in a 120~OOO pound Tinius Olsen universal
testing machines of the screw~power~typewith a positive control
over the speed o.f the cross he adt) In a few q,:ases, the limited
capacity of the machine required that the test be continued to
rupture in a larger capacity testing machine Q Automatic ~lect~
ronic recording equipment was used to plot the load~strain cUl"~ve,
which generally just reached into the strain hardening range o
The tests were conducted so that the static level of '. yield
stress was also obtainedo The speed of testing used was that
recommended in Fritz La.boratory publ'ication No o 220Ao 15:# being
chosen So tbat the mill test of a steel manufacturer could be
simulatjedo (Crosshead speed shall not exceed 1/16 ino per rninute
per inch or gage length~)
Frpm the load~strain curve then p the following data.were
obtained; YoungUs Modulus~ Proportional Limit 9 Upper and Lower
Yield Levels if anyp the yield stress level at the strain rate
used, the static yield leve1 1 - and where it occurred on the .re
cording paper, an estim~tion of the strain hardening modulus o
Combination of·",·._d.at'a from web' and .fl·ange according to their res
pective areas in .the fu]~l', or'oss se.ction was employed to show ~
by comparison" whether such-method.&- will gi VB an ··ac curate . indi-
cation of the yield stress and other data.

220Ao 28 --7
The effect of strain rate on the apparent strength of steel
in testing has been given considerable attention$) and data is prec=
sented that will enable predictions for the static yield strength
knowing th~ speed of testingo Although it has been known in the
pa~rt that i-Jhe strairJ. rate has an effect}) very 11ttle data was
available ~~d t~e subject was generally ignoredo
.fu" ~orrelations .
Oornparisons were made between the results o.f all the
tests, stub columns 9 coupons~mill reports j as well as data obt~ined
in other investigations o
T11e steel W8.S supplied by Company "An and by Company "En ~
for both tension coupon and stub column testso The results are
shown both separately and combined$ for in some cases it was felt
tJ1~~ttr combination of the data obta.ined from the dif.ferent steels
could lead to inconsistencies o The data where the values have
been combined will be useful in strength predictions when the
origj~n of the material in question is unknown 0
( c ) !tESULTS
~ The Static Level of Yield Stress
Refer to Section C~5 on strain rateo
(a) Stub Column Tests
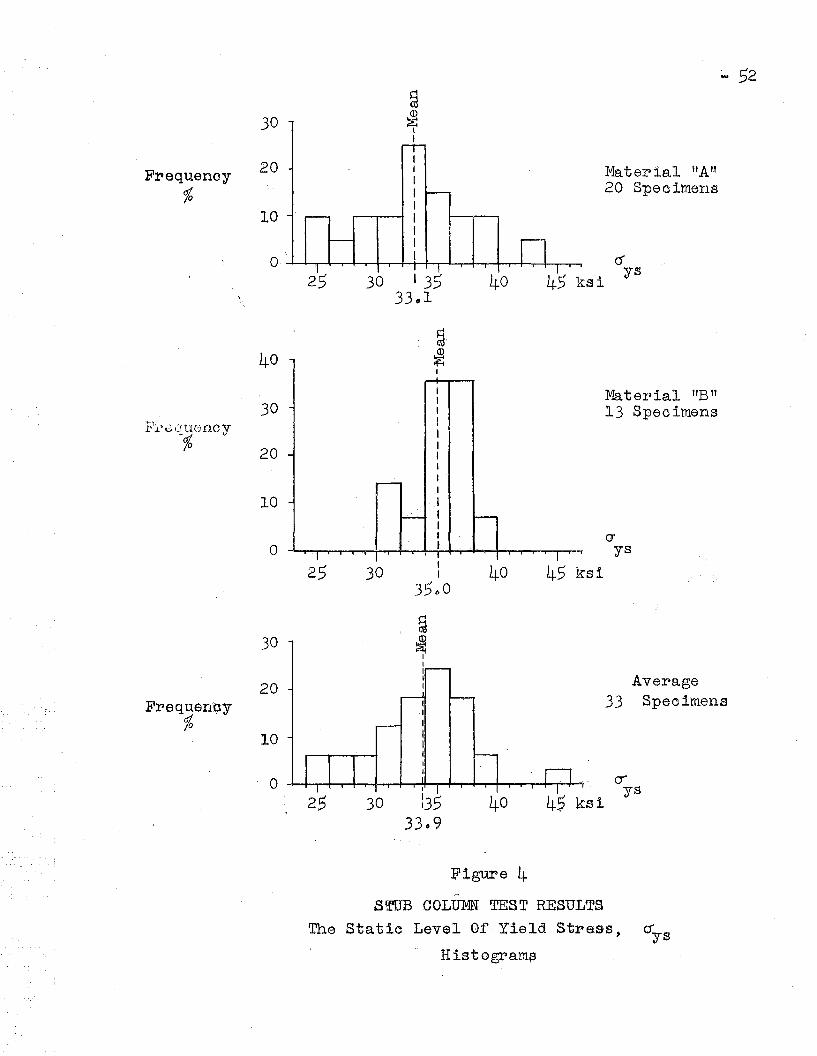
From Tables II~ 111 9 and Figure 4, it is seen thatg
material uAn crys= 3.301 ksi mean value (20 specimen~.)!
"En {Jys= 3500 ksi .mean value (13 specimenj'? '
Average a =: 3309 ksi mean value (33 specimens)ys
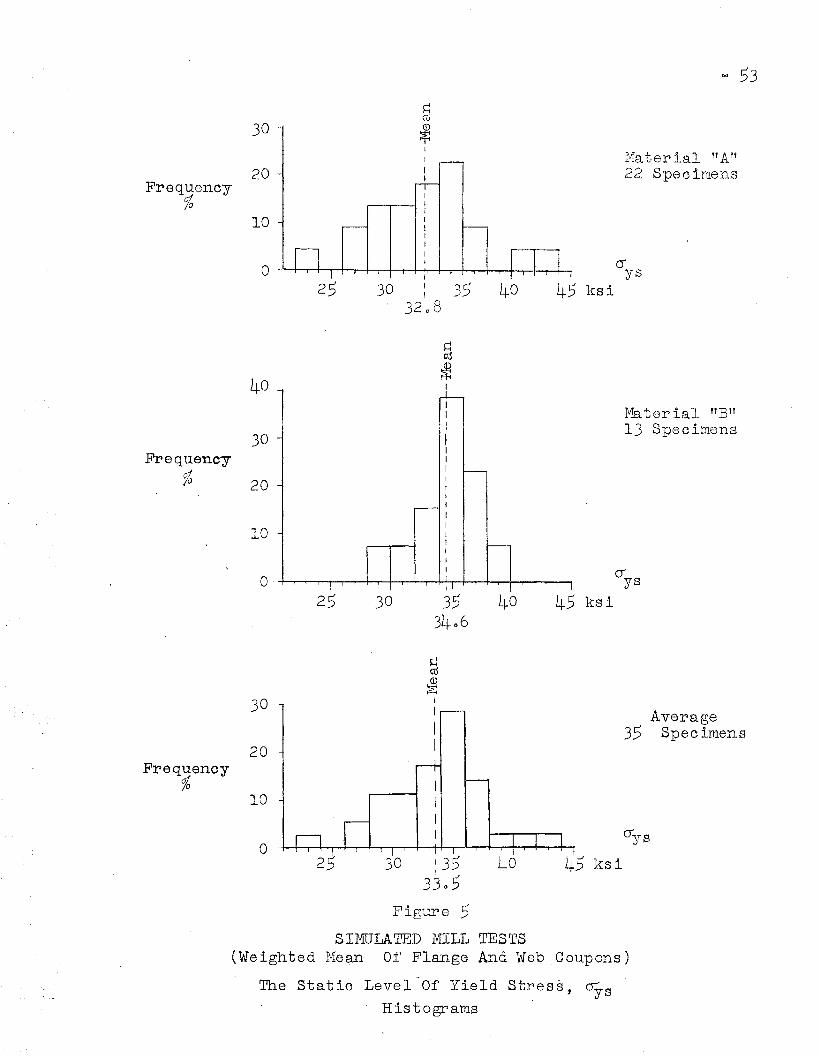
1J2l Simulated Mill Tests
These are the weighted mean of the individual coupon testso The
individual data is recorded in Tables 1 and 2» and in Figure 50
111aterial nAft °ys= 3208 ksi mean value (22 specimens)"En °ys= 3406 ksi mean value (13 specimens)
Average O'ys= 3305 ksi mean value (35, ,:,,~pe cimens )
~8
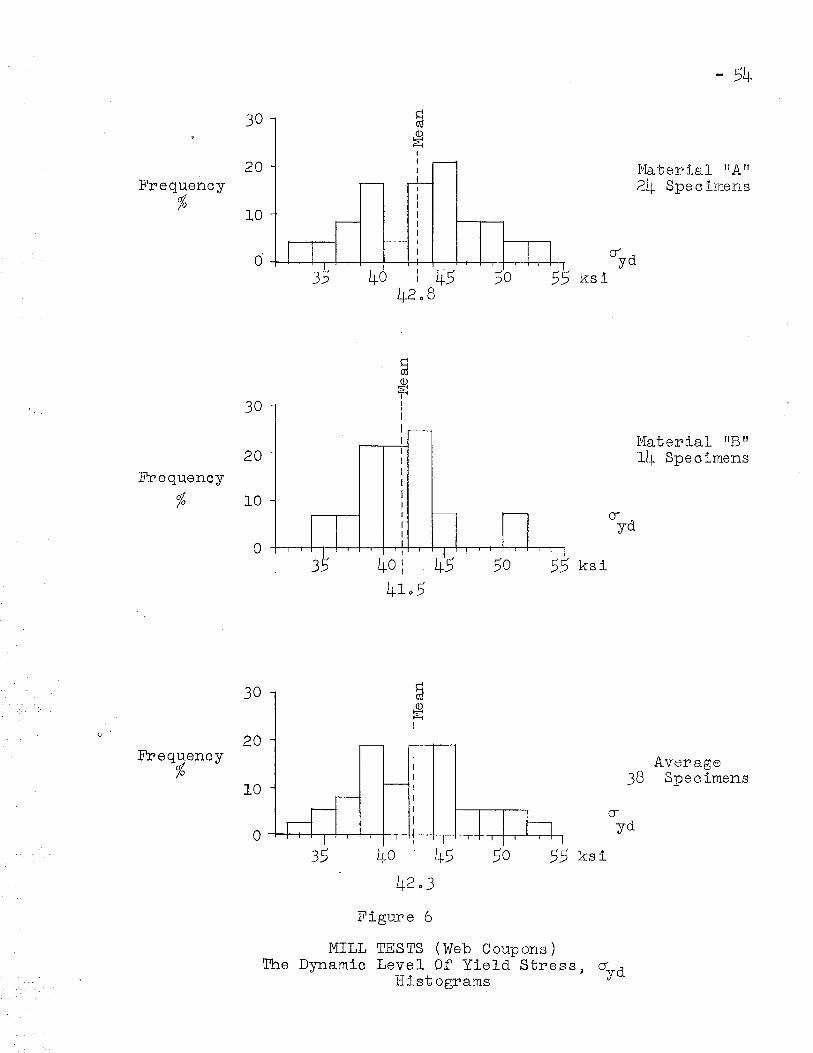
The ffMill Reports U for Yield streng'th
The mill report for t4e yield strength or steel is based
on a tension test on a coupon cut from the web or the particular
shape carried out in the manu~acturerns own laboratoryp as part
()f b.:ls C()}:J.trol all produc'tif)no 'rhe tests are oon.ducteds"t $,peeds
81)p:etJx,iro.sJte:ly the same as those advised in Fr:Ltz Laooratory p1.1b<=
lication No o 220Ao15o The results then give the yield strength
f(,~r EL n d7<yrl,SJuic Vi le,rel 0yd,9 where dynamic is llsed as compared to
sta'tic o It! 1Ni:11. be fur'tller de:fined latero
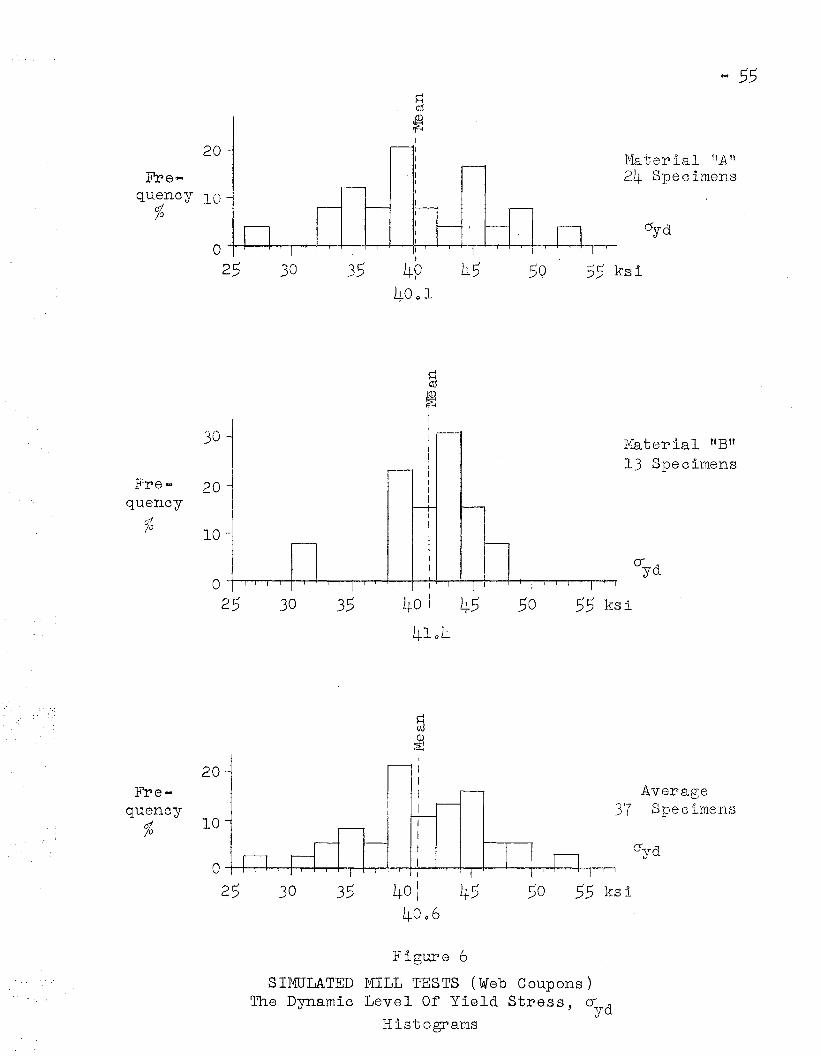
The nsirau.lated~? mill, ~tests were tension coupon tests con=>
cI1Icted irl .Fritz. LEl.boratory as outlined in section b""39 on web
coupons cut frcnn WF stlapes Q The speed of testing "simulated"
tha,t of mill It:tboratory $) and was according to the speed recommended
in the previous paragr apho
~ Mill Tests» Figure 6(i
material n.A~' 0yd= 420 8 l{si mean value ( 24 specimens)UBlt Ciy,d= ~-165' ks1 mean value (14 specimens}
Average 0yd= 4203 ksi mean value (38 specimens)
_NQTi+~ 3000 material flB" millests gave: Gyd= 44-01 ksi
UU "'Simulated It ~il1 Tests 9 Figure 70
ma.terial u.A n Oyd= 4001 ksi mean value (24 spe cime,¥~~}.):tfJ5 tf °yd= 410 4~ ksi mean 'value (13 spe cimerls )
Average uyd= 4_0 0 6 ksi mean value (37 specimens)
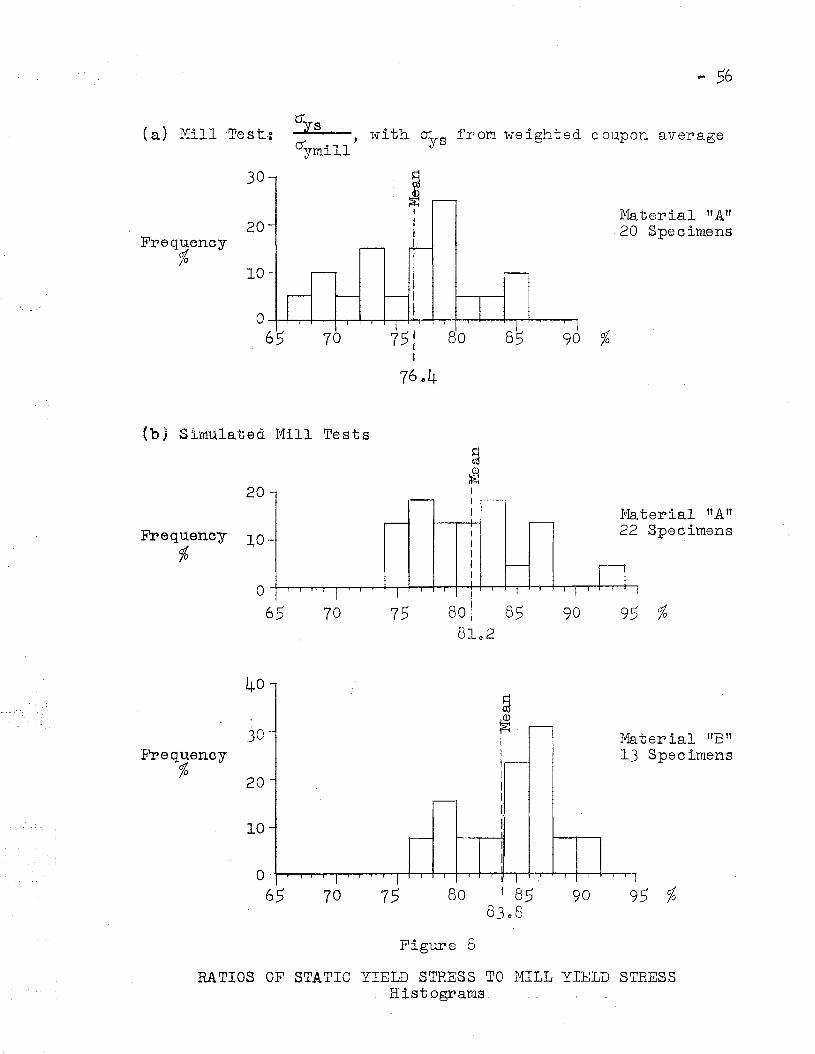
~ Compa.~ison of" Mill T~est Resulvbs with the ays
To allow a prediction to be made of 1" '"1;he .static 1\3vel
of J7"ield stress C1y S:J .from the mill test rep'arts;9 a com.parison of
these res'ul.'ts was made as a ratio of the former to the latter!J
('tb.a.t i$ 9 (]ys.!CJy mill testso) Tabulation of the resul ts is shown
in ~ra~b1,eE~ ~II 8l1d 111.9 w.ith the distribution shown in Figure 80
Ex cer:d:; i~or some material "B U results J) as shown in Table III;> t'he
y'if:;1(i t3tress is ~taken as the weighted static value .from the
coupon tests s it being shown later that such a value is completely
equi 'v2tlent to that obtained from a stub colunm testo
1~) Oomparison Using Mill Results, ay~/ay mill» Figure 8
material nAn ratio =: 76'% mean value (20 specimens)~
"B tf ratio :=: 84% mean v,alue (13 specimens)p
Average :} ratio = 79% mean value (33 specimens)
(b) Comparison U,sing tfS~imulate'dtr Mil,l Results, Figure 8
These results have 'very little application B.nd are re--
corded only for comparisono Assuming that the materials are equal 9
t;b.ey do indi cate 110wever that company "A tf appears 'to run its mill
t,ests at a l1.igher ~testing speed than company ftB If 0
ma.terial tt Att ratio = 81%' mean value (22 specimens)
u13 tf ratio := 84% mean value (l3 speciluens)
Average ratio = 82%'mean value (35 specimens)
4Q Evaluation of 0Jis f) Static Level of Yield Str:ess
tJy cornparison of values :rrom stub columns and .from tension couponso
This set of comparisons was made to see whether the static
:yj_e:l0- stress of a WFl shape fJ obtained from the tension cqupons by
weighting and averaglng according to respective are~s of flanges.
fLnd web SJ could approxima.te, th'e ,value of the static yield stress.. ~
()"(»ta1ned f~om a stub column test on the full cross sec·tionQ
220A Q 28 ~lO
Oys weighted coupons 9 Figure 90°ys stub column
Ratifj~
rnaterial "An ratio = 9901% mean value (18 specimens)
"13 n ratio ~lOOo5% mean value ( 6 specimens)
Average ratio = 9905% mean value (24 specimens)
~ Variation o~ Yield Strength with the Strain Rate
The yield strength of steel is directly arfected by the
rate of strain~ngo This· may be regarded as a property of steel j and
tJ18 phenomen9nhas been studied and observed on numerous occasions
in the past50 Gener~ly speaking the faster the steel is loaded,
the higher the yield point tends to become until the limit, when
the ultimate load is reached wi·thout yieldingo
It is seen therefore that the testing speed of a coupon is
of the utmost importance as a pa~ticular type of steel could have
(J.ll j~rli·inite number or 'values for the yield strengtho Actually 9
tllis is ex actly what does happen todayB Al though the ASTM have
tentative specirications limiting the testing rate, it would appear
th'at some investigators use lower rates than others since discrep....,
ffilcies exist as high as 20% in the measured value for yield strengtho
At this juncture it should be noted that strain rate does not ac~
count for all the variation between tests ~ it cannot account for
manufacturing methods o It should be .noted however 9 that the
difference due to chemical and other manufacturing properties can
be more clearly evaluated if these superimposed artificial dis~
41
crepancies of s~rain rate are removed o
Thi£topic was ;nvestigated at length by Marshman5, and the
reader is referred t·o this, publicati.on for complete details o Nonet=-"
the=less!J this chapter will briefly describe the prop'lems of strain
rate ffild will indicate some of the results obtainedo

c=>ll
The gre atest practical difi'icul ty as 80ci ated w'i th strain
rate is its measurement o Although this ;is not difficult if spe,cially
measured~ it is not possible to use an indicated free moving cross~
b,ead sr>eed as "the strain ~ate for any particula.r rnachine o This is
Pfll~ticularly true with an hydraulic testing m~chineQ This is due
to 't:he fact that 9 during testing 9 the machine i tseli~ is deforming
so that an adjustment must be made to the indicated rree~running
cross head speed to obtaiti the actual rate of strainingo It is in
the elastic portion o~ the loading that this effect has its greatest
influencG p for as the load increases the deformations of the various
parts of the machine also increaseo The result is that the indi~
cated testing speed (free~running) is progressively decreasedQ
This state of, af~airs corltinues till the' climax is reached at the
;71 e1, (1, point,,"' At this instant the specimen starts to yield,;) the
l.oad is constant and no .further deformation of the machine takes
plac8 J all the movement being due to the pla~tic yielding of the
specimeno That iS J except for a negligible part of the strain
rate being taken up with keeping the deformed testing machine in
equilibfium under the applied, for practical purposes now constant
loadjl the specimen is "straining" at the indicated free~running
speedo Although the ~ndicated st~ain ra~e below yield point is
rIot representat.ive o.f the actual strain ra.te ~ and therefore can~
not be used; once the yield point has been reached and the load
ffi1.d st;rain r·ate have stabilized» the indicated ratio or dynamic
'to static yield points ha.s a definite level which is dependent on
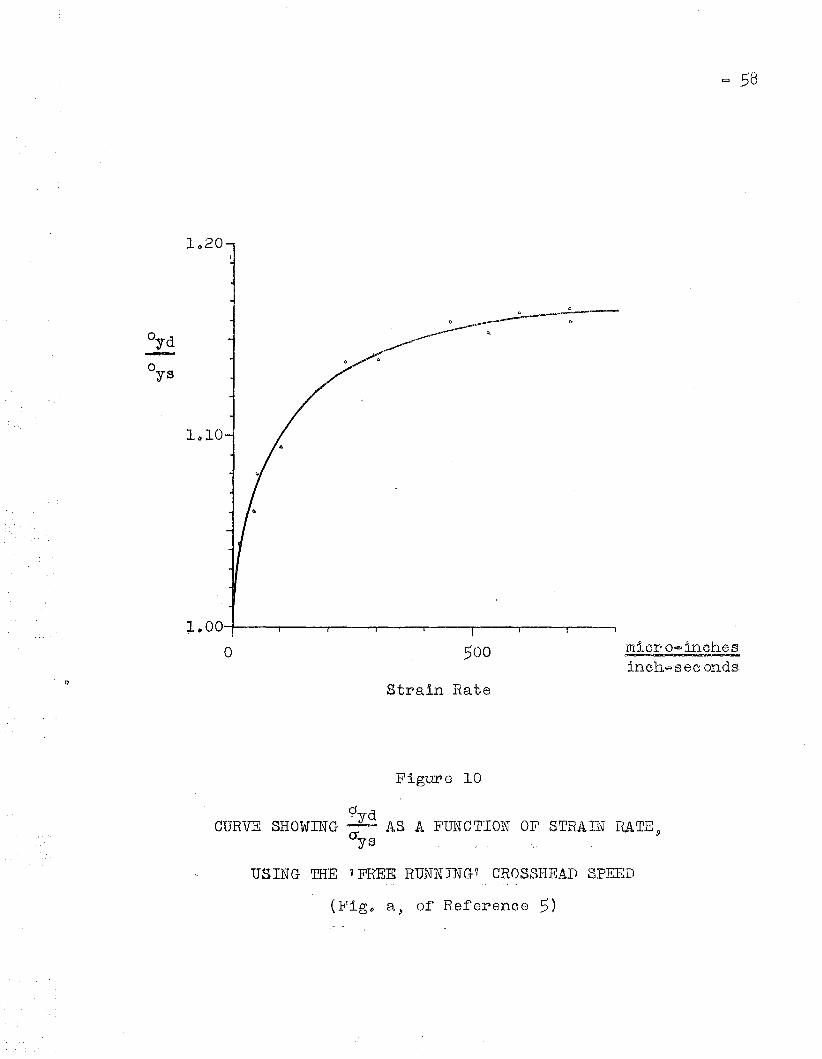
the testing speed Q ~ plot of this ratio versus testing speed is
shown in Figure 100 It should be noted that the curve is the
220Ao 28: -12
result of a number o~ tests of plate specimens from one manufacturer
(Cornpany 1YBU)o All tests were carried out on the same mechanical
testing machine o
The dynamic yield stress, ayd~ is defined as the yield
stress at a particular strain rate other than the zero strain rate o
~he static yield stress on the other hand is defined as the yield
stress at the zero strain rateo
Tests5 have shown that the static yield level may be deter
mined without actually conducting the experiment in its entirety
at a zero strain rate o ,Ul tha.t is required is that the strain
rate be decreased to zero in the plastic region and that a few
minutes be taken to allow the load to decrease to the minimumo
(In the case of hydraulic machines p~rticularly~ oare must be taken
t11ftt 'the static level is ap'proached from the positive side'p that,is,
no strain reversal'is to be allowed9 ) The ef~ect of this on a
stress~strain curve is shown in Figure Ilj a typical stress~strain
curve from the series of coupon 'test's ru.n on the screw... type mech=
anical testing machine~ This property has not been proved con~
elusively on a large number of tests, but it ~s ~elt that the
series conducted5 may be regarded as indicative o~ the behavior
to be expected due to their excellent correlationo
Figure 12 indicates a further observation$ bearing out the
foregoing con91usions; namely 1> that in the p,lastic yield range the
0yd depends on the testing speed~ where,as ~ the 0ys ~ as obtained
by stopping the movement or the cross~head3 is relatively constant 0
~ Te:t:\sion Versus ·Compression Coupons
Although no compression coupons were used in this series
o:f tests previous investigations have shown that, on the aver,~gEJ,

220Ao 28
tension, arid compression Gfjoupons give resul.ts 'that are a.lmost
ldentiea1.6" These results and conclusions will be repeated here
:in S11mmaX)y fc)rm (see Table IV) 0 Al tll0Ugh these par'tlcular re~,
sult;s ,are for one shape 9 8WF31jJ experi ence w'i th other shapes gl_\r~;
the SB,rne indi c a't i cns 0
Quoting from the above referred referencee
"The elimi,natioIl of COlnr):ef~i3siorl test.tng o.f
coupons (in the case or rolled structural
steel sb.84pes) is t1+us considerecl as "tvarranted,
particularly in view of larger variation in
propertj.. es due ttJ ot11er causes. n
Compression testing of coupons is mucb. more di.ff~icult as com~
pared to the case of testing tension coupons~
Considering the full cross~section9 the static yield level
as deter;)min.ed from stub column tests was alrnos-t identical w'i th
'that f:l?om t,he weighted mean of the tensi.on coupons as shown in
Figux~t3 90
':L- Var'iati.on in Rroperi;;ies_ o:f_~l!lens from Web aB.-d F1.~~
There is conflicting opinion on the subject of whether
tl1e 's,hape arid size of a specimen has any appreciable ef,fect on
the physical propertieso Previous investigations? have shown
tl1&t thilS effect is neglig,ible in couI)on testing~ but reeent tests
indicated no conclusions in either direction$
This section presents a summ'ary of certain results~ shown
in Tables II and III and in some of the figures o The yield
s~trerlgth both a-t the static and the dynamic level is consider~e:d~
as is also the ultimate strength.

220Ao 28
lu.ater",la}~ Y~An~'l:U~.. =-aI~.I.~~~
me an =: ~32o 8 ksi (22 speeimeIls)
raatlge 29~~37 ksig 18WFII.05 9 16WF [Jt~ 9
:14WF 61 9 1 ""'WF'4 r
).(.-:, I ....... c",::;
12WF 92:> 12WFl 6,S')l12WF 50 9 lOl!fEl 66 »lOWE' 335> 81V\ijl~1 .3+:;
x"arlge below29 ksi~ 14WJjl.320 ...-. 22 0 1'1 ksi
12WF190 --- 26088WF 67 =: 26Q3
~L}+WF'~lJ~l
l~JVFj 781 ;?;\TIil .5~~
lO~{Fl 39
ri3.11ge abo,\re37 ksi~ S'WP 31 = 3709 ksi
8WF db =: 37t) 861tlF:15'~ 5= 1-1-30.35'1tW~18o 5=: 410_3
rnat.t3I~ial nBu.~..:~~...c.~~~..i.,:-""....II!!!!Q'.:I~
rue an = 3L~4 6 ksi (13 spe cimens)
l~ tln,ge ~29 t= 37 ks i ~ 18~v"Fll05 ~
1.Ll·WF 78:;12WF 53p
6WF 25
16WF-88 9
14WF6J..9lOW!i'66 p
14w~Fl,1~1
12WF1~190
6Wli~5~ ;)
rarlge belo1tl29 ksi~ 14WF'426 ~ 28 0 6 ksi
rarlge above37 ksi: 14WF142 - 38 fJ O ksi
.5vVFl8 0 5 = 3704
The above summary should be consi~ered with Tables II and
111 0 It is then seen that in general, as would be expected» the
hea'\Tier ~:;ections llave a lower (Jys 5J whi.le lighter sections lJ.ave a
hi. grleJ7' ays than tbe me anQ
Sirl.ce the flanges are the controlling fae'tor 1,11 C()lllmCi.
~~tr¢eng'th bo'th fOl~ bllckl,irlg and direct loads ~ the bit B.nei tK (Al"E;a
()i~ Fl,arlge~1Area of Web) Iita'tios were also COllsideredo The indic.ations

220Ao 28
28 ksi
37 ksi
°ysor 0ys > 37 ksiSIlapes w'i'th 0< < approx 0 2 Q 5
:from <the sll1alJ~ number of results on hand are 'that ~
sllapes w'i'th lj/t .n:: approx o 10 or less~ have ays <bit - approx o 18 or more ,9 have °ys .:>
287
The stub column values for 0ys were also considered, and
it, may be seen that the indications are exactly the same as t'lor
t118 c.OllPOllS 9 althoug11 the results are less random$' tha.t i8,9 the
spr~ad is narrowero
l£l 0yd9 Dynamic Yield stress, Figure 6
mill test ~ web coupon results
Irl. t11is case:J the same general indicatiol1S'lbold as above as can _be
seen franl the rea.sonably constant histogramu It shou:ld be noted5)
how'e'ver~9 tl'lat the resul ts are more randomo Since Oyd is nob de:f1ned
,l'!Ol~ a partict.llar strain rate.9 test.ing differences are probably
p:r:esento
(c) CLt1lt.9 ~he U:ltimate Stress;; 5as,ed on Reduced Area6ac.tual
Rerer to Tables lIs III and to Figure 20~ (from simulated
mill coupon tests~ weigllted meansol
35 specimens were considered and to obtain a more realistic picture
t~he ul timate striless was based on the reduced area at, failure 0.. Fl?om
'the histogram 9 it is seen that the spread o.f results is extremely"
narrow with only the following shapes not in the range 120~150 ksi o
TIl!1.teri al nAn~ 18-WFI05 = 11005 ksi14WF228 := 187f)512WF 53 = 11405
material tWE n ~ 14wF426 = 1060.5 ks!1~4WF142 :; 15'40314WF 61 := 15705
These results appear to be random~displacements rrom the mean 9 rather
tJlaLl du.e. to any pl1ysical properties; of the crossQOsectiorlsl shapeo
lII~ RESIDUAL STRESSES
(~l) INTFt()DTJCTION AND DESOltIPTION
:rlll;j st1.1dy· of residual stresses ha.s been extremely inten=,
s:if.ied ill tb.e last five yeal~sQ This is mainly due to an in=
cr~eflsixlg appreciat,iorl of their effect on 'the buckling strengh of
e()J~u.n111SQ These studies h'ave brought to light ITlany .factors that
I1B.ve explail1ed pa.st failures ().f correlation between experimental
arld pr'edie<ted \Ta},116S for column strellgths9 & Wh,ile residual
18 tresses llave also been stud<ied in built 11p coll~mn,s ,<; this paper
will only be concerned with the structural rolled shapes of A~7
;9'1:;ee1,0
Residual stresses are stresses that remain in a member after
it Ilas beeJ:l :rna.rlu.factur~edo T.r1ese;l in the main» are due to uneven
eool.irlg of the mernber af'ter t'lOt rollingo Residual str~esses are
a() :rol~rned by va,rious fabrica.tion methods 9 such as welding and
cold bendingo\ As a general rule however, the effect of these
types of stresses is less pronouncedo
The mea,suremerlt of residual stresses of t11e type in question
:1s r)6st; aecc)rnpl,ished by the "sectioning" luethod,9 whereby the member
. 18 l11,eas'-ured before and arter cutting .into longi.tudinal striplso
!rl1e c.ut;ting releas~s the stresses enabli~g the sectioned strips to
clef'ol~rn freel"y aocordirlg to the relaxation o.f ttheir internal f9rceso
This method is explained at le~gth in Reference 60
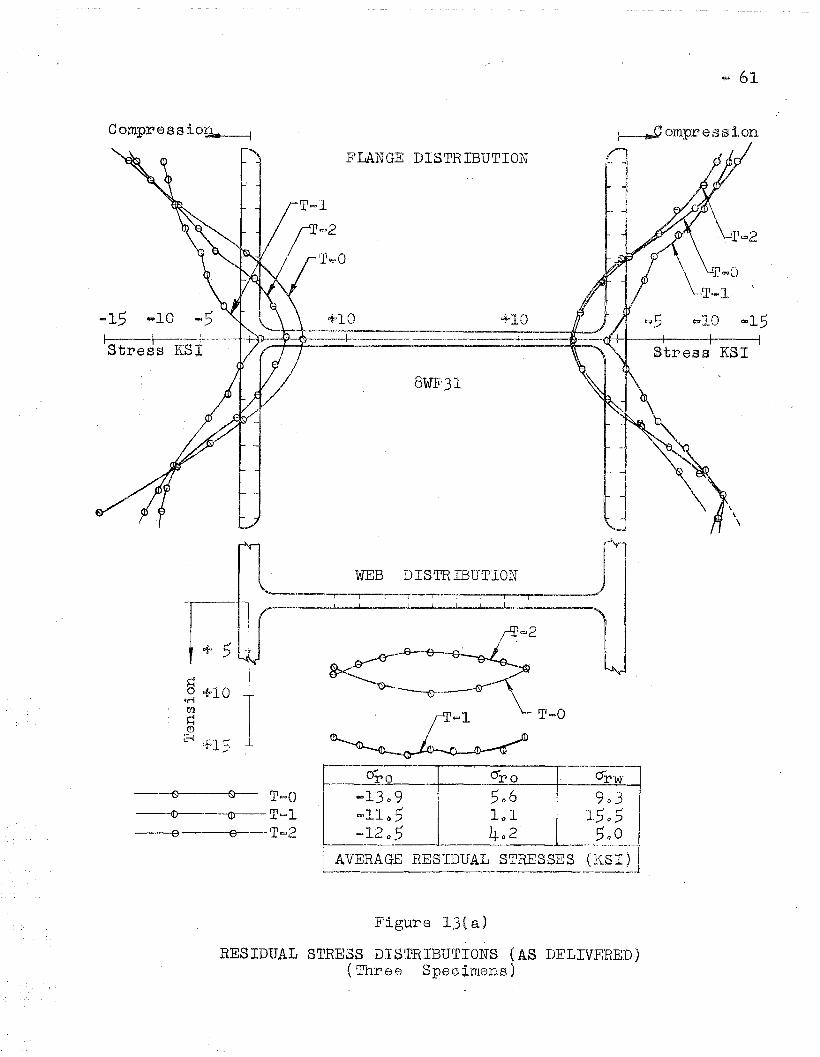
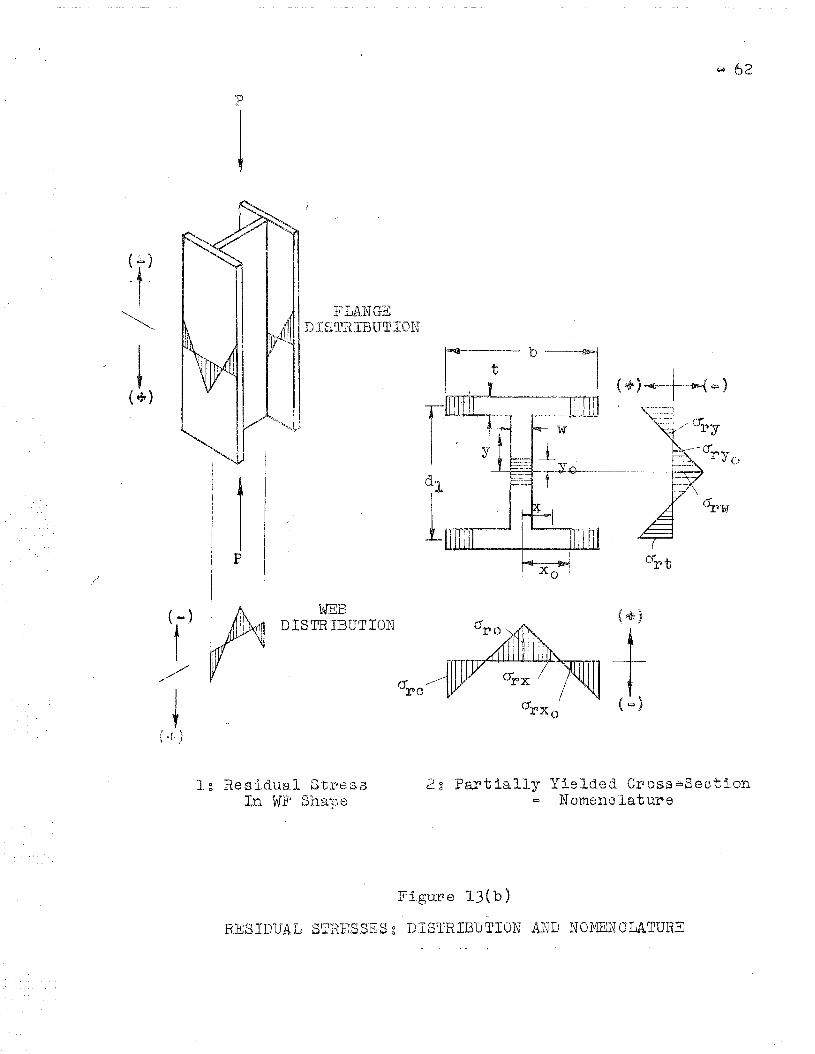
A ~ typical re sidual stress d~stri,bution diagram .for a WF
shape is shown in Figure 13 whe~e the terminology is also explainedo
Generally 51 'these distributions may be appr'Dximated quite well by
st.:raight 1.ine segrn,~n.tso I(rom a'~knowledge of this distribution it
is Vos;sible to predic,t ~he '.avera,?6 a~ f curve .for the full cross
sec'tion and the procedure is described in Reference 60

220Ao28 =17
It has been shown in these previous studies that an actual
stub colunnl test gives a more aocurate and far simpler means of
ob,taining the average (j'=- t. curve than the length'y calculations that
are required starting from a measured residual stress distripution o
The i'mportance of this average curve is that the apparent tangent
modulus values obtained oan be related to the oarrying oapacity or
the member and thus oolu'r11l1 strengths can be predicted o It should
be l)olnted out however, tha t while the fflmee If of the average <T- G
curve shows the effect of the residual stress ·distribution, it
does not enable the specific distribution to be determined except'
for crrco ~rc is generally the largest inherent residual stress
and defines the proportional limit o
(b) RESTJLTS
1 0 Residual Stress Distribution in_WF Shapes
rl1J.1.8 results o~ the previous investigations a.re summarized
in Table 'V f) wIlile Table VI gives the individual detailed results 0
This will give an indication of the distribution of residual
stress .irl ·WF shapes 0 In all cases the method of It seotioning"
'was used o
~ Residual Stress rrom Stub Column Tests
The limit of proportionality of the stress strain curve
defines the magnitude of the residual· stress, ~rc, since in all
cases that have thus far been measured the flange residual
stresses have been higher than those in the webo
(crro =: cry - crp )
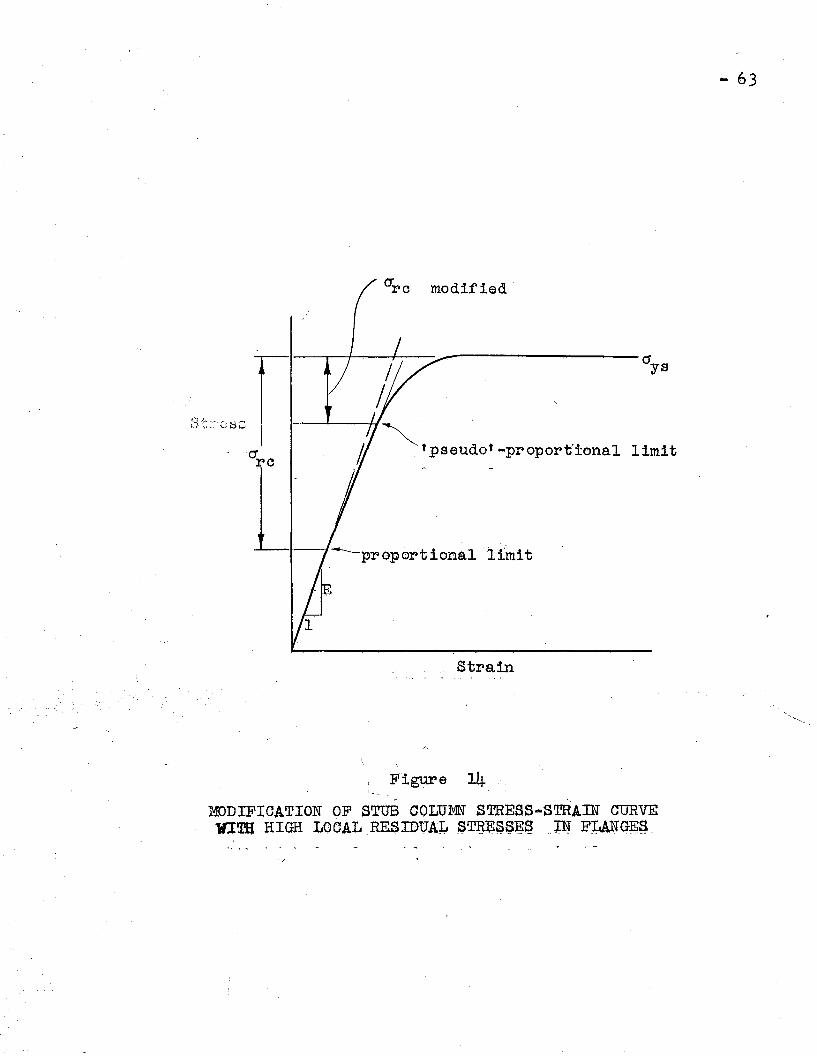
To take account or looal high residual stresses and to
obtain by interpolation a basio value ~or ~rc p~esumed to exist
when 'these are not present $ a a~ E curve of ·the 'type shown in
Figure 14 :i t w'as modifie d in 'the :following manner ~ The portion of
the curve above the proportional limit~ although with a very slight
curvature 9 may be considered as a str~ight line o The tangent
pCJiIl't of this line w'ith the r'knee" of the curve is then taken as
a pseudo~porportional lirni t 1] thus defining what in this. report
will be regarded as a basic value for Grco
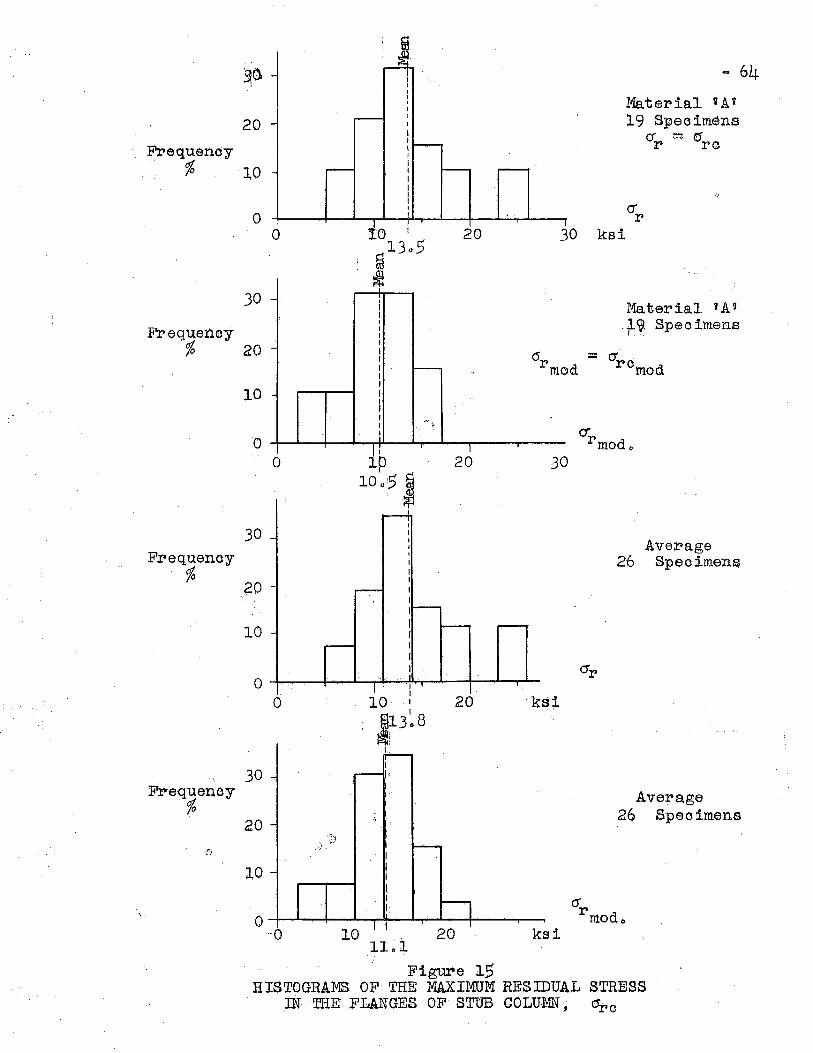
The results following ~d shown in Figure 15 are of two
types» the actual residual stress average ro~d the average modi~
fied as explained above~ where necessaryo
To show whether or, the maximum residual stress as determined
from a stub column test fJ is a ~unction of the yiel,d stress or not;;
the ratio or/Oys has also been considered with or both modified
atld lil11Uodified o The results are shown i.n Figure 16 Q
( a) a!~ from Stub ColunID.(l Figure 150
material !tAn Or = 13Q5 ksi mean value (19 specimens)a - 1005 ksi mean value (19 specimens)rmod
material "Bu or := 1406 ksi mean value ( 7 specimens): a = 12 0 6 ksi mean value ( 7 specimens)rmod
average or = 13 0 8 ksi mean value (26 specimens)
a .- 1101 ksi mean value (26 specimens}rmod -
ill. °r/Oysfrom4$:
Stub Colunm Q Figu.re 160
material nAft °r/Oys = ~-lo 1% mean value (19 specimens)
or/aysmod = 32Q9% mea.n value (19 specimens)
material nEtt °r/Oys == 4105% mean va.lue ( 7 specimens)
or/oYSmod = 3506% mean value ( 7 specimens)
average °r/Oys == 4102% mean value (26 specimens)
°r/OYSmod :::: 33 Q6% mea.n value (26 specimens)

220,!Ao 28 ~19
jo Residual stress Prediction,
Attempts have been made in the past9 to correlate the
residual s'tresses of a shape with its physical properties!; such
as b 9 d 9 t 9wo This has also been attempted in the present investi~
gationo Unfortunately» the only statement that can be made re~
garding these studies is that no definite tendencies seem to existo
Probably the most intricate and complete endeavor at this
prediction has been made by Ao HUber90 It is felt 9 however j that
his method offers no better accuracy than obtained by merely esti~
mating values from the tables of results already at hand o
For these reasons then s the correlation attempted by the
author has not been presentedo
220Ao 28 ~20
IV Q OTHER MATERIAL PROPERTIES
(a) INTRODUCTION AND DESCRIPTION
The determination or the yield strength of a material is
accompanied usually by the finding of the elastic modulus 9 and if
tIle test be on a coupon.9 the ultimate strength and strain hardening
mo&~lus are also easily obtainedo
This chapter seeks to present additional da.ta on the follow<=>
i.Tlf~ prJoperties ~
10 YoungUs modulus, Eo
,20 Strain harden:).ng modulus, Esto
30 Ultimate strength of a tension coupono
The t,W() moduli $JE and Est 9 may be defined as the constant
ratio of stress to strain in the elastic and at the on~set of the
E\t~,r~;8"in~ hardenj~ng ranges o
The procedure of testing with tension coupons has been de=
SC1)ibed abo'v6o The results .from these "tes'ts have been enumerated J
and the Young U s Modulus will be compared also with "the values ob=>
tained from stub column testso
(b) RESULTS
h Young Us Modulus 2 Eo
Tables II and III show the actual experimental values
fo:!? E from bo'th coupon and stub columna Indiv,idual coupon values
al"le sholifn as well as a. combined value for the cross section 9
weighting the average according to the respective areas of flange
and webQ To check this method~ the results were then compared to
those obtained from the full cross section by stub column testso
22011. 0 28 t=21
(a) E 9 Weighted Coupon Results 9 Figure 170
It is noted that the flange has the lower value for E9 as
was the case with the other properties obtained from the stress~
strairl curve 0
frAn 3( 21 specimens)luaterial E == 31 0 2xlO ksi mean value
material tlB'tf E = 31Q lxlO3 ksi mean value (11 specimens)
, average E = 310 2xl03 ksi mean value (32 specimens)
~,{·b) E£l Stub Column Results p ,Figure 170
luateri 8.1 HAu E "3 value (19 specimens)::;: 31u 5xlO ksi mean
material uB tt E :=: 30 0 4xl03ksi me all value ( 7 specimens)
a,verage E := 3102xlO3 ksi mean value (26 specimens)
b. Comparison of Coupon and Stub Colunm Results for E
To check the assumption ~or weighting the average for E
with the coupon tests as was done before with the other material,1
Irr~operties ~ the ra'tio for E for each particular sectioIl,9 obtained
by the above two methods~ was comparedo See Figure 18 0
material "A" Ec~upon :::::; 99,. 7% mean value (16 specimens)Estub column
- ~3Q Strain Hardening Mod~lusJ Est
material uB U
average
n =100 0 7% mean value (6 specimens)
=10000% mean value (22 specimens)
,At the time of publication the reductioll o.f results .for
this proper'ty was incomplete and cannot be presented here Q
~'The Ultimate Strength of a Tension Couron,i,
Similarly to the method employed with the static yield
stress SJ t.;he -ultimate nominal stress in tension:; ',-for a wide fla.nge.'.,' .
shape was determined by the weighted average 6.t<'the individual
crnlpon tests for web and flange o Further J to account for the re=
duction in area ,the ultimate strength is also shown based on the
220Ao 28 ~22
percentage reduction recordedo The individual percentage reductions
have been combined according to the weighted averageo
It is pointed out that use of this method with coupon ulti~
mate strength is probe.blJ1" extrapolating too, far as no account is
rl1ade o,r the changed crystal structure due to the "necking" cj The
results should be indicative however 9 since the values for per
cent,ag;e reduction gerlera~l,ly d"o rlot differ greatly for fl,ange or
'w'e"b from the s artIe sha,pe 0
(a,) °0"l11t frCJID Weigl1'ted Coupons of "simulated" Tes'ts:; Figure 190
nlaterial nA" 0ult -- 62 0 9 ksi raean value (23 specimens)
material nBn aul t -- 6503 ksi mean value (12 specimens)
average a'ult ~-- 6307 ksi mean value (_35 spe,cimens)
(b) °Oultmod from Weighted Coupons 9 Based on Ultimate Cross=
Sectional Area~ Figure 200
rnaterial nA~Y 0ul tmod
Inateri a1 uE U a'ul tm()d
average OUltmod
~- 13409 ksi mean value (23 specimens)
~ 1350 0 ksi mean value (12 specimens)
...- 1~_34o 9 ksi mean value (35 specimens)
ill O(1u lt from Mill Teat;s (web) p Figu:ve 21 0
material nA u GUlt - 6603 ksi mean value (24 specimens)
.. material "13 t, aul t := 68~ 2 ksi mean value ( 7 specimens)
average aUlt ~ 6704 k$i mean value (31 specimens)
ill <) aul t from Silumated Mill Test's (web coupons)!i Figure 220
material "AU ault .:...... 63Q .5 ksi mean val.ue (24 specimens)
material uB if (Jult == 65'00 ksi mean val.ue (13' specimens)
average °ult -- 6400 ksi mean value (37 specimerls)
(e) Percentage Reduction in Area.9 Figure 230
10 Web ma'teria.l "AUmaterial uB If
average
1+.90 6% (24 specimens)
50 0 8% (14 specimens)5001% (38 specimens)
( continued)
220Ao 28
,20 }111.ange mEtterie.l nAu 5'40 0% (24 specimens)
material uBn 5106% (14 specimens)
a~lerage 5:3Q 1% .(38 s'pecimens)
~io weightedrnean, material nAn 5303% (24 specimens)
material uRn 5"104% (14 specimens)
average 52 0 6% (38 specimens)
Average failure is on 4704% of original areBo
~ ~£!LStress S~n Curve
A typical stress strain curve has been drawn from the
abc>ve results ,9 being an average obtained from the stub column
testis ,9Ild ()ther tests conductedo Figu:re 240
220Ao 28
~ ~O~9LUSI~S AND P1SCUSSION
'l:he fol,lowirlg disc'ussion embodies the conclusions and
suggestions that follow from the results above o
1(1 The ;)rield strength has many defixlitions o The static
yield stress 9 0ys however 9 is the preferred value as it
:18 the easiest to obtain and also ilS the stress trlat
corresponds best to normal structural loading conditions Q
Irl stub colunm tests;; by allowing the load to ttsettle
. d01\rn n:y that is COlne to an equilibr.ium posi tion after a
load increment p it is the static value that i~ obtained o
With coupon tests 9 all that is required is that the rate
of ErtJ~aj.l~ing be decreased to zero anywhere in the plastic
yiel,d rarlge o This is easily accomplished .in mecl1anical
ai1d llydra~ll].ic test'ing machines p al thotlgh wi th the latter:>
a dial gage indicator is required to show movement of
the cross head~ and to guard against strain reversal o
From the results (Figures 4959 and Section 0-1) the
approximate value for 0ys was 3307 ksi o This was the
overall average for stub column and simulated mill
(weighted average) tests¢ Until more extensive tests
show' otherw"ise p this value is close enough to be taken
as the usually accepted cry = 33 ksio
Although an attempt at a frequency curve 9 rather than
a histogram~ was made this statistical method of repre=
sentation could not be carried to fruition e The method
was n.ot applicable on a number of counts;1 the number of

l"3esul,ts were too smal:l to be a representative saraple y the
results were not dependent on chance alone but on many
n1anufa.cturirlg .fac'torso For instance J it would be expected
the comparatively large sections give small values f'or 0y9
w'hile small sections give larger val,tleS o ' The aluourJ.t of
cold work 9 rate of cooling 9 etc o9 undoubtedly played a
major role in this situationQ
2 0 Mil,~l test resttl,ts for the yield streng'th were approxi<·o
mately 27,% higher than the tri"Q8 stati c 1.eve1 9 dl16 probably
t() 'two causes ~
a. these are tension tests run on coupons c~t from the
web 9 whicn being rolled thinner than the flange give
about a 4=7% higher yield level than the flange o
bo the yield strength depends directly on the strain
rate as shown in Figure 10Q Even w'i th a.pparelltly
small strain rates approaching zero y 0yd can be 5%greater 'thandys p w'hereas at normal testing speeds J
13~18% is a better figure o
The strain rate ha.s' an obvious and sensitive effectQ
Thel~efore[) unless i't is specified for testing the correla=>
tIon..of re sul·ts of di.f:ferent tests is imposs.ible 0 Indeed.9
in this series of tests conducted on steel from the same
lot!Y the simul.a.~ed mill (Fritz Laboratory) tests produced
O"yd approximately 5% lower than did the mill testso The
former used the recommended speed of the ASTM A6~54T (and
A370=54T) while the testing speed of the latter is not
known al thou gh i t shoul.d be the s arne ()
~26
One of' "the more important obj ects of this investigation
was to see whether the yield stress could be defined by
the mill testo The results 9 Figure 8 and Section C~3 are
variedo Comparison of the static yield level w"i th both
mill arId Simtlla<ted nlill results w-as corlsidered Q The range
of distribution was reasonably good and the average was
equal to 79% for the ratio a;~~110 More consistent results
Trlere obtairled for the ratio Oys -"'="'-~9 w.i'th an average of°ysimo mil:l
82%0 (In all cases» Gys is .from weighted coupons 0 ) This
again brings up the question of a standard strairl rate $
mId the good agreement of the simulated mill results above 9
(simiJ~ar 8'train ra'te results from stee:l of different manu='
facturers) lAroul,d bear out 'the premise o It is ext~remely
difficul"t to draw definite COnCl11.siorlS .from these .figures
above p particularly as previous investigations4 have ob=
of. 01 ~tained 851o± 5/0 as the ratio of Gyd Q
From the above J it is suggested that 80%* 5% is a prob~
able val,"ue .f()r (Jys Q
a'ymill
The procedure in the previous paragraph was for the
weighted tension coupons but the same results would have
srlown had Gys.from s'tub column tests been used o Figure 9
and Section 0=4 show that almost perrect correlation exists
for 0ys between stub column and weighted coupons 0
Another result of this study is that the full crOBS
section strength of a wide flange shape may be estima~ed~
wi th complete confidence;; from 'tension tests on coupons cut
from flange and web o Although economically this may be no
220Ao 28
sa~lingj) it does enable a laboratory with test.irl.g machines o,f
it limi'ted capacity to obtain reliable estirnates o Unfort<=
Ul1at~el.y9 0ys a.l1dE are the. only properties tha,t such coupon
tests IN'ill supply ~ the inlportant o'p arid rtkne.e n of the 0-. €.
cur"Je (show'il1.g effect of residual stresses) for the .fl111
cross section cann,ot be estimatedo
L}r)' The problem of strain rate 9 and its effect on the yield
s·tress as shown above can only be o,rercome w'i th substantial
ter3ting on a wide variety and type of testing machine o
Steel from the different manufacturers must also be subject
to exhaustive testso Since the strain r.tate irl 'the "elastic
range is l1.ot to() important;) wi thin r oi easonabl,8 limits f) the
basis for such a series or tests should be on the free=
rum1ing speed of the cross heado It is expected that thel
'outcome of such tests will show a similarity in the
G'yd( . versus strain rate) curves for different typ~s ot:test=°ys
ing machine and steels o This has been indicated from the
reasonable correlation between Marshman5 and Romanelli59
'the former testing on a screwoo<>type mechanical machine and,:
the latter on a hydraulic machine 0 Such tes.ti,~12rould in
dicate whether the difference for (Jyd betwee;~r>,s\imulated
and mill tests was due to the different testing machines
or to difrerent strain rates used o Up to the yield level
and in the strain hardexling range the type of machine and
size of specimen has a much larger effect thro~ in the
plastic range o This effects ~owever, seems to be of little
practical interesto To check this elastic effect of machine
220Ao28 =28
aXld speoixnen in the plastio r-ange f) mecha~nical stra..1.n gages
lJ\f()lll,d be attached O'ver the full lerlgth of the specimen to
rneasure the ac'tua~l str"ain rat;e and to compa,re thelU with
Tests have demonstrated that a fast method of obtain=
ing 0ys is to decrease the strain rate to zero once or
t~wice in the plastic yield range (wi th no s'tr4 9.in reversa~l) 0
.S'n It was [[9,how'n that~ eonlpressiorl and tensiOll coupons give
a:lrnos't iderlt~ical results o The di.fficul.t cornpresston coupon.
test can therefore be eliminated in all but confirmatory
60 Cferlerall.y speaking heavier section.s ha."\re a lower 0y arld
:ligllter sections a higher 'value 0 Similar general state""
~lellts w'ere made for b/·t and 0< ratios" The sma.~ll sample
of results 9 however~ precludes any definite conclusions 0
70, F:rt')m the stut) colurnn tests conducted» the indicated
\r-t:L'lue for or is 13 ks,i o This is the mean of the maximllffi
compressive residual stresses in the cross section and in
general occurred at the f:l ange tipo Further:; this valuet
1.s the complemeIlt, of the proportioD~al limi t wi th respect
to the yield stresS 3 indicating that the average value ror
proportional limit is approximately 20 ksi o
The above vallIe is a. realistic estimation deduced f l rOTIl
!i'igu,re 1,5 where the urnodi,fied n values ha"ve also been taken
into slight consideration o Attention is drawn to Table V
where the values 1203 arId 707 ksi (compression) are average
,ralues for WF shapes ():f d./b ~ 105 and .:> 105 respectivE31yo

220Ao 28
OrSince the histograms for the ratio have become
°ysmuch wider irl d.is~r:ibution.9 rather tp.arl nardrow'er:f w-i th
respeet to the or histogranls , it is ooncll1ded that eTr is
.rl0t a ,flLQotion of the yiel,d stress o This has tended 'to 'be
confirmed by recent pilot tests on low alloy high strength
steel where or was ,found to be of tllf; same order of magrli=>
tude as WB.S measll:red in A<=7 s'teel o
8 u Tl'le predictitJYl ofl the residual, st:ress dIstribution
based on mathematical relationships between the cross
sectiO!lal, physical properties is flot warranted un'til .fur=
ther and more complete t~st results are at h~do Adequate
estimation may be obtained from tabulated results already
ava:i.l.,abl,e suc.h as Tables V and VI of this report o
90 The Y'oung O ;8 mf)dulus was round to be 310 ,aID [3 ksi f) the
overall ~rV'erage va~lue obta,ined fr01U all coupon and stub
colllmn-> tests conducted ill this series o
As with the yield stress~ an excellent estimation for
the Young U s mOd'Lllus of a full cross sec'tional sha.pe may be
obtained from the weighted average of the coupon valueso
No e.ffects of size on 'the Young l1 s modulus was noted.9{;
altll'ough the number of specimens w'as too' smal:l for any
definite conclusionso
10~ The ultimate strength of tension coupons~ Section IV=b~49
Figures 19 9 21 9 22 lies within very definite bounds with an
average of 64~67 ksi o (This is within the limits 60~72 ksi
speci1~ied by ASTM A7t=55T) l) These meas'uremellts are ba.sed on
the initial cross sectional areao ·It should ';:;e noted tha.t
220Ao 28
the simulated mill tests gave somew~at lower results than
mill testso However, this small difference was prob=
ably due to the slower strain rate after the yield point
the simuJ.. a<ted mill testso
The ultimate strength b~sed on:ultimate cros9'~Bectlon
is 1,ikewise wi'thiD~ d.efini.te bounds wi th an average of
approximately 135 ksi as shown in Figure 20 0
The percentage reduction in area. although' with fl" slightly
wider range 9 Figure 23~ is also reaonably consistento A
d:li),ference of 5% between web and .flange values was noted',,- ',~
sllggesting that thickness of rolled section could have an
efrecto Generally taking a weighted average for all speci~
mens the percente.,ge reduction in area. is approximately
220AQ 28 ~31
VIo SU"GGESTIONS
Continuing from the previous chapter on conclusions and
disOllBs1.()11S 11~I"ith respect to ·the liluited number ofl testTs conducted.,
t,he ,fo:'LlolflJi,n,g 8'uggestions become rel,e\lantg
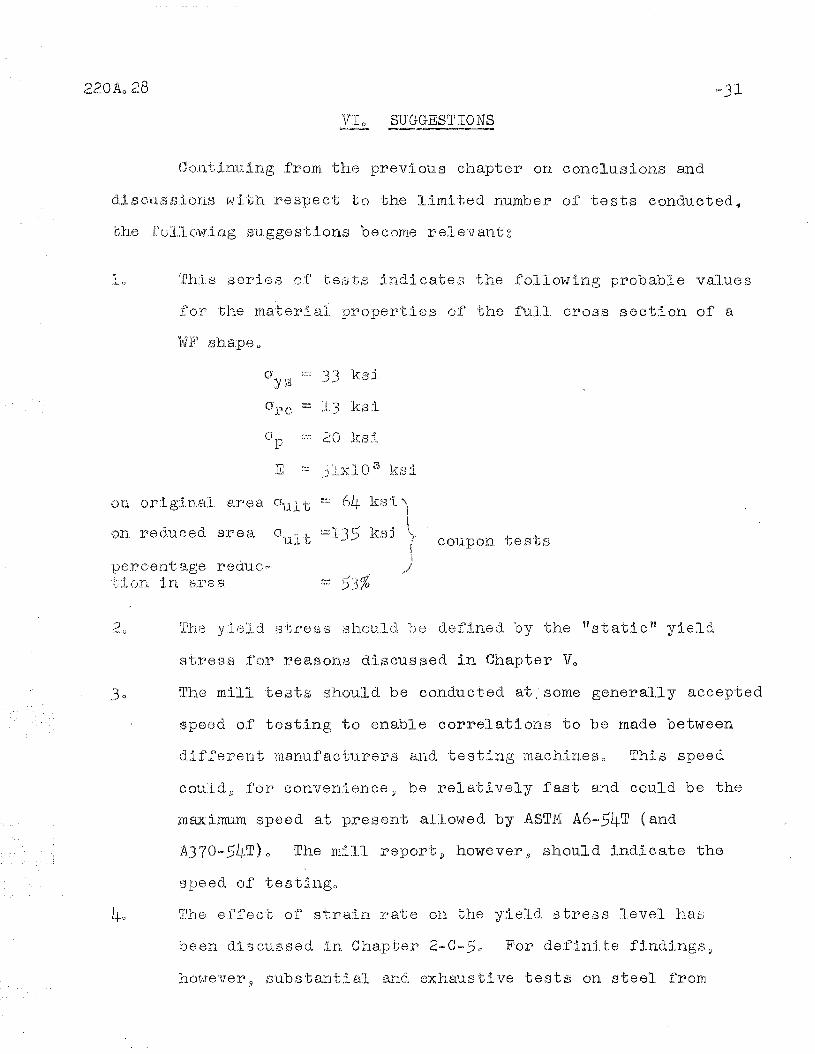
~lo TILt;g serie s of tea ts indi cate 13 the following probable va.lue s
for 'the material. properties of the f1,.:tll, cross section of a
C)' '["~=-":I ,33 kslyrJJ
O"l;)e ........ :1,3 ksi
Cfp '==" 2~O ksi
E 011;:;=-:-..... ':'lxlO 3 ksi,~)
()rl ()rigir18,1 area au.l t
on r;,ec1uced a4reB~
per~c'ent·a.,ge redu.c,,~
on .in lEtre B,
- 64 ksj.)I
5' ksi \.,f
~I)
i~.
COllpon tests
,20 The y:iel.d stress sh()'uld ()6 defined by the 1f s tatic U yield
stress for reasons discussed in Chapter Vo
~io The mill <tests should be conducted at,' some generally accepted
$peed or testing to enable correlations to be made between
dif.f~ererJ,t rnanufacturers and testing machin.es o This speed
COllld.9 for co,nvenience;; be reI atively fas t and could be the
maximum speed at pl~esen't allowed by ASTM A6-.54T (and
A370~54T)o The mill reports however» should indicate the
speed of testingo
40 The effect of strain rate on the yield stress level has
been discussed in Chapter 2=0-50 For definite findings~
h01-\re'"er 9 sorabstan'tial arid exhaustive tests on steel from
220Ao 28
d,lf)~f~el~en,t marlu,fa,cturers shou~ld be conducted on a~ wide
;\tR.L'P~tet'y fll1d 'type °,f) 'test;in,g machine 0
,,'0 ~rr.Lls 861-"ie8 ()cf test(3 111rt,her irldica.ted that the nsta'tic Yf
],e"vel, o:f yie:ld Isrtress ,for a WF s11ape is 80%t 5% of tIle
m.ll,l, test V'i:ll~"ue Ctn a t;ension coupon cut .frora the web of
'the SE3c'tion Q StandarJdizatiorJ. 'to a definite 'testing rate
may c.hsllge this 'V'Ell:ue a
6<) 'rllE~ J'ieI,d i5rtress an,d. 'Y'()lll1.g R s modl11~us ,f()l~ a gi ven shape
C~Jl be e;gt,iJna:ted acol1r~a.tely from test resul'ts on COUpOY1S
elJ.t f:r?t)m i'lange arid 'web, i.f tIle w'eighted average accord~
iIl,~~ 'bo r'espec't:i ve areas is used o This is or use where
~)111..y srnil:l:l ea..paci'ty t,8stixlg macl1ir18s are available o
70 The elimination or compression testing of coupons is
1N'a,rI~arlted irt 'the case D.r rolled structural steel, shapeso
TeJ:1Sit)rl COllPOlJ,S a,ccornplish 'the same purpose with greater
220,$}.0 28
.A~C l(NOWLIGDGiillJIENTS............,.-'Q'QF-=<O:._ ~~
~33
'fllis S·tl1d'y· b.as bee:n, [aade as a S,trllct~ura1, Resea:rch problem 1
course !lumber CEL~04!J o,f -the I)epal~tmerlt of Ci'vl:1 En,girleeringo It
prese11'ts ,f.t par~t, clf 'the tlleoretiea~ and expeI~.imental ~rt'ud,ies nlade
on. a l~esearch progrroTI on. the in.fl"uerlCe tJ,f Y'esidllal s'tress on
Pllblie f{r)8,ds [J t:lle N",9:ti.t)na~:1 SeieIlce FCJUrlda.tion and 'the Column He<=
SE~a.1?C}"J. OCj.tl11e:il. j ()lu'tl'y' t3P()YltSOr 'the res8,arch pl':Jograma
sincerely appreciated o
MallY t~es't HpecimellS Tt\fere prepared in the machine shop of
Fri,tz Erlgirleer.i:n.g l~abore~toryo Sineere ,appreciat.ioYl is expressed
Messrs o a'8orge Lee)l Robert~ Wagrler ~'rld Theodore Galambos
assisted. in t~l1.e tes'ts arid irJ. the prepara:tion. of t:;he datao Their
cooperation is gratefully appreciated Q
Io LQS() BeedJ=8 9 B o Thtfrl.imarUl,9 and RoL o Kett:erPLASJ,rrC DESIGN IN STR1JCTURAL STl~EL q S1..1mme"r Course])IJehlgll U-:tl~1"\Ter~1i't'JT[) Septembel'~ 19.550 "
~:o Ao Wo Hu1;er6
THE INFL'UEJ>TOE OF RES:IDUl\L S~rRESS ON THE IN'STABILITYOF (;OLTJl\11~'S» Fri'tz L,abc)rJat()r1y Report No o 220Ao 22,Lel1igh 'O'rliversi"t~~9 Ma·y 19560
~3 n i~o viG HLlb erSlTUB COI.J1JMl\f TEST 9 Fr:i't;,z; La,boratcl1~Y Report ,Noe 220Ao 16.9I~il::~11:igrl lJ11i'v'er~sit;'Y,9 a"ul~'y 1,9.560
L~.o .A Q ir 0 C:t(),ZTllTI ttl1d .A Q W0 HuberMATEli:IitL PROPEf(~rIES:y RESIDUAL STRESSES ,9 A1\TD OOLUMNS~eRl~N'{J~rH9 Pr~oE3r~ess Repor't 9FTJj,t,z Labora~tory Repor'tI\r~)o ~2c~t)j\0:1.4.9 Lehigh TJniv'ersitY9 Nov'ember 195'50
,~~,' 0 l:]" 0 (~o l\1a:r~1 s['nna.Il.
THE 11IB1LTJENCE: C)F PLASTIC STRAIN RATE ON THE Y:IELDSlrREN'GTI1 O'F M~TI~D STmLs> Unpublisherl s Le11ighlJ.ll:i.'Tsrsit':,?·D Jllrle 1,9560
('/0 ho V{Q Hl1rJ81" BX1~d Lo So Beedl~e
RESIDUaL. STRESS M~D THE COMPRESSIVE STRENGTH OF STEEL p
Fr'ity~ L at)or~a:t()r'Y- I?e.f>oT"t 1~'oo ~?20Ao 9 9 Lehigh Urliverai ty 9
IJe ceruber 1,9 5'~3 0
7n Refer to Page 5 of Reference 4080 a o Reference 2
b o Refererlce 4C Q Yo Fl1j i t.a~
BUIL,T UP COljlJlVIN STRENGTH~ Disseration,9 L-ehighUniversitYa 19560
170 AoWo' Huber;>RESIDUJ\L STRESSES IN WIDE '''FLANGE BEAMS AND OOLUMNS;>}ttl~it~z L aborB.tory R,eport NO Q 2201\0 2,5.9 Lehigh lJniversi ty 9
July 1956 Q
1,0 Nomencl.at'u:r~e
APPENDIX=tz ~
~35
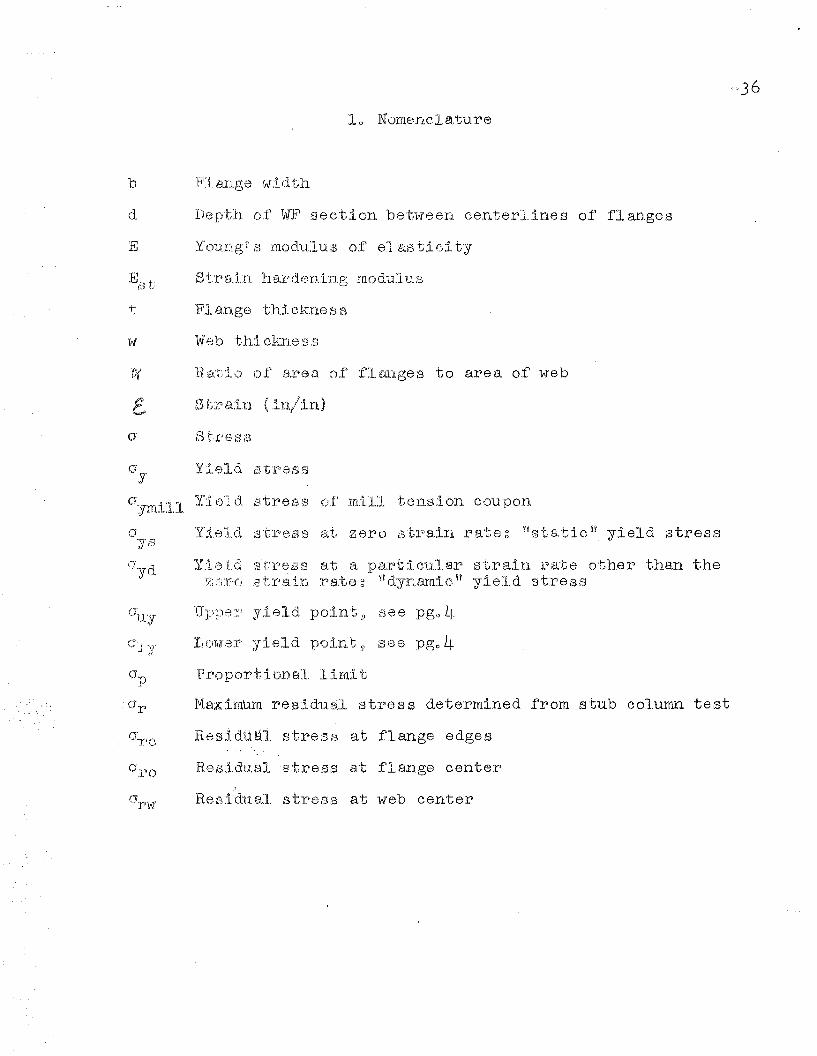
10 l\fomerlolature
d I)e[Jtll (J,f WF seetiorl 'be'tweerl centerlines of flanges
Ec''l+ Str~tJ,trl l1Etrd.enirlg m()du.~lust,;) \,)
t Fl artge t;hi Ckr18 3 r2~
a Yield stress.y"
~Y:-iel,d atl:06SS at a Pllr'~,t"icul.ar' s~trairl l~ate o'ther than the-,~tf:rr() Bt,r~tt.irl ra:tje g Hdyrlamic n 'yield stress
tf1) 'pe "r;j .y~:i eld. point :) see pgo 4Il()lr\rerl ·yield pCJ;int 51 see pgo 4
0p PI~opor~tio:rlal, 11mit
:' Or l'vlax:imu'm pesidual stress determir.!.ed from s'tub column test
(J' ResJ..d1.ial strer:Js at flange edges-:pc
(J'T)(J Res:tdu.s.l s'tress a:t .flange center
(J':raw' Res~i'dual strec8S a.t web center
2 0 Tal)les
=37
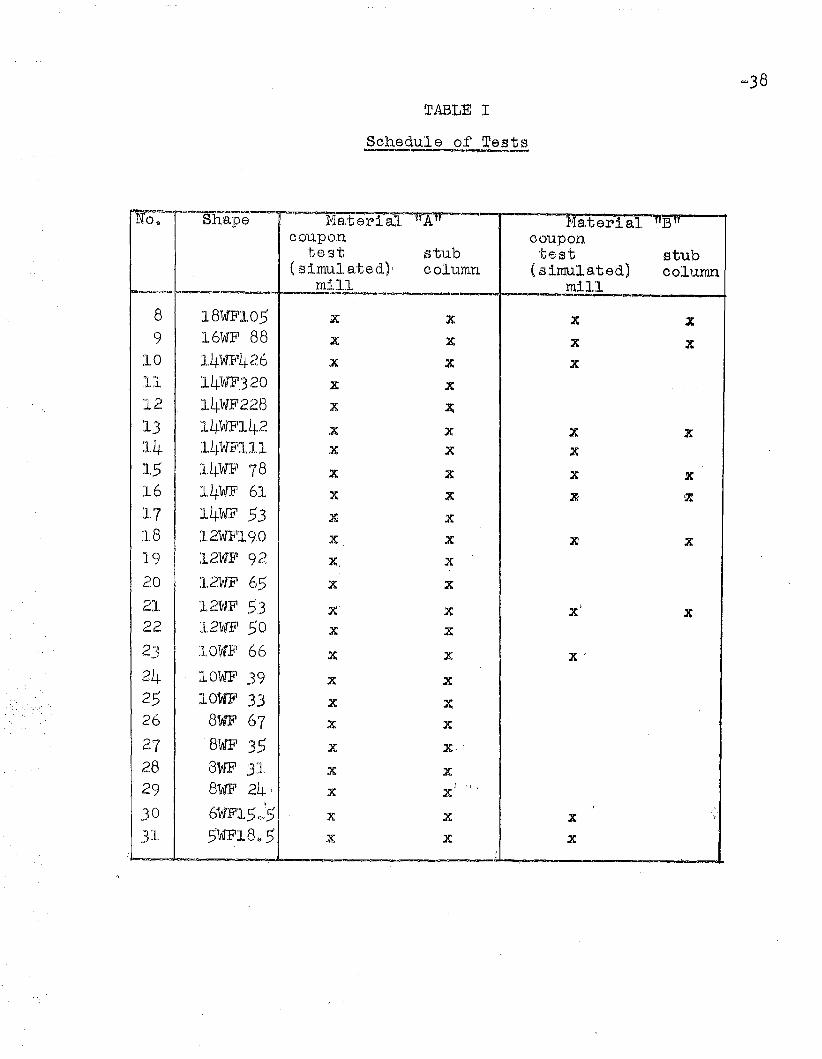
Ir.A13LE I
Schedule of Teststue:=uo-...., 4aQiM~ ........,..........,................
-Noe, shaP6 Ma'terial. nAu Material. HBncoupo,n coupon
test stub test stub( Sim\llat~ed,)' column ( sirnula,ted) column~1___ miJ~:l~p_""t,
~-- -----8 18WF105 ~' x .x ~
9 16WF 88 x X .x x10 1,4WF'L~26 x x x11 14WF.320 .x x12 1 41JuF228 x :x;
13 14W}i'1L~,2 x x x x:14 14WE"11,J.. l x .x x15 1LtWF 78 x oX x It16 1,LtWF 61 x x x· IX
:17 14WF 53 .x' x18 12WF19,Q x x x' x19 :12WF 92 X" x20 12WF 65' x x21 12WF 5'3 x' x Xl x22 12WF 5'0 x .x23 lOWF 66 oX x x'24 lOWF ~39 x x25 lOW 33 x, X26 81r1F '67 x x27 8WF 35 .x x'28 8WF 31 .it .x29 8WF 24: I ",1, \
X X'I
"30 6WF15Qy'5 x x x .1 1,1....
31 5WF18 0 5 .it x xi !
-38
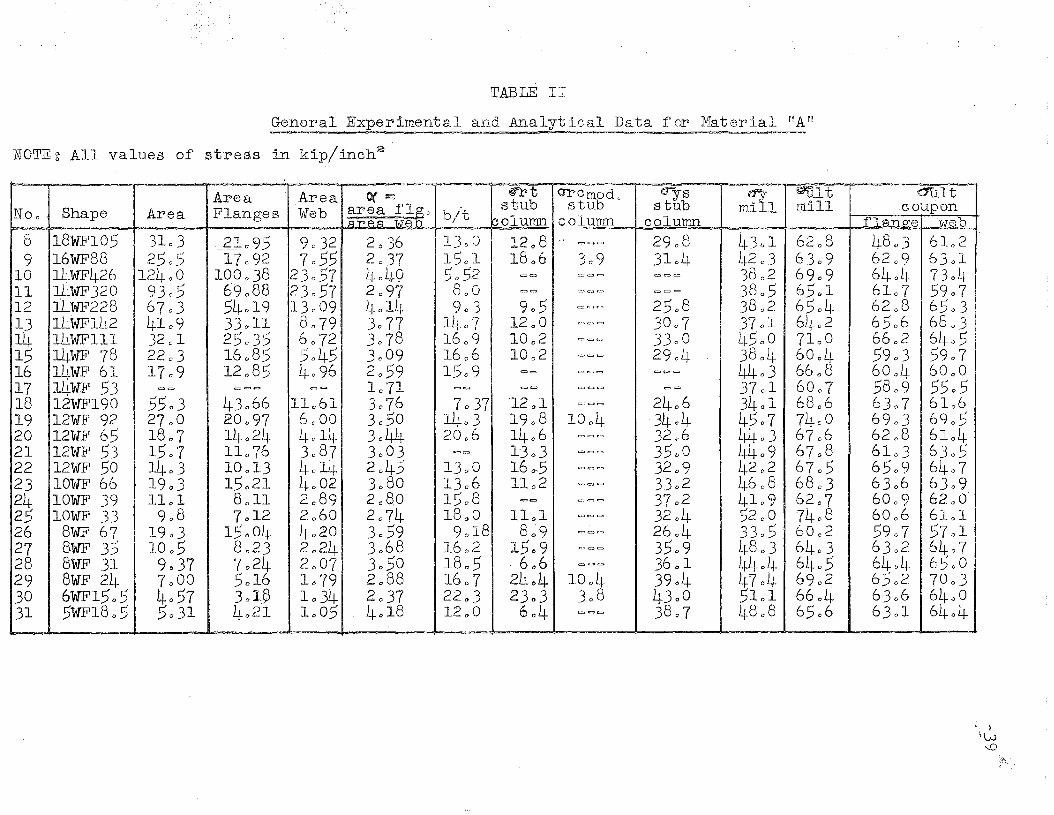
TABLE II
G..:...neral Experimental aD.d Analytical Data for Material rYAlf
NOTE~' All values_ of stres-s- in kipjinch2
Area. ' -Area O(g; qrt ~crnodo ~ys ert'r erult cTult
N-oa Shape Area Flanges Web area flg o bj/tstub stub stub mill rnill "coupon
~~Aa lAre b bolumn column column fl~nQe 'web
8 18WF105 3103 ~)?_J.. () 95 9032 2 0 36 13 0 0 12081=~= 29 0 8 4301 6208 4803 61029 16WF88 2505 17092 7055 2037 1501 1806 309 3104 4203 6309 62~9 6301
10 1~¥WF426 12400 100038 23057 4040 5052 == =~= === 38 ~2- 6-909 6404 730411 ~4WF320 9305 69 0 88 23057 2 097 8 60 =~ === === 3805 6501 61 0 7 590712 14WF228 6703 54019 13009 4614 903 905 === 2508 3802 6504 62 0 8 650313 14WF142 4109 33 0 11 8079 3077 1407 12 0 0 === 3007 37bl 6402 6506 '68 0 314 14WFlll 32 0 1 25035 6072 3078 1609 10 0 2 ~== 3300 4.500 71 0 0 66 02 640515 14WF 78 2203 16085 5045 3 0 09 1606 10 0 2 =c:::::.= 2904 - 38 0 4 60 0 4 5903 590716 14wF 61 1709 12 6 85 4096 2059 1509 == === =~= 4403 66 0 8 60 0 4 600017 14WF 53 == =l:::It::2 -c;:::;o -= 1071 =e:.- == === == 37 01 6007 5809 550518 12WF190 5503 43066 11 0 61 3076 7 (] 37 '12 0 1 === 2406 3401 68 06 6307 610619 12WF 92 27 0 0 20097 6000 30.50 1403 19 0 8 1004 ·3404 4507 74 0 0 6903 690520 12WF 65 1807 14 0 24 4014 3044 2006 1466 === 32 0 6 4403 6706 6208 610421 12WF 5]- 1507 11 0 76 3087 3003 c:=-= 1303 === 3500 4409 6708 61 03 630522 12WF 50 1403 10 013 4014 2045 13 Q O- 160.5 ~== 32 0 9 42 0 2 6705 6509-- 640723 lOWF 66 1903 15 6 21 4002 3080 1306 11 0 2 c:::.=o::::> 33 0 2 4608 6803 6306 1630924 lOWF' 39 1101 8 0 11 2 0 89 2 0 8.0 ;15
08 =~ =c:>= 37 02 4,109 62 0 7 60 0 9 ' 6200·
25 lOW 33 908 7012 2060 2074 18t>o 11 0 1 ==-= 3204 52 00 7408 60 0 6 610126 8WF 67 1903 15 0 04 4'020 3059 901,8 8 0 9 === 2604 3305 60 0 2 5907 -570127 8Wl? 35 1005 8023 2024 306-8 16@2 15¢9 t::::le;:;:to;:::::l' 3509 4803 6403 6302 640728 8WF 31 9037 7~24 2007 3050 1805 . 606 <=:>~e:. 36 0 1 4404 6405 6404 650029 8WF 24 7 0 00 5D16 1079 2088 1607 2404 1004 3904 4704 69 0 2 6502 700330 6WF1505 4057 3o~~ 1 0 34 2 037 22~3 2303 3 0 8 43 0 0 5101 6604 6306 64 0 031 5WF18 0 5 5031 4~21 1005 4018 12 G O 604 c::>e;:;:t= 38 0 7 4808 6506 6301 6404
1_ g~w
'-D~'?:
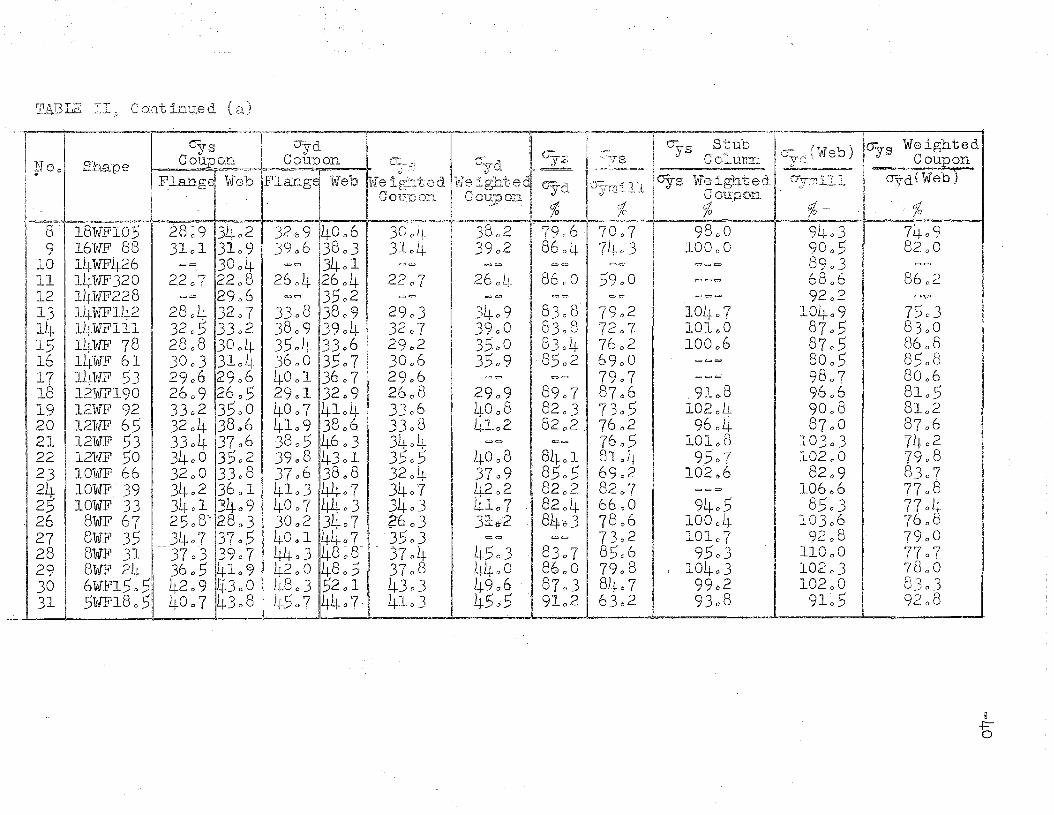
TABLE- II, Contin~ed (a)
I Noo
- CJys uyd - r-~~~fr~'7 r-CJy~ S~ub -t',-r-_ [ -, Icr:; 13 WeightedShape COUIJ on Coupon. ()yd uys 1:"113 Column iL'i,-Web) Y Coupon
"I I (, L
l8Flange Web Flange Web Weighted Weighted tJYd ;O=r~11 ays Weighted CFymill . OYd. WeO )! - ~ I"'t . \T CLL.J.. ,... . ' _
..;01..T'"oon Gounon U \JQupon. - " - , '.d! % % c_ % 10. . .,- M ' 0 0 ,·';0 c· I:)
18~WFI05 . 28~9 3402 32/0 9 40 06 30~:4==~-jb:2 7?o6 70 0 7 _9800 94o~ 74099 16WF 88 3101 31 09 39~6 3803 3104 39 0 2 8604 7403 100 0 0 90o~ 82 00
10 14WF426 == '30 0 4 == . 34 01 == == -e:to;;::j == === 8903 ==
11 14WF320 2207 22 08 2604 2604 22 0 7 26 o~- 86 0 0 5900 === 68 06 I 860212 14WF228 == 2906 ~= 35 0 2 == =~ == == === 9202 =?
13 14WF142 2804 32 0 7 3308 3809 2903 3409 830
8- 7902 10407 10409 750314 14WFlll- 3205 3302 - 38 0 9 3904 32 0 7 39 0 0 I 8308 7207 lOlbO 8705 83 0 0
M,15 14WF 78 28 0 8 30 0 4 3504 3306 2902 _35' 0 0 8304 76 02 10006 8705 86 0816 14WF 61 30 0 3 31 0 4 36 0 0 3507 3006 3509 -"85 0 2 69 0 0 === 8005 85'0817 14WF 53 2906 2906 40 0 1 3607 2906 =-= == 7907 t:::I==- 9807 800618 12WF190 2609 2f~ 0.5 29 0 1 32 0 9 26 0 8. 2909 8907 8706 ,.9J.. 08 9606 810519 12WF 92 33 0 2 35 0 0 40-07 41'04 3306 40 0 8 82 0 3 7305 10201+ 9008 810220 12W"F 65 32 0 4 38 Q 6 41d'9 3806 33 0 8 4lo2 82 0 2, 76 0 2 9604 87 00 870621 12WF 53 3304 37 0,6 38 0 5 4603 3404 =-~ -== _7605 101 0 8 10303 74 0 222 12WF 50 34 0 0 3502 39 0 8 43 0 1 3.505 40 0 8 84 0 l 8104 9507 102 0 0 790823 lO'WF 66 32 0 0 33-c 8 .3706 3808 3-2 0 4 3709 85'05 69 0 2 102 0 6 8209 830724 lOWF,' 39 3402 36_ 0 1 4103 4407 3407 I 4202 82 0 2 82e>7 === 10606 770825 lOW 33 3401 3409 4007 4403 3403 41 0 7 8204 6600 9405 8503 7704
. 26 8WF 67 25 0 8'~ 28 G 3 30 0 2 3407 a-5-'o3 3±-~2 84-w3 7806 100 0 4 10306 760827 8WF 35 3407 3705 40~1 440,7 3503 ~~ -(:;:;:)0==> 73 0 2 101 07 92 08 79 0028 8WF 31 -_.- 37 0'3 3967 4403 48~8- - 3704 - 4503 8307 8506 9503 . 11000 770729 8WF 24 3605 41 0 9 42 0 0 4805 37 0 8 44 0 0 86 0 0 7908 i 10403 102 0 3 780030 6WF1505 4209 .43 0 0 4803 52 0 1 4303 4906 8703 8407 99 0 2 102 00 830331 5W'F1805 4007 43G8 4507 4407, 4103 4505 91 0 2 63 0 2 9308 9105 9208
R-+::o
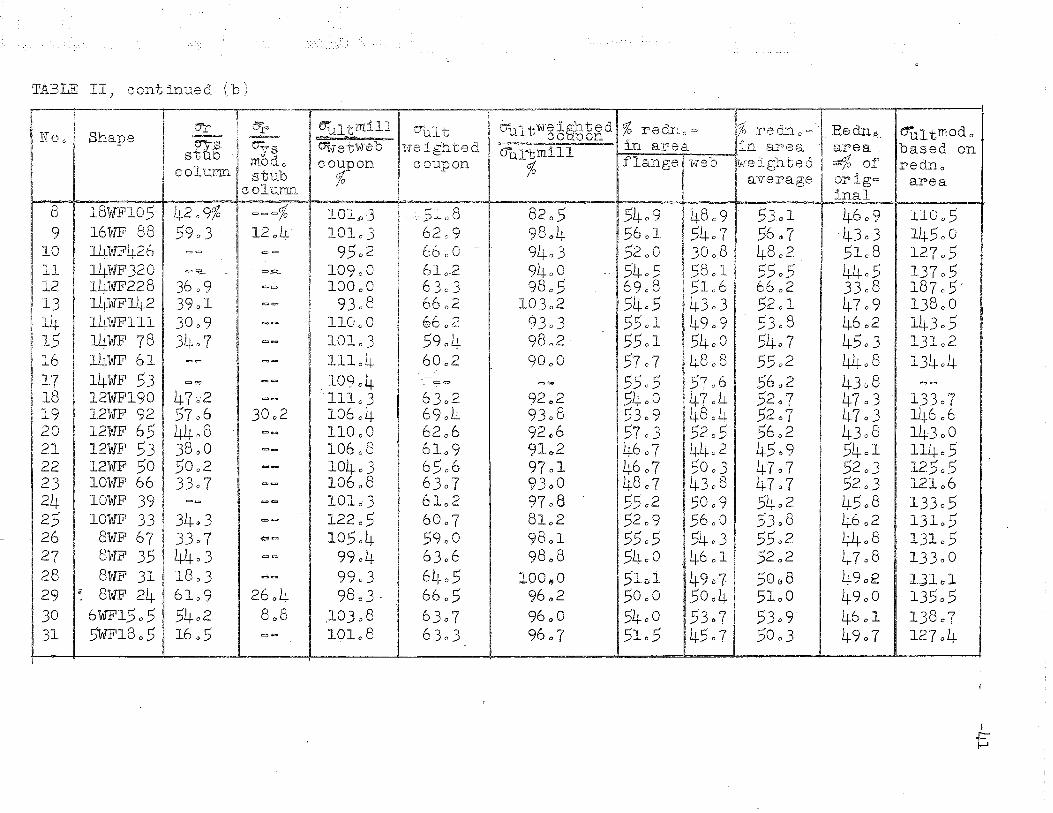
TABLE II, continued (by
~ ~- I .
110 Ci Shapeerr i vl~ eu.lt 111111 C):;._~ ~,i ~ uult 'W'e i§f1.ted %redrl o 2> ,% redn o =- Redn-o-,_ .' ~u-ltmodo~I~ 2re7 --15;::,. - _ 79 :.j,-l~v '. :l ~ qo 'pon __
W 0:;: in area in 8#rea G..rea based on~b- \rsg VW"euweb vJel_-ghtea z::rul~'millst ~- m~d~ flange Iweb litTeigl"lted =.4 f' red_nocoupon ~ coupon % "'~7o O..L.eolD..lTID Ert,jub d ,0 aver'age or i.g~/0 i ~ area
colurtJrl 1
inal8 18WFI05 4209% Cj=Cj% b. 101-fj·3 -,.-:- 5'1 0 8 82D5 5409 48c9 53.01 4609 1100.59 16WFI 88 5903 1204 10103 6209 9864 5601 5407 5f- - t'"7 -43D3 145000 0 1
10 14WF426 == c::l= 95 0 2 66, 0 a -~ . 9403 52 0 0 300.8 48 02 51c8 1270511 14WF320! =9_ (::::19_ 10900 61 0 -2 94 o C\ -- 5405 58 0 1 5505 4405 1370512 14WF228 3609 =~ 100 00 63c3 98 oS' 69c8 51c6 6602 3308 187 0 .5 /13 14WF142 3901 =(::::1- 93 0 8 6602 10302 '5405 4303 52 01 4709 1380014 14WFlll 3009 c:;:;)~ I 110 0 0 6602 9303 5501 4909 5308 4602 1430·515 14WF 78 3407 t::::e:::> ~ 10103 5904 9'802 55 01 54 0 0 5407 4503 13102I16 14WF 61 =c:::::l" e::tQl!:l 111 0 4 6002 90 0 0 5707 48 0 8 5502 4408 1340417 14WF 53 c= 0:::::>
I ,10904 --- 55D5 57 u6 56&2 4368 e::><:::)=~ -" =.e;" =l;i;)-• oJ
18 12w~190 41'0-2 -t::::)= --.11103 6302 92 0 2 54 0 0 4704 .5207 4703 1330719 12WF 92 5706 3002 10604 6904 9308 5309 4804 5? '7 4703 14606,.-;" ., {
20 12WF 65 4408 ~~ 110 00 62 0 6 924>6 57 03 5205 56 0 2 4308 143 0 021 12WF 53 3800 ~c:= 106 e 8 61 0 9 91,02 4607 '4402 4509 5401 1.140522 12WF50 5002 ~c= 10403 6506 9701 4607 5003 4707 5203 125 0 ~523 lOWF 66 3307 <:=lII-e:> 10608 6307 93 0 0 4807 43 0 8 4707 52 0 3 1210624 lOWF 39 ~<:=- c;»-e:::ro 101 0 3 61 0 2 9708 55·02 50 0 9 5402 4508 133052.5 lOWF 33 3403 =-~ 122 0 5 6007 81 02 52 0 9 56 0 0 5308 46 0 2 13105
- 26 8WF 67 3307 1?~ 10504 59 0 0 98 0 1 5505 5403 55 0 2 44 0 8 131052 17 8WF 35' 4403 ~c:::> 9904 6306 98 0 8 54 0 0 46 0 1 5202 4708 133 0 028 8WF 31 1803 e::::t-= 9903 6405 lQO~.O 51~1 4967 50e8 4902 1-3lo129 Ii 8WF 24 6109 2604 98 0 3 - 6605 96 0 2 50 0 0 50 0 4 51 0 0 49 0 0 1350.530 6WF1505 5402 8 0 8 ,10308 6307 96 0 0 54 0 0 5307 5309 46 0 1 1380731 5WF18 6 .5 16 ~5 ~~ 10108 6303 9607 5105 4507 50 0 3 4907 12704
1 - -
y
+:~

TABLE 11.9 continued (c)
E E E Ecoupon 8
No o Shape coupon couporl stub Estub coluYtmflange web weighted column %
'"
18WFI05.,
8 31()7 3109 31 0 8 30 0 8 103049 16WF 88 30~6, _32 0 9 3103 31 0 8 9804
10 14WF426 ~II=)- 32 0 4 e;:;,= 3303 <;;:;;>l::::lo
11 14WF320 34 0 1 3300 3309 ~e:t ==
12 14WF228 ~I:::::) 33 0 0 =c;:;:;> =~ -c:o.c::::>
13 14WF142 29 0 8 32 09 30 0 5 29 0 1 1040814 14WFlll 31 0 3 2807 30 0 7 31 0 2 980415 14WF 78 2906 30 0 8 2909 32 0 0 930516 14WF 61 2908 2708 2903 ~-
t:>""o::t
1,7 14WF 53 30 0 3 30 0 6 30 0 4 ~- =C=>
18 12WF190 38<t4 3406 3707 3207 1150319 12WF 92 2907 33¢O 3004 3108 950620 12WF 65 31ttl 28 0 8 3006 30 0 0 102 0 021 12WF 53 33~2 30 0 0 3204 33 0 8 9.50922 12WF 50 3308 2906 ,32 0 6 32 0 9 990223 lOWF 66 31 0 8 -30 0 7 3106 30~1 10.500
24 lOWF 39 31 0 3 30~.5 31 0 1 1:::lo;I-t:;:;:> =~
25 lOWF 33 30$5 3004 30 0 5 2902 1040526 8WF 67 30 0 2 30 0 7 30 0 3 -- ~~
27 8WF 35 30 6 2 32 0 2 30 0 6 31~2 - 980228 8WF 31 30&1 " 33&0 3008 30 0 2 -10200
29 8WF 24 c::..c::r 3404 -e::<_ 3202 c:::::lc::;;t
30 6WFl.505 27 0 8 3205 2902 336.5 870231 5WF18 0 5 2909 2906 29 0 8 3204 92 0 0
- ...~ ~ .- __ ••&_~••-..... •• _,of. • ~.~_ r
.. - ~ .... ........:. ,----_::-, .:..._.. _:=- .._~. ,-~-~- ~ --~ .-.. "=......... ~ ... ~-.....-....... ._. -~ - - - "'IIi'::. ~, -
I
+:f\)
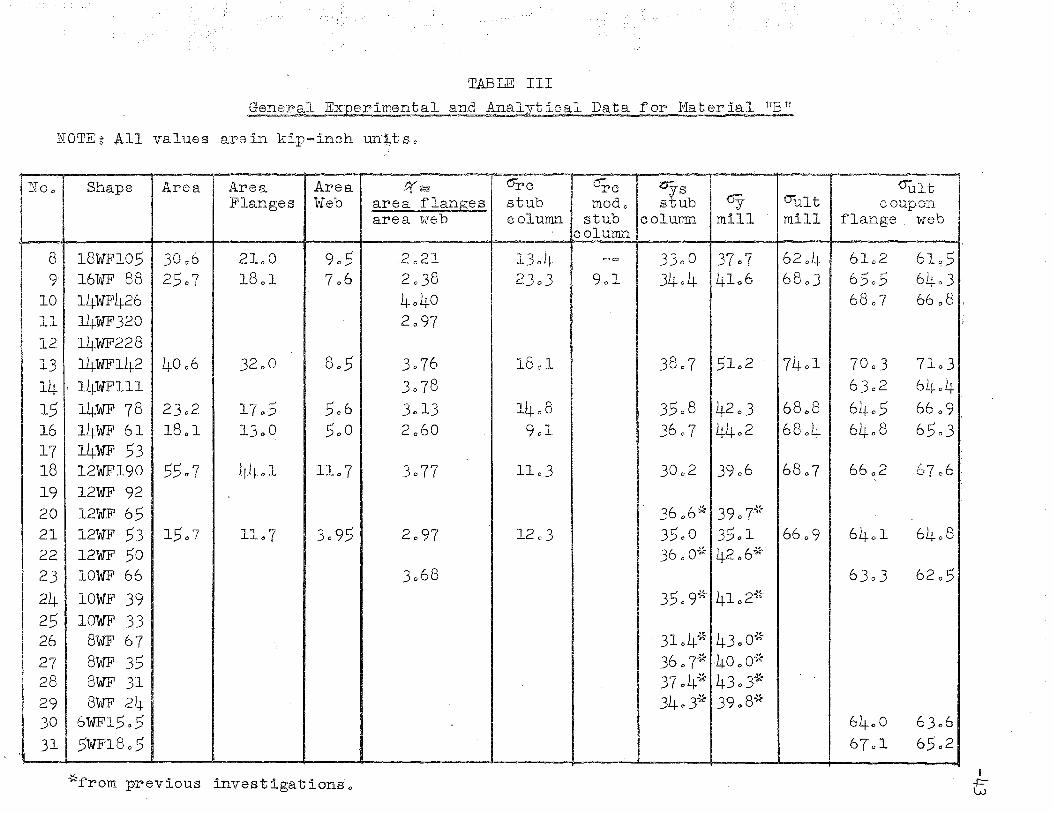
TABLE III
~l. Experimental a~1-Anal~ica.l Data for Mate~rial~
NOTE~ All values arein kip~inch unttso
-l\f 0 0 Shape Area Area Area tt'gs tJrc ore dys ault
Flanges Web area .flanges st::ub modo stub oy o-ult C OUpOl1.
area web C olurrL."'1. stub colurnn mill mill flange webcolumn
8 18WFI05 30 0 6 2100 905 .2021 1304 C-:I= 33 0 0 3707 6204 6102 6105
9' 16WF 88 2507 18 0 1 706 2038 2303 901 34-04 41 0 6 6803 6505 6403 :10 14WF426 4040 6807 66 0 811 14WF320 209712 14WF22813 14WF142 40 0 6 32 0 0 805 3076 18 0 1 3807 .51 0 2 - 7401 70 0 3 71 0 3
14 ' 14WFlll' 3078 6302 640415 14WF 78 2302 170·5 506 3013 14 0 8 35 0 8 4203 68 0 8 6405 660916 14WF 61 1801 13 0 0 5 0 0 2 0 60 901 3607 44 0 2 6804 6408 650317 14WF 5318 12WF190 55t17 4401 1107 3077 1103 3002 3906 68 0 7 6602 ·67 06 '
'--
19 12WF 9220 12WF 65 ! 36 D6'"~i- 39 0 7~~f:
21 12WF 53 1507 1107 3095 . 2097 1203 3500 3501 6609 64 0 1 64 0 822 12WF 50 36 0 o~~ 4206~~
23 lOWF 66 3068 6303 62 0 524 lOWF 39 350 9'"~ 4102~~
25 lOW 3326 8WF 67 3104·8( 43 0 O~~
27 8WF 35 36 0 7~':; ;40 0 O~~
28 8WF 31 4v 43 D3~~37 0 ".tf
29 8W 24 340 3~; 39 0 8~io
30 6WF1505 64<,0 6306
31 5WF1805 6701 6502"
~~.from previous investigations· 0
B
e;-
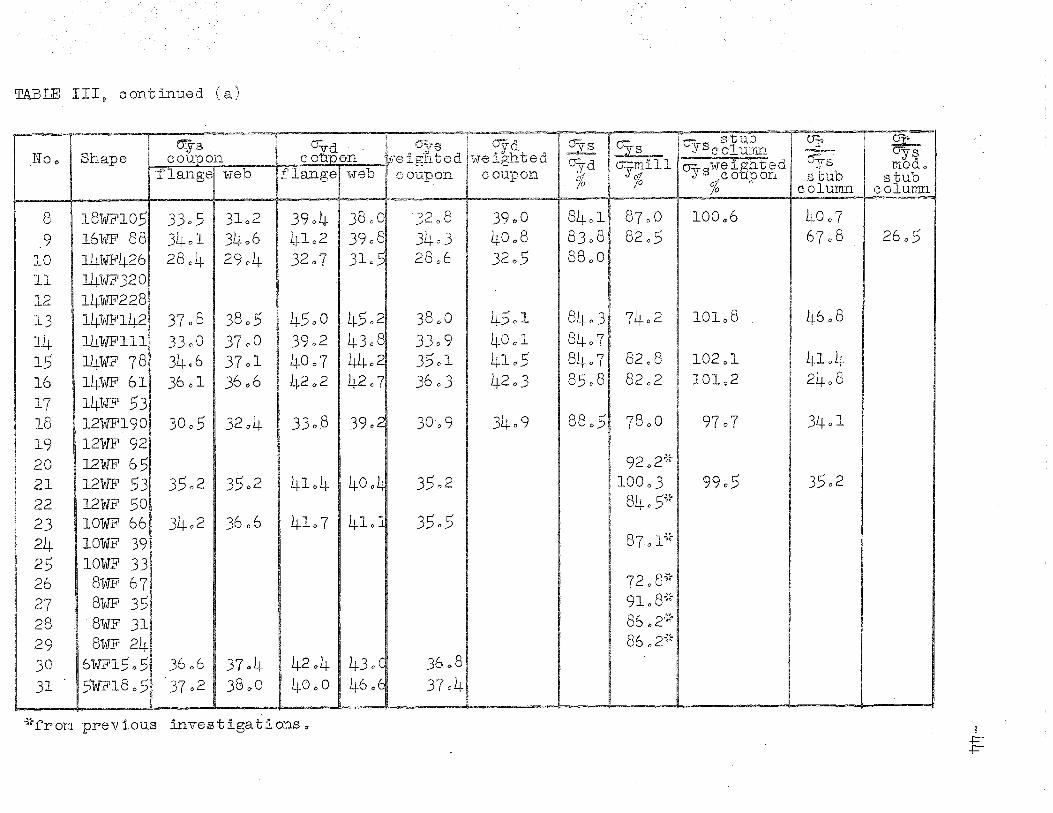
TABLE 11109
continued (a)
2605
35 0 2
3401
46 0 8
40076708
41042408
9905
9707
101 0 8
100 0 6
102 0 1101 0 2
72 0 8~;
91 0 8~;
86 0 2~·;
86 0 2"~i-
87·0 l~~~
92 0 2"~~
100 0 3840 5~~
88 0 51 78 0 0
84 c· 1 1. 87 0 083 08 820588 0 0
8403i 7402840784071 82 0 88508 82 0 2
3409
39 0 0400832 0 5
45 0 1
400141054203
36 0 83704
3009
3502I
35051
38 0 0 I
3309 II
35013603 0
"32 0 8340328 0 6
330.8 13902
42 04 J 43 c C
40 0 0 I 460E
4104140o~
41 0 7 1410]
45 0 0 45 0 2
39 0 2 43 0 84007 44 0 242 0 2 4207
3904 3800·4102 390832 0 7 3105
3~ 06) 37 <J437 0 2 38c,o
3005 I 32 0 4
37 0 8 380533 0 0 37 0 03406 37 0 136 a 1 36 06
3502 3502
3402 36 06
3305 31 0 23401 34et62804 2904
18WFI0516WF 8814WF42614WF32014WF22814WF14214WFlll14WF 7814WF 6114WF 5312WF19012WF 9212WF 6512WF 5312WF 50lOWF 66lOWF 39lOWF 33
8WF 67l\8TtW 358WF 318WF 24
6WF1505·
5WF1805~
~ :r-"""""""'--J...;- ---"<""':------... -
89
101112131415161718192021222324252627
I 28
I2930
I 31
· :n - --, , , . I o=i;>; . UO or en_?yd ~ eJY:s YScolm - ~s
No" I Shape we 19hted (J-yd Io::::mill cr:;; ",l:'lfe1i2fitedI ~.'JTS m.od 0
coupon ~ (Ii y% Y~dcoupon stub I stub/0 0 10 column e olum..n
~~:from previous investigations 0 B
+=+=-
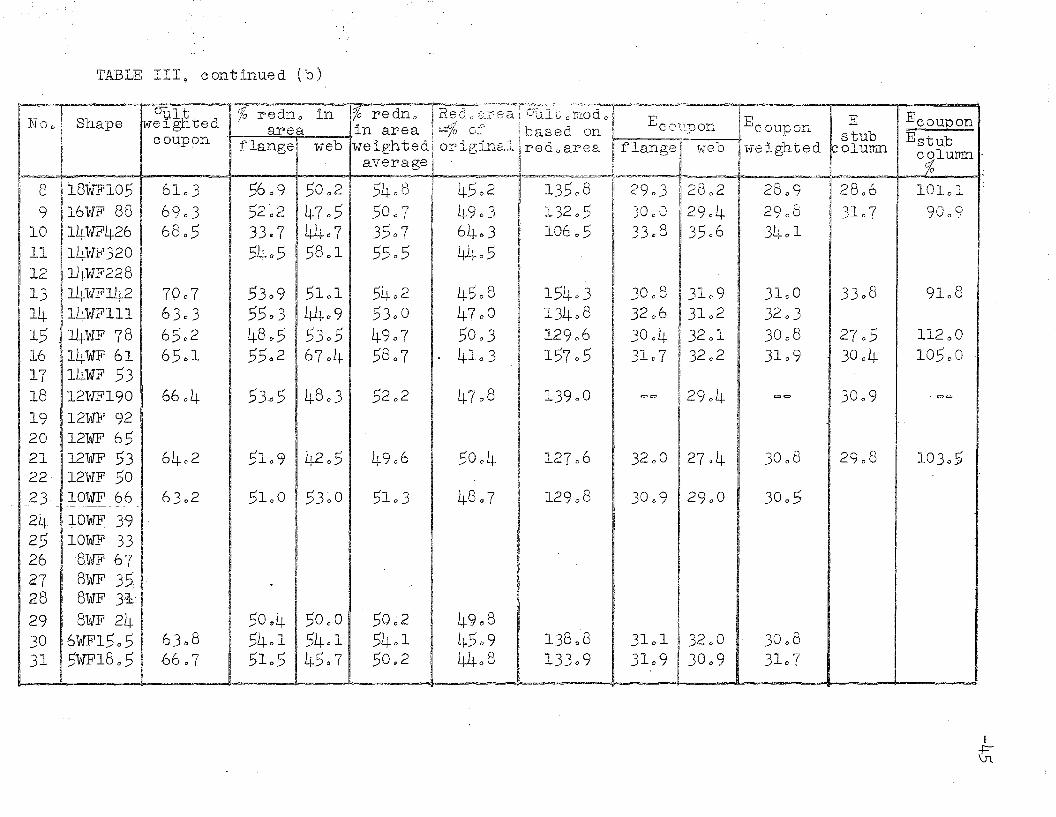
TABLE III.9 continued (b)
- ! OVlt %·~o in i% d D" '~'::=~a::.~';~~~~~,"'-";',~=:' --=. ,.E - I E EcouponNo., I Shape
{) re no ne,Ct 0 cLJ-"'eo. f u...Lv 0 I,.ilod 0 Ewelglited
• -.0" ~ I r< onarea ~n area ~.1o 01' . based 011 '-" J- OOUDon r - EstubuL; stUbcoupon . flange web weighted original red.,area .flangef web v,reighted "'olumn! C%lumnaverage' ~ ! If,
~ ~ '-"w -~~~r ~ r ~ ,-'''...'''''-.......~
8 ,18WFI05 6103 5609 50 02 540~ ~5o: ~3508 ~ ~90~ 12802 2809 2806 101 0 1
9 16WF 88 6903 52 '02 47 05 50" I I 49.,3 .13205 -yO,,\.! 12904 29 0 8 3107 90'091.0 141NF426 6805 33¢7 4407 3507 I 6463 10605 33 0 8. 35e6 34 0 111 14WF320 54ct5 5801 5505 440512 14WF228
- 13 14WF142 7007 5309 5101 5402 4508 15403 3008 3109 31 00 33 0 8 91 0 814 14WFlll 6303 5503 4409 5300 4700 134 0 8 3206 31 0 2 32 0 315 J.4WF 78 6502 4805 5305 4907 50 03 12906 3004 32 0 1 3008 2705 112 0 0
16 14WF 61 6501 5502 6704 58 0 7 ,. 4103 15705 31 0 7 3202 3109 30 0 4 105 O~O
17 14WF 5318 121NF190 6604 53~5 48 0 3 5202 4708 139 0 0 e::t= 2904 ~c:;;:) 3009 ' ~=
19 12WF 92 ..
20 l2W 6521 12WF 53 64 0 2 5109 42 0 5 4906 .50 0 4 12706 32 00 2704 3008 2908 1030522 12WF 5023, 10WF 66 6302 5100 53'~O 5103 48 0 7 129 0 8 30 0 9 29 0 0 30 0 5
"" - --~-- ~-~~~ - - -
24 ~o~ 3925 lOWF 3326 -8,WF 6727 8WF 35. ,,: .-
28 8WF 3·,~:i
29 -S'WF 24 .50c4 50 0 0 50~2 490830 6WF1505 63 0 8 5401 5401 5401 4509 138 0 8 31 0 1 32 0 0 300831 .5WF1805 66c7 51 0 5 4507 50 0 2 44<>8 13309 31 0-9 30 0 9 31 0 7
n
&
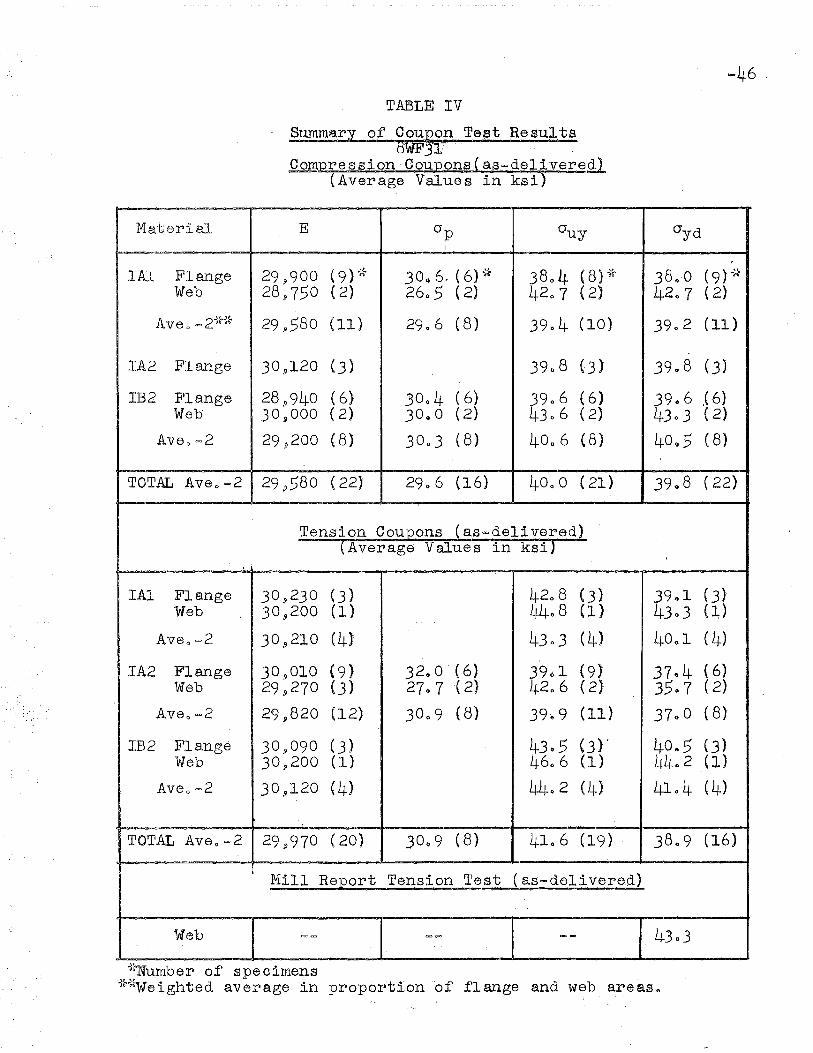
TABLE IV
Summary of CallEOn Test Results.8WF3r'" '- ' .
Compression·Coupon8(as~deliveredl
(Average Values in ksi)
-46 .
Ma'terial E 0p Guy °ydI
IA.l Flange 29 9 900 (9) 1~ 30 4 6r (6)~" 3801+ (8) ~~ 380·0 (9) ~}
Web 28 :1,750 ( 2) 2605 ( 2) 4207 ( 2) 42 il 7 ( 2)
Ave 0 .= 2~~"~~ 29 9 580 (11) 2906 (8) 3904 (10), 3902 (11)
IA2 Flange 30 09 120 (3) 3908 (3) 3ge8 (3)
1132 Flange 28 9 940 ( 6)- 3004 ( 6} 39Q6 ( 6) 3906 ,( 6)Web 30 ~OO.O ( 2) 3000 ( 2) 4306 ( 2) 4303 ( 2)
AV6 o t=2 29~200 ( 8) 30 03 (8) 4006 (8) 40 0 5 ( 8)
TO~AL Ave o t=2 29 .9580 ( 22) 29u 6 (16) 40 0 0 ( 21) ~908 ( 22)
Tension Coupons (as7delivered)(Avera.ge Values in 'kei)
IAI Flange 30 ~230 '(3 ) 4208 (3} 3941 (3)Web 30$200 (1) 4408 (I) 4303 (~ )
Aveo<=>2 30,9210 <4} 4303 (4) 4001 (4)
IA2 Flange 30.9 010 (9) 32 0 0' ( 6) 3901 (9) 37e4 ( 6)Web 29~270 (3) 2707 .( 2} 42 0 6 ( 2) 3507 ( 2)
Aveo~2 29,820 (12) 3009 ( 8) 3909 (11) 3700 ( 8)
1152 Flange 30 9 090 (3) 4305 (3) ~ 40,,5 (3)Web 30p200 (1) 4606 (1) 4402 (l}
Ave o -.2 30 9 120 (4) 4402 (4) 4104 (4)
I
TOTAL Ave Q <=2 29 p970 ( 20) 30Q 9 (8) 4106 (19) . 3809 (16)
i
Mill Report Tension Test (as .... delivere.d):
Web <= c::o "*"""'" ."., -. 4303
*Number of specimens'~~1~eighted average in proportion of ,flange and web areas o
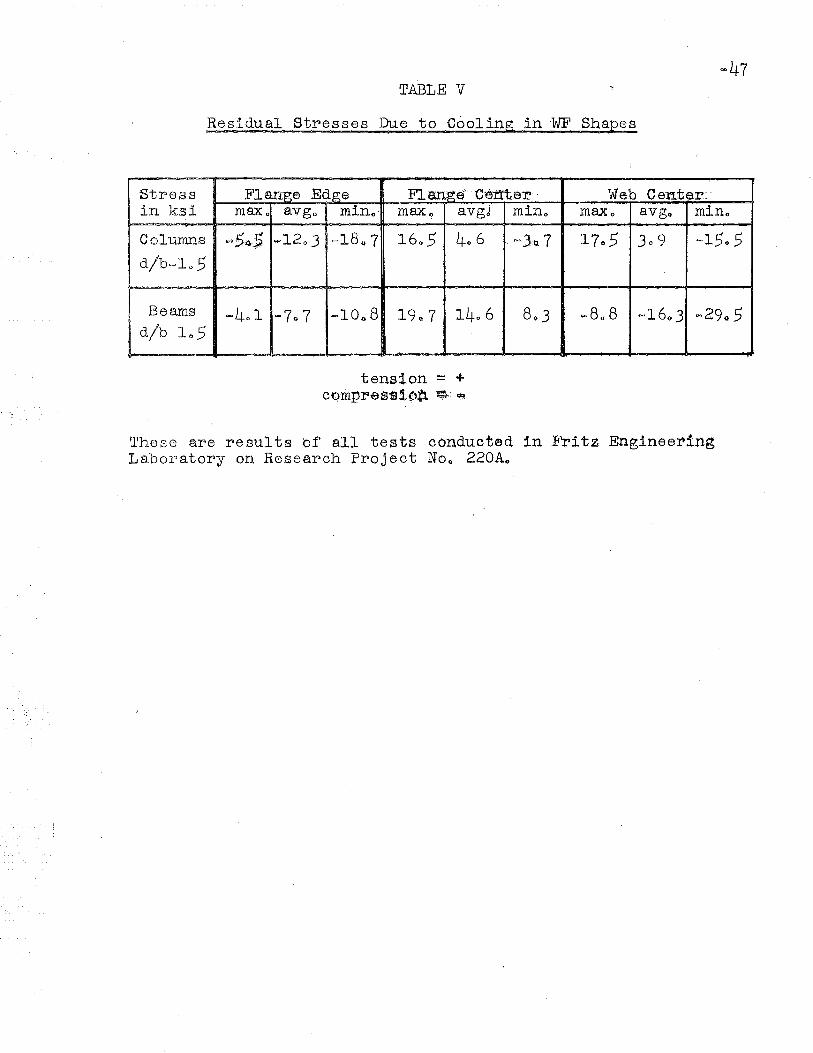
TABLE V
Residual Stresses Due to Cooling in 'WF Shapes
c.47
Stress Fl,ange Eq.ge F1'an~-e"" C:ettt_e~' . Web Ce'nt'e.r~:·
irJ. ksi m8X o avgo mino' max., avg~ mino max.., . avgo mino
Columns ~54$ ~1203 <=18 Q 7 1605 406 ·-.3117 1705 3,09 -1505d/b=lo5
Beams ~401 ~7f) 7 ~lOo8 1907 1406 8 Q 3- ~808 -16~3 ~2905
Id/b 105
tension = +cQmpr-eS'S1ot! ~ ~
These are results of all tests conducted in Fritz EngineeringLaboratory on Research Project No o 220Ao
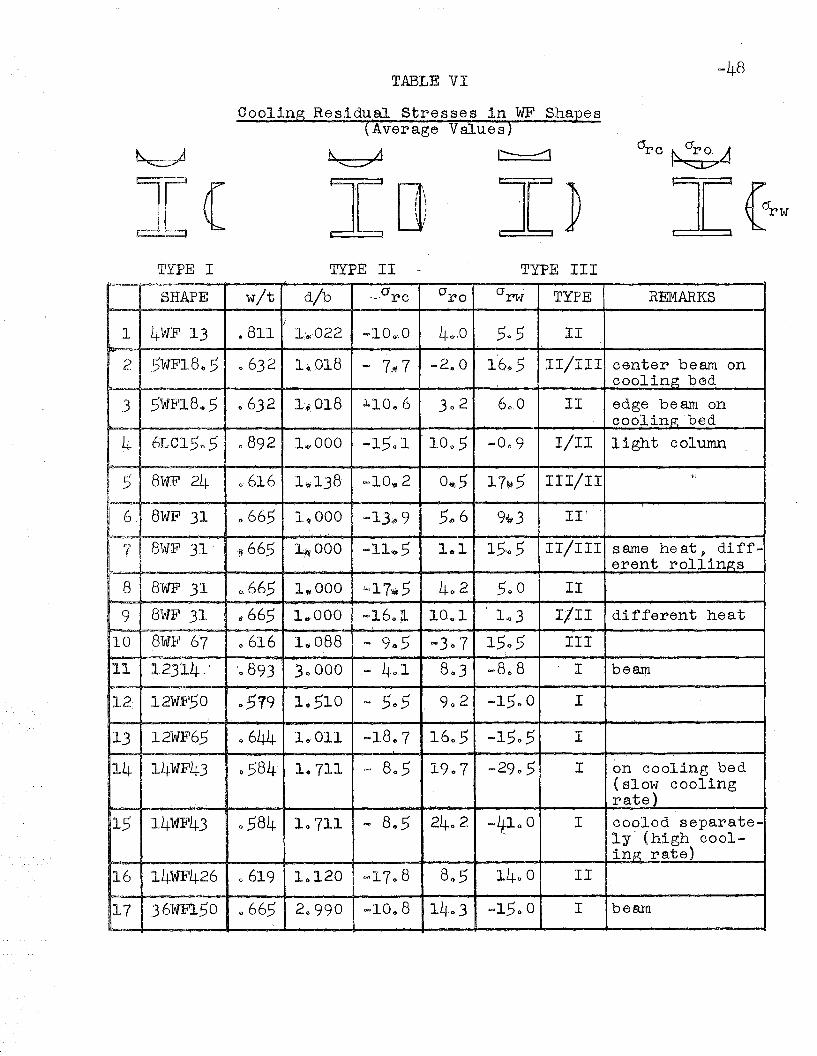
TABLE VI
Cooling Residual stresses in WF Shapes(Average Values)
~ II r:::-:=::1<:::::::::>' '
TYPE I
I[)TYPE II -
I~TYPE III
~
SHAPE wit d/b ---.orc oro a ' TYPE REMARKSrw
i1 4WF 13 .811 1:'or022 -10 0>:0 40.,0 505 II
2 .5·WF18~ 5 0632 1 •. 018 UQ 7r-f 7 ... 2 G O 1'6~5 II/III center beam oncooling bed
.3 5WF18.5 0632 1:.-··'018 ~lO.,6 30,2 60,0 II edge beam. on..','cooling 'bed
1+ 6LC1,5'o5 () 892 litl,OOO -1501 10Q5 -009 I/Il light column
r"i' 8WF 24 0,616 li;l138' --lOlj(t 2 O~.5 17~.5 I!I/II 'H
~
=
6" . 8WF 31 ,0665 l~OOO r=13;~ 9 5~ 6 9~3 II". ",,;,
7 8WF 31' ,~665 ~~OOO -11~5 161 '15~5 II/III same heat, difr-erent rollings
~-~
8 8WJ1" 31 tt665 1.,000 J-l 7~5 402 5Q O II
9 8WF 31 d' 665 l~OOO -16o~ 100,1 l-q 3 rIll different heat
10 8WF 6'7 0616 1~O88 COl) 9.05 C=;O)o7 1505 III
~1 12314. 1 '0893','
40,1 803 -8 0 83~OOO """ I beam
12· 12WF50 tt,519 10510 ~ 505 9 Q 2 -1500 II
13 12WF65 Q 6lW- If)' 011 -1807 ,1605 -1505 I
14 14WF'43 0584' 10711 ..... 805 1ge7 -2905 I on cooling bed(slow cooling
. I.' rate)
15 14WF43 0584 10711 - 8~5 24~2 ~4J.oO I cooled separate-ly' (high cool ....ing rate)
16 14WF426 ? 619 10120 -.17 0 8 8~5 140 0 II
17 36WJi'l50 0665 Zi>990 ,-10tt8 141)3 -.1500 I beam

30 Figures
-49

Plast 10 Range
.. 50
Strain Hardening
0:Y
Unit str'aiP.
Stress-Strain Curve
Figure 1
GRAPHIOAL PEFINTTION OF TERMS
.. 51
IIIIIIIII
: Figure 2II SHOWING POSITION OFI . TENS JON COUPONS CUTI 'FROM FLA:NGE AN"D WEBI OF A ,WF SHAPE.t,J
,,
8u Ga
20 '':
Figure 3
thR ::: 3"
DlMENS~ONS OF TENSION COUPON
(Shaped'to ASTM"Spe6ifioation)
30§(1)
~I
Fttequenoy%
20 Material HAn20 Specimens
10
30 40 45 ksi
c1ys
F~~eqtler.tCY
%
40
30
20
10
o
I
IIIIII- I,
~. I1
... .1~ I f-
III
I I J.
Ma.tell ial HB tl
13 Specimens
ays
25 30 40 45 ksi
30
Frequerf(ly%
20
10
Average33 Specimens
(Jys
4$ !rsi4°30o ~~-+--r--+--,r-"'P't-"""-+-~I~""""""-+-"""""""""''''''''-'''''''''''''''''"'''-'t
:353.309
Figure 4.""
S:mB COLUMN TEST RESULTS
The Static Level Of'·Yield Stre.ss, O'ya
H1stogram~
"-1 53
Frequency%
30
20
10
~cd
~II
II
Material, "An22 Specimens
(J'ys
L~5 ksi3530o --'--i--r-+-r~r-+--.-+---r--+-4r-1-+-r-+-.......-l---,-...4--r-~.......f-.
II
32 0 8
40
30
Material "BtT13 Specime11s
Frequency
% 20
10
()ys
45 ksi403025a --f--T--r--....,--.,...--r-~-.--+__-t--T--+-'-I'-+-"""--+-'"""T--iI--1--r--r-.-.,---,
353406
Frequency'%
30
20
10
§ill~
II
II
Average35 Specimens
o30 40
(Jys
45 ksi
J:i-'igure 5SIMULATED MILL TESTS
(Weighted. Mean Of Flange And Web ,. Coupons)
The Static Level'-Of Yield Stress, aysHistograms
~ 54
Frequenoy%
30
20 .
10
§~fIJ lVIa terial "A If
2Lt Spe c imens
350' -+--1~+-r-+-r-+--+-+-f--t-1--f-O+-+--r-t--r--i--r--t--r cJy d
55 Irs i
30
20
pco~Fj""4II
III Material HEff
14 SpecimensFrequency
% 100yd
55 ksi5035o --l---,r--r-+-t--+-r-+--"---+~Ii-r--+--,r-+--r--r---r--1I-i--t--i-r--l
40: 4541cJ)
10
(>
Frequency'%
30
20Average
38 Specimens
35 50 55 ksi
0yd
Figure 6
MILL TESTS (Web Coupons)The Dynamic Level Of Yield Stress, ~yd
Histograms
20
Fre-quency 10
%,0,
25 30
IIjI
. II
J
~
Material "AH24 Specimens
30
Fre- 20quency
% 10
025 30 35
§~t:,II
I
Material "EtT13 Specimens
(Jyd
55 ksi
Qcd
~I
20 II
Fre-- I Averagequency I 37 Specirnens
% 10 III a'yd
0 II
25 30 35 40 : 45 50 55 ksi
40 0 6
Figure 6
SIMULATED MILL TESTS (Web Coupons)The Dynamic Level Of Yield Stress, ~yd
Histo~ams
'cJYS , with ~ys from weighted coupon average<1ymill
30
20Frequency
%10
065 70 80 85 90 %
Material "AH20 Speoimens
(b) Simulated Mill Tests
20
Frequency 10-%
§Q)
~III Material "Au
22 Specimens
o65 70 75
I
801 8581 0 2
90 95 %
95 %
Material "B"13 Specimens
90
Qct$
~.IIIIIIII
7570
O~--r-~~.......,..-r--r--r-f----,-+-r--+--r-+-~-r-t--r-t--r--t--r-1-.,.---r-'I
65
20
10
F"'requency%
Figure 8
RATIOS OF STATIC YIELD STRESS TO MILL YIELD STRESSHist ograms,

1 "Animens
105 %I1100I
9901
9590
- II1
I Mater.is.- I 18 SpecI-,. I
I- I
I!
- I
II
I I II
'I I I Io
30
40
10
FreqUaleY 20
~ys Stub Column
dys Weighted Coupon
Figure 9
RATIO OF STA~IC YIELD STRESS, STUB COLUMN" TO WEIGHTED COUPONS
Histogram
500
l. OO......,..-.---...----------~------..,--....,..---1o
Strain Rate
Figure 10
~ 58
'mi Cn;:"O=:inchem!.inch~sec onds
<;$ydCURVE SHOWING a AS A FUNCTION OF STRAIN RATE g
ys
USING THE vFREE- RUNNlliGv CROSSHEAD SPEED
(Figo a, of Reference 5)

11
B
FigVI"S 11
4 6
Elongation in Irlohes x·- (205 x 10 4 )
2
T:iTICAL LOAD~DEFORlVJA~,PION CURVE FOR COUPON TEl'JSI01~ TEST
oo T 1 i i .,
10
30 1 I v V·Load
inKips
20
\..rl.....0

50Strain Rate =235 microainch
inch":'se_c 0
Strain Rate = 98 &2oro-inch~cb.-=-~~co
-- --
cTyd :: 3402
OYs == 31~2t
Figura 12,.."
STRESS~STRAIN CURVE FOR FLAT PLATE" TENSION GOUPON,.SEOWING E:FFEC~S OF DIFFEREl\fT~STRAm __ :rJATES
(Jyd == 35 ..4
20
10
40
Stressin 30
Kips
0' ; . i i ~ i ~ J ,..., ( , - i ~ • ... ,.., i i r -\ ,. I i~- iii I I i
o 0 0 005 00010 0 0 015 0 0 020
Str-ain in Inch_es Per In~h:
0'o
FLANGE DISTRIBUTION
~lO ~15
....nt--+--a-----+----+-------i,~~~~ Stress KSI
+10
Compr es s i o~----1
-15 -10 +10r---r---r--+-.---~.. --_..,- .- -+ '---Io--+a:::_-"""",-_-t-_~-=-._.=-~-_"'-_-='~-- --=--=-=:
Stress KSI
+ 5
J'+'""
'WEB DISTR·IBUTIONI I I i' I =r~~~~
~--=-=....~_~ L b......d- ~-J.",.~"""""",,
s:to +10It";
I 00
~(i)
8 ,J.::.'l r'b •. '"
-~-T~O
--(r------<D--- T~1e e --T-=2
~c ~o ~w~--_.-.....-=--------+---'-""'"""'-----l~-~.;..----I
~1309 506 903~1105 10 1 1505~12 0 .5 402 ' 500
-_._--~-- "'-._-_._---.~~,_.-- "", ,... ,~._~.'.
AVERAGE RESIDUAL STRESSES (I~SI)....._------------- '-~~_----.-._--....
Figure 13(a),-
RESIDUAL STRESS DISTRIBUTIONS (AS DELIVERED)( Three Speot,rnens)
~ 62
p
p
F1LA.NC;}EI) ISTR113U"TION
WEBDISTRIBUTION
~l: Residual StressIn WEi Shal)e
2~ Partially Yielded Cross=SectionG:) Nomenolature
Figure 13( b)
RESIDUAli STliEtSSES ~ IJIS5rRIBU'TION AN-D NO:MEN(1LATURE
S eclC
~ -0",ro
mod1:ried'
~ ~,pseudo'"'proport'ional limit
j
----pr op6~t i ona.l'i :tm!t
" Strain
.. 63
,.~-----
'11,' ,..LL.f- '.~ '.
MODIFICATION OF STUB COLUMN" STRESS-STRAIN CURVEWITS HIGH LOCAL<R~$IOllAJ:,~~l¥S~~~ :"'~ FWQ-~~.
,1
" ;
q 64
20
F'requenoy; % ],0
11atez:.ial 'At19 Speoimens
_<1p == 0"1'0
Cfr
Materia.l IAU.1.9 Specimens
f·.·.
=: 0: 'cd rOmod
30 kat
30
20
20101
100$ ~'~
j
- IIIIIIII- II 6rI r-- -, In''II
- IIII ,.I r:
II; , I' I
o
oo
30
10
Fr equenc'y% 20
30Frequenoy
%20
10
o "l."
a
30l:Te-quenoy
%20
'JI
10· .1
d' 1~1308~~
\:'
IItII"
I
20
Average26 Speoimen$
Average26 Speoimens
crr modoO--t--L-~-..a.-..........---...........-.a.,.-""----""---t
'·-0 10 20 ksi1101
Fig~e l~,HISTOGRAMS OF'THE MAXIMtrrM' RESIDUAL STRESS
nJ- 'THE FLANGES OF STUB COLU:MN, arc
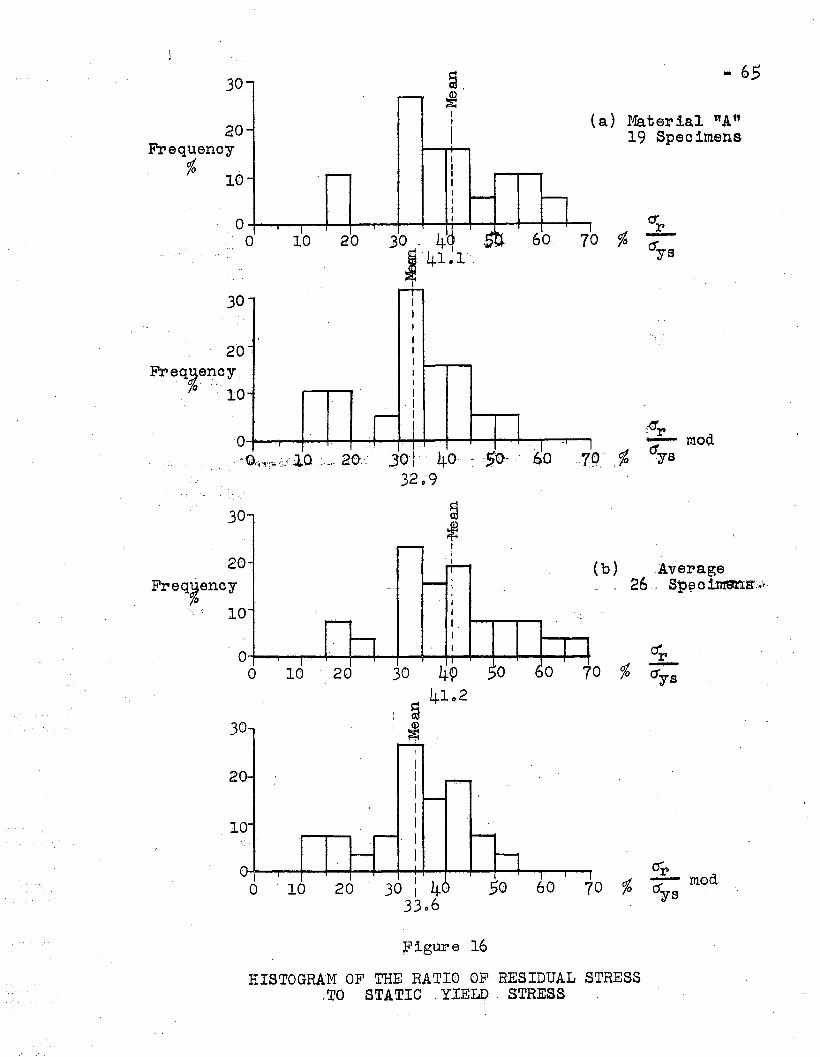
30
20Frequenoy
%10
s.~
II
t
.. 65
(a) Material "AU19 Specim.ens
10 20O~--.-,.......---I---+-...-.....-......-...............---t---t----t-~--...o
0'~O,~,.t'"j!..'~~.<,+O.:-.,.ao :?ol 40- ~. ·~e- - 60
32.9
(b) --Average26.,,, S)~o,:Lme'n.lfW~·i,
Lr"rr:' 70 d! - mod,vO 60 70 C'fys
m~II.. I
30 4~
4102;
o 10 20 30: 40·.330'.6
O~..."..--r-~-""'+--..4~""'-*-""""'''''''--+-''''''''''''''''--'''---I
o
30
20
10
30
20Fre,qyenoy
/&10
'igure"16
HISTOGRAM OF THE RATI0,OF'RESIDUAL' STRESS:':-rTO STATIC. YIELD,,! STRESS
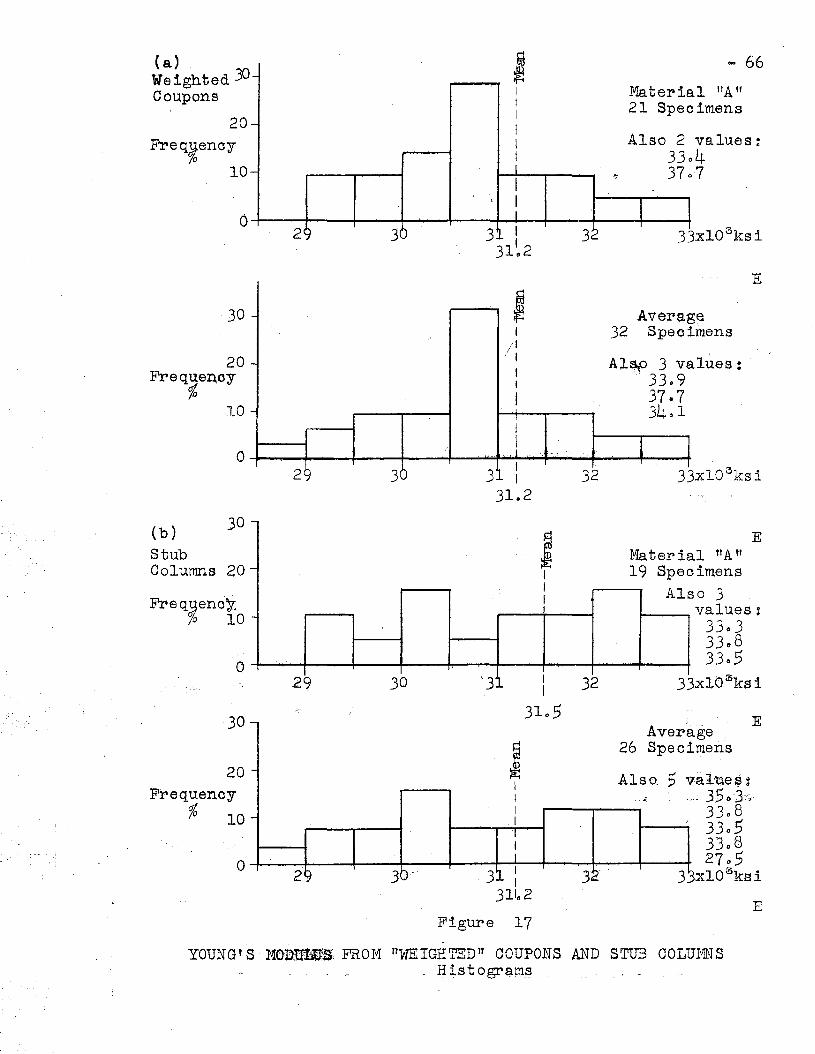
., 66
values:47
al llA n
almens
g.- ~
I Materi1 21 SpaI
- I! I Also 2
I 330- I 37,0
I-I';
:
II.
I II
29 30 3L II t
3o
(a)Weighted 30Coupons
20
Ii'I'eq~enOY.'
10
E
alues:
g~
imens
I31.2
~- Avera,J I 32 Spec
"
/1/ I
Al~ 3 V-II . 33.9I 3707
- 34 0 1'I
II I I-- 1_..:., ",( . I I
29 30 '31 32a
.30
20Frequency
%10
E
E
E
al UA Tf
oimensso.:' 3values:
3303330833o~
33xl0 3 ksi32II
31 0 5
30
-
s:1
~ Materi-
I 19 Spe,I I AlI
f-/'
Average, .
.~ ::s:~:O:::::~:I -. .... ,'., :,;..:,~" 35 G·3·r~>I .---.----... 33 b 8: ------..' 3305I 3368
o-f-----t-~__+---+__-_+_-__f_~I-__+__~~-___t"-..__...r 27 0 52'1 3~'" 3: 3" . 3 xI0 3 ksi
3110 2
Figure 17
o
30 -
30(b)
StubColumns 20
Freqgeno'~/0 10
'20 Frequency'
ob '7°' '10 -
...
YOUNG'S' MC}DIffi1a~ FROM uVlEIGHTE'D1J COUPONS AND STUB COLUMf.\fS' .. -, - ,T; ,Uistogr~ro~
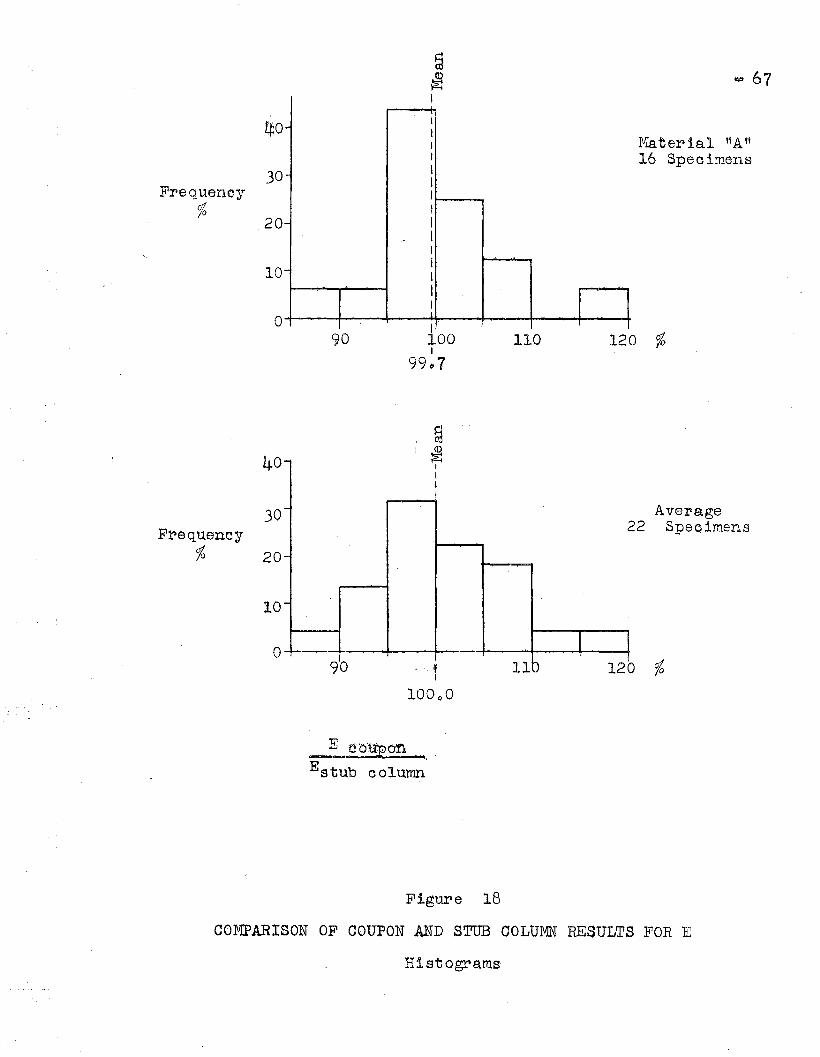
Material "Aft16 Specimens
120 %110I100I
990790
I.....III
- IIII
- I" I
II- II III ,o
30
20
10
Frequency%
..
Average22 Speoimens
o %
§ ..
i~
9
- III
-
-
-,) I
0 ". '" ;f lIb 12'o
30
40
'10
Frequenc;r% 20
.Eab·~ .,Es tub C olu~<·
Figure 18
COMPARISON OF COUPON AND STVB COLUMN RESULTS FOR E
Histograms'
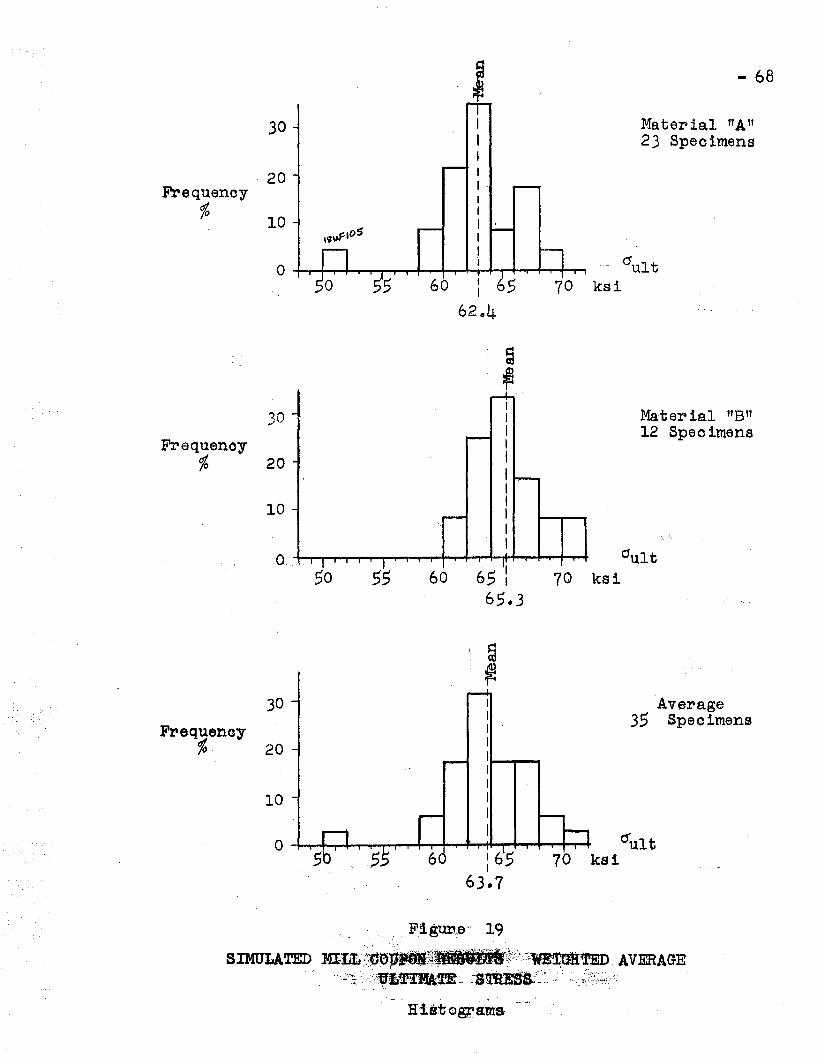
I - 68
30 Material "An23 Spec'1mens
·20Frequency
% 10~10$'\'1
0 '.- 'O'ult60 I 65 70 ksiI
62.4
;~I'
Material "B"30 II 12 Specimens
Frequenoy ,% 20 I
II
10 IIII
CultQ",.:"50 60 65 l 70 ks1
65.3
~
~30 I 'Average
",
I 35 SpecimensFrequenoy I
~ 20 IIII
10 III
o'ult0165 kstI
63.7
, F'!gtm,~e ,. 19
S~~. .~A~
H"iEftograD.
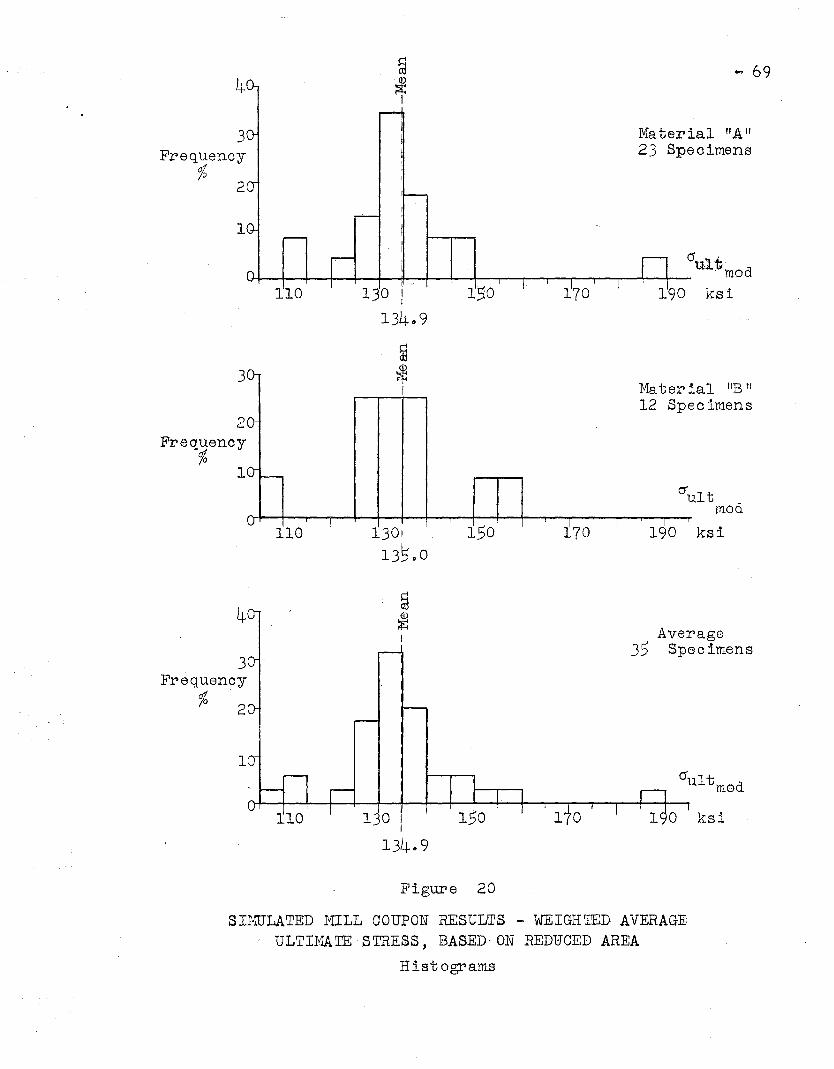
4
3Frequency
%2
1
130
- 69
Material "Au23 Speoimens
O'Ult,o ,'mod
190 ksi
~al tfB.tt
ecimens
ultmod
190 ksi170150110
0- , Mater •12 Sp
0
0- I.---
cr
V I I T T I
3
2Frequency
%1
4
3Frequenoy
% .2
~'~
I Average35 Specimens
10°U1tmod
130 I ksfI
13409
Figure 20
SI.MrJLATED MILL COUPON RESULTS *-" WEIGHrrED AVERAGE,. ULTIMATE", STRESS, BASED· ON REDUCED AREA
Hist.ograms
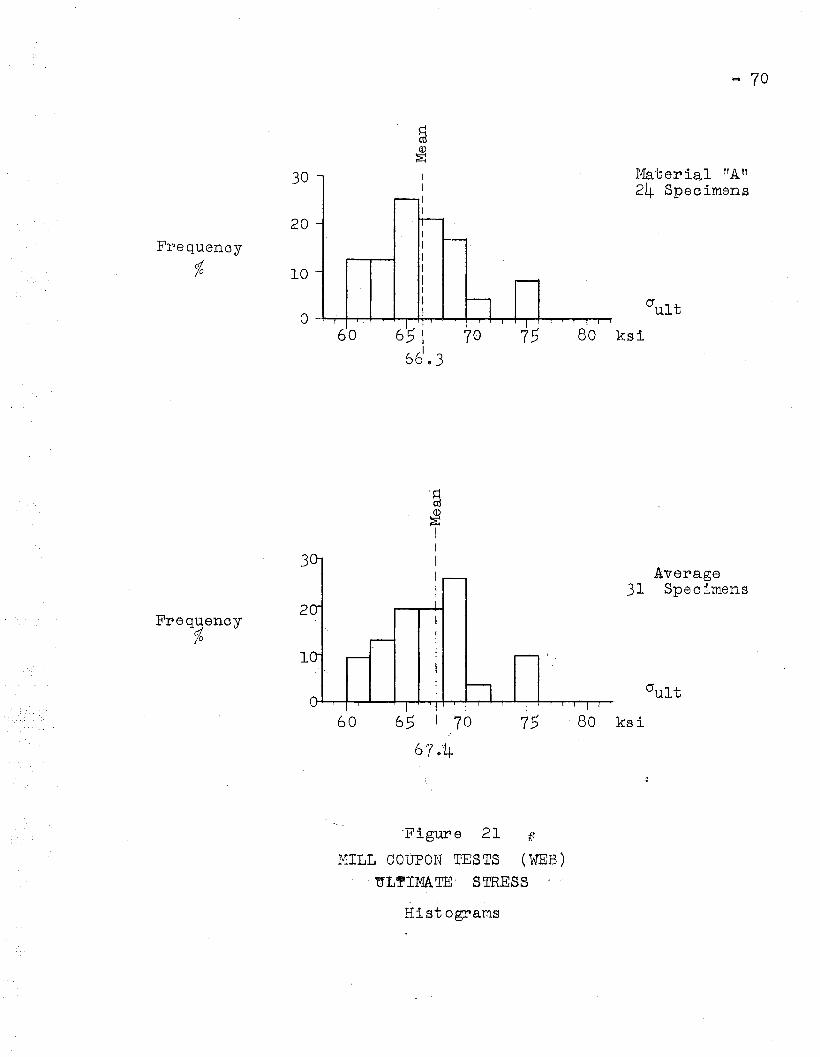
.. 70
~Q)
~
30
20
Frequenoy
% 10
a60 65l 70
661
.3
Material "An24 Specimens
75 80 ksi
Frequency%
3
2
1
60
'~
en~IIIII
Average31 Specimens
75 . 80 ksi
"Figure 21 f.
MILL COUPON TESTS (WEB)~ . tJLIf'IMATE' STRESS
. - ,
Histograms

C1ult
ksi
Mat er 1a..1 "B tr
13"'Spec imens
~ 71
:Ma.ter ial lTA tl
24 Specimens
7570
;fInIII
60 67II
55
: ., 563 o'~5
~
~IIIIIIIIII
o----f--!~'t""_"'"'I_..,......,..~-,.--+--r-~t-t-~.....--l--.--40-....-....--.....---.-....,.........- CTult
80 ksi
30
20
10
40
30 -i
10
20
Frequency%
Freqtlency%
Frequency%
30 37Average
Specimens
10
757060 : 65
64010
Figure 22
55o-J--r-+-T-+-....,....-+----T-t---,...-+--r-.....-..,.~r_+_~~__...._.t,o_,_..,.....,...__,.._.~ 0"ul t
80 ksi
SIMULATED MILL COUPON TESTS (WEB)ULTIMATE STRESS'
.Histograms
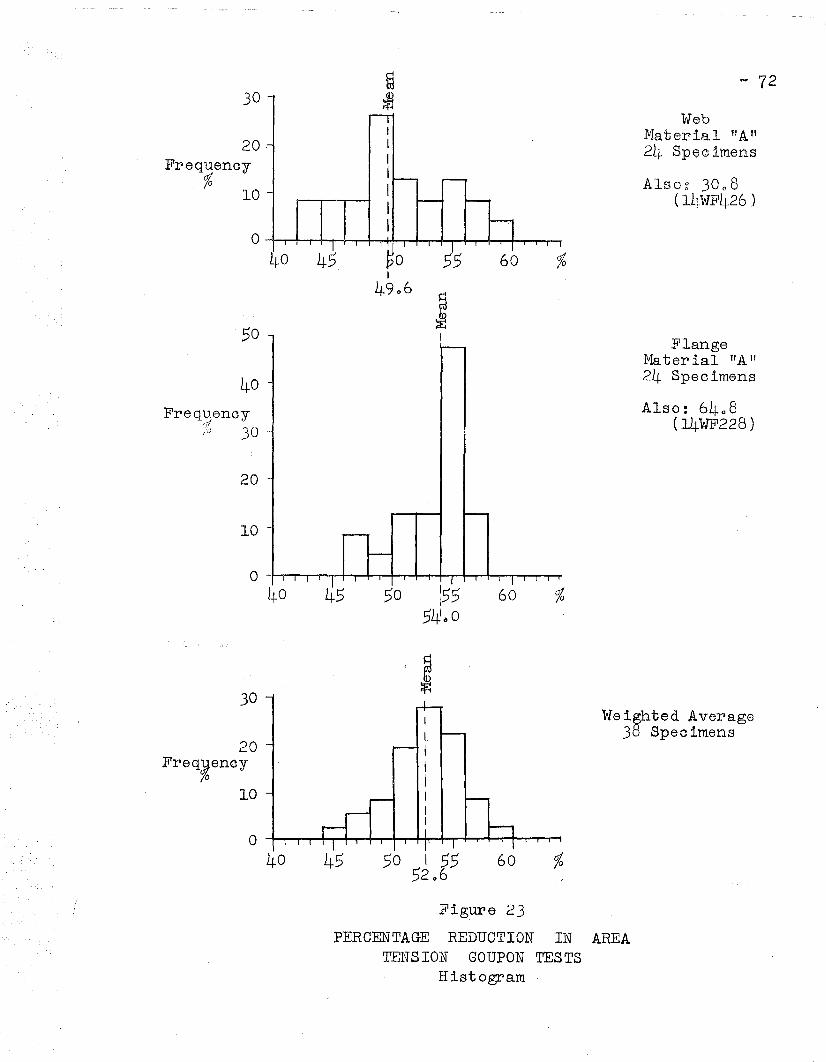
- 7230
20·Frequency
1010
40Frequency
~rb 30
40 45 55
JI
60
WebMaterial "A n24 Specimens
Alsog 30 0 8. (14WF426)
FlangeMaterial "Alf24 Specimens
Also: 6408C14WF228)
20
10
30
20Freq~ency
10
Weighted Average38 Specimens
6045O--J--.p-.......-.............................-4~Hr-+-T--t--r-...,....,.....,.-,~,......
40
/Figure 23
PERCEN.TAGE REDUCTION IN AREATENSION GOUPON TESTS
Histogram

3
2
Stressksi
1
30
20Stressksi
10
o
o
o
e;J 73
C1rc
Average from33 stub column
and. 35 weightedtension ooupon tests
Strain in/ina
Typical Stress~Strain Curve For Stub ColumnAverage From Test Results
=: 200.0
Strain in/ina
Suggested Typical Stress~Strain Curve. For WF Stub Column Test
Figure 24