Embed Size (px)
Citation preview
1
Paper Prepared for the UAPS conference,
Arusha, 10-14 December 2007
Maternal Mortality in South Africa in 2001:
From Census to Epidemiology
Michel Garenne (1)
Robert McCaa (2)
Kourtoum Nacro (3)
(1) IRD and Institut Pasteur, Paris, France
(2) MPC, University of Minnesota, USA, and Director of the IPUMS project
(3) UNFPA, New York, USA
Updated
September 28, 2007
Abstract: 311 words
Paper: 6088 words
Tables: 4
Figures 2
Email addresses:

2
Abstract
The 2001 census of South Africa included a question on deaths in the previous 12
months in the household, and for these deaths two questions on external causes and maternal
mortality. The census offers therefore a range of opportunities to assess levels and
differentials in maternal mortality, in a country severely affected by high death rates from
HIV/AIDS and from external causes. The level of the Maternal Mortality Ratio in 2001,
MMR = 646 per 100,000 live births, appeared much higher than anticipated, and much higher
than previous estimates dating from pre-HIV/AIDS times. This high level occurred despite a
relatively low proportion of maternal deaths (6.4%) among deaths of women aged 15-49
years, and was due to the outstandingly high level of adult mortality, some 4.7 times higher
than expected from mortality below age 15 or above age 50. The main reasons for these
outstanding levels were HIV/AIDS and external causes of deaths. Levels were found to be
consistent with other findings in the Cape Town area, and with the Agincourt DSS. The
gradients of differentials in MMR were considerable: 1 to 9.1 for population groups (race), 1
to 3.1 for provinces, and 1 to 2.1 for levels of education. Relationship with income and wealth
were complex, with highest values for middle income and middle wealth index. The effect of
urbanization was small, and reversed in a multivariate analysis. Higher risks in some of the
provinces were not necessarily associated with lower income or lower education, but
correlated with prevalence of HIV/AIDS. These results have many implications for public
health: maternal mortality seems to have increased dramatically over the past 10 years, most
likely because of HIV/AIDS and tuberculosis; indirect causes of maternal mortality appear
much more important than direct obstetric causes; the MMR appears not longer a reliable
measure of the quality of obstetric care in this type of situation.
Keywords: Maternal mortality, Differentials, Risk factors, HIV/AIDS, Indirect causes,
External causes, South Africa

3
Introduction
Maternal mortality is an important element of the health transition, and in developed
countries the decline in maternal mortality indicators has been dramatic during the 20th
century. Beyond the number of maternal deaths, which remains small compared to the number
of deaths for all causes combined, maternal mortality bears a strong symbolic value, since
these deaths occur “while giving birth”. Interest in maternal mortality in developing countries
has been gaining momentum in the 1980’s with the “Safe Motherhood Initiative”, and more
recently with the “Millennium Development Goals” (MDG) and the IMMPACT project
[Rosenfield and Maine, 1985; Rosenfield et al., 2006; United Nations, 2000; Graham, 2002].
A recent collection of articles, published in the Lancet in 2006, summarizes the demographic
and public health debates around maternal mortality [Ronsmans et al. 2006].
A recurrent issue with assessing maternal mortality levels in developing countries has
been the source of data, especially in situations where vital registration is deficient, which is
the case for most of Africa [Boerma, 1988]. Many attempts were tried over the past 50 years
to overcome this lack of information. For instance, some of the demographic sample surveys
conducted by INSEE in the 1950’s and 1960’s in Africa included a question on maternal
deaths among other questions on deaths in past 12 months. This was the case at the survey
conducted in Burkina Faso in 1960-1961 (Haute Volta at that time), and again later in the
same country at the 1991 demographic survey. These surveys were often based on fairly large
samples (50,000 to 100,000 households), and produced some reliable estimates. With the
WFS and DHS programs in vogue since the mid 1970’s, the focus became on smaller surveys,
based on 5,000 to 10,000 households, and a new technique was developed for measuring
maternal mortality: the “sisterhood method”, with its two variants, the indirect and the direct
estimates [Graham et al., 1989; Rutenberg and Sullivan, 1991]. The sisterhood method
measures maternal deaths among the sisters of the respondent, which can therefore increase
significantly the number of cases in populations with high fertility. However, if the sample
size is small, the number of cases recorded this way is still small, with wide confidence
intervals. These are even wider when the indirect estimation is used [Garenne & Friedberg,
1997]. Furthermore, the sisterhood methods produce estimates for several years before the
survey, with imprecise dating in case of the indirect method. When applied with care, both

4
types of retrospective data provide similar estimates, as shown in a case study in Bangladesh
(Hill et al., 2006).
An alternative is to use a full scale population census, and to investigate maternal
deaths in the past 12 months (or 2 to 3 years), to get rid at the same time of the issue of
sample size and of the issue of time reference. Only a few examples are available in Africa:
Benin (1992), Madagascar (1993), and Zimbabwe (1992), which have already been reviewed
[Stanton et al. 2001], and the South Africa 2001 census, which is investigated in this study.
Note that The United Nations “Principles and Recommendations for Population and
Housing Censuses, Revision 2” recognize the importance of using censuses to measure
maternal mortality for countries that lack complete and reliable civil registration and vital
statistics systems, but also note that census information in general is a poor substitute for
complete and reliable vital registration data. In addition, they present cautionary statements
about the collection of this information in a census, which thus implies the need for countries
to build and maintain complete and reliable vital registration systems. They recommend two
follow-up questions in cases where the household being interviewed reports that there was a
death during the past 12 months. After ascertaining the name, age and sex of the deceased
person and date of death, the two additional questions concerning cause of death should be
asked as follows: 1) Was the death due to an accident, violence, homicide or suicide? 2) If the
deceased was a woman aged 15 to 49, did the death occur while she was pregnant or during
childbirth or during the six weeks after the end of pregnancy? [United Nations, 2006].
In addition to demographic information, many studies have tried to capture maternal
mortality from hospital based studies. Of course, these studies have numerous biases, and they
may either over-estimate maternal mortality when hospital function well and attract most of
the complicated obstetric cases, or under-estimate maternal mortality, when the population
has low access to the health infrastructure.
The aim of this paper is to investigate the results of the 2001 census of South Africa,
which included the recommended questions on maternal deaths. In addition to the estimation
of maternal mortality levels and age patterns, the paper also shows the ability of the census to
provide information on maternal mortality differentials, and the opportunity for multivariate
analysis, analogous to a case / control study, to investigate epidemiological risk factors.

5
Definition of maternal deaths
The World Health Organization (WHO) definition has been stable over the past 30
years: “A maternal death is the death of a woman while pregnant or within 42 days of
termination of pregnancy, irrespective of the duration and the site of the pregnancy, from any
cause related to- or aggravated by- the pregnancy or its management, but not from accidental
or incidental causes” (ICD-10, volume 2, page 134). The WHO definition also distinguishes
between the “direct obstetric” causes, resulting from natural obstetric complications or from
obstetric interventions, and the “indirect obstetric” causes, resulting from previously existing
diseases, or diseases that developed during pregnancy independently from obstetric causes.
The ICD-10 makes a special provision for HIV/AIDS and obstetrical tetanus (normally coded
among the infectious and parasitic diseases), and recommends to include them among the
maternal deaths. In theory, HIV/AIDS should be included in the “indirect cause” category,
and the obstetrical tetanus in the “direct cause” category, but this is not explicit in the ICD-10.
The ICD-10 manual recommends to publish separately direct causes and indirect causes,
however this is rarely done in practice in demographic surveys, and more generally in
developing countries, except when the source of data are medical certificates or special
hospital investigations. The WHO definition therefore includes deaths that result from
communicable and non-communicable diseases that could have occurred even if the woman
had not been pregnant or delivering. However, the WHO definition does exclude external
causes which are not related to pregnancy or delivery.
Khlat & Ronsmans [2000] have shown how difficult it is to assess an attributable risk
of maternal mortality from the WHO definition. In fact, during the maternal risk period (40
weeks of pregnancy and 6 weeks post partum), women appear at the same time at increased
risk of death from the direct causes, and at lower risk of death from indirect causes for a
variety of reasons. A simple way of investigating the possible biases is to compare the
proportion of deaths due to maternal causes to the proportion of time spent by women in the
maternal risk period between age 15 and 49, which depends primarily on the Total Fertility
Rate (TFR). If the first proportion is much higher than the second, then most likely the direct
causes are overwhelming; however, in the case where both are equivalent, positive and
negative effects of pregnancy are compensating. We will see such a case when analyzing the
2001 census of South Africa.
6
Data and Methods
The IPUMS sample
The 2001 census conducted in South Africa included a question on deaths that
occurred in the past 12 months in the household, that is between October 10, 2000 and
October 10, 2001. Deaths were recorded by month and year and by age and sex. Furthermore,
for each death in the past 12 months, two questions on cause of death were asked: whether it
was due to accident or violence, or whether it was a maternal death. Maternal deaths fitted the
World Health Organization (WHO) definition, that is any death of a woman in their
reproductive ages (in this case under age 50), either pregnant, delivering, or within six weeks
after delivery.
The census also included a number of questions which could be used for the analysis
of maternal mortality differentials: area of residence (urban/rural), province of residence, level
of education, citizenship (nativity), population group (race), ethnicity (defined by the
language spoken at home), and religion. In addition, several characteristics of the dwelling
unit were also available in the census form (type of living quarters and housing unit, number
of rooms, tenure status, source of water, toilet facility, energy or fuel used mainly for cooking,
heating, and lighting), as well as a number of household goods (radio, refrigerator, television,
telephone, computer, cell-phone). The questionnaire also included an item on annual gross
income for each household member, coded in 12 categories, presented as multiples of 4800
ZAR per year, coefficients being 2n, with n= 1 to 12.
A 10% sample of the census was made available to the IPUMS project by Stats-SA,
the statistical institute of South Africa, and this dataset was the basis for the analysis. The
sample included most questions on the questionnaire. However, in the IPUMS file, the
question on survival of mother and father was not included, and furthermore the row number
of the surviving mother was not included, which did not permit a direct match of infants to
their mother.
Calculation of maternal mortality levels
The three classic indexes of maternal mortality are used in this paper. The maternal
mortality ratio (MMR) was calculated as the number of maternal deaths to the number of
7
births in the past 12 months. The number of births in the past 12 months was calculated as the
number of infants surviving at time of census backward projected in past year. The probability
of surviving was calculated directly from the data (1L0/S0), by calculating the infant death rate
(deaths age 0 in past 12 months divided by the infant population at time of census), and
applying a separation coefficient (1a0) of 0.315, derived from model life tables. This
calculation was repeated for each group in the differential analysis.
The maternal death rate (MDR) was calculated as the number of maternal deaths
divided by the female population age 15-49 at time of census.
The maternal mortality quotient (MMQ), or lifetime risk of dying from maternal
causes, was calculated by reconstructing the life table for maternal mortality, by single year of
age, from age 12 to age 51 years. Yearly quotients were calculated as the ratio of maternal
deaths to the female population at risk, that is the surviving women plus the deaths in the past
12 months.
Socio-economic factors
Most socio-economic variables were used as recoded in the IPUMS sample, which
was equivalent to the coding on the census sheet in most cases. Income was given as the mean
of the class (for instance 2400 ZAR for the class ranging from 1 to 4800 ZAR, etc.), with the
exception of the last open class (2,457,601+ ZAR) coded as the bottom value of the class.
The differential analysis presents maternal mortality ratios by socioeconomic
characteristics taken at the household level, since details at the level of individual maternal
deaths were not available. For some factors the definition of socio-economic characteristics
was straightforward, since it applied to all members of the household (place of residence,
province). For other characteristics, the corresponding value for the head of household was
considered (race, ethnicity, nativity). For level of education, we took the highest level in the
household, whoever it was (other codings were tried: level of education of the household
head, level of education of women in their reproductive ages, but the highest level in
household gave the highest correlations). For income, we cumulated all incomes in the
household, and divided by the number of household members, to obtain an income per capita.
We also defined a “wealth index” on the model used by other authors (Garenne &
Hohmann, 2003). This index is the sum of 10 dummy variables indicating modern goods in
the household or its modern status. The variables selected were: ownership of dwelling, piped
8
water, electricity, sewage, toilets in dwelling, telephone, cell-phone, television, refrigerator,
and radio.
Matching cases and controls
In the multivariate analysis, cases (maternal deaths) were matched with controls
(women who delivered and survived). Controls were defined as women living in the
households who had a surviving infant at time of census. The identification of the controls
was done by selecting women most likely to be mothers of the infants in the census file. In
more than half of the cases, this was easy since only one woman aged 12-50 years was living
in the household. In other cases, we took the woman aged 12-50 preceding the child in the list
of household members. The choice of the woman selected for controls in a household did not
matter for the multivariate analysis, since only the characteristics of the household were
considered. This choice could have been crucial for the estimation of the effect of age at
delivery, and was therefore ignored for the case control study. However, we present below an
estimation of age effects based on an independent estimation of the age pattern of fertility
derived from DHS data (see below).
Results
Death registration
The IPUMS 10% sample of the 2001 census of South Africa included 36,267 deaths
out of a total of 3,725,655 persons enumerated, and 76,292 surviving infants, corresponding
to 78,702 births in the past 12 months, with a survival probability of newborns from birth to
the census date equal to 0.970. This corresponds to a crude birth rate (CBR) of 21.1 per 1000
and a crude death rate (CDR) of 9.7 per 1000, which are values consistent with other
estimates for this period in South Africa. The distribution of deaths by month and year was
quite regular, with an average of 2790 deaths per month, and a marked seasonality with
excess mortality from June to September. However, the month of October was probably over-
estimated, since the 21 days of year 2000 included 2641 deaths and the 10 days of year 2001
included 2137 deaths, whereas one would have expected 3133 deaths in total from the number
9
recorded in the previous and next two months. This suggests that mortality in the previous 12
months could have been overestimated by some 4.7%, because of including too many deaths
in October 2000 (instead of only from October 10 to October 31) and in October 2001
(instead of only from October 1 to October 10). We did not attempt to correct for this minor
bias in the final estimates.
Maternal mortality level
The IPUMS sample of the 2001 census of South Africa included 508 maternal deaths,
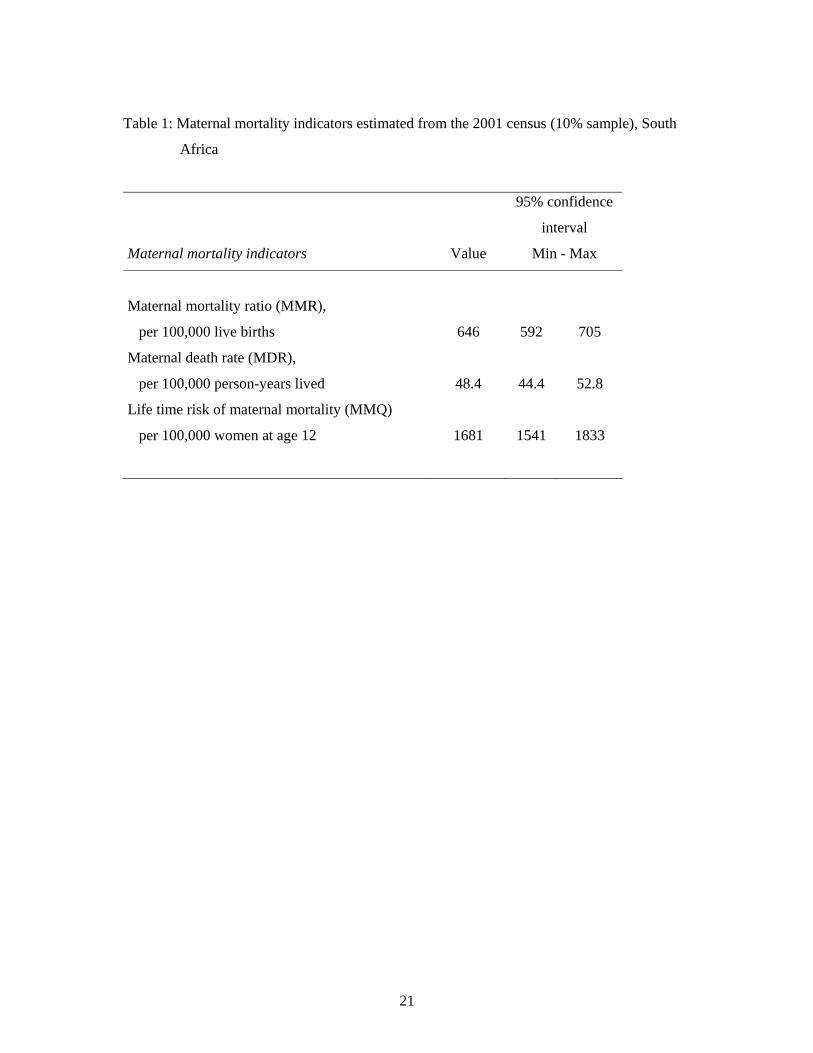
out of 1,048,824 women aged 15-49 years. Straightforward calculations give a maternal
mortality ratio (MMR) of 646 per 100,000 live births, a maternal death rate (MDR) of 48.4
per 100,000 women, and a life-time risk (MMQ) of 1681 per 100,000 (Table 1). Matching the
MMR and MMQ corresponds to a total fertility rate (TFR) of 2.62, which is basically equal to
the TFR expected from the trends in TFR at the two previous DHS surveys (TFR= 4.58 at the
1988 DHS for the 1985-1988 period, and TFR= 3.10 at the 1998 DHS for the 1995-1998
period predict a TFR of 2.60 in 2001). These estimates are therefore internally consistent.
The value of the MMR may appear high for a country such as South Africa. However,
the total number of deaths of females age 15-49 in the 12 months preceding the survey was
7934, so that the proportion of these deaths classified as maternal deaths was only 6.4%. With
a TFR of 2.62 children per woman, some 6.6% of the time of women age 15-49 is spent in the
maternal risk period (40 weeks of pregnancy and 6 weeks after delivery out of 35 years),
which means that the observed proportion of maternal deaths is equivalent to that expected
from the level of mortality in the population, and therefore that the deaths attributable to
obstetric causes must be compensated by the lower risk of pregnant women from indirect
causes, for a variety of reasons that remain to be explored. In conclusion, it is because female
adult mortality is extremely high in South Africa that the MMR also appears very high.
The female mortality quotient between ages 15 and 50 years (35q15) calculated from the
2001 census data was 0.2471, which corresponds to a life expectancy of 49.7 years in the UN
model life table system for developing countries (general pattern). This is obviously much
lower than the observed female life expectancy in the census data (e°(0)= 64.4 years). This
discrepancy is due to the fact that mortality in young adult ages is much higher than that at
other ages, in particular because of the high burden of HIV/AIDS and of external causes.
Mortality before age 15 (15q0) was 0.072, which corresponds to a life expectancy of 68.1 years
in model life tables. Life expectancy above age 50 was 30.65 years, which corresponds to a
10
life expectancy of 77.1 years in model life tables. Taking an average of 72.6 years as a
reference value for life expectancy, adult female mortality in the census appeared as 4.7 times
higher than expected from model life tables based on other age groups (expected 35q15 =
0.05237). If this coefficient is applied, the MMR would be only 137 per 100,000.
The 2001 census estimates for the Shangaan living in rural areas of the Limpopo
province could be compared with the Agincourt DSS, a population from the same ethnic
group living in the same province, and which accounts for about 7% of the total Shangaan
living in Limpopo (Tollman, 1999; Tollman et al., 1999). The MMR for the 2000-2002 period
in Agincourt was 305 per 100,000 live births (15/4912), not significantly different from the
MMR among the Shangaan from rural Limpopo at the 2001 census (MMR= 382 per 100,000;
P= 0.593). Note that the two populations were also comparable in birth rates (24 per 1000 in
both cases, P= 0.970), and in life expectancy at birth for men (e°= 58.7 and 57.1 respectively,
P= 0.251). However, female mortality in 2000-2002 was higher in Agincourt than at the
census (e°= 64.3 and 72.9 respectively, P< 0.001), and this was true for all adult age groups.
This is probably due to a higher level of HIV/AIDS infection among women in Agincourt
than among the Shangaan of Limpopo on the average, since female life expectancy averaged
also 72 years in 1992-1994 in Agincourt, before HIV/AIDS became an important cause of
death.
In-depth studies and long term trends of maternal mortality were conducted in the
Cape Town Peninsula, from births and deaths data recorded in hospitals [van Coeverden,
1979 and 1986; Fawcus et al. 2005]. Results show first a marked decline in MMR from 301
per 100,000 in 1953 to 31.2 per 100,000 in 1987-1989, followed by a marked increase
reaching 112 per 100,000 in 2002. These data are not strictly comparable to the census data,
since they apply to the most developed part of the province, and are based on hospital data.
However, they indicate firstly that even in the most advanced part of the country, MMR was
already high (112 versus 306 for the whole province at the 2001 Census), and secondly, that
the MMR has been multiplied by 3.6 in the recent years, mostly because of indirect causes, in
particular HIV/AIDS, and to a lesser extent to hypertension and pregnancy related sepsis.
Another element corroborating the MMR estimates is given by hospital statistics on
induced abortion. Dickinson and Rees (1999) report that “425 women died in hospitals each
year from complications of unsafe, clandestine abortions”. The confidential enquiry on
maternal deaths (1998) estimated that out of 133 cases of maternal deaths investigated, 12
were due to septic abortion, out of which 7 were due to induced abortion outside of health
services. Even if these data apply to a time when the “Termination Of Pregnancy act” was just
11
passed, it gives an order of magnitude of the number of maternal deaths from other causes
consistent with the 508 deaths found in the 10% sample.
Maternal mortality differentials
South Africa is a complex society, with outstanding gradients by race and level of
economic development. Some groups are living on European standards, whereas others are
closer to those living in remote place of other parts of sub-Saharan Africa. As a consequence,
mortality differentials are usually very large, and this applies as well to maternal mortality. In
addition to living standards, mortality levels and trends are also compounded by the raging
HIV/AIDS epidemic and by the high mortality from accident and violence, both groups of
causes of death which maintain a complex relationship with socio-economic status, often
different from that with other causes of death such as other infectious and parasitic diseases,
and non-communicable diseases. We present here only differentials in the MMR, since the
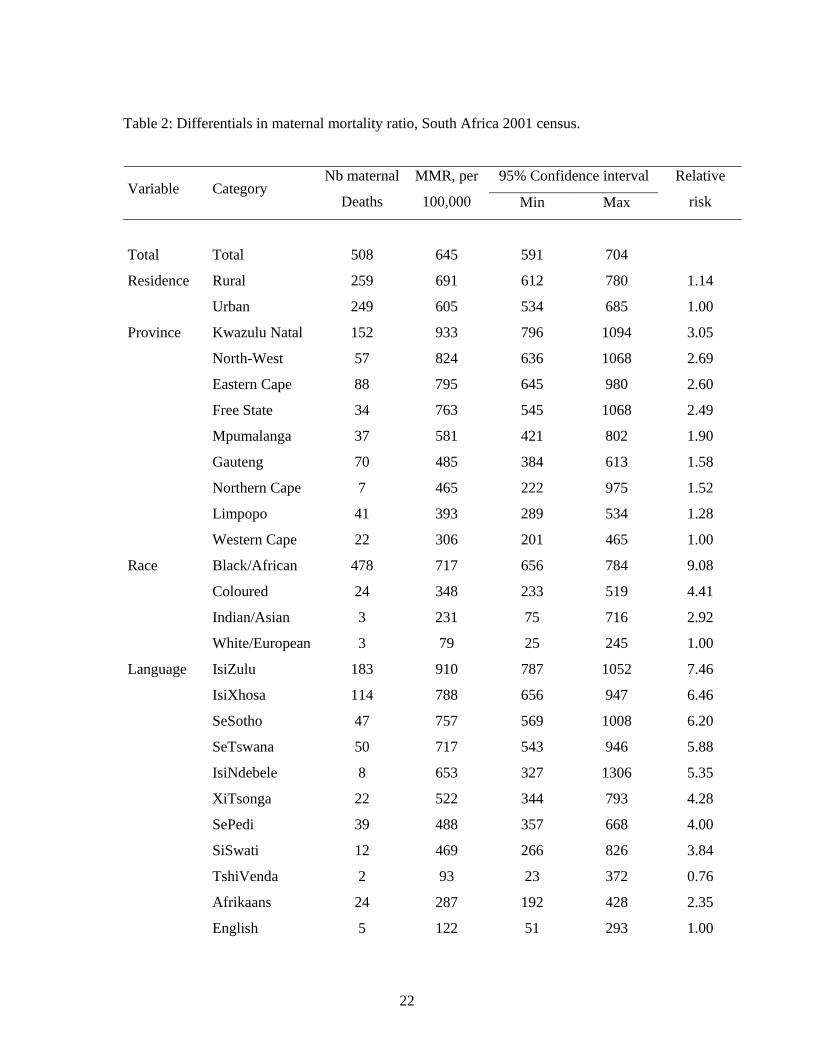
relationships with the other maternal mortality indicators were the same (Table 2).
The MMR was only marginally higher in rural areas (691 per 100,000) than in urban
areas (605 per 100,000). This is probably due to the balance between diverging forces: more
HIV/AIDS and more external causes in urban areas, and less access to medical services in
rural areas (Table 2).
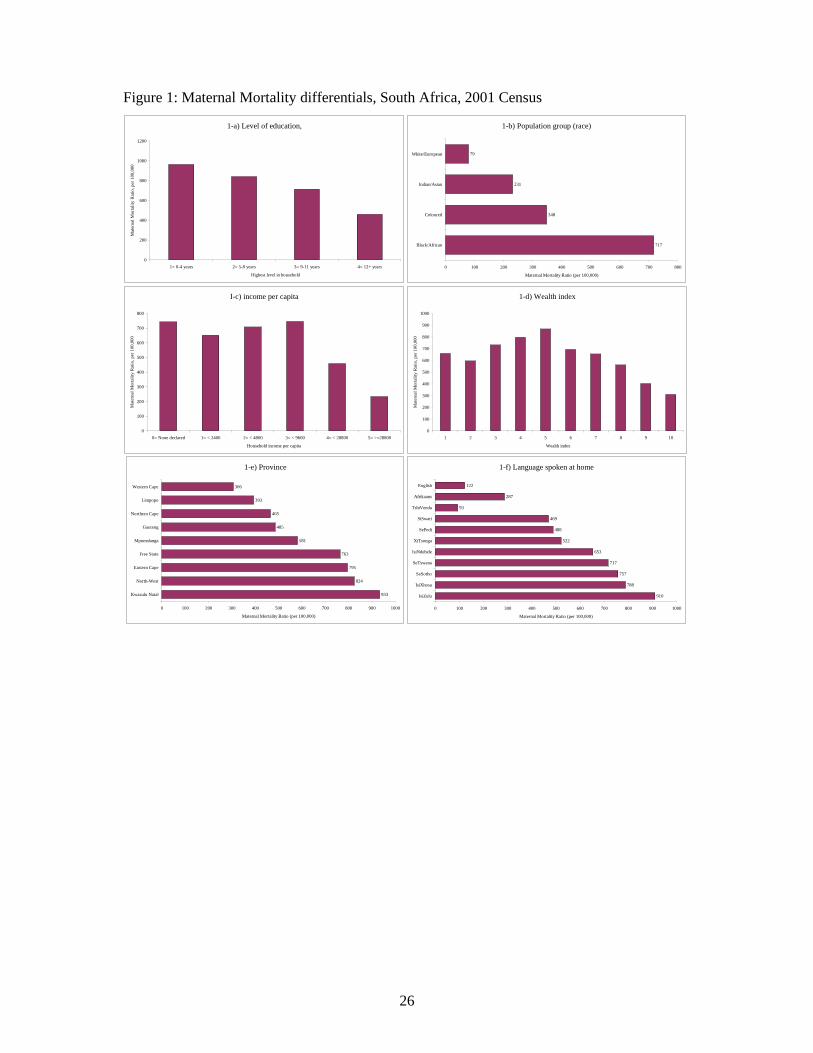
The gradient by province was very marked, from 3.0 to 1 between the province with
highest maternal mortality (Kwazulu-Natal, 933 per 100,000) and the province with the
lowest MMR (Western-Cape, 306 per 100,000) (Figure 1-e). South African provinces vary
very much in their ethnic composition, as well as in their level of development. Kwazulu-
Natal is the most populated, has the highest HIV seroprevalence rates and the lowest life
expectancy, but fares better for education, income and wealth. On the other side of the
spectrum, Western Cape has the lowest HIV seroprevalence rates, the highest life expectancy,
the highest level of education, the highest wealth index, and the next-highest income. The
wealthiest province (Gauteng) has a MMR below average, but still somewhat higher than the
MMR in the poorest province (Limpopo). These two contrasting provinces have similar life
expectancy (67.6 and 66.4 respectively), similar levels of female adult mortality at age 15-49
(0.155 and 0.172 per 1000), but Gauteng has higher HIV infection rates (29.8%) than
Limpopo (14.5%), which probably explain the differences in maternal mortality, since the
death rates from external causes was about the same.

12
The gradient by population group (race) was even more marked, with a range from 9.1
to 1 from Black/African (717 per 100,000) to White/European (79 per 100,000), the two other
groups being in an intermediate situation: Coloured: 348 per 100,000, and Indian/Asian: 231
per 100,000 (Figure 1-b).
The gradient by ethnicity, measured by the language spoken at home, reflects at the
same time the race, the urbanization, and the location. As could be anticipated, the range of
variation was also considerable, from 1 to 7.5 (Figure 1-f). The two groups speaking
European languages appear in a more favorable situation: speakers of English (122 per
100,000) and Afrikaans (287 per 100,000). Among the speakers of African languages, the
levels of MMR were much higher, with a range from 469 per 100,000 (SiSwati) to 910 per
100,000 (IsiZulu), with the exception of the TshiVenda (93 per 100,000), a group in which
only 2 maternal deaths were recorded, therefore with a huge confidence interval (23 to 372
per 100,000), although still significantly lower than the next lowest African group, the
SiSwati (P= 0.034).
The gradient by level of education was small, compared to gradients by province,
primarily because of the high level of education in the country, even in remote rural areas
(Figure A-a). The range was from 1 to 2.1 between 12+ years of education (MMR= 461 per
100,000) and less than 5 years of education (MMR= 963 per 100,000).
The gradient by level of income was complex, with two peaks, one for the very poor,
who declared no monetary income (MMR= 743 per 100,000), and the other for the
intermediate category (4800-9600 ZAR per capita), with the same MMR (Figure 1-c). The
differences between contiguous categories for groups above the intermediate category were
statistically significant (P= 0.015 between III and IV, and P= 0.036 between IV and V),
whereas differences between contiguous categories for groups below the intermediate were
not (P= 0.267, P= 0.538 and P= 0.737 respectively). However, it was clear that maternal
mortality was not increasing with lower income below the intermediate category. This seems
to be due to the complex relationships between area of residence, income, HIV/AIDS and
level of mortality from all causes.
The gradient by level of wealth, measured by the wealth index was even more striking
than the income gradient (Figure 1-d). The relationship had an inverse U-shape, with lower
levels of MMR for the second poorest (MMR= 556 per 100,000) and the wealthiest (MMR=
311 per 100,000), and the maximum for the intermediate category (5 items), with an MMR=
867 per 100,000.
13
The correlations between the MMR and the various variables at the level of the
province revealed the key factors. Correlation between the MMR and any indicator of
mortality was very high, and reached -0.91 with life expectancy, and was also high (+0.73)
with the prevalence of HIV in the province. Correlations with indicators of socio-economic
status were average: -0.42 with education; -0.49 with income, -0.49 with wealth, -0.32 with
urbanization. Relationships with racial composition were complex: negatively related with the
proportion of White/European (-0.53) and Coloured (-0.58), but positively related with the
proportion of Black/African (+0.58) and Indian/Asian (+0.45), the last being explained by the
concentration of Indian/Asian in Kwazulu-Natal. Correlations with fertility (+0.14) and with
population density (-0.15) were very small. Correlation with the proportion of home delivery
was positive, as expected, but of small magnitude (+0.29), underlying again the importance of
indirect causes in maternal mortality levels in South Africa.
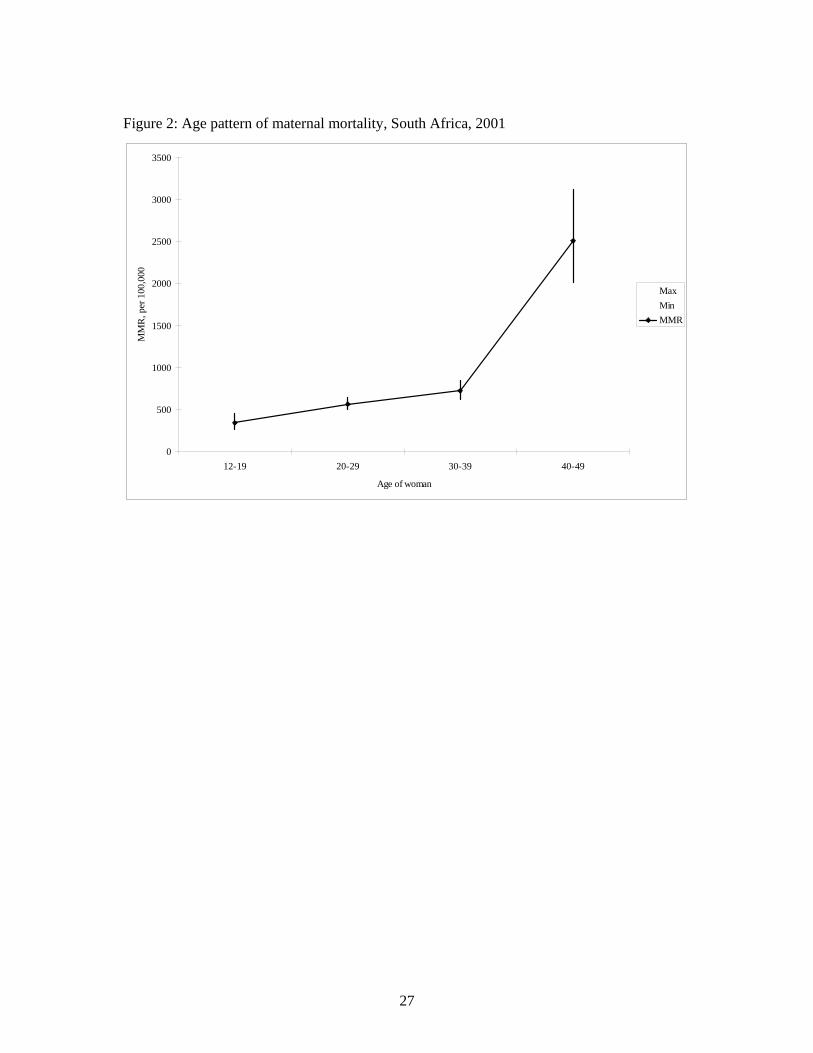
Age effect
The effect of age at delivery could not be assessed directly from the census data, due
to the lack of link of births to mothers, but could be approached by comparing the distribution
of maternal deaths by age to that expected from age specific fertility rates in the 1998 DHS
survey, standardized with the estimated TFR in 2001. Results show a regular increase of
MMR with age from adolescent years (12-19) to age 39, and a major increase above age 40
(Figure 2). This is probably due to two factors: the age at HIV infection, which peaks around
age 30 (age effect), and the fact that older women are much more likely to deliver at home
(cohort effect). The National Committee for the Confidential Enquiry into Maternal Deaths
(1998) already noted the high vulnerability of older women, attributed to obstetric causes and
to heart complications in case of pre-existing valvular heart disease.
5) Multivariate analysis
Because of the complex social fabric of South Africa, the multivariate analysis is
particularly difficult, and potentially misleading. A series of Linear-Logistic regression
models were ran on cases (maternal deaths) versus controls (surviving women), which
provide not only odds ratios, but also absolute risks since controls cover the whole population.
However, it should be noted that the analysis is not strictly equivalent to a formal case /
control study, since individual characteristics are not known for women who died, but only
14
the characteristics of their household. In addition to household characteristics, we have added,
in a second model, some of the characteristics of the province (community variable) likely to
have an effect on maternal mortality ratios, namely the HIV seroprevalence rate in 2001, the
proportion of home delivery, and the female death rate from external causes at age 15-49
years.
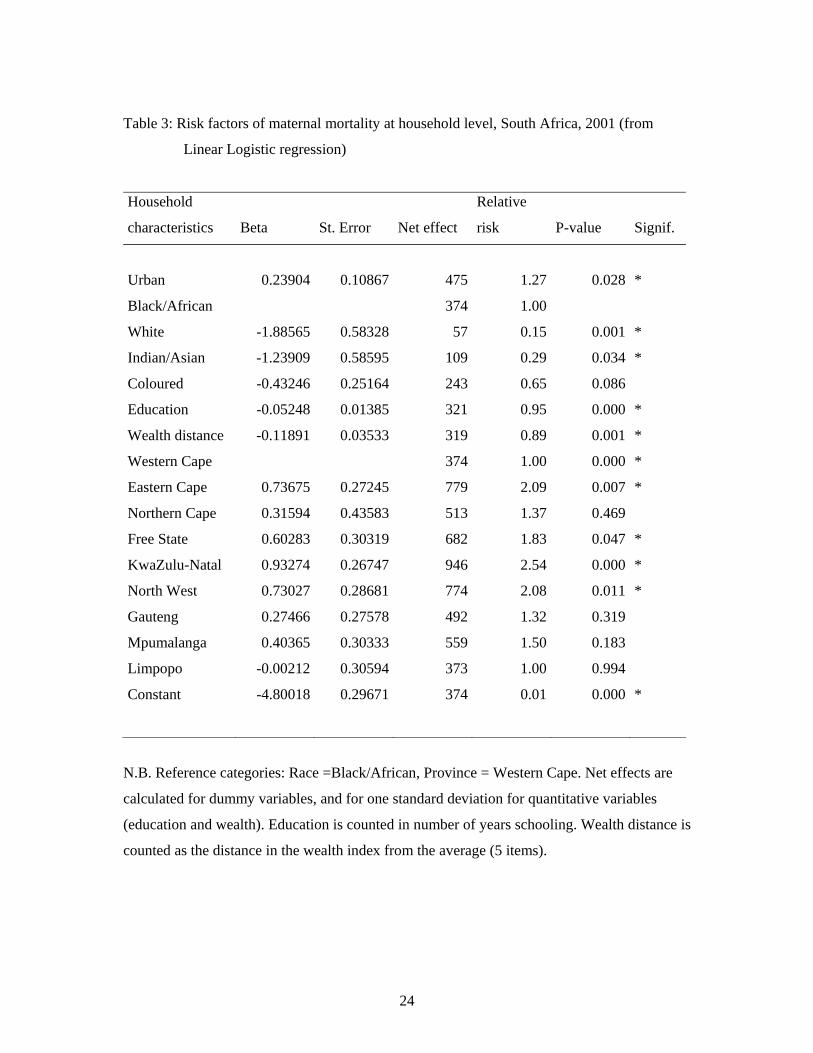
Considering first the household characteristics reveals some interesting features, when
controlling for urban residence, education, race, wealth, and province (Table 3). Firstly, the
effect of urban residence changed, with higher levels of MMR in urban areas (+27% instead
of -14% in the univariate analysis) when other factors were taken into account. Secondly, the
effect of the level of education became even smaller, with a net effect of -15% for one
standard deviation (2.9 years of schooling). Relationship with income or wealth was not
linear, and their net effect in the logit-linear regression were not significant. As seen above in
the univariate analysis, the relationship with wealth was quadratic, and better seen as a peak
for medium values of wealth (5-items). We therefore coded a “wealth distance” as the
absolute difference between the number of items in the household and the medium value.
Taken this way, the effect of wealth was significant, but remained relatively small, and of
similar magnitude to that of education. The ranking of the four racial groups was maintained
in the multivariate analysis. Large differences were also seen within provinces, keeping
basically the same relationships as in the univariate analysis. The difference between
Limpopo and Western Cape even disappeared in the multivariate analysis, because the small
difference noted in the univariate analysis was compensated by the effect of large differences
in income and education. The case of Limpopo deserves further investigation, not only for
maternal mortality, but also for overall levels of mortality, which appear lower than expected
from its situation in socio-economic development. Note that the Agincourt DSS, located in
Limpopo, confirms these findings.
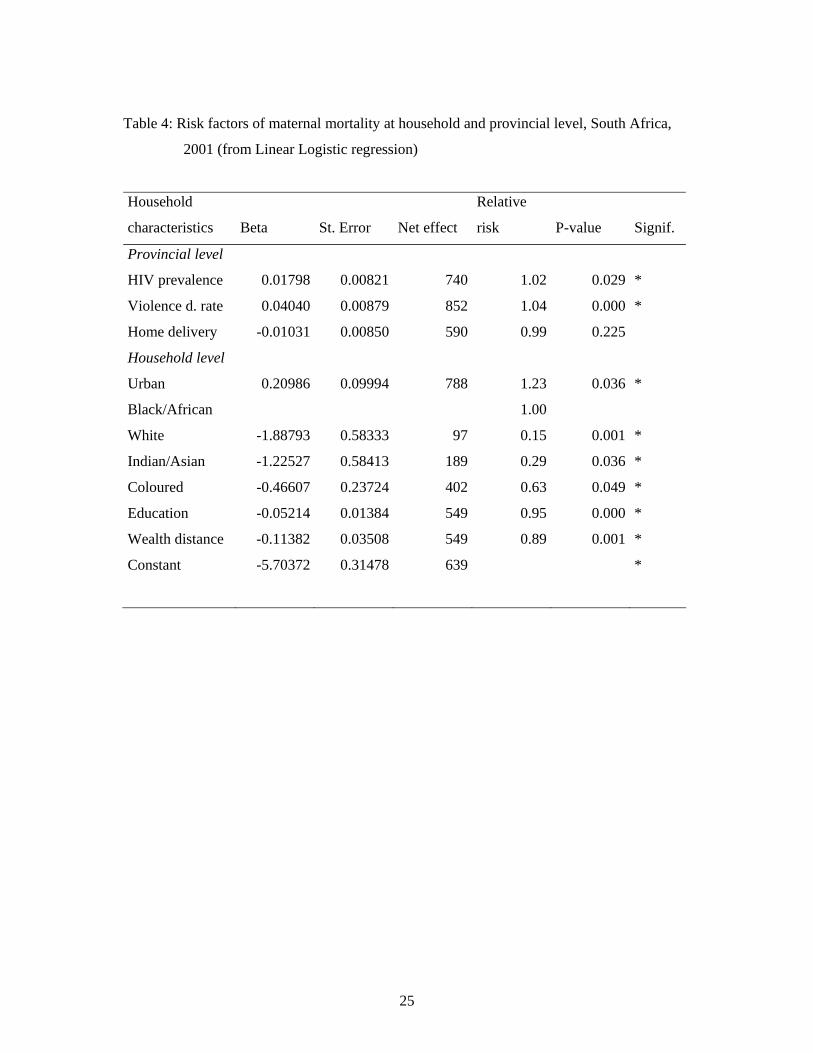
In order to better approach the large differences between the provinces, further
controls were added: the HIV prevalence in the province, taken from the published values by
the Ministry of Health for 2001 (sentinel sites of pregnant women), the death rate at 15-49
from external causes, calculated from the 2001 census data, and the proportion of home
deliveries, taken from the 1998 DHS survey. Results confirmed the probable role of
HIV/AIDS and violent deaths in the overall level of maternal mortality: both effects were
positive and significant (Table 4). The effect of the home delivery variable, however, was not
significant, and even somewhat negative, contrary to what was expected. This indicates that
indirect causes (and in particular HIV/AIDS and external causes) are the most important
15
factors for determining MMR levels, and that conversely direct causes play a much smaller
role in the differentials.
Discussion
The census has a great potential for monitoring levels, trends and differentials in
maternal mortality. By definition, the census provides a complete picture of the whole
population, and therefore ignores the issues of representativeness which often hamper
estimates based on medical statistics. The census also provides large numbers and small
confidence intervals, which limit the value of estimates from demographic sample surveys. It
also permits precise point estimates, which is not the case for estimates derived from the
survival of sisters, an important issue in situations where changes are rapid. The census also
allows for a variety of univariate and multivariate analyses at the household level, which can
reveal the source of major differentials in a country. Even if less precise than formal case /
control studies investigating the effect of individual characteristics on maternal mortality, and
if the list of variables is small and imposed by the census, the lessons learned may still be very
informative for public health professionals.
Levels for MMR in 2001 South Africa appear much higher than previous estimates
(Moodley and Pattinson, 2003; Moodley, 2003). The 1998 DHS estimate (150 per 100,000
live births) covered a different period (1992-1997), when HIV/AIDS was not yet a major
cause of death, and was based on a tiny sample (19.2 deaths after sampling weights were
applied) which produce a large confidence interval, to which should be added the variance
due to the sampling technique, and another variance due to the sisterhood method. At the
2001 census, the MMR was 4.3 times higher, the MDR was 3.3 higher, and the GFR was 0.77
times lower. Even taking into account the large confidence intervals at the 1998 DHS, there is
no doubt that maternal mortality has been increasing dramatically in South Africa over the
past 10 years, which is confirmed by local studies in Cape Town and in Agincourt.
The proportion of maternal deaths among deaths of women in their reproductive ages
is obviously different from that observed in other countries, even with similarly high levels or
MMR. For instance, in Niakhar, Senegal, the MMR was 519 per 100,000 in 1983-1989, with
a proportion of maternal deaths equal to 26.3% [Garenne & Fontaine, 1988]. In Nouna,
Burkina Faso, the MMR was 389 per 100,000, and the proportion of maternal deaths was
16
24.1% [Garenne et al. 1997]. In Matlab, Bangladesh over the 1976-1985 period, the MMR
was 551 per 100,000, with a high proportion of 37.3% of all deaths of women aged 15-44
years [Koenig et al. 1988]. In the case of South Africa, the proportion of maternal deaths was
only 6.6%, not different from the proportion of time spent in the maternal risk period.
Assuming that half of the maternal deaths were due to direct causes implies that women are at
a 50% lower risk from indirect causes during the maternal risk period. Of course, a proper
investigation of direct and indirect causes should be done to better understand these
phenomenon, and in particular by considering separately cases of premarital fertility (very
young women), middle age women, and older women, who have very different obstetric risks,
and are differentially affected by HIV/AIDS and by tuberculosis [Khan et al., 2001].
Maternal mortality differentials appeared quite different from classic differentials
observed elsewhere in Africa or Asia. Above all, the ethnic/racial and provincial differences
were overwhelming in South Africa, even after controlling for socio-economic status.
Furthermore, relationships with income and wealth were far more complex than elsewhere.
This has also been observed in Agincourt, where mortality from infectious diseases other than
HIV/AIDS were negatively linked to socio-economic status, but where mortality from chronic
diseases, from accident and violence, and from HIV/AIDS and PTB were either inversely
related, or had a U-shape relationship. Lastly, relationship with urbanization was also
different from expected, with a small gradient, that was even reversed in the multivariate
analysis. A similar observation was made in the hospitals of Kwazulu-Natal (Moodley et al.
1996). All these patterns should be understood within the framework of the complex social
fabric of the country, and its recent history.
The magnitude of the changes noted in maternal mortality in South Africa is simply
outstanding, and calls for a careful monitoring of trends and patterns. The vital registration
has been improving dramatically in South Africa from 1992 to 2001, so that trend analysis is
difficult. However, its coverage is becoming high and stable for adults, and it can now be used
for monitoring trends in maternal mortality in the coming years. This will provide at least
trends in direct causes, the most likely to be picked up in the medical certificates.
Another important finding of this study is the major role played by indirect causes.
This makes the analysis of MMR using the demographic definition of maternal mortality
more difficult than before. The main aim of the MMR was to target the obstetric causes, with
the idea to improve the safety of pregnancies and deliveries. We could now be in a situation
where direct causes continue to decrease while indirect causes increase, so that trends in

17
MMR reflect primarily trends in indirect causes. This changes totally the interpretation of the
MMR, and its implication for monitoring progresses in safe motherhood.
One of the Millennium Development Goals (MDG) is to reduce maternal mortality by
three fourth by 2015. In order to monitor progresses made in obstetric care, new tools are
needed, since the MMR using the demographic definition is unlikely to be appropriate in
cases where emerging diseases and external causes play an increasing role. There is therefore
a need to go beyond the demographic numbers, and to look more carefully at trends in
maternal causes of death in developing countries. If the census provides the numbers, it
should be complemented with cause of death information. This can be done by full scale
verbal autopsies, detailing the timing of the death (early pregnancy, late pregnancy, delivery,
post-partum period, induced abortion), the leading obstetric causes (hemorrhage, eclampsia,
obstructed labor, pulmonary embolism, post-partum infections, etc), the leading indirect
causes (HIV/AIDS, PTB, hepatitis, etc.), and the leading external causes (road traffic
accidents, household accidents, homicide, suicide, etc.). Verbal autopsies have been used with
success for a long time for investigating maternal deaths, and are likely to add immensely to
the whole picture (Fortney et al., 1986; Garenne & Fontaine, 1988; Fauveau et al. 1988,
Fottrell et al. 2007).
18
References
Boerma, Jan Ties. (1988). The magnitude of the maternal mortality problem in Sub-Saharan
Africa. Social Science and Medicine, 24,6:551-558.
Bullough C, Meda N, Makowiecka K, Ronsmans C, Achadi EL, Hussein J. (2005). Current
strategies for the reduction of maternal mortality. BJOG: an International Journal of
Obstetrics and Gynaecology; 112:1180-1188.
Dickson-Tetteh K, Rees H. (1999). Efforts to reduce abortion-related mortality in South
Africa. Safe Motherhood Initiatives / Reproductive Health Matters; 190-195.
Fauveau V, Koenig MA, Chakraborty J, Chowdhury AI. (1988). Causes of maternal mortality
in rural Bangladesh: 1976-1985. Bulletin of the World Health Organization; 66(5):
643-651.
Fawcus SR, van Coerverden de Groot HA, Isaacs S. (2005). A 50-year audit of maternal
mortality in the Peninsula maternal and neonatal service, Cape Town (1953-2002).
BJOG: an International Journal of Obstetrics and Gynaecology; 112:1257-1263.
Fortney JA, Susanti I, Gadalla S, Seleh S, Rogers SM, Potts M. (1986). Reproductive
mortality in two developing countries. American Journal of Public Health; 76(2):134-
138.
Fottrell E, Byass P, Ouedraogo TW, Tamini C, Gbangou A, Sombié I, Högberg U, Witten
KH, Bhattacharya S, Desta T, Deganus S, Tornui J, Fitzmaurice AE, Meda N, Graham
W. (2007). Revealing the burden of maternal mortality: a probabilistic model for
determining pregnancy-related causes of death from verbal autopsies. Population
Health Metrics; 5(1):1-9.
Garenne M, Fontaine O. (1988). Assessing Probable Causes of Deaths Using a Standardized
Questionnaire. A study in Rural Senegal. In: J. Vallin, S. D'Souza et A. Palloni ed.
Measurement and analysis of mortality. [Reprinted as a Public Health Classics, in:
Bulletin WHO; 84(3):248-253]
Garenne M, Sauerborn, R, Nougtara A, Borchert M, Benzler J. (1997). Direct and indirect
estimates of maternal mortality in a rural area of Burkina-Faso. Studies in Family
Planning, 28(1): 54-61.
19
Garenne M, Friedberg F. (1997). Accuracy of indirect estimates of maternal mortality: a
simulation model. Studies in Family Planning, 28,2:132-142.
Garenne M, Hohmann S. (2003). A wealth index to screen high risk families: application to
Morocco. Journal of Health, Population and Nutrition; 21(3):235-242.
Graham W, Brass W, Snow RW. (1989). Estimating maternal mortality: the sisterhood
method. Studies in Family Planning 20,3:125-135.
Graham WJ. (2002). Now or never: the case for measuring maternal mortality. Lancet,
359(9307):701-704.
Hill K, El-Arifeen S, Koenig M, Al-Sabir A, Jamil K, Raggers H. (2006). How should we
measure maternal mortality in the developing world? A comparison of household
deaths and sibling history approaches. Bulletin of the World Health Organization;
84:173-180.
Khan M, Pillay T, Moodley JM, Connolly CA. (2001). Maternal mortality associated with
tuberculosis-HIV-1 co-infection in Durban South Africa. AIDS; 15(14):1857-1963.
Khlat M, Ronsmans C. (2000). Deaths attributable to childbearing in Matlab, Bangladesh:
Indirect causes of maternal mortality questioned. American Journal of Epidemiology;
151(3):300-306.
Koenig MA, Fauveau V, Chowdhury AI, Chakraborty J, Khan MA. (1988). Maternal
mortality in Matlab, Bangladesh: 1976-1985. Studies in Family Planning; 19(2):69-80.
Moodley D, Payne AJ, Moodley J. (1996). Maternal mortality in KwaZulu-Natal: need for an
information database system and confidential enquiry into maternal deaths in
developing countries. Tropical Doctor; 26(2):50-54.
Moodley J, Pattinson RC. (2003). Maternal deaths in South Africa. South African Medical
Journal; 93(5):354.
Moodley J. (2003). Saving mothers: 1999-2001. South African Medical Journal; 93(5):364-
366.
National Committee for the Confidential Enquiry into Maternal Deaths. (1998). Interim report
on the confidential enquiry into maternal deaths in South Africa. Department of
Health, Pretoria [available on web site:
www.doh.gov.za/docs/reports/1998:mat_deaths.html]
Ronsmans C, Graham WJ. (2006). Maternal mortality: who, when, where, and why. Lancet;
368:1189-1200.
Rosenfield A, Maine D. (1985). Maternal mortality- a neglected tragedy. Where is the M in
MCH? Lancet; 2: 83-85.
20
Rosenfield A, Maine D, Freedman L. (2006). Meeting MDG-5: an impossible dream? Lancet;
368(9542):1133-1135. [DOI:10.1016/S0140-6736(06)].
Rutenberg N, Sullivan JM. (1991). Direct and indirect estimates of maternal mortality from
the sisterhood method. In: Demographic and Health Surveys World Conference
Proceedings, August 5-7, 1991; Vol. 3. Calverton (MD), USA: Macro International:
1669-1996.
Stanton C, Hobcraft J, Hill K, Koogbé N, Mapeta WT, Munene F, Naghavi M, Rabez V,
Sisouphanthong B, Campbell O. (2001). Every death counts: measurement of maternal
mortality via a census. Bulletin of the World Health Organization; 79(7):1-19.
Tollman SM. (1999). The Agincourt field site: Evolution and current status. South African
Medical Journal; 89(8):853-858.
Tollman SM, Herbst K, Garenne M; Kahn K, Gear JSS. (1999). The Agincourt demographic
and health study: site description, baseline findings and implications. South African
Medical Journal; 89(8):858-864.
United Nations. (2000). United Nations Millenium Declaration. Resolution A/RES/55/2. New
York, NY: United Nations.
United Nations. (2006). Principles and Recommendations for Population and Housing
Censuses, Revision 2. New York, United Nations. (Paragraph 2.196).
Van Coeverden de Groot HA. (1979). Trends in maternal mortality in Cape Town, 1953-
1977. South African Medical Journal; 56():547-552.
Van Coeverden de Groot HA. (1986). Maternal mortality in Cape Town, 1978-1983. South
African Medical Journal; 69(13):797-802.
21
Table 1: Maternal mortality indicators estimated from the 2001 census (10% sample), South
Africa
Maternal mortality indicators Value
95% confidence
interval
Min - Max
Maternal mortality ratio (MMR),
per 100,000 live births 646 592 705
Maternal death rate (MDR),
per 100,000 person-years lived 48.4 44.4 52.8
Life time risk of maternal mortality (MMQ)
per 100,000 women at age 12 1681 1541 1833
22
Table 2: Differentials in maternal mortality ratio, South Africa 2001 census.
95% Confidence interval Variable Category
Nb maternal
Deaths
MMR, per
100,000 Min Max
Relative
risk
Total Total 508 645 591 704
Residence Rural 259 691 612 780 1.14
Urban 249 605 534 685 1.00
Province Kwazulu Natal 152 933 796 1094 3.05
North-West 57 824 636 1068 2.69
Eastern Cape 88 795 645 980 2.60
Free State 34 763 545 1068 2.49
Mpumalanga 37 581 421 802 1.90
Gauteng 70 485 384 613 1.58
Northern Cape 7 465 222 975 1.52
Limpopo 41 393 289 534 1.28
Western Cape 22 306 201 465 1.00
Race Black/African 478 717 656 784 9.08
Coloured 24 348 233 519 4.41
Indian/Asian 3 231 75 716 2.92
White/European 3 79 25 245 1.00
Language IsiZulu 183 910 787 1052 7.46
IsiXhosa 114 788 656 947 6.46
SeSotho 47 757 569 1008 6.20
SeTswana 50 717 543 946 5.88
IsiNdebele 8 653 327 1306 5.35
XiTsonga 22 522 344 793 4.28
SePedi 39 488 357 668 4.00
SiSwati 12 469 266 826 3.84
TshiVenda 2 93 23 372 0.76
Afrikaans 24 287 192 428 2.35
English 5 122 51 293 1.00

23
Table 2 Cont./…
Education 0-4 years 52 963 734 1264 2.09
5-8 years 121 841 704 1005 1.82
9-11 years 183 714 618 825 1.55
12+ years 152 461 393 540 1.00
Income None declared 142 743 630 876 3.18
< 2400 Rd 147 652 555 766 2.79
2400-4800 Rd 95 707 578 864 3.02
4800-9600 Rd 73 745 592 937 3.18
9600-28800 Rd 38 459 334 631 1.96
28800 Rd 13 234 136 403 1.00
Wealth index (nb items)
1 24 660 442 985 0.76
2 53 596 455 780 0.69
3 74 732 583 919 0.84
4 68 797 628 1011 0.92
5 72 867 688 1092 1.00
6 59 694 538 896 0.80
7 55 654 502 852 0.75
8 55 561 431 731 0.65
9 40 403 296 549 0.46
10 8 311 156 622 0.36
24
Table 3: Risk factors of maternal mortality at household level, South Africa, 2001 (from
Linear Logistic regression)
Household
characteristics Beta St. Error Net effect
Relative
risk P-value Signif.
Urban 0.23904 0.10867 475 1.27 0.028 *
Black/African 374 1.00
White -1.88565 0.58328 57 0.15 0.001 *
Indian/Asian -1.23909 0.58595 109 0.29 0.034 *
Coloured -0.43246 0.25164 243 0.65 0.086
Education -0.05248 0.01385 321 0.95 0.000 *
Wealth distance -0.11891 0.03533 319 0.89 0.001 *
Western Cape 374 1.00 0.000 *
Eastern Cape 0.73675 0.27245 779 2.09 0.007 *
Northern Cape 0.31594 0.43583 513 1.37 0.469
Free State 0.60283 0.30319 682 1.83 0.047 *
KwaZulu-Natal 0.93274 0.26747 946 2.54 0.000 *
North West 0.73027 0.28681 774 2.08 0.011 *
Gauteng 0.27466 0.27578 492 1.32 0.319
Mpumalanga 0.40365 0.30333 559 1.50 0.183
Limpopo -0.00212 0.30594 373 1.00 0.994
Constant -4.80018 0.29671 374 0.01 0.000 *
N.B. Reference categories: Race =Black/African, Province = Western Cape. Net effects are
calculated for dummy variables, and for one standard deviation for quantitative variables
(education and wealth). Education is counted in number of years schooling. Wealth distance is
counted as the distance in the wealth index from the average (5 items).
25
Table 4: Risk factors of maternal mortality at household and provincial level, South Africa,
2001 (from Linear Logistic regression)
Household
characteristics Beta St. Error Net effect
Relative
risk P-value Signif.
Provincial level
HIV prevalence 0.01798 0.00821 740 1.02 0.029 *
Violence d. rate 0.04040 0.00879 852 1.04 0.000 *
Home delivery -0.01031 0.00850 590 0.99 0.225
Household level
Urban 0.20986 0.09994 788 1.23 0.036 *
Black/African 1.00
White -1.88793 0.58333 97 0.15 0.001 *
Indian/Asian -1.22527 0.58413 189 0.29 0.036 *
Coloured -0.46607 0.23724 402 0.63 0.049 *
Education -0.05214 0.01384 549 0.95 0.000 *
Wealth distance -0.11382 0.03508 549 0.89 0.001 *
Constant -5.70372 0.31478 639 *
26
Figure 1: Maternal Mortality differentials, South Africa, 2001 Census
1-a) Level of education,
0
200
400
600
800
1000
1200
1= 0-4 years 2= 5-8 years 3= 9-11 years 4= 12+ years
Highest level in household
Mat
erna
l Mor
talit
y Ra
tio, p
er 1
00,0
001-b) Population group (race)
717
348
231
79
0 100 200 300 400 500 600 700 800
Black/African
Coloured
Indian/Asian
White/European
Maternal Mortality Ratio (per 100,000)
I-c) income per capita
0
100
200
300
400
500
600
700
800
0= None declared 1= < 2400 2= < 4800 3= < 9600 4= < 28800 5= >=28800
Household income per capita
Mat
erna
l Mor
talit
y Ra
tio, p
er 1
00,0
00
1-d) Wealth index
0
100
200
300
400
500
600
700
800
900
1000
1 2 3 4 5 6 7 8 9 10
Wealth index
Mat
erna
l Mor
talit
y Ra
tio, p
er 1
00,0
00
1-e) Province
933
824
795
763
581
485
465
393
306
0 100 200 300 400 500 600 700 800 900 1000
Kwazulu Natal
North-West
Eastern Cape
Free State
Mpumalanga
Gauteng
Northern Cape
Limpopo
Western Cape
Maternal Mortality Ratio (per 100,000)
1-f) Language spoken at home
910
788
757
717
653
522
488
469
93
287
122
0 100 200 300 400 500 600 700 800 900 1000
IsiZulu
IsiXhosa
SeSotho
SeTswana
IsiNdebele
XiTsonga
SePedi
SiSwati
TshiVenda
Afrikaans
English
Maternal Mortality Ratio (per 100,000)
27
Figure 2: Age pattern of maternal mortality, South Africa, 2001
0
500
1000
1500
2000
2500
3000
3500
12-19 20-29 30-39 40-49
Age of woman
MM
R, p
er 1
00,0
00
MaxMinMMR

28