Embed Size (px)
Citation preview

An average of 183mm of rainfall was recorded over the island equivalent to 174% of the long term mean for the month with 55% in the first fortnight
and 45% in the second. Vacoas recorded 17 rain days (≥1mm of rain).
MAURITIUS METEOROLOGICAL SERVICES
CLIMATE JUNE 2021
Introduction
June 2021 was very wet with 174% of the Long Term Mean rainfall. The month was rather warm and ranks the 11th warmest from 1960.
El-Nino La-Nina Southern Oscillation (ENSO) remained in the neutral phase and the Indian Ocean Dipole (IOD) in the equatorial Indian Ocean became
gradually negative in the 3rd
week. The Subtropical Indian Ocean Dipole remained neutral and the Madden Julian Oscillation (MJO) was active over the
western Indian Ocean during the mid of the month.
1. Rainfall
Fig. 1: Spatial rainfall distribution (a) Observed (b) Anomaly (mm)
Fig. 2: Regional rainfall distribution

Fig. 4: Mean temperature trend for June from 1960-2021
The monthly mean temperature over the island
in June 2021 was 22.1°C which is slightly above
the LTM 1981-2010 (+0.7oC).
The mean minimum temperature anomaly was
above the normal (+1.2oC); the 7th warmest on
records and the mean maximum temperature
anomaly was close to the normal (+0.2oC).
2. Surface Temperature
19.5
20.0
20.5
21.0
21.5
22.0
22.5
23.0
1960
1962
1964
1966
1968
1970
1972
1974
1976
1978
1980
1982
1984
1986
1988
1990
1992
1994
1996
1998
2000
2002
2004
2006
2008
2010
2012
2014
2016
2018
2020
Mea
n t
em
pera
ture °
C
Year
Mean Temperature in degrees Celsius (oC) over Mauritius
Mean Temp °C 5 per. Mov. Avg. (Mean Temp °C ) Linear (Mean Temp °C )
Fig. 3: Meteosat8 satellite pictures
(b) Clouds coming from the South of Mauritius on 08
(c) Clouds coming from the East on 26
(a) Clouds coming from the East on 06

(a)
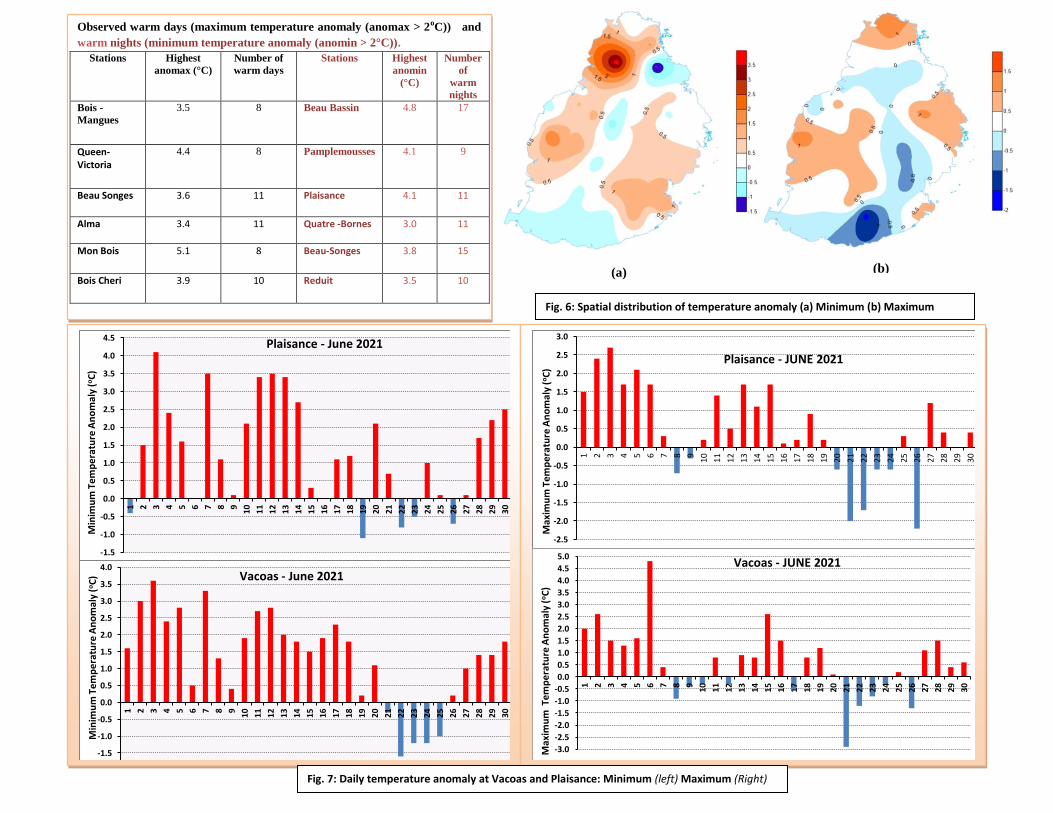
The nights were warmer at most places except from 19-26 where minimum
temperatures were cooler than the normal by 1-4oC; (Fig 6(a)). However, no
new extreme low minimum was recorded.
The lowest minimum recorded was 11.3oC at Mon Bois on 24 and the
highest minimum was 24.6oC at Port-Louis on 02.
The daytime during the first week was warmer by 1-3oC and the remaining
days had mostly close to normal temperatures (Fig 7). However, during the
period 20-26, the advection of cold air caused a drop in the maximum
temperatures of 2-3oC below the normal on some days.
The lowest maximum for the month was 15.9oC recorded at Grand-Bassin
on 21. The highest maximum was 31.3oC recorded at Port-Louis on 06.
No new extreme maximum temperatures were recorded.
Fig. 5: (a) Mean minimum (b) Mean maximum
temperature distribution
(b)
(b)
Observed warm days (maximum temperature anomaly (anomax > 2oC)) and
warm nights (minimum temperature anomaly (anomin > 2°C)).
Stations Highest
anomax (°C)
Number of
warm days
Stations Highest
anomin
(°C)
Number
of
warm
nights
Bois -
Mangues
3.5 8 Beau Bassin 4.8 17
Queen- Victoria
4.4 8 Pamplemousses 4.1 9
Beau Songes 3.6 11 Plaisance 4.1 11
Alma 3.4 11 Quatre -Bornes 3.0 11
Mon Bois 5.1 8 Beau-Songes 3.8 15
Bois Cheri 3.9 10 Reduit 3.5 10
Fig. 6: Spatial distribution of temperature anomaly (a) Minimum (b) Maximum
-1.5
-1.0
-0.5
0.0
0.5
1.0
1.5
2.0
2.5
3.0
3.5
4.0
4.5
1 2 3 4 5 6 7 8 9 10
11
12
13
14
15
16
17
18
19
20
21
22
23
24
25
26
27
28
29
30
Min
imu
m T
em
pe
ratu
re A
no
mal
y (o
C)
Plaisance - June 2021
-1.5
-1.0
-0.5
0.0
0.5
1.0
1.5
2.0
2.5
3.0
3.5
4.0
1 2 3 4 5 6 7 8 9
10
11
12
13
14
15
16
17
18
19
20
21
22
23
24
25
26
27
28
29
30
Min
imu
m T
em
pe
ratu
re A
no
mal
y (o
C) Vacoas - June 2021
-2.5
-2.0
-1.5
-1.0
-0.5
0.0
0.5
1.0
1.5
2.0
2.5
3.0
1 2 3 4 5 6 7 8 9
10
11
12
13
14
15
16
17
18
19
20
21
22
23
24
25
26
27
28
29
30
Max
imu
m T
em
pe
ratu
re A
no
mal
y (o
C)
Plaisance - JUNE 2021
-3.0
-2.5
-2.0
-1.5
-1.0
-0.5
0.0
0.5
1.0
1.5
2.0
2.5
3.0
3.5
4.0
4.5
5.0
1
2
3
4
5
6
7
8
9
10
11
12
13
14
15
16
17
18
19
20
21
22
23
24
25
26
27
28
29
30
Max
imu
m T
em
pe
ratu
re A
no
mal
y (o
C)
Vacoas - JUNE 2021
Fig. 7: Daily temperature anomaly at Vacoas and Plaisance: Minimum (left) Maximum (Right)
(a)

3. Sunshine and Humidity
4. Winds
60
65
70
75
80
85
90
95
100
1 2 3 4 5 6 7 8 9 10 11 12 13 14 15 16 17 18 19 20 21 22 23 24 25 26 27 28 29 30
Re
lati
ve h
um
idit
y (%
)
Date
June 2021 Percentage Relative Humidity (% RH)
Vacoas Plaisance LTM Vac LTM Plai
0.0
2.0
4.0
6.0
8.0
10.0
12.0
1 2 3 4 5 6 7 8 9 10 11 12 13 14 15 16 17 18 19 20 21 22 23 24 25 26 27 28 29 30
Sun
shin
e (h
ou
rs)
Date
June 2021- Number of bright sunshine hours Vacoas Plaisance LTM Vac LTM Plai
Overall, the mean relative humidity was close to the
normal at both stations. The low values from 20-25 at
Plaisance was the effect of the advection of cold dry air.
The number of daily bright sunshine hours was close to
the normal at Vacoas and Plaisance; with a daily mean
difference of -0.2 hours and -0.4 hours compared to their
respective LTM. Day 12 and 26 had the lowest sunshine
hours (Fig 08). The total number of monthly bright
sunshine hours at Vacoas was 209.2 (97% of LTM) and at
Plaisance it was 161.3(93% of LTM).
Fig. 8: Daily relative humidity and sunshine
hours.
The wind was mainly from the eastern and south-eastern sector. On some occasions
light wind from the south and the northwest prevailed at Plaisance. Fig. 9(a): Wind frequency at Plaisance

Fig. 9(b): Wind frequency at Vacoas Fig. 10:Waverose at BlueBay showing waves from the south-eastern sector
The ocean waves at Blue Bay were mainly from the southern sector. A high wave
warning was issued for the period 06-09 June 2021; the wave height exceeded 4 metres
on day 08.

Fig. 12: Statistical Model Forecast of (a) rainfall and (b) temperature
FORECAST FOR JULY-AUGUST-SEPTEMBER (JAS)
Neutral ENSO is likely to persist during July-
August-September period. From Figure 11 (a),
in the Indian Ocean, both IOD and SIOD are
forecasted to be neutral. Figure 11 also shows
that the Mascarene region will encounter
slightly above normal SST during JAS. Figure
11 (b) shows that pressure anomaly over the
SWIO will be normal.
Consensus forecast for Mauritius:
Statistical analysis is showing normal to slightly above
normal rainfall for JAS.
As such cumulative monthly rainfall is as follows:-
July slightly above normal ( 140 mm)
August normal (~90 mm)
September normal (~80 mm)
Mean temperature is forecasted to be normal in most
places (Fig 12b).
Figure 11: (a) Sea surface temperature and (b) pressure anomaly charts for JAS 2021
The right of publication in print, electronic and any other form is
reserved by the Meteorological Services. Any part of this document
may be reproduced provided complete source is acknowledged or
after authorization from:
Director, Meteorological Services,
St Paul; Road Vacoas,
Tel: 6861031/32, Fax: 6861033, email: [email protected]
Updated on: 27 July 2021