Embed Size (px)
DESCRIPTION
May 2012 Corpo
Citation preview

Current Corporate Information May 2012
Drilling operations in Whiting‟s Redtail
Prospect in the Denver Basin in Weld
County, CO. The Wolf 35-2623H was
recently completed with an initial
production rate of 426 BOE/d from the
Niobrara “B” zone.
In April 2012 Whiting drilled the Stubstad 14-6TFX in the Sanish field, which
flowed 2,249 BOE/d from the Three Forks formation. This is the highest initial
production rate for a Whiting operated Three Forks well in the Sanish field.
On March 17, 2012 Whiting
completed it‟s first horizontal
Wolfcamp well located in Pecos
County, TX. The Big Tex North 301H
was completed producing 440 BOE/d.

Forward-Looking Statements, Non-GAAP Measures, Reserve and
Resource Information, Definition of De-Risked
This presentation includes forward-looking statements that the Company believes to be forward-looking statements within the meaning of the
Private Securities Litigation Reform Act of 1995. All statements other than statements of historical fact included in this presentation are forward-
looking statements. These forward looking statements are subject to risks, uncertainties, assumptions and other factors, many of which are
beyond the control of the Company. Important factors that could cause actual results to differ materially from those expressed or implied by the
forward-looking statements include the Company’s business strategy, financial strategy, oil and natural gas prices, production, reserves and
resources, impacts from the global recession and tight credit markets, the impacts of state and federal laws, the impacts of hedging on our results
of operations, level of success in exploitation, exploration, development and production activities, uncertainty regarding the Company’s future
operating results and plans, objectives, expectations and intentions and other factors described in the Company’s Annual Report on Form 10-K for
the year ended December 31, 2011. Whiting’s production forecasts and expectations for future periods are dependent upon many assumptions,
including estimates of production decline rates from existing wells and the undertaking and outcome of future drilling activity, which may be
affected by significant commodity price declines or drilling cost increases.
In this presentation, we refer to Adjusted Net Income and Discretionary Cash Flow, which are non-GAAP measures that the Company believes are
helpful in evaluating the performance of its business. A reconciliation of Adjusted Net Income and Discretionary Cash Flow to the relevant GAAP
measures can be found at the end of the presentation. Whiting uses in this presentation the terms proved, probable and possible reserves.
Proved reserves are reserves which, by analysis of geoscience and engineering data, can be estimated with reasonable certainty to be
economically producible from a given date forward from known reservoirs under existing economic conditions, operating methods and government
regulations prior to the time at which contracts providing the right to operate expire, unless evidence indicates that renewal is reasonably certain.
Probable reserves are reserves that are less certain to be recovered than proved reserves, but which, together with proved reserves, are as likely
as not to be recovered. Possible reserves are reserves that are less certain to be recovered than probable reserves. Estimates of probable and
possible reserves which may potentially be recoverable through additional drilling or recovery techniques are by nature more uncertain than
estimates of proved reserves and accordingly are subject to substantially greater risk of not actually being realized by the Company.
Whiting uses in this presentation the term “total resources,” which consists of contingent and prospective resources, which SEC rules prohibit in
filings of U.S. registrants. Contingent resources are resources that are potentially recoverable but not yet considered mature enough for
commercial development due to technological or business hurdles. For contingent resources to move into the reserves category, the key
conditions, or contingencies, that prevented commercial development must be clarified and removed. Prospective resources are estimated
volumes associated with undiscovered accumulations. These represent quantities of petroleum which are estimated to be potentially recoverable
from oil and gas deposits identified on the basis of indirect evidence but which have not yet been drilled. This class represents a higher risk than
contingent resources since the risk of discovery is also added. For prospective resources to become classified as contingent resources,
hydrocarbons must be discovered, the accumulations must be further evaluated and an estimate of quantities that would be recoverable under
appropriate development projects prepared. Estimates of resources are by nature more uncertain than reserves and accordingly are subject to
substantially greater risk of not actually being realized by the Company. 1

Company Overview
Drilling the Hutchins Stock Association #1096 in North
Ward Estes Field, Whiting‟s EOR project in Ward and
Winkler Counties, Texas.
(1) Assumes a $57.20 share price (closing price as of April 30, 2012) on 117,517,777 common shares outstanding as of March 31, 2012.
(2) As of March, 31, 2012. Please refer to the “Outstanding Bonds and Credit Agreement” slide for details.
(3) As of March 31, 2012. Please refer to the “Total Capitalization” slide for details.
(4) Whiting reserves at December 31, 2011 based on independent engineering.
(5) R/P ratio based on year-end 2011 proved reserves and 2011 production.
Market Capitalization(1) $6.7B
Long-Term Debt(2) $1,240 MM
Shares Outstanding 117.6 MM
Debt/Total Cap(3) 28.5%
Proved Reserves(4) 345.2 MMBOE
% Oil 86%
R/P ratio(5) 13.9 years
Q1 2012 Production 80.7 MBOE/d
2

3%2%11%
17%
67%
Michigan Gulf Coast
Mid-Continent Permian Basin
Rocky Mountains
ROCKY MOUNTAINS
54.0 MBOE/D
PERMIAN
13.6 MBOE/D
MID-CONTINENT
8.7 MBOE/D
MICHIGAN
2.7 MBOE/D
GULF COAST
1.7 MBOE/D
Map of Operations
Q1 2012 Net Production
80.7 MBOE/d
3
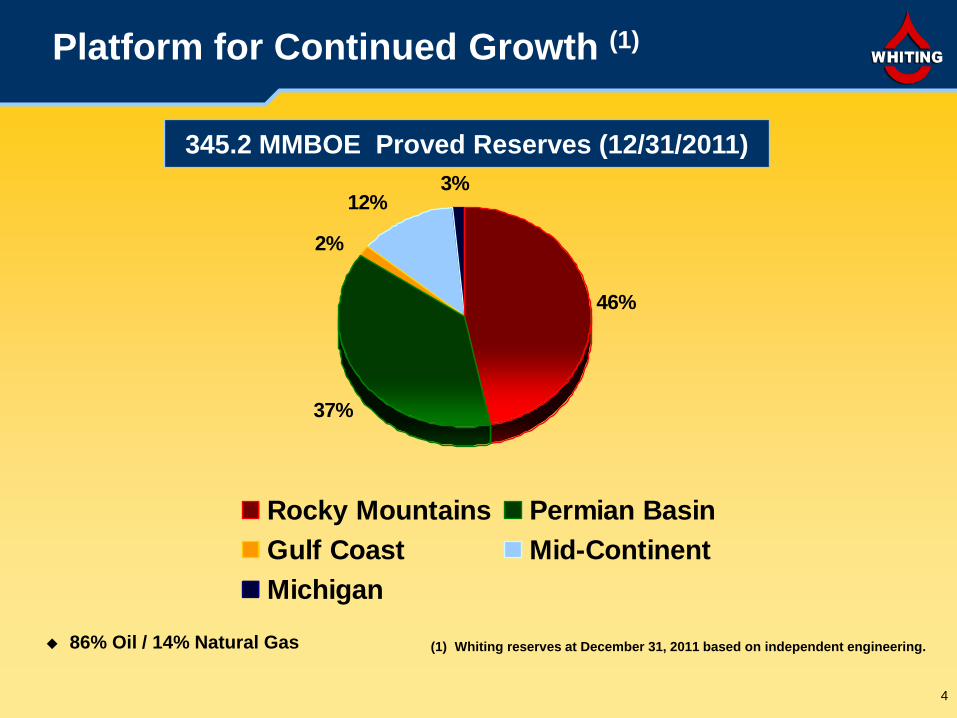
46%
2%
12%3%
37%
Rocky Mountains Permian Basin
Gulf Coast Mid-Continent
Michigan
Platform for Continued Growth (1)
345.2 MMBOE Proved Reserves (12/31/2011)
86% Oil / 14% Natural Gas
(1) Whiting reserves at December 31, 2011 based on independent engineering.
4

Whiting Pre-Tax PV10% Values at December 31, 2011 (1)
- Using SEC NYMEX of $96.19/Bbl and $4.12/Mcf Held Flat
Proved Reserves (1)
Core Area
Oil (MMBbl)(2)
Natural Gas (Bcf)
Total (MMBOE)
%
Oil(2)
Pre-Tax PV10% Value(3)
(In MM)
Rocky Mountains 132.2 162.3 159.2 83% $ 4,157.1
Permian Basin 122.5 38.1 128.8 95% $2,011.6
Other(4) 43.1 84.6 57.2 75% $1,236.0
Total 297.8 285.0 345.2 86% $ 7,404.7
(1) Oil and gas reserve quantities and related discounted future net cash flows have been derived from oil and gas prices calculated using an average
of the first-day-of-the month NYMEX price for each month within the 12 months ended December 31, 2011, pursuant to current SEC and FASB
guidelines. The NYMEX prices used were $96.19/Bbl and $4.12/MMBtu.
(2) Oil includes natural gas liquids.
(3) Pre-tax PV10% may be considered a non-GAAP financial measure as defined by the SEC and is derived from the standardized measure of
discounted future net cash flows, which is the most directly comparable US GAAP financial measure. Pre-tax PV10% is computed on the same
basis as the standardized measure of discounted future net cash flows but without deducting future income taxes. As of December 31, 2011, our
discounted future income taxes were $2,132.2 million and our standardized measure of after-tax discounted future net cash flows was $5,272.5
million. We believe pre-tax PV10% is a useful measure for investors for evaluating the relative monetary significance of our oil and natural gas
properties. We further believe investors may utilize our pre-tax PV10% as a basis for comparison of the relative size and value of our proved
reserves to other companies because many factors that are unique to each individual company impact the amount of future income taxes to be
paid. Our management uses this measure when assessing the potential return on investment related to our oil and gas properties and
acquisitions. However, pre-tax PV10% is not a substitute for the standardized measure of discounted future net cash flows. Our pre-tax PV10%
and the standardized measure of discounted future net cash flows do not purport to present the fair value of our proved oil and natural gas
reserves.
(4) Other consists of Mid-Continent, Michigan, and Gulf Coast.
5

Probable Reserves (1)
Core Area
Oil (MMBbl)(2)
Natural Gas
(Bcf) Total
(MMBOE)
%
Pre-Tax PV10% Value(3)
Oil(2) (In MM)
Rocky Mountains 24.7 133.5 46.9 53% $ 375.9 Permian Basin 36.9 53.0 45.8 81% $ 576.6 Other(4) 9.2 24.4 13.2 69% $ 83.9
Total 70.8 210.9 105.9 67% $ 1,035.4
Possible Reserves (1)
Core Area
Oil (MMBbl)(2)
Natural Gas
(Bcf) Total
(MMBOE)
%
Pre-Tax PV10% Value(3)
Oil(2) (In MM)
Rocky Mountains 59.2 150.0 84.3 70% $ 1,086.9 Permian Basin 101.9 8.9 103.3 99% $ 861.0 Other(4) 3.0 28.3 7.7 39% $ 75.9
Total 164.1 187.2 195.3 84% $ 2,023.8
(1) Oil and gas reserve quantities and related discounted future net cash flows have been derived from oil and gas prices calculated using an average of the
first-day-of-the month NYMEX price for each month within the 12 months ended December 31, 2011, pursuant to SEC and FASB guidelines. The
NYMEX prices used were $96.19/Bbl and $4.12/MMBtu.
(2) Oil includes natural gas liquids.
(3) Pre-tax PV10% amounts above represent the present value of estimated future revenues to be generated from the production of probable or possible
reserves, calculated net of estimated lease operating expenses, production taxes and future development costs, using costs as of the date of estimation
without future escalation and using 12-month average prices, without giving effect to non-property related expenses such as general and administrative
expenses, debt service and depreciation, depletion and amortization, or future income taxes and discounted using an annual discount rate of 10%. With
respect to pre-tax PV10% amounts for probable or possible reserves, there do not exist any directly comparable US GAAP measures, and such amounts
do not purport to present the fair value of our probable and possible reserves.
(4) Other consists of Mid-Continent, Michigan, and Gulf Coast.
Whiting Pre-Tax PV10% Values at December 31, 2011 (1)
- Using SEC NYMEX of $96.19/Bbl and $4.12/Mcf Held Flat
6

(1) Oil and gas reserve quantities and related discounted future net cash flows have been derived from oil and gas prices calculated using an average of the
first-day-of-the month NYMEX price for each month within the 12 months ended December 31, 2011, pursuant to SEC and FASB guidelines. The
NYMEX prices used were $96.19/Bbl and $4.12/MMBtu.
(2) Oil includes natural gas liquids.
(3) Pre-tax PV10% amounts above represent the present value of estimated future revenues to be generated from the production of resource potential
reserves, calculated net of estimated lease operating expenses, production taxes and future development costs, using costs as of the date of estimation
without future escalation and using 12-month average prices, without giving effect to non-property related expenses such as general and administrative
expenses, debt service and depreciation, depletion and amortization, or future income taxes and discounted using an annual discount rate of 10%. With
respect to pre-tax PV10% values of resource potential reserves, there do not exist any directly comparable US GAAP measures and such amounts do
not purport to present the fair value of our resource potential reserves.
(4) Resource potential of 148 MMBOE from the ROZ in the North Ward Estes field not reflected in this table as we await results from our initial pilot expected
by year-end 2012.
(5) Other consists of Mid-Continent, Michigan, and Gulf Coast.
Resource Potential (1)
Core Area
Oil (MMBbl)(2)
Natural Gas
(Bcf) Total
(MMBOE)
%
Pre-Tax PV10% Value(3)
Oil(2) (In MM)
Rocky Mountains 297.4 506.7 381.9 78% $ 3,945
Permian Basin (4) 59.9 86.1 74.2 81% $ 707
Other (5) 7.4 91.8 22.6 32% $ 82
Total 364.7 684.6 478.7 76% $ 4,734
Whiting Pre-Tax PV10% Values at December 31, 2011 (1)
- Using SEC NYMEX of $96.19/Bbl and $4.12/Mcf Held Flat
7

Future Drilling Locations as of December 31, 2011(1)
8
(1) Please refer to the beginning of this presentation for disclosures regarding “Forward Looking Statements” and “Reserve and Resource Information”.
(2) Includes 203 gross (108 net) PUD locations.
Total 3P Drilling Locations
Gross Net
Northern Rockies(2) 707 334
Central Rockies 421 283
Permian Basin 838 338
Mid-Continent 210 189
Gulf Coast 72 58
Michigan 16 13
Total 2,264 1,215
Total Resource Drilling Locations
Gross Net
Northern Rockies 1,839 640
Central Rockies 1,416 889
Permian Basin 417 307
Mid-Continent 6 1
Gulf Coast 34 31
Michigan 29 22
Total 3,741 1,890

Capital Budget for Key Development
Areas in 2012 ($ in millions)
(1) These multi-year CO2 projects involve many re-entries, workovers and conversions. Therefore, they are budgeted on a project basis not a well basis.
(2) Comprised primarily of exploration salaries, lease delay rentals, seismic, other exploration and development and timing adjustments.
Land
$163MM
Central Rockies
$85MM
Permian
$97MM
EOR
$177MM
Exploration
Expense(2)
$56MM
Facilities
$238MM
Non-Op
$133MM
Northern Rockies
$851MM
9
2012 CAPEX (MM $) %
Gross Wells
Net Wells
Northern Rockies $851 47% 218 124
EOR $177 10% NA(1) NA(1)
Permian $97 6% 19 19
Central Rockies $85 5% 20 16
Non-Operated $133 7%
Land $163 9%
Exploration Expense (2) $56 3%
Facilities $238 13% Total Budget $1,800 100% 257 159

All Whiting Lease Areas In Williston Basin Plays at
March 31, 2012
(1) As of 03/31/2012, Whiting’s total acreage cost in
701,751 net acres is approximately $336 million, or
$479 per net acre.
MISSOURI
BREAKS
LEWIS
& CLARK
CASSANDRA
BIG
ISLAND
SANISH &
PARSHALL
10
8 6
4
2
1
9
7
5
A‟
A
STARBUCK
HIDDEN
BENCH
TARPON 3
Gross Acres Net Acres
Sanish / Parshall 177,001 83,011
- Middle Bakken / Three Forks Objectives
Pronghorn 170,870 121,403
- Pronghorn Sand Objective
Lewis & Clark 209,564 138,370
- Three Forks Objective
Hidden Bench 49,941 30,036
- Middle Bakken / Three Forks Objectives
Tarpon 8,187 6,359
- Middle Bakken / Three Forks Objectives
Starbuck 104,854 91,497
- Middle Bakken / Three Forks Objectives
Missouri Breaks 96,836 57,762
- Middle Bakken / Three Forks Objectives
Cassandra 30,427 13,794
- Middle Bakken / Three Forks Objectives
Big Island 168,786 121,673
- Multiple Objectives
Other ND & Montana 113,856 37,846
1,130,322 701,751(1)
Pronghorn
10

Whiting Drilling Objectives in the Western Williston Basin
-- Shooting for the “Sweet Spots”
A‟ A
Please note dual targets in the Middle Bakken and
Pronghorn Sand / Upper Three Forks
11

12
Typical Bakken Production Profiles Sanish Field (1) (2)
Production Profiles in Oil Equivalents
Bakken - Sanish
10
100
1,000
10,000
0 12 24 36 48 60 72 84 96 108 120 132 144 156 168 180
Months On Production
Eq
uiv
ale
nt
Daily P
rod
ucti
on
BO
E/D
EUR - 950 MBOE
EUR - 450 MBOE
EUR - 950 MBOE, CAPEX $6MM
Nymex oil price/Bbl $80 $90 $100
ROI 6.7:1 7.7:1 8.8:1
IRR (%) 498% 809% 1,303%
Payout (Yrs.) 0.6 0.5 0.5
PV(10) $MM 19.43 23.31 27.19
EUR - 450 MBOE , CAPEX $6MM
Nymex oil price/Bbl $80 $90 $100
ROI 2.7:1 3.2:1 3.7:1
IRR (%) 70% 104% 148%
Payout (Yrs.) 1.4 1.0 0.9
PV(10) $MM 5.46 7.36 9.27
(1) Please refer to the beginning of this presentation for disclosures regarding "Reserve and Resource Information." All volumes shown are un-risked. Our
pretax PV10% values do not purport to present the fair value of our oil and natural gas reserves.
(2) EURs, ROIs, IRRs and PV10% values will vary well to well. Whiting holds an average WI of 60% and an average NRI of 50% in its operated Bakken wells in
Sanish field.

13
Typical Three Forks Production Profile Sanish Field (1) (2)
Production Profile in Oil Equivalents
Three Forks - Sanish
10
100
1,000
0 12 24 36 48 60 72 84 96 108 120 132 144 156 168 180
Months On Production
Eq
uiv
ale
nt
Da
ily
Pro
du
cti
on
BO
E/D
EUR - 400 MBOE
EUR - 400 MBOE , CAPEX $6 MM
Nymex oil price/Bbl $80 $90 $100
ROI 2.5:1 2.9:1 3.4:1
IRR (%) 50% 73% 105%
Payout (Yrs.) 1.8 1.4 1.1
PV(10) $MM 4.35 6.07 7.79
(1) Please refer to the beginning of this presentation for disclosures regarding "Reserve and Resource Information." All volumes shown are un-risked. Our pre-
tax PV10% values do not purport to present the fair value of our oil and natural gas reserves.
(2) EURs, ROIs, IRRs and PV10% values will vary well to well. Whiting holds an average WI of 60% and an average NRI of 50% in its operated Three Forks
wells in Sanish field.

Typical Non-Sanish Field Bakken or Pronghorn
Sand / Three Forks Well Expected Results(1)
10
100
1000
0 20 40 60 80 100 120 140 160 180
Daily E
qu
av
ale
nt
Oil R
ate
B
OE
/d
Months on Production
EUR – 600 MBOE
(Avg 1st 30 days 830 BOE/d)
EUR – 350 MBOE
(Avg 1st 30 days 430 BOE/d)
(1) Please refer to the beginning of this presentation for disclosures regarding "Reserve and Resource Information." All volumes shown are un-risked. Our pre-
tax PV10% values do not purport to present the fair value of our oil and natural gas reserves.
Oil Price ($/Bbl) 90.00 100.00
ROI 3.7 4.2
Payout (yrs) 0.9 0.8
PV10 ($MM) 11.03 13.28
IRR 155% 213%
Oil Price ($/Bbl) 90.00 100.00
ROI 2.0 2.3
Payout (yrs) 2.3 1.9
PV10 ($MM) 3.23 4.57
IRR 35% 47%
EUR 350 MBOE, Capex $7.0 MM
EUR 600 MBOE, Capex $7.0 MM
14

Average IP and 30, 60, 90 Day Production(1) of 2011
Whiting Operated Sanish Bakken and Pronghorn Wells
15 (1) All wells drilled and completed in the year 2011.
2,017
803 650 589
1,783
772 659
577
-
500
1,000
1,500
2,000
2,500
IP BOEPD 30 Day 60 Day 90 Day
2011 Sanish Bakken Wells 2011 Pronghorn Wells

Six Month Cumulative Production by Operator
For Bakken and Three Forks Wells Drilled Since January 2009
& Operators with Greater that 10 Wells Producing
Source: IHS Energy, Inc. & North Dakota Industrial Commission (As of April, 2012)
16
6 month Avg Production

TransCanada
Keystone XL
Existing Pipelines
Proposed Pipelines
Williston Basin Off-Take Expansion (1)
(1) Projected additions based on publicly available information. 17
All Volumes Barrels per Day Existing Capacity 2012 2013
Total Additions Additions
Enbridge 210,000 145,000 Q4 355,000
Bridger / Belle Fourche 200,000 100,000 Q1 300,000
Tesoro /Mandan 60,000 60,000
EOG (rail) 60,000 60,000
Plains 50,000 Q4 50,000
Hess (rail) 60,000 60,000
COLT (rail) 27,000 Q2 27,000
Lario (rail) 100,000 100,000 Q3 200,000
Savage (rail) 90,000 Q2 90,000
Quintana (rail) 90,000 Q1 90,000
Total 690,000 412,000 190,000 1,292,000

Big Tex Prospect Pecos, Reeves and Ward Counties, Texas
OBJECTIVE
Vertical Wolfbone
Hz. Wolfcamp & Hz. Bone Spring
ACREAGE
Whiting has assembled 118,356
gross (87,599 net) acres in our
Big Tex prospect in the
Delaware Basin:
• Average WI of 76%
• Average NRI of 57%
• Well by well WI and NRI will
vary based on ownership in
each spacing unit
COMPLETED WELL COST
Vertical: $3 MM - $4.5 MM
Horizontal: $5 MM
DRILLING PROGRAM
Recently completed the Stewart
101 with a 24-hr IP of 232 BOE/d
from a vertical Wolfcamp
wellbore and the Big Tex North
301H with a 24-hr IP of 440
BOE/d from a horizontal
Wolfcamp wellbore. Due to
these favorable results, we plan
to increase our 2012 drilling
program to 17 wells from 13
wells.
18
Stewart 101
IP: 232 BOE/D Big Tex North 301H
IP: 440 BOE/d

Redtail Niobrara Prospect Weld County, Colorado
OBJECTIVE
Niobrara Shale
ACREAGE
Whiting has assembled 97,267
gross (74,808 net) acres in our
Redtail prospect in the
northeastern portion of the DJ
Basin
• Average WI of 70%
• Average NRI of 57%
• Well by well WI and NRI will
vary based on ownership in
each spacing unit
COMPLETED WELL COST
Horizontal: $4 to $5.5 MM
DRILLING PROGRAM
Recently completed the
Wildhorse 16-42H with a 24-hr IP
of 430 BOE/d and the Wolf 35-
2623H with a 24-hr IP of 426
BOE/d. Due to these favorable
results, we plan to increase our
2012 drilling program to 17 wells
from 8 wells.
Redtail 74,808 Net Acres
.
Wild Horse 16-13H
General trend of Colorado Mineral Belt
.
19
Horsetail 18-0733H
. .
Wolf 35-2623H
Wild Horse 16-42H
.

Whiting Postle
N. Ward Estes Total
Whiting
% Postle N. Ward
Estes
12/31/11 Proved Reserves(1)
Oil – MMBbl 167 131 298 44%
Gas – Bcf 263 22 285 8% Total – MMBOE 210 135
(2) 345
(3) 39%
(2)
% Crude Oil 79% 97% 86%
Q1 2012 Production
Total – MBOE/d 63.6 17.1 80.7 21% (1)
Based on independent engineering by Cawley, Gillespie & Associates, Inc. at December 31, 2011. (2)
Includes Ancillary Properties
EOR Projects - Postle and North Ward Estes Fields
Headquarters
Field Office
Whiting Properties
North Ward Estes & Ancillary Fields
Postle Field
CO2 Pipeline
MID-CONTINENT McElmo
Dome
Bravo
Dome
DENVER CITY PERMIAN
20
(3) Since their acquisition in late 2004 and early 2005, through December 31, 2011 Postle and North Ward Estes have produced
32.8 MMBOE net to Whiting.

8,830 BOE/d
0
5
10
15
20
25
North Ward Estes 3P Unrisked Production Forecast (2)
Proved
P1 + P2
P1 + P2 + P3
2012
Jun
„05 Q1.
„12 2020
315 – 335 MMcf/d
Current CO2 Injection
(1) Based on independent engineering by Cawley, Gillespie & Associates, Inc. at December 31, 2011. Includes ancillary fields. Please refer to the beginning of this presentation for disclosures
regarding "Reserve and Resource Information." All volumes shown are unrisked.
(2) Production forecasts based on assumptions in December 31, 2011 reserve report. After 2020, North Ward Estes field proved reserve production is expected to decline at 5% - 7% year over year.
North Ward Estes - Net Production Forecasts (1)
Magnitude and timing of results could vary.
Pro
du
cti
on
Rate
Mb
oe/d
21

(1) Based on independent engineering at Dec. 31, 2011. Please refer to the beginning of the presentation for
disclosures regarding “Reserve and Resource Information.” All volumes shown are unrisked. 22
Development Plans – North Ward Estes Field Ward and Winkler Counties, Texas
58,000 Net Acres
Project Timing and Net Reserves (1)
Injection
CO2 Project Start Date
2007 - 2008
2009 - 2010
2010 - 2015
2011
2012 - 2015
2015
2016
2016
Totals (MMBOE)
Phase 2
Phase 3
Phase 4
Phase 5
Phase 6
Phase 7
Phase 8
Base: Primary,
WF & CO2
Phase 1
PVPD
Other
Proved P2 P3 Total
44 4 6 60 114
0 2 2 2 6
0 0 2 4 6
0 25 4 8 37
0 4 1 1 6
0 3 9 9 21
0 10 2 3 15
0 5 1 1 7
0 3 0 1 4
44 56 27 89 216

58,000 Net Acres
Phase 1 2007 - 2008
2009 - 2010
2010 - 2015
2011
2012 - 2015
2015
2016
2016
Phase 2
Phase 3
Phase 4
Phase 5
Phase 6
Phase 7
Phase 8
Injection
CO2 Project Start Date
Development Plans – North Ward Estes Field Ward and Winkler Counties, Texas
Total 2012 - 2040 Remaining
Capital Expenditures (1)
(In Millions)
CapEx (2)
Drilling, Completion, Workovers
& Gas Plant Costs $ 515
CO2 Purchases 1,439
Total $1,954
(1) Based on independent engineering at Dec. 31, 2011.
(2) Consists of CapEx for Proved, Probable and Possible reserves. Please refer to the beginning
of this presentation for disclosures regarding "Reserve and Resource Information."
23

Consistently Strong Margins
(1) Includes hedging adjustments.
$0.00
$10.00
$20.00
$30.00
$40.00
$50.00
$60.00
$70.00
$80.00
2005 2006 2007 2008 2009 2010 2011 Q1 12
20% 24% 27% 20% 26% 18% 17% 18% 7%
6% 7% 7%
7% 7% 8% 8% 6% 5%
5% 5%
5% 5% 5%
2%
3% 4%
3% 3%
5% 2% 2%
6%
$28.73/64%
$30.82/61% $31.29/58%
$45.10/65%
$25.71/57%
$41.58/68%
$50.65/68%
$49.19/66%
Lease Operating Expense Production Taxes G&A Exploration Expense EBITDA
Wh
itin
g R
ea
lize
d P
ric
es
(1)
$/B
OE
Consistently Delivering Strong EBITDA Margins (1)
$44.70 $50.52 $53.57
$69.06
$45.01
$61.48
$90.51/Bbl
$3.43/Mcf
$74.17/BOE
24
$73.88

Steady Production Growth
2005 2006 2007 2008 2009 2010 2011 2012E
33.1 41.5 40.3
47.9 55.5
64.6 67.9 80.9
Production A
ve
rag
e D
ail
y P
rod
ucti
on
(M
BO
E/d
) 12% CAGR Production 2005 – 2012E(1)
25
(1) Represents the mid-point of 2012 full year production guidance range

Total Capitalization ($ in thousands)
Mar. 31, Dec. 31,
2012 2011
Cash and Cash Equivalents $ 9,825 $ 15,811
Long-Term Debt:
Credit Agreement $ 640,000 $ 780,000
Senior Subordinated Notes 600,000 600,000
Total Long-Term Debt $1,240,000 $1,380,000
Stockholders‟ Equity 3,116,932 3,020,857
Total Capitalization $4,356,932 $4,400,857
Total Debt / Total Capitalization 28.5% 31.4%
26

Outstanding Bonds and Credit Agreement
7.00% / Sr. Sub. – NC
Coupon / Description Amount
02/01/2014
Outstanding Maturity Ratings
Moody‟s / S&P
$250.0 mil. Ba3 / BB+
6.50% / Sr. Sub. – NC4 10/01/2018 $350.0 mil. Ba3 / BB+
● Bond Finance Covenant: Ratio of pre-tax earnings to fixed charges (interest expense) must be greater than
2:1. It was 14.23:1 at 3/31/12.
● Restricted Payments Basket: Approximately $2.1 billion.
● Bank Credit Agreement size is $1.5 billion under which $640 million was drawn as of 3/31/12. Weighted average
interest rate is currently 2.13%. Redetermination date is 5/1/12.
● Bank Credit Agreement Covenants: Total debt to EBITDAX at 3/31/12 was 0.89:1 (must be less than 4.25:1)
Working capital at 3/31/12 was 2.05:1 (must be greater than 1:1)
Price
106.750
106.375
3/31/12
27

Oil weighted, long-lived reserve base Reserves 86% oil; 13.9 year R/P (1)
Multi-year inventory to drive organic production growth
2,264 3P and 3,741 Resource future drilling locations; Project 17 - 22% YoY production growth in 2012
Disciplined acquirer with strong record of accretive acquisitions
16 acquisitions in 2004 – 2011; 230.9 MMBOE at $8.23 per BOE average acquisition cost; Acquired 701,751 acres in the Williston Basin 2005 – 2012; $479 per acre average
Commitment to financial strength Total Debt to Cap of 28.5% as of March 31, 2012
Proven management and technical team Average 28 years of experience
In Summary
(1) Percent oil reserves and R/P ratio based on year-end 2011 proved reserves and total 2011 production. 28

Guidance for Q2 and Full-Year 2012(1)
29
(1) Includes the effect of Whiting’s fixed-price gas contracts. Please refer to fixed-price gas contracts in this presentation.
Guidance
Second Quarter Full-Year
2012 2012
Production (MMBOE) 7.00 - 7.40 29.00 - 30.20
Lease operating expense per BOE $ 12.20 - $ 12.50 $ 12.30 - $ 12.60
General and admin. expense per BOE $ 3.70 - $ 3.90 $ 4.00 - $ 4.20
Interest expense per BOE $ 2.45 - $ 2.65 $ 2.45 - $ 2.65
Depr., depletion and amort. per BOE $ 21.30 - $ 21.70 $ 21.50 - $ 21.80
Prod. taxes (% of production revenue) 8.0% - 8.2% 8.0% - 8.3%
Oil price differentials to NYMEX per Bbl ($ 12.50) - ($ 13.50) ($ 12.00) - ($ 13.00)
Gas price premium to NYMEX per Mcf (1) $ 0.60 - $ 0.90 $ 0.60 - $ 0.90

Hedge Period
Contracted Volume (Bbls per
Month)
Weighted Average NYMEX Price Collar
Range (per Bbl)
As a Percentage of March 2012
Oil Production Hedge Period
Contracted Volume (MMBtu
per Month)
Weighted Average NYMEX Price Collar Range (per MMBtu)
As a Percentage of March 2012
Gas Production
2012 2012
Q2 988,690 $66.69 - $108.62 45.2% Q2 32,477 $6.00 - $13.60 1.4%
Q3 988,440 $66.69 - $108.62 45.2% Q3 31,502 $6.00 - $14.45 1.4%
Q4 988,157 $66.69 - $108.61 45.2% Q4 30,640 $7.00 - $13.40 1.3%
2013
Q1 294,560 $48.17 - $90.71 13.5%
Q2 294,550 $48.17 - $90.71 13.5%
Q3 294,450 $48.16 - $90.70 13.5%
Oct 294,340 $48.15 - $90.69 13.5%
Nov 194,340 $47.96 - $85.90 8.9%
Dec 4,340 $80.00 - $122.50 0.2%
2014
Q1 4,250 $80.00 - $122.50 0.2%
Q2 4,150 $80.00 - $122.50 0.2%
Q3 4,060 $80.00 - $122.50 0.2%
Q4 3,970 $80.00 - $122.50 0.2%
Existing Crude Oil Hedge Positions(1)
Disciplined Hedging Strategy
Utilize hedges to manage exposure against potential commodity price declines while maintaining pricing upside
Employ mix of contracts weighted toward the short-term
Existing Natural Gas Hedge Positions(1)
(1) As of April 1, 2012.
30

Fixed-Price Marketing Contracts
Existing Natural Gas Marketing Contracts(1)
31
(1) As of April 1, 2012.
Weighted Average As a Percentage of
Hedge Contracted Volume Contracted Price March 2012
Period (MMBtu per Month) (per MMBtu) Gas Production
2012
Q2 461,296 $5.41 20.1%
Q3 465,630 $5.41 20.3%
Q4 398,667 $5.46 17.4%
2013
Q1 360,000 $5.47 15.7%
Q2 364,000 $5.47 15.9%
Q3 368,000 $5.47 16.0%
Q4 368,000 $5.47 16.0%
2014
Q1 330,000 $5.49 14.4%
Q2 333,667 $5.49 14.5%
Q3 337,333 $5.49 14.7%
Q4 337,333 $5.49 14.7%

Adjusted Net Income (1)
(In Thousands)
Reconciliation of Net Income Available to Common Shareholders to
Adjusted Net Income Available to Common Shareholders
(1) Adjusted Net Income Available to Common Shareholders is a non-GAAP financial measure. Management believes it provides useful information to investors for analysis of Whiting’s fundamental business on a recurring basis. In addition, management believes that Adjusted Net Income Available to Common Shareholders is widely used by professional research analysts and others in valuation, comparison, and investment recommendations of companies in the oil and gas exploration and production industry, and many investors use the published research of industry research analysts in making investment decisions. Adjusted Net Income Available for Common Shareholders should not be considered in isolation or as a substitute for net income, income from operations, net cash provided by operating activities or other income, cash flow or liquidity measures under US GAAP and may not be comparable to other similarly titled measures of other companies..
32
Three Months Ended
March 31, 2012 2011
Net Income Available to Common Shareholders $ 98,201 $ 19,144
Adjustments Net of Tax: Amortization of Deferred Gain on Sale (2,346) (2,121)
Impairment Expense 11,151 4,812
One-time Charge Under Production Participation
Plan Related to Trust II Offering 5,928 - Unrealized Derivative Losses 9,095 77,833
Adjusted Net Income (1) $ 122,029 $ 99,668
Adjusted Net Income Available to Common Shareholders per Share, Basic $ 1.04 $ 0.85
Adjusted Net Income Available to Common Shareholders per Share, Diluted $ 1.03 $ 0.84

Discretionary Cash Flow (1)
Reconciliation of Net Cash Provided by Operating Activities to
Discretionary Cash Flow (In Thousands)
(1) Discretionary cash flow is computed as net income plus exploration and impairment costs, depreciation, depletion and amortization, deferred income taxes, non-
cash interest costs, losses on early extinguishment of debt, non-cash compensation plan charges, non-cash losses on mark-to-market derivatives and other non-
current items, less the gain on sale of properties, amortization of deferred gain on sale, non-cash gains on mark-to-market derivatives, and preferred stock
dividends paid, not including preferred stock conversion inducements. The non-GAAP measure of discretionary cash flow is presented because management
believes it provides useful information to investors for analysis of the Company’s ability to internally fund acquisitions, exploration and development.
Discretionary cash flow should not be considered in isolation or as a substitute for net income, income from operations, net cash provided by operating activities
or other income, cash flow or liquidity measures under US GAAP and may not be comparable to other similarly titled measures of other companies.
33
Three Months Ended
March 31, 2012 2011
Net cash provided by operating activities $352,992 $214,055
Exploration 9,744 14,599
Exploratory dry hole costs (251) (2,902) Changes in working capital (10,310) 58,598
Preferred stock dividends paid (269) (270) Discretionary cash flow (1) $351,906 $284,080