Embed Size (px)
Citation preview
MC Workforce Investment Board
Occupational Trends in Montgomery County, Maryland: 2012 – 2017
Stephen S. Fuller, Ph.D.Dwight Schar Faculty Chair and University Professor
Director, Center for Regional AnalysisGeorge Mason University
April 4, 2013

Montgomery County, MD: Growth Potential Summary: 2012-2017
(in billions of 2012 $s, jobs in thousands)
Indicator 2012 2017 Change
GRP Growth $68.7 $79.5 15.8%
Net Job Growth38,934
5.9%
Replacement Job Growth
77,677 T=116,611
11.8% T=17.8%
Resident Workforce Growth 548,454 578,241 29,787
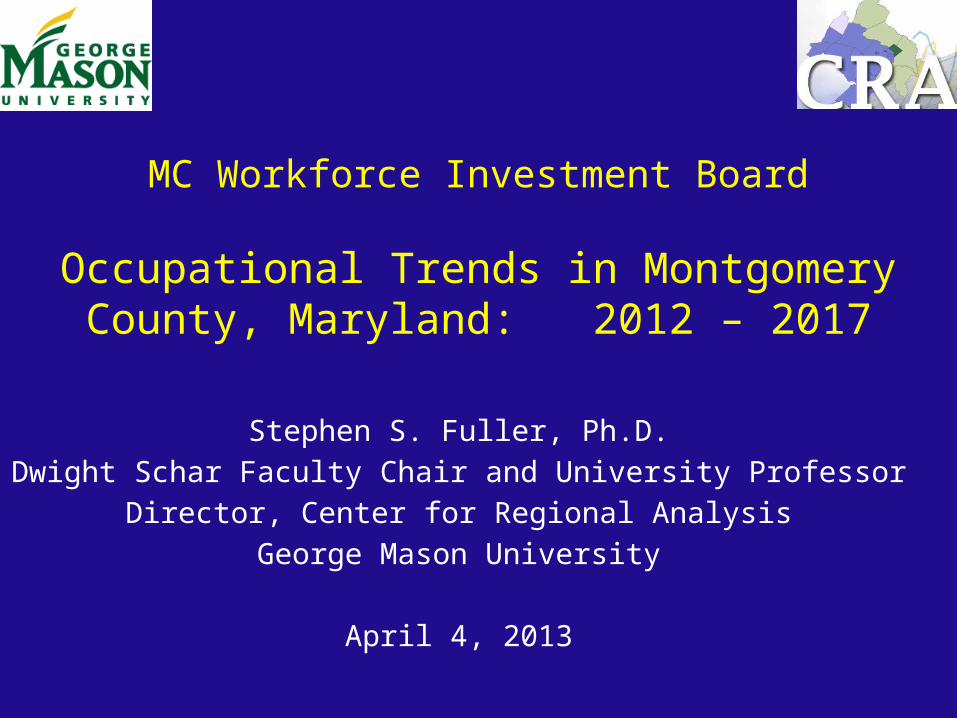
Montgomery County, MD: Major Sources ofWorkforce Demand, 2012-2017
Occupation 2 Digit SOC Openings % Total % ChangeSales and Related Occupations 15,173 13% 19%Business and Financial Operations Occupations 12,613 11% 21%Healthcare (all) 11,989 10% 22%Office and Administrative Support Occupations 11,377 10% 14%Management Occupations 8,379 7% 16%Food Preparation and Serving Related Occupations 7,808 7% 25%Personal Care and Service Occupations 7,198 6% 24%Building and Grounds Cleaning and Maintenance Occupations 5,725 5% 18%Education, Training, and Library Occupations 5,662 5% 18%Arts, Design, Entertainment, Sports, and Media Occupations 4,795 4% 17%Construction and Extraction Occupations 4,022 3% 16%
Totals 94,741 81%Total, All 116,611 100% 18%

Montgomery County, MD: Major Sources ofNet New Jobs 2012-2017
Occupation 2 Digit SOC Net New % Total % ChangeHealthcare (all) 6,907 18% 13%Business and Financial Operations Occupations 6,735 17% 11%Personal Care and Service Occupations 3,703 10% 12%Sales and Related Occupations 3,055 8% 4%Building and Grounds Cleaning and Maintenance Occupations 2,850 7% 9%Management Occupations 2,558 7% 5%Education, Training, and Library Occupations 2,284 6% 7%Food Preparation and Serving Related Occupations 1,855 5% 6%Life, Physical, and Social Science Occupations 1,379 4% 9%Office and Administrative Support Occupations 1,296 3% 2%Arts, Design, Entertainment, Sports, and Media Occupations 1,249 3% 4%
Totals 33,871 87%Total, All 38,934 100% 6%

Montgomery County, MD: Major Sources ofReplacement Jobs, 2012-2017
Occupation 2 Digit SOC Replacement % Total % Change
Sales and Related Occupations 12,118 16% 15%
Office and Administrative Support Occupations 10,081 13% 12%
Food Preparation and Serving Related Occupations 5,953 8% 19%
Business and Financial Operations Occupations 5,878 8% 10%
Management Occupations 5,821 7% 11%
Healthcare (all) 5,082 7% 9%
Arts, Design, Entertainment, Sports, and Media Occupations 3,546 5% 13%
Personal Care and Service Occupations 3,495 4% 11%
Education, Training, and Library Occupations 3,378 4% 11%
Construction and Extraction Occupations 3,030 4% 12%
Computer and Mathematical Occupations 3,016 4% 9%
Totals 61,398 79%
Total, All 77,677 100% 12%

Educational Levels of Net New andReplacement Jobs, Montgomery County, MD
2012 – 2017 (percent)% of Net New % of Replacement % of Openings
Bachelors+ 35.3% 26.9% 29.7%Short OJT 23.1% 38.1% 33.1%
Postsecondary 11.8% 6.4% 8.2%Work Experience 9.7% 8.4% 8.8%
Medium OJT 6.3% 8.3% 7.6%Long OJT 5.1% 5.6% 5.5%
Associates 4.5% 4.0% 4.2%Professional 3.3% 2.2% 2.6%
Total Number 38,934 77,677 116,611
Total Jobs of 2017 694,758

Average Hourly Earning by % Net New Jobs in Montgomery County, MD 2012 – 2017
$0-$14.99 $15-$29.99 $30-$44.99 $45-$59.99 $60-$74.99 $75+0%
5%
10%
15%
20%
25%
30%
35%

$0-$14.99 $15-$29.99 $30-$44.99 $45-$59.99 $60-$74.99 $75+0%
5%
10%
15%
20%
25%
30%
35%
40%
Average Hourly Earning by % Replacement Jobs in Montgomery County, MD 2012 – 2017

Bachelors+; $8,068,067.70
Short OJT; $3,051,878.14Related Work Experience;
$1,564,557.93
Moderate OJT; $1,251,138.57
Professional; $1,146,126.86
Long OJT; $999,597.58
Postsec-ondary;
$836,662.74Associates; $809,980.14
Share of Average Hourly Earnings
Calculated as Average Hourly Earnings multiplied by number of jobs at each education level for 2017.
Average Hourly Earning of all Jobs by Education Levels in Montgomery County, MD 2017

SOC Occupation Net New % Total % ChangeBuilding & Grounds Cleaning & Maintenance Occupations 2,630 7% 9%
37-2011 Janitors & Cleaners, Except Maids & Housekeeping 1,404 4% 11%37-3011 Landscaping and Groundskeeping Workers 931 2% 19%37-2012 Maids and Housekeeping Cleaners 231 1% 13%
Personal Care and Service Occupations 2,065 5% 12%39-9021 Personal Care Aides 982 3% 21%39-9011 Childcare Workers 455 1% 6%39-2021 Nonfarm Animal Caretakers 374 1% 11%
Healthcare Support Occupations 1,625 4% 18%31-1011 Home Health Aides 1,516 4% 33%31-9799 Healthcare Support Workers, All Other 65 0% 8%
Food Preparation and Serving Related Occupations 1,543 4% 6%
35-3021 Combined Food Preparation and Serving Workers, Including Fast Food 664 2% 10%
35-3031 Waiters and Waitresses 258 1% 4%35-2021 Food Preparation Workers 162 0% 9%35-2012 Cooks, Institution and Cafeteria 159 0% 16%
Total 7,863 20%Total, All 38,934 100% 6%
Net New Jobs with Short-Term OJT in Montgomery County, MD 2012 – 2017
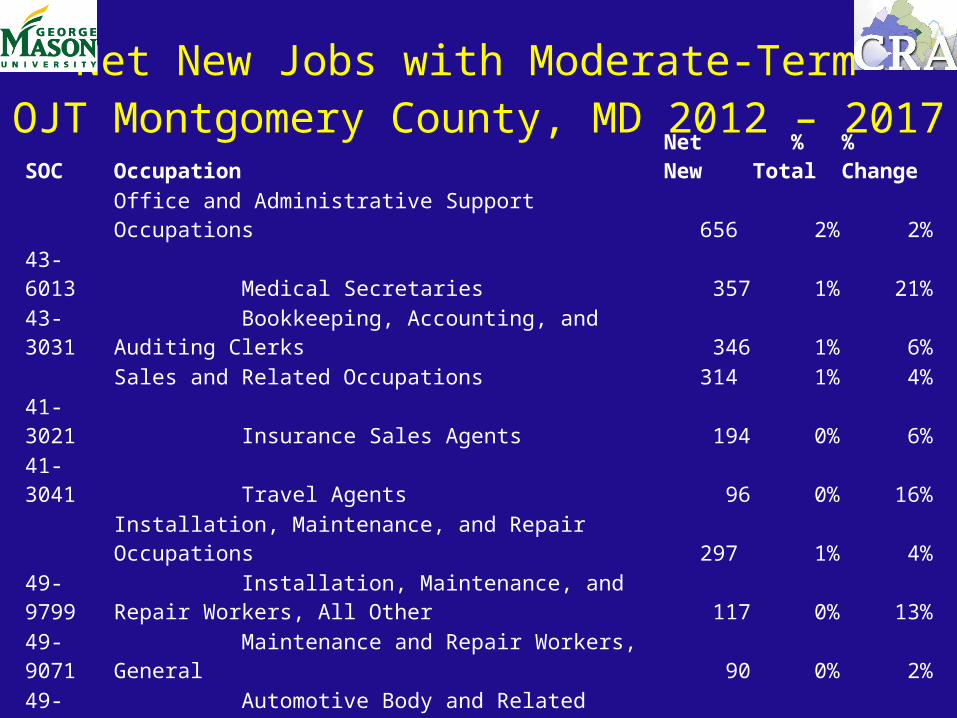
SOC Occupation Net New % Total % ChangeOffice and Administrative Support Occupations 656 2% 2%
43-6013 Medical Secretaries 357 1% 21%43-3031 Bookkeeping, Accounting, and Auditing Clerks 346 1% 6%
Sales and Related Occupations 314 1% 4%41-3021 Insurance Sales Agents 194 0% 6%41-3041 Travel Agents 96 0% 16%
Installation, Maintenance, and Repair Occupations 297 1% 4%49-9799 Installation, Maintenance, and Repair Workers, All Other 117 0% 13%49-9071 Maintenance and Repair Workers, General 90 0% 2%49-3021 Automotive Body and Related Repairers 56 0% 12%
Healthcare All 395 1% 18%31-9092 Medical Assistants 248 1% 17%29-2052 Pharmacy Technicians 94 0% 8%
Construction and Extraction Occupations 277 1% 4%47-2141 Painters, Construction and Maintenance 85 0% 4%
47-2073 Operating Engineers and Other Construction Equipment Operators 74 0% 10%
47-2081 Drywall and Ceiling Tile Installers 48 0% 8%Total 1,939 5%Total, All 38,934 100% 6%
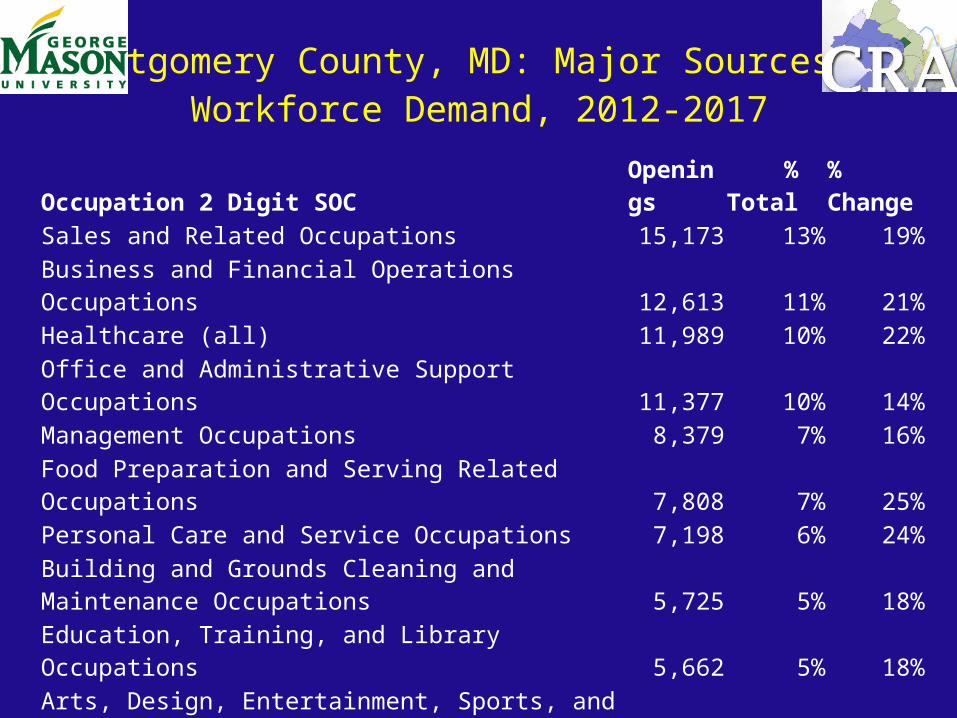
Net New Jobs with Moderate-Term OJT Montgomery County, MD 2012 – 2017

SOC Occupation Net New % Total % Change
27-0000 Arts, Design, Entertainment, Sports, and Media Occupations 885 2% 4%
27-4021 Photographers 330 1% 5%
27-2022 Coaches and Scouts 230 1% 18%
27-2042 Musicians and Singers 185 0% 9%
13-0000 Business and Financial Operations Occupations 797 2% 11%
13-1199 Business Operations Specialists, All Other 698 2% 9%
47-0000 Construction and Extraction Occupations 186 0% 4%
47-2031 Carpenters 303 1% 7%
47-2111 Electricians (224) (1%) (11%)
49-0000 Installation, Maintenance, and Repair Occupations 106 0% 4%
49-3042 Mobile Heavy Equipment Mechanics, Except Engines 46 0% 22%
49-9041 Industrial Machinery Mechanics 47 0% 18%
49-9051 Electrical Power-Line Installers and Repairers (36) (0%) (20%)
Total 1,974 5%
Total, All 38,934 100% 6%
Net New Jobs with Long-Term OJT in Montgomery County, MD 2012 – 2017
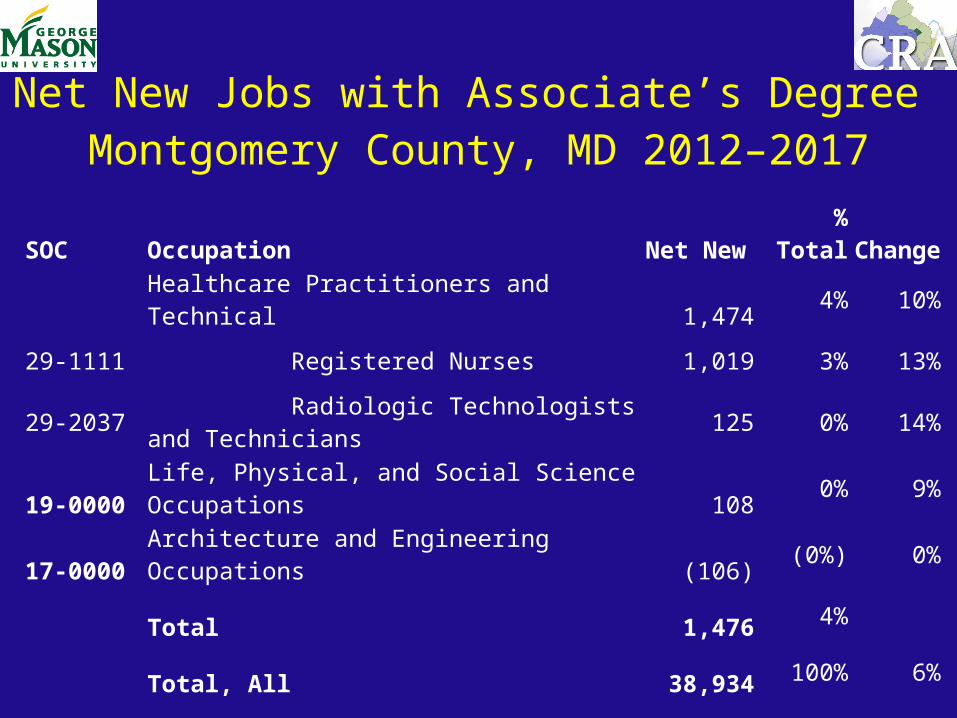
SOC Occupation Net New % Total Change
Healthcare Practitioners and Technical 1,4744% 10%
29-1111 Registered Nurses 1,019 3% 13%
29-2037 Radiologic Technologists and Technicians 125 0% 14%
19-0000 Life, Physical, and Social Science Occupations 1080% 9%
17-0000 Architecture and Engineering Occupations (106) (0%) 0%
Total 1,4764%
Total, All 38,934100% 6%
Net New Jobs with Associate’s Degree Montgomery County, MD 2012–2017

SOC Occupation Net New % Total % ChangeBusiness and Financial Operations Occupations 5,863 15% 11%
13-2052 Personal Financial Advisors 1,875 5% 27%13-1111 Management Analysts 1,680 4% 14%13-1161 Market Research Analysts and Marketing Specialists 549 1% 18%13-2011 Accountants and Auditors 465 1% 5%13-2051 Financial Analysts 221 1% 10%
Education, Training, and Library Occupations 1,395 4% 7%25-3999 Teachers and Instructors, All Other 501 1% 8%
Life, Physical, and Social Science Occupations 1,273 3% 9%19-1029 Biological Scientists, All Other 217 1% 9%
Sales and Related Occupations 1,098 3% 4%
41-3031 Securities, Commodities, and Financial Services Sales Agents 1,099 3% 22%
Management Occupations 1,017 3% 5%11-3031 Financial Managers 308 1% 8%11-1021 General and Operations Managers (230) (1%) (2%)15-0000 Computer and Mathematical Occupations 848 2% 3%21-0000 Community and Social Service Occupations 759 2% 10%29-0000 Healthcare Practitioners and Technical Occupations 753 2% 10%29-1199 Health Diagnosing and Treating Practitioners, All Other 326 1% 9%
Total 13,006 33%Total, All 38,934 100% 6%
Net New Jobs with Bachelor’s or Above in Montgomery County, MD 2012–2017

SOC Occupation Net New % Total % Change
Management Occupations 1,539 4% 5%
11-9199 Managers, All Other 679 2% 8%
11-9141 Property, Real Estate, and Community Association Managers 563 1% 9%
Education, Training, and Library Occupations 685 2% 7%
25-3021 Self-Enrichment Education Teachers 685 2% 17%
Sales and Related Occupations 492 1% 4%
41-9021 Real Estate Brokers 314 1% 9%
41-1012 First-Line Supervisors of Non-Retail Sales Workers 259 1% 11%
43-0000 Office and Administrative Support Occupations 270 1% 2%
37-0000 Building and Grounds Cleaning and Maintenance Occupations 162 0% 9%
47-0000 Construction and Extraction Occupations 160 0% 4%
35-0000 Food Preparation and Serving Related Occupations 157 0% 6%
Total 3,465 9%
Total, All 38,934 100% 6%
Net New Jobs with Related Work Experience in Montgomery County, MD 2012 – 2017

SOC OccupationReplacement %Total Change
Office and Administrative Support Occupations 7,441 25% 13%43-4051 Customer Service Representatives 1,067 4% 15%
Sales and Related Occupations 6,564 22% 19%41-2031 Retail Salespersons 2,696 9% 18%41-2011 Cashiers 2,492 8% 23%
Food Preparation and Serving Related Occupations 5,409 18% 20%35-3031 Waiters and Waitresses 1,762 6% 25%
Building and Grounds Cleaning and Maintenance 2,612 9% 9%
37-2011 Janitors, Cleaners, Except Housekeeping 1,251 4% 9%37-2012 Maids and Housekeeping Cleaners 893 3% 8%
Personal Care and Service Occupations 2,478 8% 13%39-9011 Childcare Workers 1,226 4% 16%
Transportation and Material Moving Occupations 2,353 8% 13%
53-7062 Laborers and Freight, Stock, and Material Movers, Hand 793 3% 18% Total 29,579 38%Total, All 77,677 100% 12%2017 All Jobs = 694,758
Replacement Jobs with Short-Term OJT Montgomery County, MD 2012 – 2017

SOC Occupation Replacement % Total % ChangeOffice and Administrative Support Occupations 1,349 21% 10%
43-3031 Bookkeeping, Accounting, and Auditing Clerks 346 5% 6%43-9021 Data Entry Keyers 190 3% 17%
Sales and Related Occupations 1,258 20% 13%
41-4012 Sales Representatives, Wholesale and Manufacturing, Except Technical and Scientific Products 433 7% 13%
41-3021 Insurance Sales Agents 342 5% 11%Installation, Maintenance, and Repair Occupations 802 12% 11%
49-9071 Maintenance and Repair Workers, General 402 6% 9%Production Occupations 678 11% 14%
47-0000 Construction and Extraction Occupations 640 10% 12%47-2141 Painters, Construction and Maintenance 235 4% 11%
Total 6,444 8%
Total, All 77,677 100% 12%
2017 All Jobs = 694,758
Replacement Jobs with Moderate- Term OJT Montgomery County, MD
2012 – 2017

SOC Occupation Replacement % Total ChangeConstruction and Extraction Occupations 1,480 34% 14%
47-2111 Electricians 493 11% 25%47-2031 Carpenters 476 11% 11%47-2152 Plumbers, Pipefitters, and Steamfitters 281 6% 14%
Business and Financial Operations Occupations 1,241 28% 11%13-1199 Business Operations Specialists, All Other 752 17% 10%13-1023 Purchasing Agents, Except Wholesale, Retail, Farm 254 6% 13%
Arts, Design, Entertainment, Sports, and Media 1,056 24% 9%27-4021 Photographers 300 7% 5%27-2042 Musicians and Singers 241 6% 12%
Total 4,374 6%
Total, All 77,677 100% 12%
2017 All Jobs = 694,758
Replacement Jobs with Long-Term OJT Montgomery County, MD 2012–2017

SOC Occupation Replacement % Total % ChangeHealthcare Practitioners and Technical Occupations 987 32% 9%
29-1111 Registered Nurses 709 23% 9%
Computer and Mathematical Occupations 599 19% 13%15-1159 Computer Support Specialists 599 19% 13%
Architecture and Engineering Occupations 419 14% 15%17-3011 Architectural and Civil Drafters 96 3% 22%
17-3023 Electrical and Electronics Engineering Technicians
903% 15%
Total 3,082 4%
Total, All 77,677 100% 12%
2017 All Jobs = 694,758
Replacement Jobs with Associate’s Degree in Montgomery County, MD 2012–2017

SOC Occupation Replacement % Total % ChangeBusiness and Financial Operations Occupations 4,063 19% 9%
13-1111 Management Analysts 1,008 5% 8%13-2011 Accountants and Auditors 933 4% 11%
Management Occupations 3,769 18% 12%11-1021 General and Operations Managers 1,229 6% 11%
Computer and Mathematical Occupations 2,418 12% 9%15-1121 Computer Systems Analysts 433 2% 9%
Education, Training, and Library Occupations 2,337 11% 11%25-3999 Teachers and Instructors, All Other 455 2% 8%
Arts, Design, Entertainment, Sports, and Media Occupations 2,130 10% 15%27-1024 Graphic Designers 335 2% 16%
Life, Physical, and Social Science Occupations 1,976 9% 13%19-3031 Clinical, Counseling, and School Psychologists 327 2% 16%
Architecture and Engineering Occupations 1,358 6% 13%Healthcare Practitioners and Technical Occupations 995 5% 11%
29-1199 Health Diagnosing and Treating Practitioners, All Other 339 2% 10%Sales and Related Occupations 905 4% 14%
41-3031 Securities, Commodities, and Financial Services Sales Agents 676 3% 14%
21-0000 Community and Social Service Occupations 814 4% 11% Total 20,935 27%Total, All 77,677 100% 12%
Replacement Jobs Bachelor’s orAbove in Montgomery County, MD 2012–2017

SOC Occupation Replacement % Total % Change
Management Occupations 2,054 31% 11%
11-9199 Managers, All Other 927 14% 11%11-9141 Property, Real Estate, and Community Association 632 10% 11%
Sales and Related Occupations 1,486 23% 12%
41-1011 First-Line Supervisors of Retail Sales Workers 789 12% 13%
41-9021 Real Estate Brokers 395 6% 11%41-1012 First-Line Supervisors of Non-Retail Sales Workers 302 5% 13%
Office and Administrative Support Occupations 1,132 17% 10%
43-1011 First-Line Supervisors of Office and Administrative Support Workers 740 11% 13%
43-6011 Executive Secretaries and Executive Admin Assist 392 6% 7%
Total 6,523 8%
Total, All 77,677 100% 12%
2017 All Jobs = 694,758
Replacement Jobs with Related Work Experience in Montgomery County, MD 2012 – 2017

Thank You Questions
cra.gmu.edu