Embed Size (px)
Citation preview
ME 410 MECHANICAL ENGINEERING SYSTEMS LABORATORY
PERFORMANCE CHARACTERISTICS OF AN
INTERNAL COMBUSTION ENGINE
Experiment No. : 4
1. OBJECT
The object of this test is to show the variation of basic engine characteristics under different engine loading conditions.
Basically, the experiment is shortly described as :
• A constant speed-variable load test, performed on a spark ignition engine. The aim of this experiment is to observe the variation of basic engine characteristics during the gradual loading of the engine by the dynamometer while the engine speed is kept constant.
• A variable speed-variable load test, performed on a spark ignition engine. The aim of this experiment is to obtain the variation of basic engine characteristics during the loading of the engine by the dynamometer while the engine speed is changing with load.
2. INTRODUCTION
Internal combustion engines (IC engines) are basically energy converters. They convert the chemical energy of the fuel to mechanical energy.
There are 2 types of IC engines :
1. SPARK IGNITION ENGINES ( SI engines).
2. COMPRESSION IGNITION ENGINES ( CI engines).
All IC engines operate on a thermodynamic cycle which includes ;
1. The induction of air or air/fuel mixture (charge).
2. The compression of the induced charge.
3. The combustion of the fuel in air towards the end of compression and during the beginning of expansion.
4. The expansion of the products of combustion.
5. The exhaust of the products of combustion.
This cycle is repeated over and over.
There are RECIPROCATING and ROTARY IC engines. They both operate on the above mentioned thermodynamic cycle. The Wankel engine is the best known rotary IC engine. The majority of IC engines are of the reciprocating type.
A reciprocating IC engine consists of ;
1. Engine block.
2. Cylinder head.
3. Piston(s) and piston pin(s).
4. Connecting rod(s).
5. Crankshaft.
6. Flywheel.
7. Valves and valve mechanisms and camshaft(s)
There will be one or more cylinders in the engine block. For water cooled IC engines these cylinders will be surrounded by an outer shell. Between the outer shell and the cylinders there will be water passages for cooling the engine. For air cooled IC engines the cylinders will be surrounded by fins for air cooling.
For multiple cylinder engines the cylinders will be arranged side by side in a row. They may be grouped and groups of cylinders in a row may be arranged opposite to each other or in a V-form or in a radial star form.
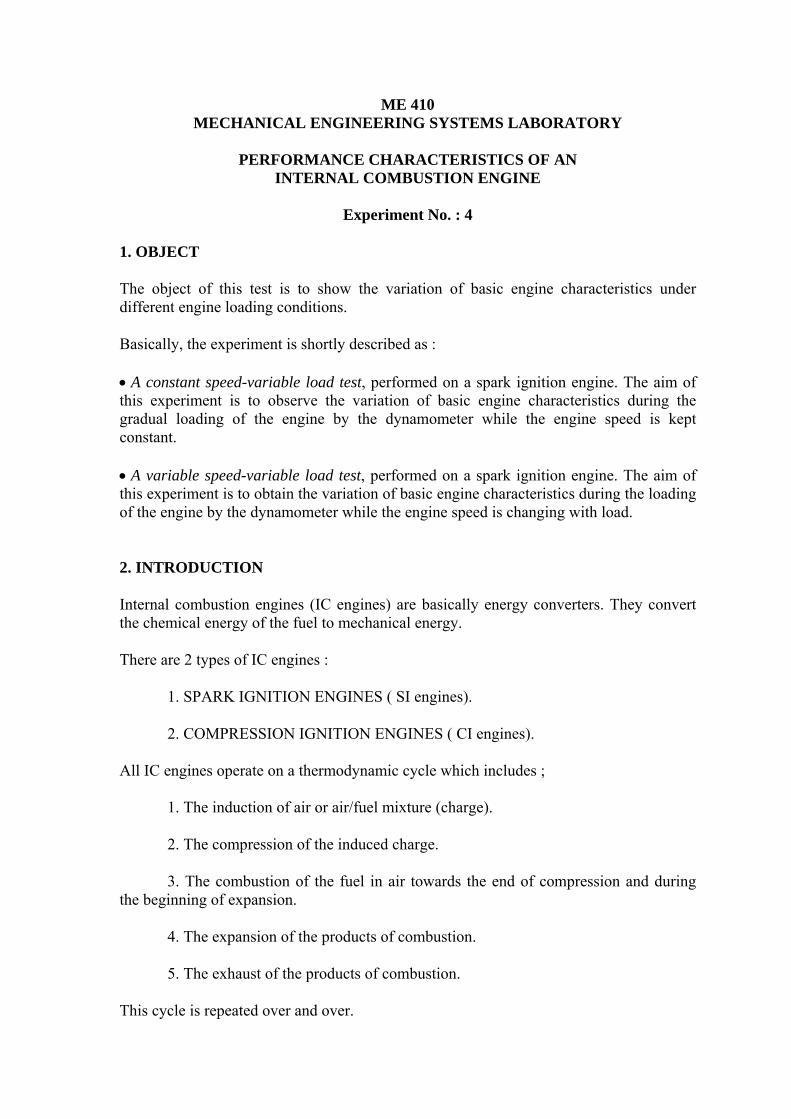
In each cylinder there will be a piston which will move back and forth from TOP DEAD CENTER (TDC, nearest position to the cylinder head) and BOTTOM DEAD CENTER (BDC, farthest position to the cylinder head). One full movement of the piston from TDC to BDC or vice versa is called a STROKE.
Each piston is connected by a piston pin to a connecting rod which in turn is connected to the related crankpin of the crankshaft. The crankshaft which is placed in the crankcase of the engine block is supported by journal bearings.
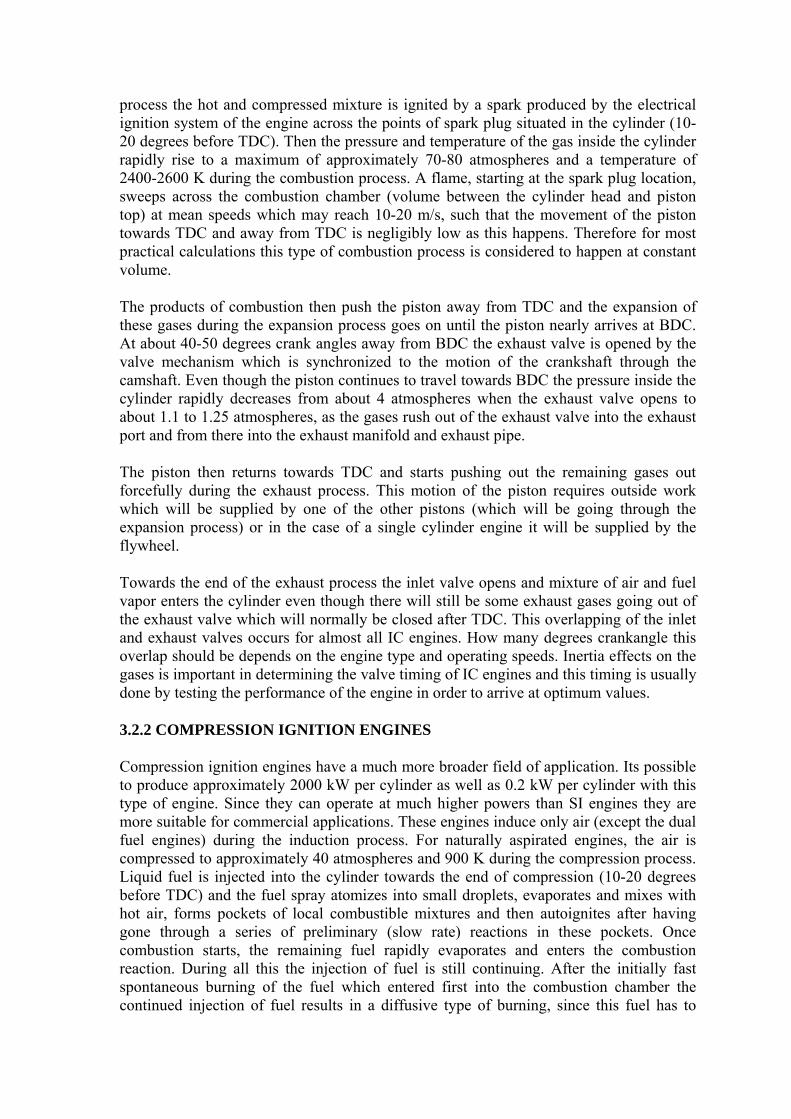
Fig. 1 Operation of a 4 stroke cycle engine
The back end of the crankshaft is coupled to a flywheel. The flywheel acts to absorb the fluctuations in the speed of the crankshaft which is mainly due to uneven distribution, both spatially and time wise, of the cyclic thermodynamic events among the cylinders.
The crankshaft of an IC engine may then be coupled to a gear box as in the case of transport vehicles or to the shaft of a water pump or to the shaft of an electric generator or to the shaft of a ships propeller or to the shaft of the propeller of an airplane or even to the shaft of the propeller of a model airplane (you can hold the engine in the palm of your hand).
It is evident that IC engines are very versatile. They come in all sizes producing powers from 40 000 kW to 0.2 kW. They are easily transported and the mainly liquid fuel that they use is easily available, relatively cheap and easily transportable. They are reliable. You can expect them to work for long hours with the same performance and over and over again for years with proper maintenance. They are easy to start and operate. Their transient characteristics (acceleration, deceleration) are excellent. All in all, we can easily say that the IC engine has been the greatest mechanical achievement of mankind, both socially and economically and it is rapidly becoming mankind's foremost concern, ecologically.
3. THEORY
3.1. OPERATING MODES OF IC ENGINES
IC engines may operate on a 4 stroke cycle or a 2 stroke cycle. In a 4 stroke cycle the piston has to go through 4 strokes in order to complete the above mentioned cyclic thermodynamic processes. In the 2 stroke cycle the piston goes through only 2 strokes to complete the cycle. This seems to make the 2 stroke cycle more advantageous. However, if the engine speed is high then the gas exchange processes are not as efficient as in the 4 stroke cycle engines and so the 2 stroke cycle is applied more to marine type slow and large CI engines and to light SI engines used on motorcycles and lawn mowers, etc. (since there won't be any need for the valves and valve mechanisms). On the other hand there are 2 stroke cycle CI engines in the power range of 200-500 kW and operating at speeds of up to approximately 2000 rpm.
In the two stroke engine, the inlet and exhaust valves are eliminated by using the piston to cover and uncover ‘ports’ or passages in the cylinder and crankcase. Beginning the cycle with the piston about the half-way through its compression stroke, all three ports are covered. The upward movement of the piston compresses a fresh charge of mixture in the combustion chamber. At the same time the pressure in the crankcase is reduced below atmospheric pressure. Near the top of the stroke the lower edge of the piston uncovers the inlet port, allowing the pressure of the atmosphere to fill the crankcase of the engine with fresh mixture from the carburetor.
The mixture in the combustion chamber is ignited in the same way as in the four stroke engine near the top of the stroke. The high pressure of the burned gases drives the piston down the cylinder. Just below TDC the piston covers the inlet port, and further downward movement compresses the mixture in the crankcase. Near the bottom of the stroke the top edge of the piston uncovers the exhaust port, allowing the burned gases to flow out of the cylinder under their own pressure.
Slightly further down, the piston uncovers the transfer port and the compressed mixture in the crankcase flows into the cylinder above the piston. The shaped piston deflects the mixture upwards, preventing it flowing straight across the cylinder and out through the exhaust port. Some engines use shaped transfer ports instead of a deflecting piston. As the piston rise on its next stroke the transfer and exhaust ports are covered and cycles of operations begins again.
3.2. OPERATION OF IC ENGINES
3.2.1 SPARK IGNITION ENGINES
Spark ignition engines are mainly used in automotive vehicles such as automobiles and motorcycles. These engines cannot be very big in size because of auto ignition (abnormal combustion) problems of flame propagated combustion of premixed mixtures. They induce a mixture of air and fuel during the induction process and then compress the induced charge to a pressure of approximately 12-15 atmospheres and a temperature of 500-600 K during the compression process and towards the end of the compression
process the hot and compressed mixture is ignited by a spark produced by the electrical ignition system of the engine across the points of spark plug situated in the cylinder (10-20 degrees before TDC). Then the pressure and temperature of the gas inside the cylinder rapidly rise to a maximum of approximately 70-80 atmospheres and a temperature of 2400-2600 K during the combustion process. A flame, starting at the spark plug location, sweeps across the combustion chamber (volume between the cylinder head and piston top) at mean speeds which may reach 10-20 m/s, such that the movement of the piston towards TDC and away from TDC is negligibly low as this happens. Therefore for most practical calculations this type of combustion process is considered to happen at constant volume.
The products of combustion then push the piston away from TDC and the expansion of these gases during the expansion process goes on until the piston nearly arrives at BDC. At about 40-50 degrees crank angles away from BDC the exhaust valve is opened by the valve mechanism which is synchronized to the motion of the crankshaft through the camshaft. Even though the piston continues to travel towards BDC the pressure inside the cylinder rapidly decreases from about 4 atmospheres when the exhaust valve opens to about 1.1 to 1.25 atmospheres, as the gases rush out of the exhaust valve into the exhaust port and from there into the exhaust manifold and exhaust pipe.
The piston then returns towards TDC and starts pushing out the remaining gases out forcefully during the exhaust process. This motion of the piston requires outside work which will be supplied by one of the other pistons (which will be going through the expansion process) or in the case of a single cylinder engine it will be supplied by the flywheel.
Towards the end of the exhaust process the inlet valve opens and mixture of air and fuel vapor enters the cylinder even though there will still be some exhaust gases going out of the exhaust valve which will normally be closed after TDC. This overlapping of the inlet and exhaust valves occurs for almost all IC engines. How many degrees crankangle this overlap should be depends on the engine type and operating speeds. Inertia effects on the gases is important in determining the valve timing of IC engines and this timing is usually done by testing the performance of the engine in order to arrive at optimum values.
3.2.2 COMPRESSION IGNITION ENGINES
Compression ignition engines have a much more broader field of application. Its possible to produce approximately 2000 kW per cylinder as well as 0.2 kW per cylinder with this type of engine. Since they can operate at much higher powers than SI engines they are more suitable for commercial applications. These engines induce only air (except the dual fuel engines) during the induction process. For naturally aspirated engines, the air is compressed to approximately 40 atmospheres and 900 K during the compression process. Liquid fuel is injected into the cylinder towards the end of compression (10-20 degrees before TDC) and the fuel spray atomizes into small droplets, evaporates and mixes with hot air, forms pockets of local combustible mixtures and then autoignites after having gone through a series of preliminary (slow rate) reactions in these pockets. Once combustion starts, the remaining fuel rapidly evaporates and enters the combustion reaction. During all this the injection of fuel is still continuing. After the initially fast spontaneous burning of the fuel which entered first into the combustion chamber the continued injection of fuel results in a diffusive type of burning, since this fuel has to
diffuse through the products of combustion in order to meet with the oxygen molecules. This kind of combustion of course takes more time than the flame propagation in SI engines. Therefore CI engines cannot normally operate as fast as SI engines. On the other hand they can have cylinder bores up to approximately one meter whereas SI engine cylinder bores are normally limited to 0.15 m The expansion and exhaust processes of 4 stroke cycle CI engines are exactly the same as in 4 stroke cycle SI engines.
3.3 TESTING OF IC ENGINES
In real life, vehicles always operate against a resistance. This resistance may be made of rolling friction, slope, air or inertia resistance. The dynamometer loading simulates the total of these resistances. Therefore the steady state performance of IC engines are tested on dynamometers. The dynamic testing of engines mounted on vehicles are done on chassis dynamometers. The dynamometers used for engine testing may be hydraulic or electrical.
3.3.1 Hydraulic Dynamometers
Basically there are two types of hydraulic dynamometers; friction and agitator types. The agitator type hydraulic dynamometer is used in our IC Engine Laboratories. The basic working principle of the dynamometer is that the coupling force arises from the change in momentum of water as it is transported from the rotor vanes and back. The engine power is absorbed by the water which circulates through the dynamometer.
3.3.2 Electric Dynamometers
This is essentially an electric generator used for loading the engine. The output of the generator must be measured by electric instruments and corrected in magnitude for generator efficiency. Since the generator efficiencies depend on loading, speed and temperature, the results obtained will not be very precise. However the generator may be cradled and the torque exerted by the stator frame may directly be measured. This torque arises from the magnetic coupling between the armature and stator and is equal to the engine brake torque. DC or AC type electric generators of may be used in these dynamometers. AC type electric dynamometers have better dynamic response characteristics and are used in cycle simulation tests.
Eddy current dynamometers are also popular. They work on the principle of increasing electromagnetic fields with load. The electro-magnetic energy increases the temperature of the coil windings in the eddy current dynamometer. Therefore the dynamometer has to be cooled by a closed loop liquid-to-liquid plate type heat exchanger.
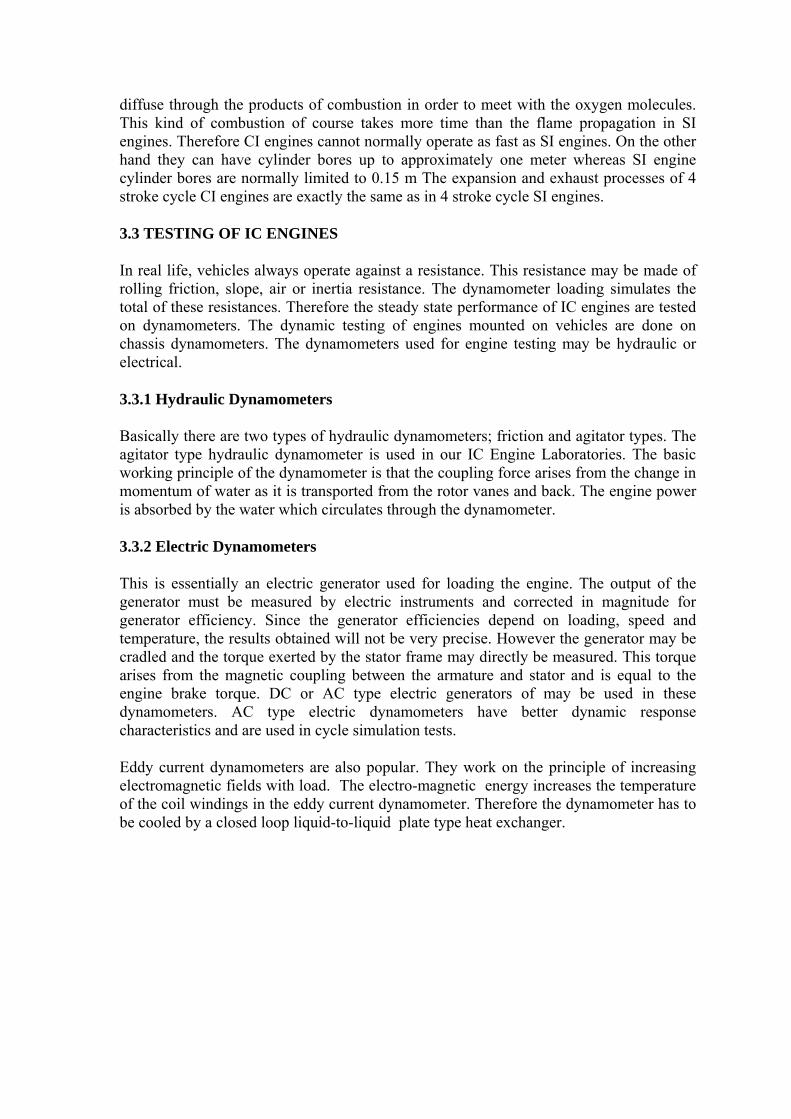
4. EXPERIMENTAL SET-UP
4.1. Engine Testing System: 1) Engine:
PROPERTY 4-STROKE PETROL ENGINE
Make LINEA 1.4 MPI
Type Multi Point Injection (MPI), in line four cylinder, four stroke, Over Head Cam (OHC), eight valves, EGR (Exhaust Gas Recycle) and Vapour feedback, water cooled engine
Bore 72 mm
Stroke 84 mm
Swept Volume 1368 cc
Compression Ratio 11.1 : 1
Maximum Torque 115 N-m @ 3000 rpm
Maximum Power 76 bhp (DIN) @ 6000 rpm
Fuel Feeding System Multi Point Injection, BOSCH EFI inj., with Lancia intake manifold
Ignition System Distributerless, full electronic
Fig. 2 Engine coupled to eddy current dynamometer
2) Dynamometer: An Eddy Current type dynamometer is used to measure engine torque. The dynamometer has a hall-effect transducer positioned at the rim of a teethed disc for measuring the shaft speed and a load cell for measuring the torque. Analog voltage outputs from both of these sensors are available on control unit of the dynamometer.
3) Instrumentation Unit: This unit consists of a computer controlled data acquisition system. The system can monitor 16 analog and 16 digital input signals. Also 16 digital output signals can be exported for controlling solenoid valves thru relays.
This unit houses all the instruments necessary for measuring all the engine performance parameters. It contains:
• Exhaust temperature meter: A chrome/alumel thermocouple fitted into the exhaust pipe close to the cylinder block of the engine was connected to an amplifier and then to the data acquisition system.
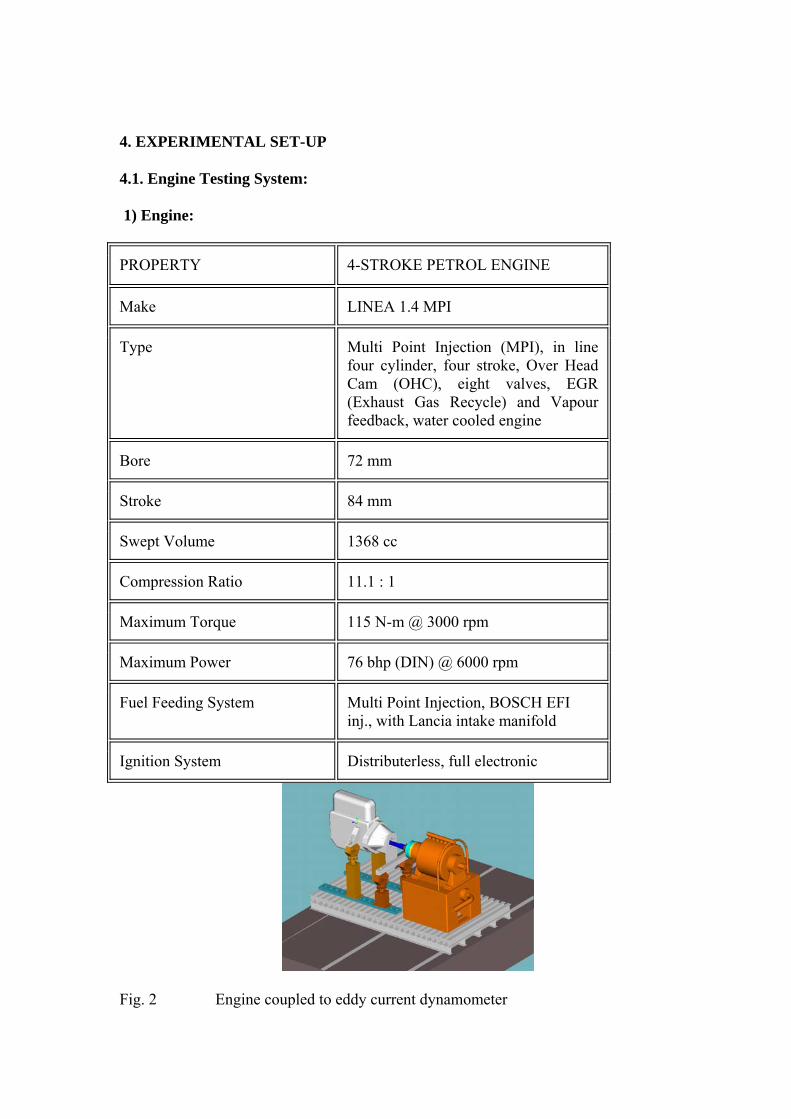
• Air flowmeter: A bosch air flowmeter • Fuel flow system: The high pressure fuel pump of the engine was dismantled
from the fuel tank and placed on top of a cylindrical container (Fig 3)
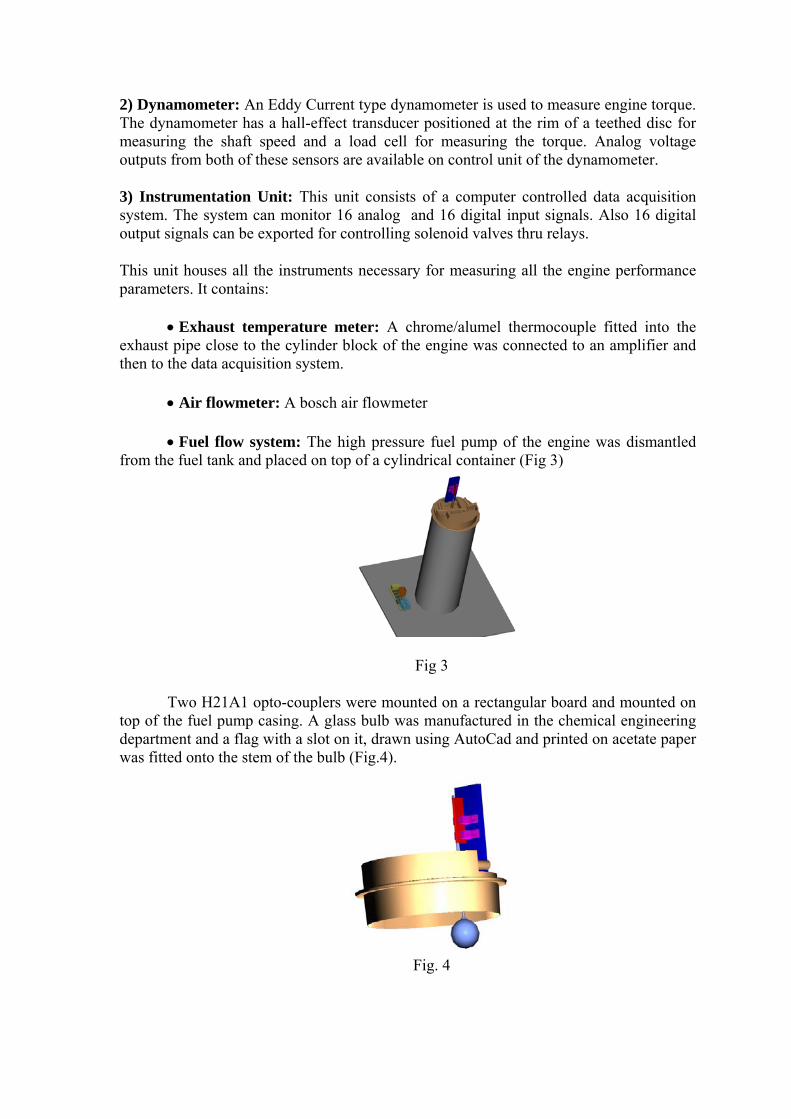
Fig 3 Two H21A1 opto-couplers were mounted on a rectangular board and mounted on
top of the fuel pump casing. A glass bulb was manufactured in the chemical engineering department and a flag with a slot on it, drawn using AutoCad and printed on acetate paper was fitted onto the stem of the bulb (Fig.4).
Fig. 4
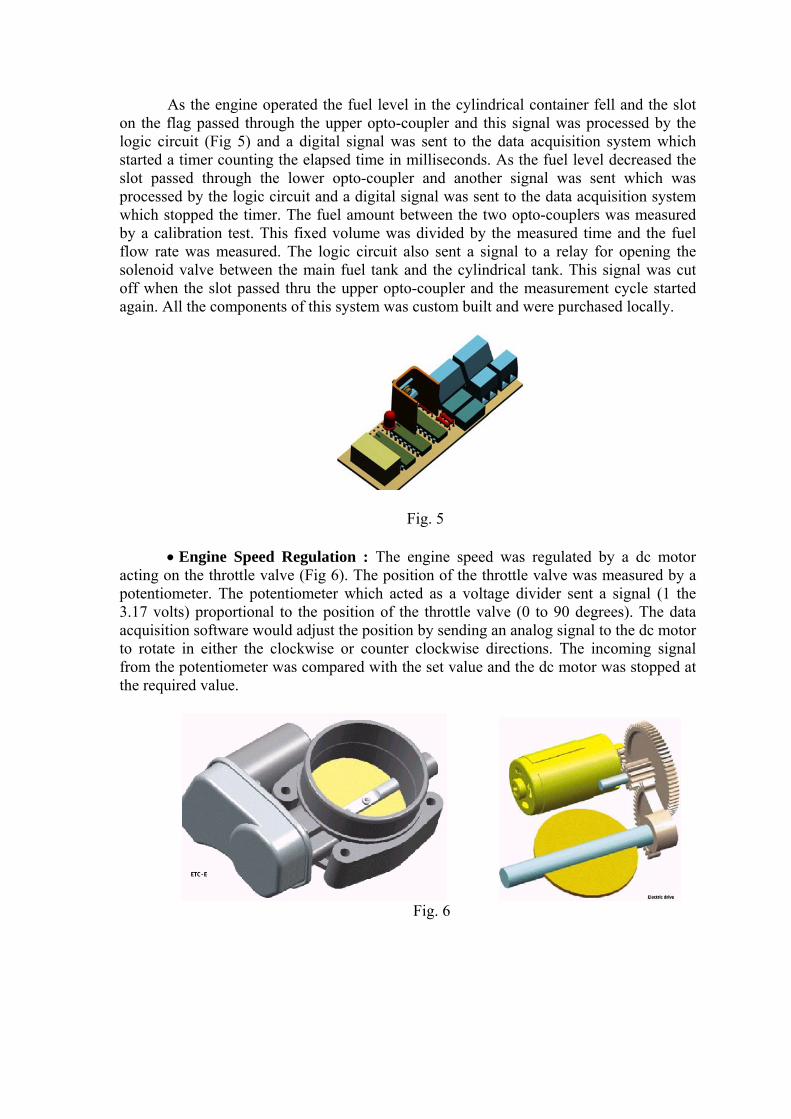
As the engine operated the fuel level in the cylindrical container fell and the slot on the flag passed through the upper opto-coupler and this signal was processed by the logic circuit (Fig 5) and a digital signal was sent to the data acquisition system which started a timer counting the elapsed time in milliseconds. As the fuel level decreased the slot passed through the lower opto-coupler and another signal was sent which was processed by the logic circuit and a digital signal was sent to the data acquisition system which stopped the timer. The fuel amount between the two opto-couplers was measured by a calibration test. This fixed volume was divided by the measured time and the fuel flow rate was measured. The logic circuit also sent a signal to a relay for opening the solenoid valve between the main fuel tank and the cylindrical tank. This signal was cut off when the slot passed thru the upper opto-coupler and the measurement cycle started again. All the components of this system was custom built and were purchased locally.
Fig. 5
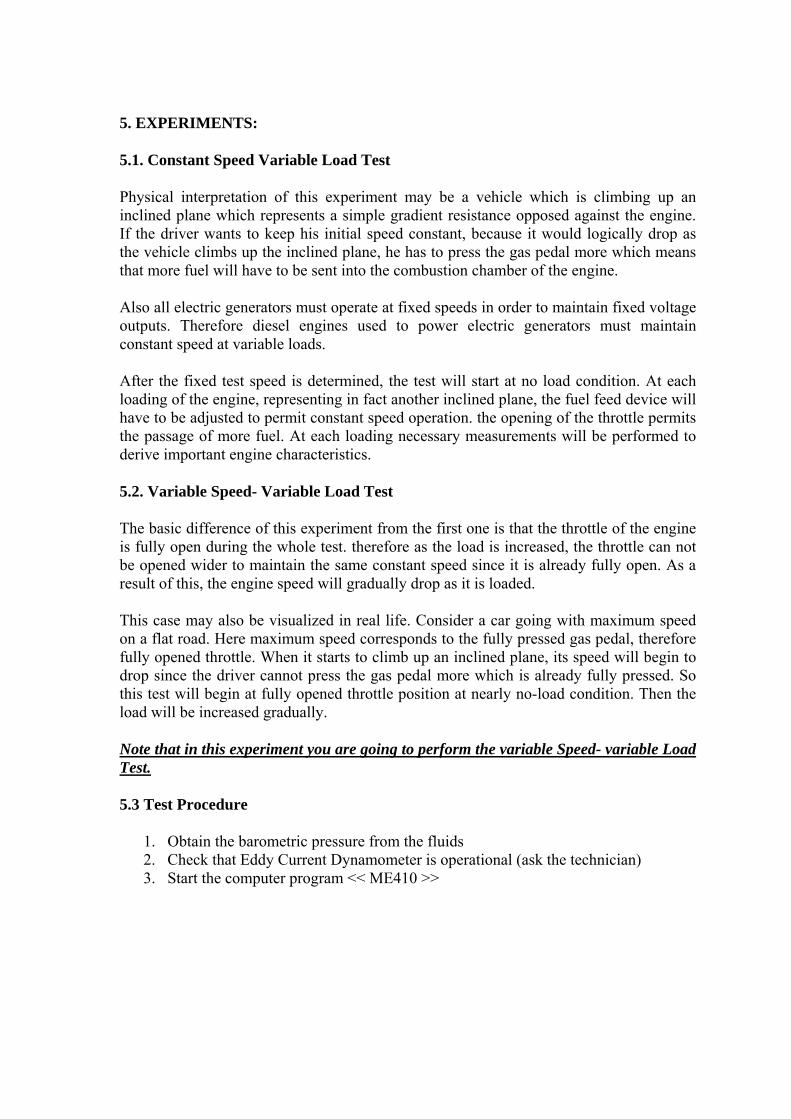
• Engine Speed Regulation : The engine speed was regulated by a dc motor acting on the throttle valve (Fig 6). The position of the throttle valve was measured by a potentiometer. The potentiometer which acted as a voltage divider sent a signal (1 the 3.17 volts) proportional to the position of the throttle valve (0 to 90 degrees). The data acquisition software would adjust the position by sending an analog signal to the dc motor to rotate in either the clockwise or counter clockwise directions. The incoming signal from the potentiometer was compared with the set value and the dc motor was stopped at the required value.
Fig. 6
5. EXPERIMENTS:
5.1. Constant Speed Variable Load Test
Physical interpretation of this experiment may be a vehicle which is climbing up an inclined plane which represents a simple gradient resistance opposed against the engine. If the driver wants to keep his initial speed constant, because it would logically drop as the vehicle climbs up the inclined plane, he has to press the gas pedal more which means that more fuel will have to be sent into the combustion chamber of the engine.
Also all electric generators must operate at fixed speeds in order to maintain fixed voltage outputs. Therefore diesel engines used to power electric generators must maintain constant speed at variable loads.
After the fixed test speed is determined, the test will start at no load condition. At each loading of the engine, representing in fact another inclined plane, the fuel feed device will have to be adjusted to permit constant speed operation. the opening of the throttle permits the passage of more fuel. At each loading necessary measurements will be performed to derive important engine characteristics.
5.2. Variable Speed- Variable Load Test
The basic difference of this experiment from the first one is that the throttle of the engine is fully open during the whole test. therefore as the load is increased, the throttle can not be opened wider to maintain the same constant speed since it is already fully open. As a result of this, the engine speed will gradually drop as it is loaded.
This case may also be visualized in real life. Consider a car going with maximum speed on a flat road. Here maximum speed corresponds to the fully pressed gas pedal, therefore fully opened throttle. When it starts to climb up an inclined plane, its speed will begin to drop since the driver cannot press the gas pedal more which is already fully pressed. So this test will begin at fully opened throttle position at nearly no-load condition. Then the load will be increased gradually.
Note that in this experiment you are going to perform the variable Speed- variable Load Test.
5.3 Test Procedure
1. Obtain the barometric pressure from the fluids 2. Check that Eddy Current Dynamometer is operational (ask the technician) 3. Start the computer program << ME410 >>
4. Choose the Datat acquisition card
5. Select the test type as << ME 410 Test >>
6. Open a new file
7. Input your filename as << Group XX >> where XX is your group
8. Write the test information from the instruction sheet
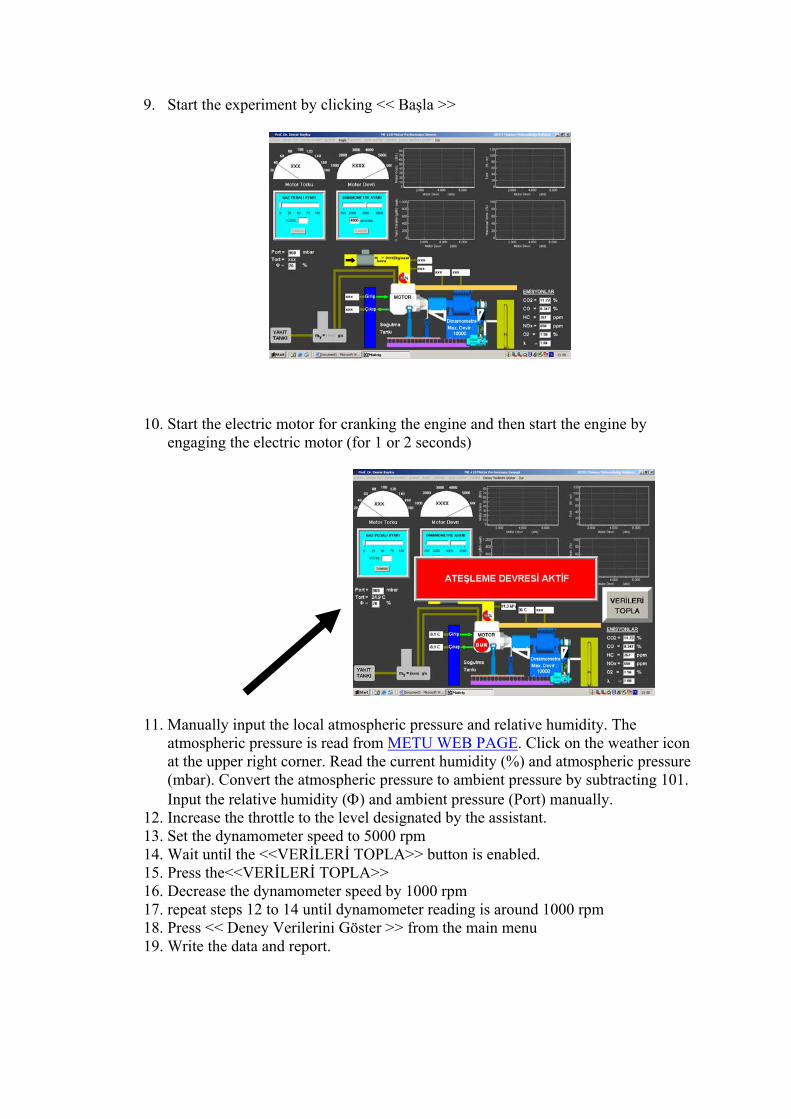
9. Start the experiment by clicking << Başla >>
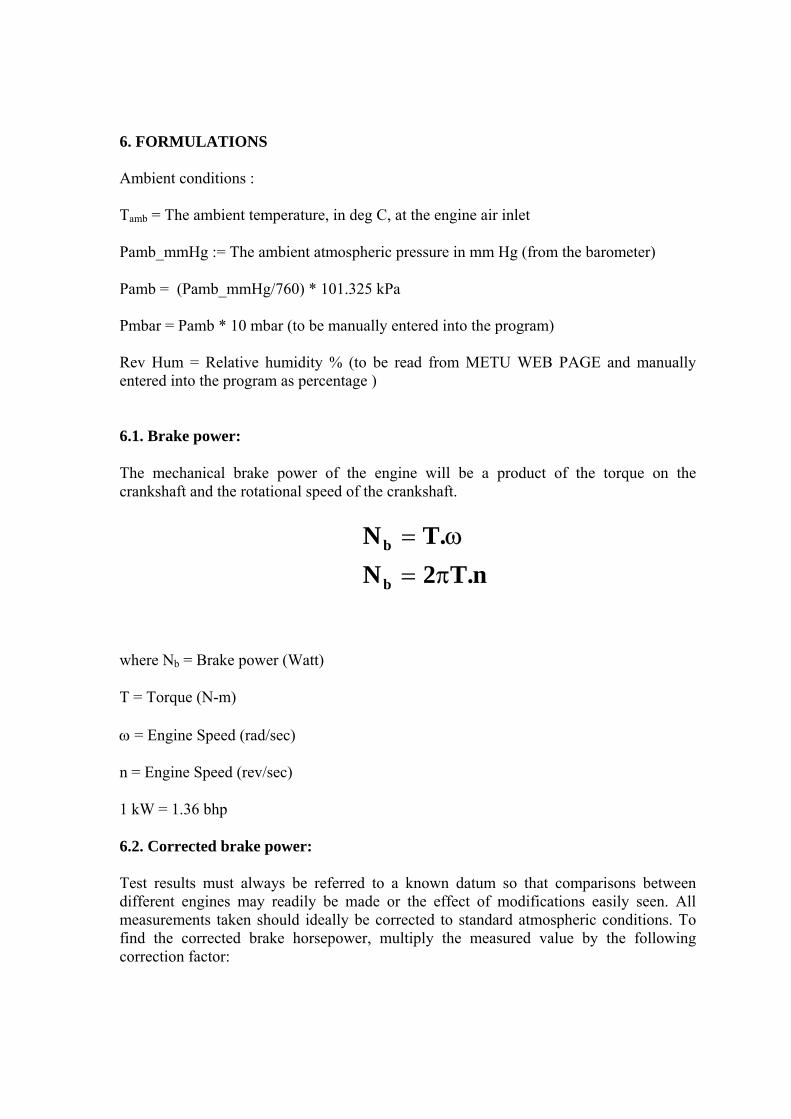
10. Start the electric motor for cranking the engine and then start the engine by engaging the electric motor (for 1 or 2 seconds)
11. Manually input the local atmospheric pressure and relative humidity. The atmospheric pressure is read from METU WEB PAGE. Click on the weather icon at the upper right corner. Read the current humidity (%) and atmospheric pressure (mbar). Convert the atmospheric pressure to ambient pressure by subtracting 101. Input the relative humidity (Φ) and ambient pressure (Port) manually.
12. Increase the throttle to the level designated by the assistant. 13. Set the dynamometer speed to 5000 rpm 14. Wait until the <<VERİLERİ TOPLA>> button is enabled. 15. Press the<<VERİLERİ TOPLA>> 16. Decrease the dynamometer speed by 1000 rpm 17. repeat steps 12 to 14 until dynamometer reading is around 1000 rpm 18. Press << Deney Verilerini Göster >> from the main menu 19. Write the data and report.
6. FORMULATIONS Ambient conditions : Tamb = The ambient temperature, in deg C, at the engine air inlet
Pamb_mmHg := The ambient atmospheric pressure in mm Hg (from the barometer)
Pamb = (Pamb_mmHg/760) * 101.325 kPa Pmbar = Pamb * 10 mbar (to be manually entered into the program) Rev Hum = Relative humidity % (to be read from METU WEB PAGE and manually entered into the program as percentage )
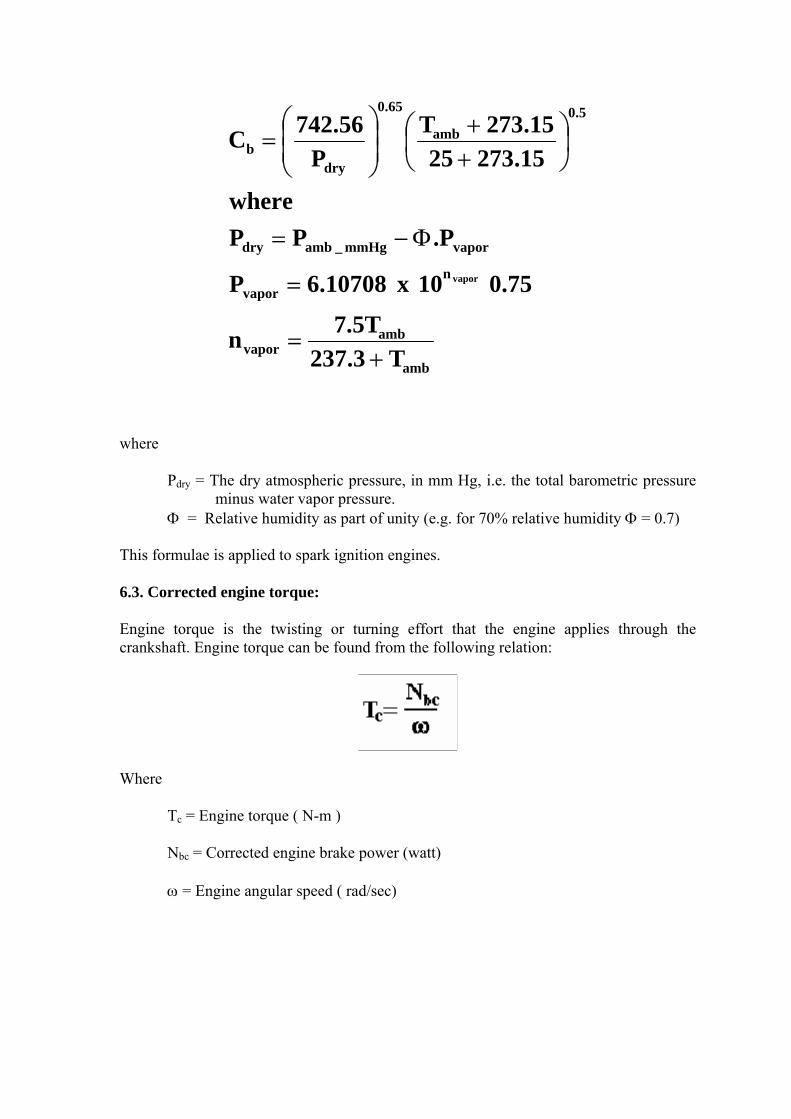
6.1. Brake power:
The mechanical brake power of the engine will be a product of the torque on the crankshaft and the rotational speed of the crankshaft.
n.T2N.TN
b
b
π=
ω=
where Nb = Brake power (Watt)
T = Torque (N-m)
ω = Engine Speed (rad/sec)
n = Engine Speed (rev/sec)
1 kW = 1.36 bhp
6.2. Corrected brake power:
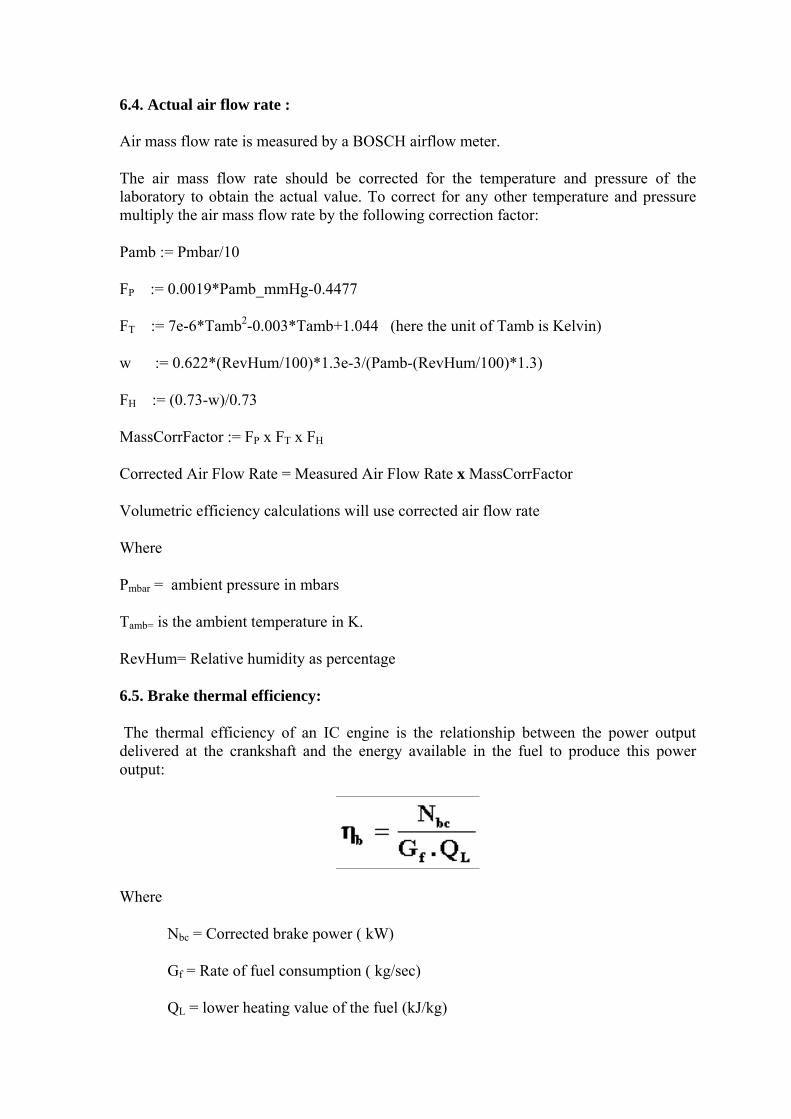
Test results must always be referred to a known datum so that comparisons between different engines may readily be made or the effect of modifications easily seen. All measurements taken should ideally be corrected to standard atmospheric conditions. To find the corrected brake horsepower, multiply the measured value by the following correction factor:
amb
ambvapor
nvapor
vapormmHg_ambdry
5.0amb
65.0
dryb
T3.237T5.7n
75.010x10708.6P
P.PPwhere
15.2732515.273T
P56.742C
vapor
+=
=
Φ−=
⎟⎠⎞
⎜⎝⎛
++
⎟⎟⎠
⎞⎜⎜⎝
⎛=
where
Pdry = The dry atmospheric pressure, in mm Hg, i.e. the total barometric pressure minus water vapor pressure.
Φ = Relative humidity as part of unity (e.g. for 70% relative humidity Φ = 0.7)
This formulae is applied to spark ignition engines.
6.3. Corrected engine torque:
Engine torque is the twisting or turning effort that the engine applies through the crankshaft. Engine torque can be found from the following relation:
Where
Tc = Engine torque ( N-m )
Nbc = Corrected engine brake power (watt)
ω = Engine angular speed ( rad/sec)
6.4. Actual air flow rate : Air mass flow rate is measured by a BOSCH airflow meter.
The air mass flow rate should be corrected for the temperature and pressure of the laboratory to obtain the actual value. To correct for any other temperature and pressure multiply the air mass flow rate by the following correction factor:
Pamb := Pmbar/10
FP := 0.0019*Pamb_mmHg-0.4477
FT := 7e-6*Tamb2-0.003*Tamb+1.044 (here the unit of Tamb is Kelvin)
w := 0.622*(RevHum/100)*1.3e-3/(Pamb-(RevHum/100)*1.3)
FH := (0.73-w)/0.73
MassCorrFactor := FP x FT x FH
Corrected Air Flow Rate = Measured Air Flow Rate x MassCorrFactor
Volumetric efficiency calculations will use corrected air flow rate
Where
Pmbar = ambient pressure in mbars
Tamb= is the ambient temperature in K.
RevHum= Relative humidity as percentage
6.5. Brake thermal efficiency:
The thermal efficiency of an IC engine is the relationship between the power output delivered at the crankshaft and the energy available in the fuel to produce this power output:
Where
Nbc = Corrected brake power ( kW)
Gf = Rate of fuel consumption ( kg/sec)
QL = lower heating value of the fuel (kJ/kg)
= 44000 kJ/kg for gasoline fuel
= 41400 kJ/kg for diesel fuel
Also density of fuel which will be used for fuel flow rate can be assumed as:
ρf = 740 kg/m3 for gasoline fuel
ρf = 820 kg/m3 for diesel fuel
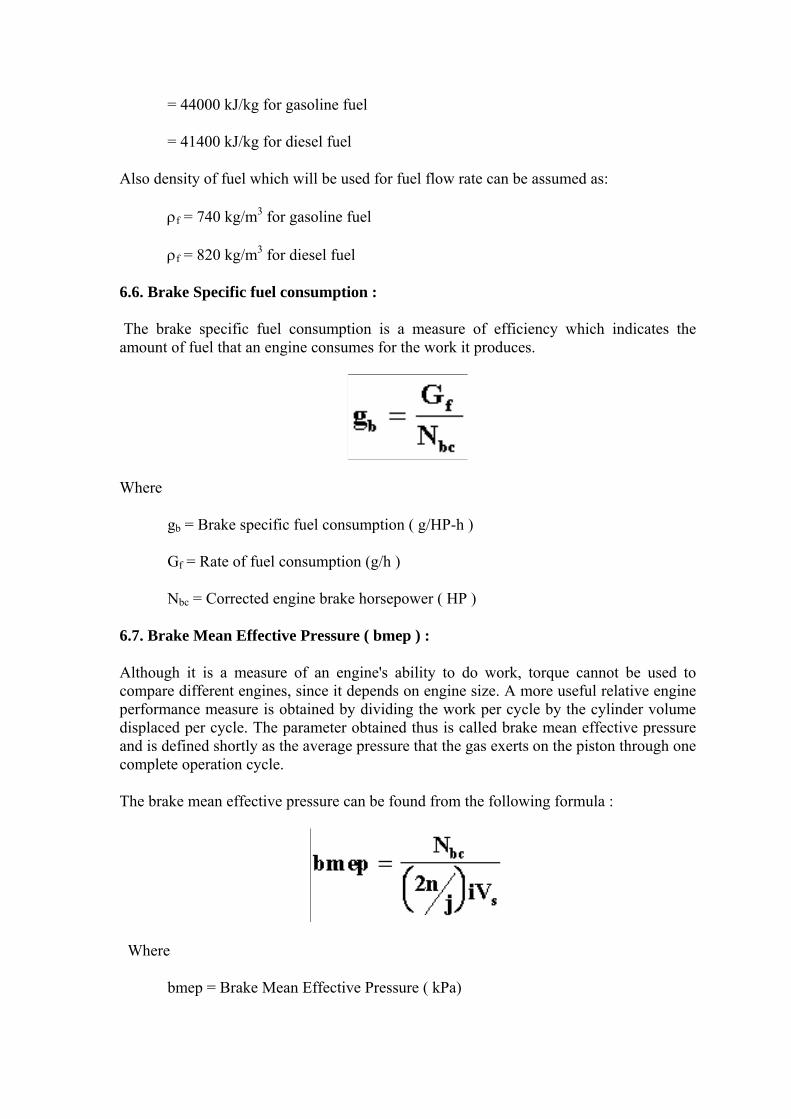
6.6. Brake Specific fuel consumption :
The brake specific fuel consumption is a measure of efficiency which indicates the amount of fuel that an engine consumes for the work it produces.
Where
gb = Brake specific fuel consumption ( g/HP-h )
Gf = Rate of fuel consumption (g/h )
Nbc = Corrected engine brake horsepower ( HP )
6.7. Brake Mean Effective Pressure ( bmep ) :
Although it is a measure of an engine's ability to do work, torque cannot be used to compare different engines, since it depends on engine size. A more useful relative engine performance measure is obtained by dividing the work per cycle by the cylinder volume displaced per cycle. The parameter obtained thus is called brake mean effective pressure and is defined shortly as the average pressure that the gas exerts on the piston through one complete operation cycle.
The brake mean effective pressure can be found from the following formula :
Where
bmep = Brake Mean Effective Pressure ( kPa)
Nbc = Corrected brake power ( kW )
n = Engine speed (rps)
j = Number of strokes
i = number of cylinders
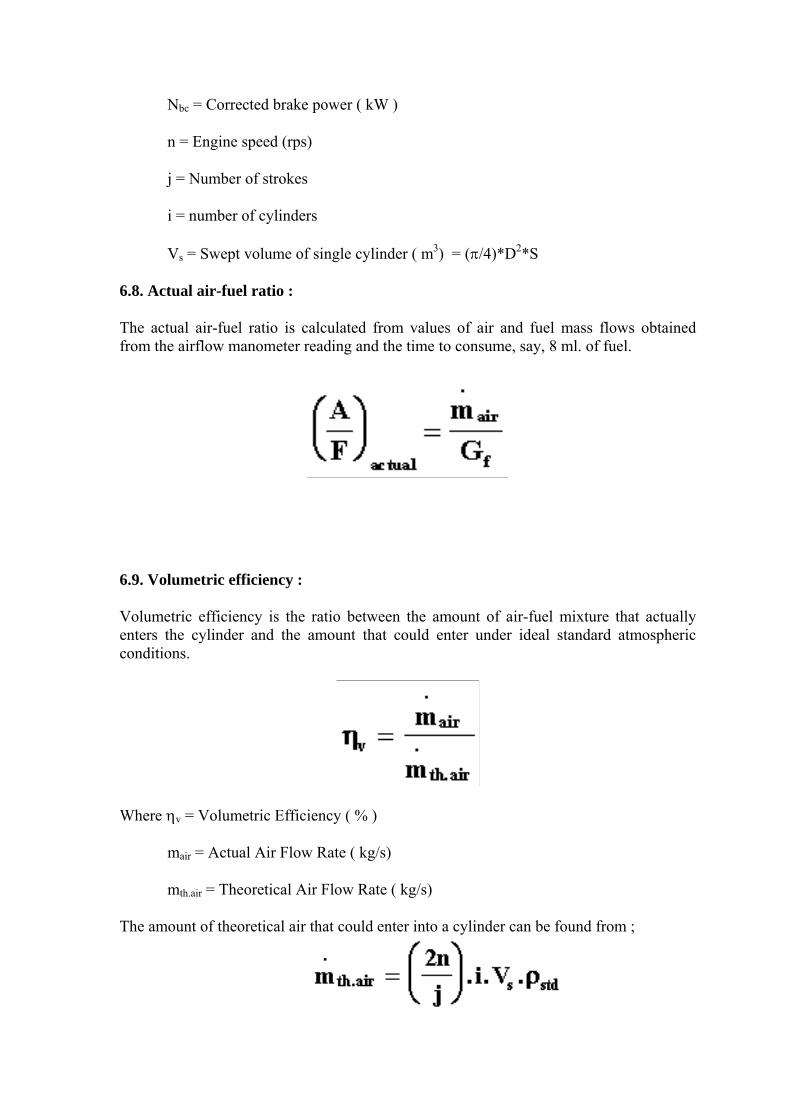
Vs = Swept volume of single cylinder ( m3) = (π/4)*D2*S
6.8. Actual air-fuel ratio :
The actual air-fuel ratio is calculated from values of air and fuel mass flows obtained from the airflow manometer reading and the time to consume, say, 8 ml. of fuel.
6.9. Volumetric efficiency :
Volumetric efficiency is the ratio between the amount of air-fuel mixture that actually enters the cylinder and the amount that could enter under ideal standard atmospheric conditions.
Where ηv = Volumetric Efficiency ( % )
mair = Actual Air Flow Rate ( kg/s)
mth.air = Theoretical Air Flow Rate ( kg/s)
The amount of theoretical air that could enter into a cylinder can be found from ;
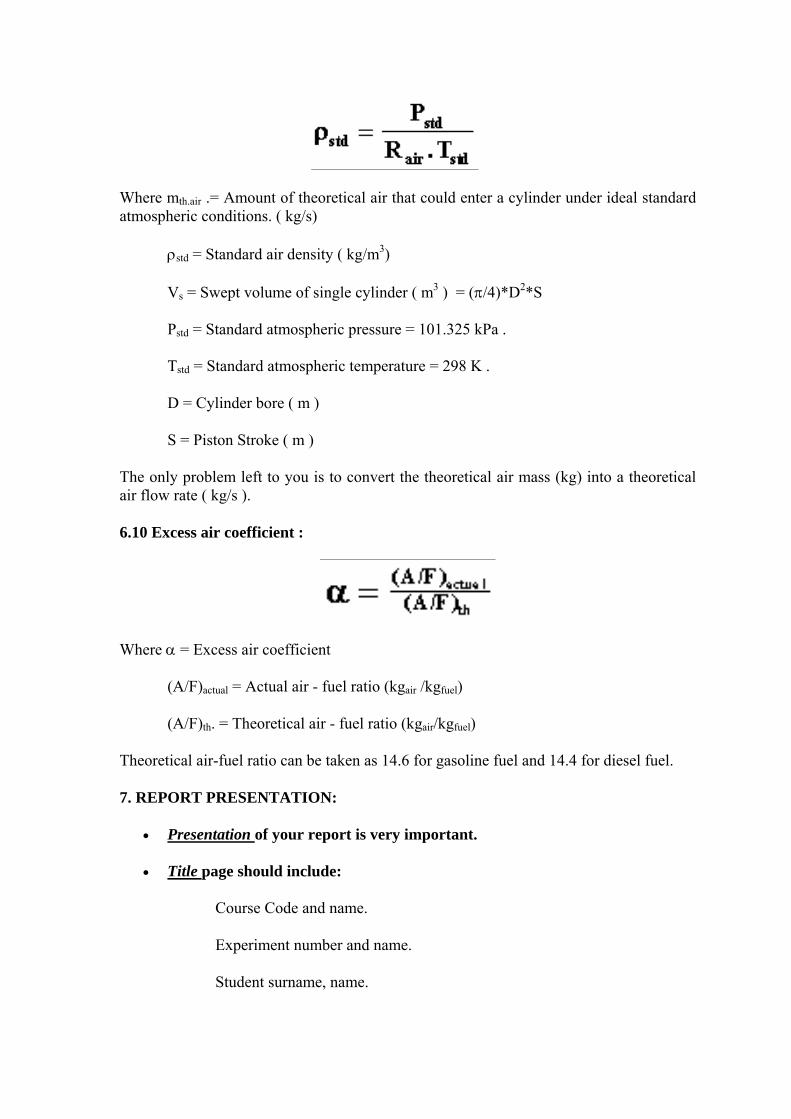
Where mth.air .= Amount of theoretical air that could enter a cylinder under ideal standard atmospheric conditions. ( kg/s)
ρstd = Standard air density ( kg/m3)
Vs = Swept volume of single cylinder ( m3 ) = (π/4)*D2*S
Pstd = Standard atmospheric pressure = 101.325 kPa . Tstd = Standard atmospheric temperature = 298 K .
D = Cylinder bore ( m )
S = Piston Stroke ( m )
The only problem left to you is to convert the theoretical air mass (kg) into a theoretical air flow rate ( kg/s ).
6.10 Excess air coefficient :
Where α = Excess air coefficient
(A/F)actual = Actual air - fuel ratio (kgair /kgfuel)
(A/F)th. = Theoretical air - fuel ratio (kgair/kgfuel)
Theoretical air-fuel ratio can be taken as 14.6 for gasoline fuel and 14.4 for diesel fuel.
7. REPORT PRESENTATION:
• Presentation of your report is very important.
• Title page should include:
Course Code and name.
Experiment number and name.
Student surname, name.
Laboratory group. Experiment date
Lab. supervisor name
• Object of the test should be briefly explained (IN YOUR OWN WORDS)
• Data, collected during test, should be tabulated.
• A sample calculation will be performed for a selected load condition
• All results will be presented in a tabulated form.
• Graphs: Selected graphs from the following will be drawn.
a) Corrected brake horse power b) Corrected torque
c) Brake mean effective pressure
d) Brake specific fuel consumption
e) Brake thermal efficiency
f) Volumetric efficiency
g) Actual air-fuel ratio
h) Excess air coefficient While plotting above graphs on a millimetric paper you are supposed to draw the trend lines of the above properties versus engine speed.
• Discussion & Conclusions: Graphical outputs will be your domain for this section. Graphs and reasons for observed performance characteristics will be explained.
Also discuss the possible sources of errors that may be encountered in the experiment.
IMPORTANT
• At the beginning it will be made clear to you, which of the engine parameters will be examined during the experiment. (This will be different for each groups) So all of the calculations and graphs will be made accordingly.
• You are supposed to read this write-up sheet carefully before coming to the laboratory. There will be at least one quiz either at the beginning or during the lab session. (Maybe both). One of the quizzes will be related to the procedure of the experiment (Equipment used, theory etc). The other will be directly related to the
report writing procedure (Calculations, graphs etc). So each of you should be active during the report writing session.
• During report-writing period you are allowed to use this write-up sheet, A-4 size paper, calculator, millimetric paper. Any other documents will be referred as cheating.
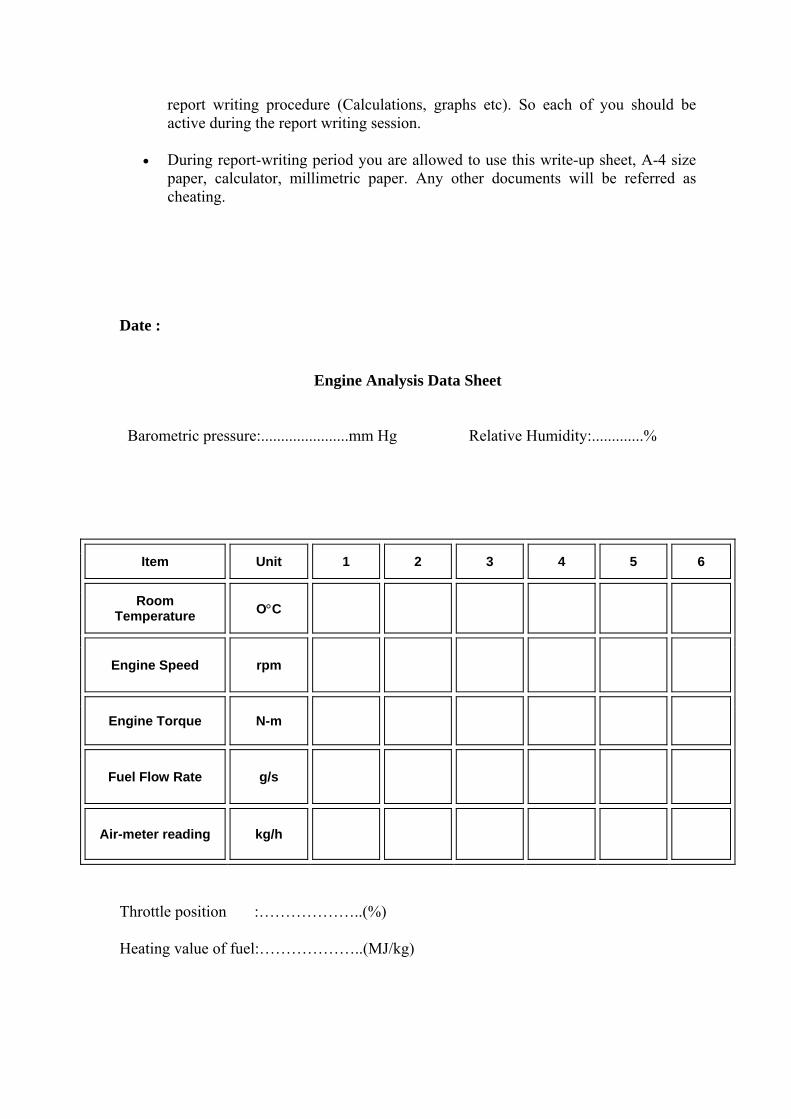
Date :
Engine Analysis Data Sheet
Barometric pressure:......................mm Hg Relative Humidity:.............%
Item Unit 1 2 3 4 5 6
Room Temperature O°C
Engine Speed rpm
Engine Torque N-m
Fuel Flow Rate g/s
Air-meter reading kg/h
Throttle position :………………..(%)
Heating value of fuel:………………..(MJ/kg)