Embed Size (px)
Citation preview

Fall Measurement Mats - CCSS.Math.Content.2.MD.1-10 © 2014 abcteach.com
Measure my height
and the crow’s height
to the nearest inch and
centimeter.
Find the difference
in heights.
scarecrow crow difference
in.
cm.

Fall Measurement Mats - CCSS.Math.Content.2.MD.1-10 © 2014 abcteach.com
Estimate the width in
inches of each hay bale.
Write the number.
Measure each bale to
the nearest inch. Write
the number.
estimate actual measurement
difference
Find the difference
between estimate and
actual measurement.

Fall Measurement Mats - CCSS.Math.Content.2.MD.1-10 © 2014 abcteach.com
The farm harvested
___ ___ pounds of
apples this fall.
How many pounds of apples
does the farm have left?
Write the equation in the box.
The mill used
___ pounds of
those apples
to make cider.
Roll a die to fill in the blanks.
Draw a number line to solve.

Fall Measurement Mats - CCSS.Math.Content.2.MD.1-10 © 2014 abcteach.com
: Draw a card.
Draw a card.
:
Fall Time
Draw arrows to show the time.
Write the digital time.
Draw a card.
Draw a card.

Fall Measurement Mats - CCSS.Math.Content.2.MD.1-10 © 2014 abcteach.com
Count out
the coins.
Apples cost
15¢ each.
Roll a die and
put that many
apples in the
basket.
Write the cost of
all the apples.
_____¢

Fall Measurement Mats - CCSS.Math.Content.2.MD.1-10 © 2014 abcteach.com
Measure each corn stalk
height to the nearest inch.
Write the measurements on
the pumpkins.
Draw a line plot in the
box to display the data.
Fall Measurement Mats - CCSS.Math.Content.2.MD.1-10 © 2014 abcteach.com
Place the
cards on the
matching
shapes.
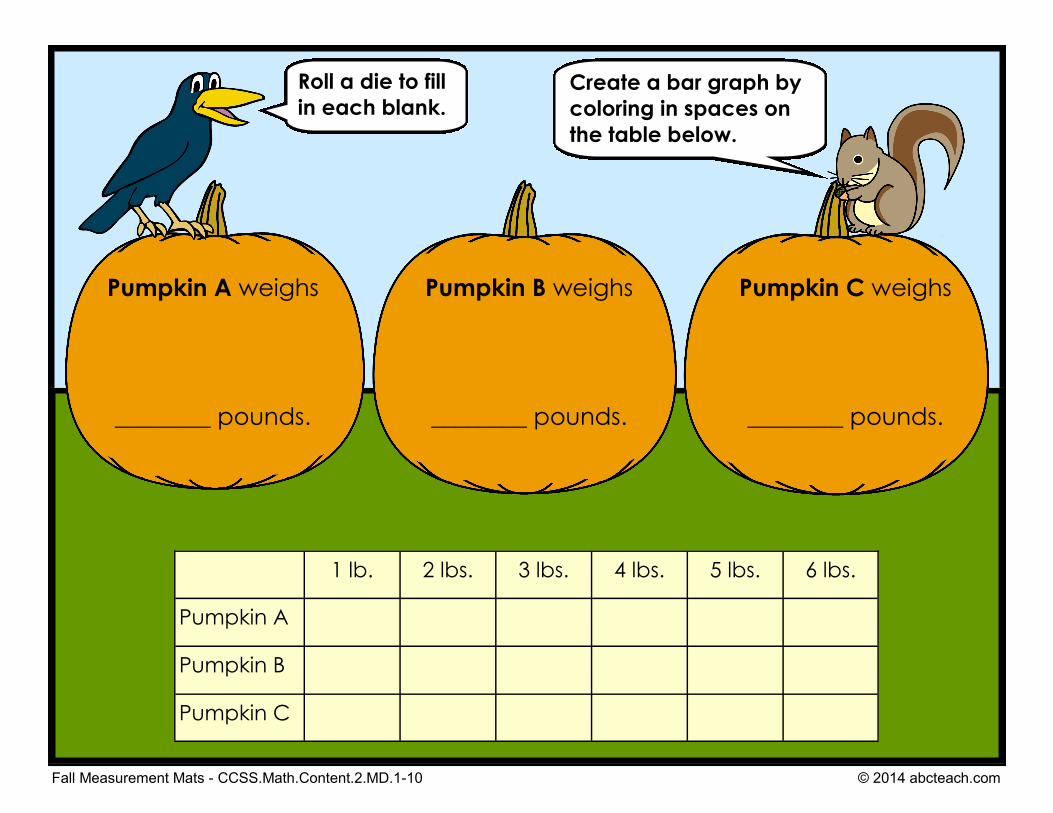
Roll a die to fill
in each blank.
Pumpkin A weighs
________ pounds.
Pumpkin B weighs
________ pounds.
Pumpkin C weighs
________ pounds.
1 lb. 2 lbs. 3 lbs. 4 lbs. 5 lbs. 6 lbs.
Pumpkin A
Pumpkin B
Pumpkin C
Create a bar graph by
coloring in spaces on
the table below.

Fall Measurement Mats - CCSS.Math.Content.2.MD.1-10 © 2014 abcteach.com
Place the
cards on the
matching
shapes.
Show how many with
pictures to create a
picture graph.
Roll a die to find out
how many of each
food the crows ate.

Fall Measurement Mats - CCSS.Math.Content.2.MD.1-10 © 2014 abcteach.com
1 2 3
4 5 6
7 8 9
10 11 12
00 05 10
15 20 25
30 35 40
45 50 55
Fall Time cards

Fall Measurement Mats - CCSS.Math.Content.2.MD.1-10 © 2014 abcteach.com
Picture Graph cards

Fall Measurement Mats - CCSS.Math.Content.2.MD.1-10 © 2014 abcteach.com
Teacher’s Page: These colorful math mats align with Common Core Standards for 2nd Grade Measurement & Data. A corresponding interactive is available for classrooms with Interactive Whiteboards. Preparation: Print mats on pp. 1-8 and laminate or place in sheet protectors for reuse. Print manipulatives on pp. 9-10, cut apart and laminate. Students will need dry erase markers or crayons, and a 6-sided die. Mats: Scarecrow Height Compare - Student will measure the scarecrow and crow in inches and
centimeters. Student will find the difference between their measurements and compare the measurement units.
Hay Bale Estimate - Student will estimate and record the length of each hay bale in inches. Student will measure and record the actual length in inches, and then find the difference (if any) between the estimates and actual measurements.
Apple Harvest Equation- Student will roll a die to fill in all blanks for a two-digit number and a one-digit number to complete the word problem. Student will write an equation to represent the word problem and make a number line to solve.
Fall Time - Student will draw four cards (two hour cards and two minute cards) and place them in the boxes to show times, and then draw arrows to show analog time and write the digital time.
Apple Coin Count - Student will roll a die and put that many apples in the basket. Student will count dimes and nickels to find the total and write the price for all the apples.
Corn Stalk Line Plot - Student will measure the height of each corn stalk, write the measurement, and draw a line plot to display the data.
Pumpkin Weight Bar Graph - Student will roll a die and write the weight for each pumpkin. Student will create a bar graph by coloring in boxes on the table provided.
Harvest Picture Graph - Student will roll a die for each food and add cards to the graph to show number rolled.