Embed Size (px)
Citation preview
MEASURING CHANGE IN EMPLOYMENT CHARACTERISTICS: THE EFFECTS OF DEPENDENT INTERVIEWING
Emanuela Sala and Peter Lynn
ISER Working Papers Number 2004-26
Institute for Social and Economic Research The Institute for Social and Economic Research (ISER) specialises in the production and analysis of longitudinal data. ISER incorporates the following centres: • ESRC Research Centre on Micro-social Change. Established in 1989 to identify, explain, model
and forecast social change in Britain at the individual and household level, the Centre specialises in research using longitudinal data.
• ESRC UK Longitudinal Studies Centre. This national resource centre was established in October
1999 to promote the use of longitudinal data and to develop a strategy for the future of large-scale longitudinal surveys. It is responsible for the British Household Panel Survey (BHPS) and for the ESRC’s interest in the National Child Development Study and the 1970 British Cohort Study
• European Centre for Analysis in the Social Sciences. ECASS is an interdisciplinary research
centre which hosts major research programmes and helps researchers from the EU gain access to longitudinal data and cross-national data sets from all over Europe.
The British Household Panel Survey is one of the main instruments for measuring social change in Britain. The BHPS comprises a nationally representative sample of around 5,500 households and over 10,000 individuals who are reinterviewed each year. The questionnaire includes a constant core of items accompanied by a variable component in order to provide for the collection of initial conditions data and to allow for the subsequent inclusion of emerging research and policy concerns. Among the main projects in ISER’s research programme are: the labour market and the division of domestic responsibilities; changes in families and households; modelling households’ labour force behaviour; wealth, well-being and socio-economic structure; resource distribution in the household; and modelling techniques and survey methodology. BHPS data provide the academic community, policymakers and private sector with a unique national resource and allow for comparative research with similar studies in Europe, the United States and Canada. BHPS data are available from the Data Archive at the University of Essex http://www.data-archive.ac.uk Further information about the BHPS and other longitudinal surveys can be obtained by telephoning +44 (0) 1206 873543. The support of both the Economic and Social Research Council (ESRC) and the University of Essex is gratefully acknowledged. The work reported in this paper is part of the scientific programme of the Institute for Social and Economic Research.

Acknowledgement: This paper derives from the project, “Improving Survey Measurement of Income and Employment” (ISMIE), funded under the Economic and Social Research Council (ESRC) Research Methods Programme, grant number H333250031. We also benefit from the core funding of the UK Longitudinal Studies Centre (ULSC) at ISER, by the ESRC (award no. H562255004) and the University of Essex. We are grateful to our ISMIE colleagues Stephen P. Jenkins and Annette Jäckle for comments and to our other ISER colleagues for their assistance in producing the ISMIE data set, especially Nick Buck, Jon Burton, John Fildes, Heather Laurie, Mike Merrett and Fran Williams.
Readers wishing to cite this document are asked to use the following form of words: Sala, Emanuela and Lynn, Peter (December 2004) ‘Measuring change in employment characteristics: the effects of dependent interviewing’, Working Papers of the Institute for Social and Economic Research, paper 2004-26. Colchester: University of Essex. For an on-line version of this working paper and others in the series, please visit the Institute’s website at: http://www.iser.essex.ac.uk/pubs/workpaps/
Institute for Social and Economic Research University of Essex Wivenhoe Park Colchester Essex CO4 3SQ UK Telephone: +44 (0) 1206 872957 Fax: +44 (0) 1206 873151 E-mail: [email protected] Website: http://www.iser.essex.ac.uk
© December 2004 All rights reserved. No part of this publication may be reproduced, stored in a retrieval system or transmitted, in any form, or by any means, mechanical, photocopying, recording or otherwise, without the prior permission of the Communications Manager, Institute for Social and Economic Research.
ABSTRACT
Surveys that take repeat measurements on the same individuals (panel or follow-up surveys) are often used to measure change in employment characteristics. This article is concerned with measurement error in such estimates of change and, specifically, how the error might be reduced by the use of dependent interviewing (DI) techniques. We use data from a large-scale experiment that involved two interviews at an interval of around 17 months and compare estimates of change that are obtained using three different interviewing techniques: traditional independent interviewing (INDI), proactive dependent interviewing (PDI) and reactive dependent interviewing (RDI). We examine three characteristics of the respondent’s employment (occupation, employed status, and whether or not the respondent has managerial or supervisory responsibilities) and three characteristics of the employing organisation (industry, type of organisation, number of employees). We focus on the estimation of change in each of these six characteristics.
We find that PDI results in lower levels of observed change for occupation, industry and number of employees. This reduction in observed change appears to represent a reduction in measurement error as the effect of PDI is particularly pronounced amongst respondents who have not reported a change in job between survey waves. Levels of change in employment characteristics amongst INDI respondents who have not reported a change in job remain implausibly high.
The reduction in measurement error brought about by PDI is particularly associated with certain employment characteristics. A reduction in the observed level of change in occupation is associated with SOC major groups 1-4 and respondents working at workplaces with large number of employees. A reduction in the observed level of change in industry is associated with certain industries and with respondents who are managers or professionals (SOC major groups 1 or 2) or have foreman or supervisor status. A reduction with PDI in the observed level of change in number of employees at the workplace is associated with large workplaces, having foreman/supervisor status, being employed in the public administration or education sectors, and being in a craft or related occupation or a plant or machine operative. We also found that measurement error was particularly reduced by PDI amongst respondents aged 36 or over and amongst the most highly qualified respondents.
Key words: dependent interviewing, employment, industry coding, labour market transitions,
measurement error, occupation coding
1
1. Introduction
Surveys that take repeat measurements on the same individuals (panel or follow-up
surveys) are often used to measure change in employment characteristics. This
article is concerned with measurement error in such estimates of change and,
specifically, how the error might be reduced by the use of dependent interviewing
(DI) techniques. We use data from a large-scale experiment that involved two
interviews at an interval of around 17 months and compare estimates of change that
are obtained using three different interviewing techniques: traditional independent
interviewing (INDI), proactive dependent interviewing (PDI) and reactive dependent
interviewing (RDI).
The substantive variables that we examine represent three characteristics of the
respondent’s employment (occupation, employed status, and whether or not the
respondent has managerial or supervisory responsibilities) and three characteristics
of the employing organisation (industry, type of organisation, number of employees).
We focus on the estimation of change in each of these six characteristics.
After describing the data (section 2), we investigate whether estimated levels of
change differ between INDI, PDI and RDI (section 3) and whether differences appear
to be associated with different levels of measurement error (section 4). We further
explore whether any differences are associated with certain characteristics of the
employment (section 5) or of the respondent (section 6). We draw some conclusions
regarding the effects of DI and point out some practical implications both for data
analysts and for survey designers (section 7).
2
2. The Data
We use data collected in two interviews with a national sample of 1,034 persons
aged 16 or over in the UK. The first interview constituted wave 8 of the UK part of the
European Household Panel Survey and took place between September 2001 and
February 2002. The second interview was part of the “Improving Survey
Measurement of Income and Employment” project, carried out at the University of
Essex and funded by the Research Methods Programme of the UK Economic and
Social Research Council. This took place between February and May 2003. Both
interviews were carried out in respondents’ own homes using computer-assisted
personal interviewing (CAPI). We refer to the first interview as “wave 8” and the
second as “ISMIE”. Further details of the sample design and ISMIE field work can
be found in Jäckle et al (2004).
At wave 8, an identical survey instrument was administered to all sample members.
At the ISMIE interview, the sample was randomly allocated to three treatment groups
that we refer to as the INDI, PDI and RDI groups. For the INDI group, the questions
about employment were identical to those asked at wave 8. The PDI group were
instead presented with the answer they had given at wave 8 and asked if this still
applied. If they replied “no”, the standard question was then asked. The RDI group
were first asked the standard question, but this was followed up with a check
question asking the respondent to confirm whether or not this represented a change
since last time. For occupation and employer, the check question was asked of all
RDI respondents, feeding back the answer given last time. For employee status,
managerial status, and number of employees the check question was only asked if
the answer given did not correspond with the answer given at wave 8. We are
3
concerned here with estimates of change in employment details and our analysis is
therefore restricted to the 434 ISMIE sample members who reported being in
employment at both interviews.
3. Estimates of Change
We examine here three characteristics of the respondent’s employment (occupation,
employed status, whether the respondent has managerial or supervisory
responsibilities) and three characteristics of his or her employing organisation (sector
of industry, type of organisation, number of employees). We focus on the estimation
of change in each of these characteristics.
For each characteristic, we constructed for each respondent an indicator of whether
the characteristic appeared to have changed between the two survey interviews. The
analysis is restricted to respondents who were in work at the time of both interviews.
The proportion of in-work respondents whose survey responses indicated change is
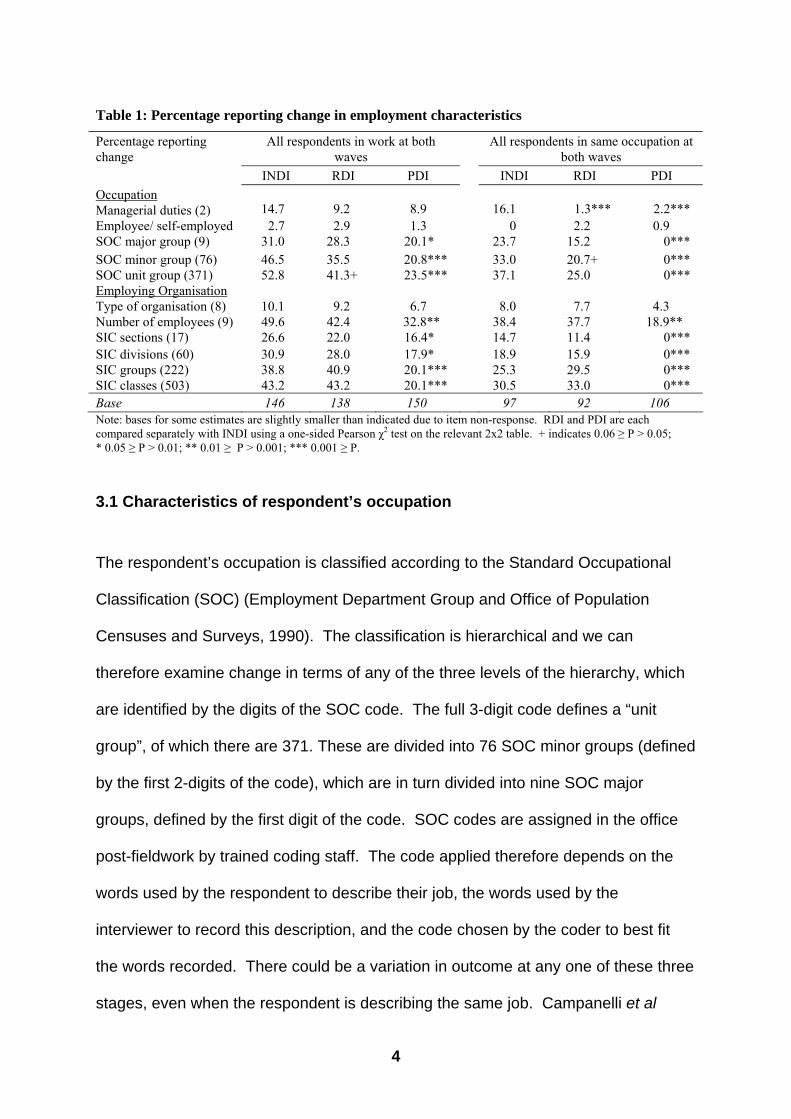
presented in Table 1 for each of the three treatment groups (left-hand panel).
4
Table 1: Percentage reporting change in employment characteristics
Percentage reporting change
All respondents in work at both waves
All respondents in same occupation at both waves
INDI RDI PDI INDI RDI PDI Occupation Managerial duties (2)
14.7
9.2
8.9
16.1
1.3***
2.2***
Employee/ self-employed 2.7 2.9 1.3 0 2.2 0.9 SOC major group (9) 31.0 28.3 20.1* 23.7 15.2 0*** SOC minor group (76) 46.5 35.5 20.8*** 33.0 20.7+ 0*** SOC unit group (371) 52.8 41.3+ 23.5*** 37.1 25.0 0*** Employing Organisation Type of organisation (8)
10.1
9.2
6.7
8.0
7.7
4.3
Number of employees (9) 49.6 42.4 32.8** 38.4 37.7 18.9** SIC sections (17) 26.6 22.0 16.4* 14.7 11.4 0*** SIC divisions (60) 30.9 28.0 17.9* 18.9 15.9 0*** SIC groups (222) 38.8 40.9 20.1*** 25.3 29.5 0*** SIC classes (503) 43.2 43.2 20.1*** 30.5 33.0 0*** Base 146 138 150 97 92 106 Note: bases for some estimates are slightly smaller than indicated due to item non-response. RDI and PDI are each compared separately with INDI using a one-sided Pearson χ2 test on the relevant 2x2 table. + indicates 0.06 ≥ P > 0.05; * 0.05 ≥ P > 0.01; ** 0.01 ≥ P > 0.001; *** 0.001 ≥ P. 3.1 Characteristics of respondent’s occupation
The respondent’s occupation is classified according to the Standard Occupational
Classification (SOC) (Employment Department Group and Office of Population
Censuses and Surveys, 1990). The classification is hierarchical and we can
therefore examine change in terms of any of the three levels of the hierarchy, which
are identified by the digits of the SOC code. The full 3-digit code defines a “unit
group”, of which there are 371. These are divided into 76 SOC minor groups (defined
by the first 2-digits of the code), which are in turn divided into nine SOC major
groups, defined by the first digit of the code. SOC codes are assigned in the office
post-fieldwork by trained coding staff. The code applied therefore depends on the
words used by the respondent to describe their job, the words used by the
interviewer to record this description, and the code chosen by the coder to best fit
the words recorded. There could be a variation in outcome at any one of these three
stages, even when the respondent is describing the same job. Campanelli et al
5
(1997) show reliability of between 0.78 and 0.82 across five studies of office
occupation coding in the UK (including their own two studies). It therefore seems a
priori likely that measurement error would lead to spurious apparent change when
using INDI. Our expectation is therefore that DI is likely to reduce the apparent level
of change in SOC, as measurement error in the assignation of a SOC code will no
longer be independent between interview waves.
The INDI data show that 53% of in-work respondents are assigned a different SOC
unit group at the two interviews, compared with 31% who are assigned to different
SOC major groups. At each of the three levels of detail, the proportion assigned
differently at the two interviews is significantly less (P<0.05) with PDI. And the
differences are large in magnitude. The proportions who appear to have changed
occupation are less than half those obtained with INDI for both unit groups (3-digit
codes) and minor groups (2 digits), and around two-thirds of the INDI proportion for
major groups. The estimates of change obtained under RDI lie somewhere between
those for INDI and PDI. For 3-digit SOC, the difference between the RDI and INDI
estimates of the level of change is of borderline significance (P=0.054). These
findings are consistent with our expectations. DI appears to reduce systematic
measurement error in measures of change. However, this does not imply that it
reduces measurement error in SOC itself – merely that any errors will tend to be
consistent.
The other two employment characteristics examined here are both measured as
dichotomous indicators: whether the respondent is an employee or self-employed
and whether the respondent has managerial or supervisory responsibilities. Our
expectation is that the impact of measurement error on estimates of change is likely
6
to be less than for SOC, both because there are now only two categories to choose
from and because there is no process of verbatim transcription and coding involved:
the answer categories are pre-coded. For both measures we observe that estimated
levels of change are lower with PDI (and, in the case of managerial responsibilities,
with RDI) but these differences do not reach statistical significance (P<0.05).
3.2 Characteristics of employing organisation
The industry sector of the respondent’s employer is measured by the Standard
Industrial Classification (SIC) (Central Statistical Office, 19921). As with SOC, this is
a hierarchical classification and we investigate change at each level of the hierarchy.
SIC has five levels. There are 17 sections, 60 divisions, 222 groups, and 503
classes, a number of which are further divided into sub-classes (142 sub-classes).
The SIC code (ignoring sub-classes) has four digits. The first two digits define the
division and the first three define the group. Sections are defined as ranges of
division codes (for example, Section D, manufacturing, consists of divisions 15 to
37). Many groups contain just a single class, with the result that analysis at those
two levels produces similar results. The SIC code is based on responses given to the
open-ended question, “What does the firm/organisation you work for actually make
or do (at the place where you work)?” The process again involves interviewers
recording answers verbatim and coders subsequently applying codes in the office.
With INDI, 27% of employed respondents are assigned to a different SIC section at
the two interviews, 31% to a different division, 39% to a different group, and 43% to
a different class.
7
At all four levels of SIC, the proportion assigned differently at the two interviews is
significantly less (P<0.05) with PDI. And again differences are large in magnitude.
The proportions who appear to have changed industry are around half those
obtained with INDI for both SIC classes and SIC groups, and only slightly higher for
SIC divisions. The estimates of change obtained under RDI are not significantly
different from those for INDI.
The other two characteristics of the employing organisation that we study here are
both categorical variables. Type of organisation refers to 8 pre-coded categories
(private firm, company or plc; civil service/ central government; local government
including local education, fire and police; National Health Service or State Higher
Education; nationalised industry; non-profit making organisation; armed forces;
other). Respondents are asked to choose one of nine categories in response to the
question, “How many people are employed at the place where you work?” (1-2; 3-9;
10-24; 25-49; 50-99; 100-199; 200-499; 500-999; 1000 or more). PDI produces
significantly lower levels of apparent change in the number of employees compared
with INDI (P<0.01). The estimated level of change is also lower for type of
organisation, though the difference is not significant. In both cases, the estimate
under RDI lies between those under INDI and PDI.
1 A revised version of SIC was published in 2003, but we refer here to SIC92, as this was the coding frame used on both ECHP and ISMIE.
8
4. Is the Reduction in Apparent Change also a Reduction in
Measurement Error?
The analysis of section 3 is based on all respondents who were in work at the time of
both interviews, regardless of whether or not they may have changed jobs. We
cannot therefore be sure whether the reduction in change assessed with PDI should
be interpreted as a genuine reduction in measurement error. In this section we focus
the analysis solely on respondents who have not changed their jobs between the two
interviews. Amongst this group, genuine levels of change in the six target variables
are likely to be very low, so reduction in the levels of observed change can be
interpreted as a reduction in measurement error. We have therefore re-run the
analyses of section 3 considering only respondents who have not changed
occupation between wave 8 and ISMIE. In case of the INDI and of RDI, the analysis
is carried out on respondents who reported at ISMIE a start date for their current
employment that is prior to the wave 8 interview date. In case of PDI the analysis is
carried out on interviewees who reported at ISMIE that their wave 8 occupation was
still their current one. The results of the analysis are shown in the right-hand panel of
table 1.
There is clear evidence of reduced measurement error with PDI, compared with
INDI. Observed levels of change are implausibly high for most variables with INDI,
whereas they are zero or very small with PDI for all variables other than number of
employees (and even for this variable, the observed level of change is reduced to
half that observed with INDI). RDI is rather less successful, producing a significant
reduction in measurement error only for managerial duties, along with a modest
9
reduction of borderline significance for SOC. Overall, there can be little doubt that DI
reduces measurement error in estimates of change for these variables. Additionally,
it appears that PDI removes a large proportion of the measurement error, whereas
RDI is less successful in that respect.
5. The Nature of Change
In this section we assess whether the nature of change differs between treatment
groups. We look at two aspects of the nature of change: first, the direction of change
and second associations with other characteristics of the respondent’s employment.
5.1 Direction of change
In this section we explore whether the reduction in spurious change achieved by DI
for certain variables is disproportionate across different categories of the variable.
For example, in Table 1 we saw that PDI produces a reduction in the proportion of
sample members who have appeared to change occupation, as measured by SOC
code. Here we ask whether the spurious change observed with INDI is
disproportionately associated with respondents in particular (observed) occupations.
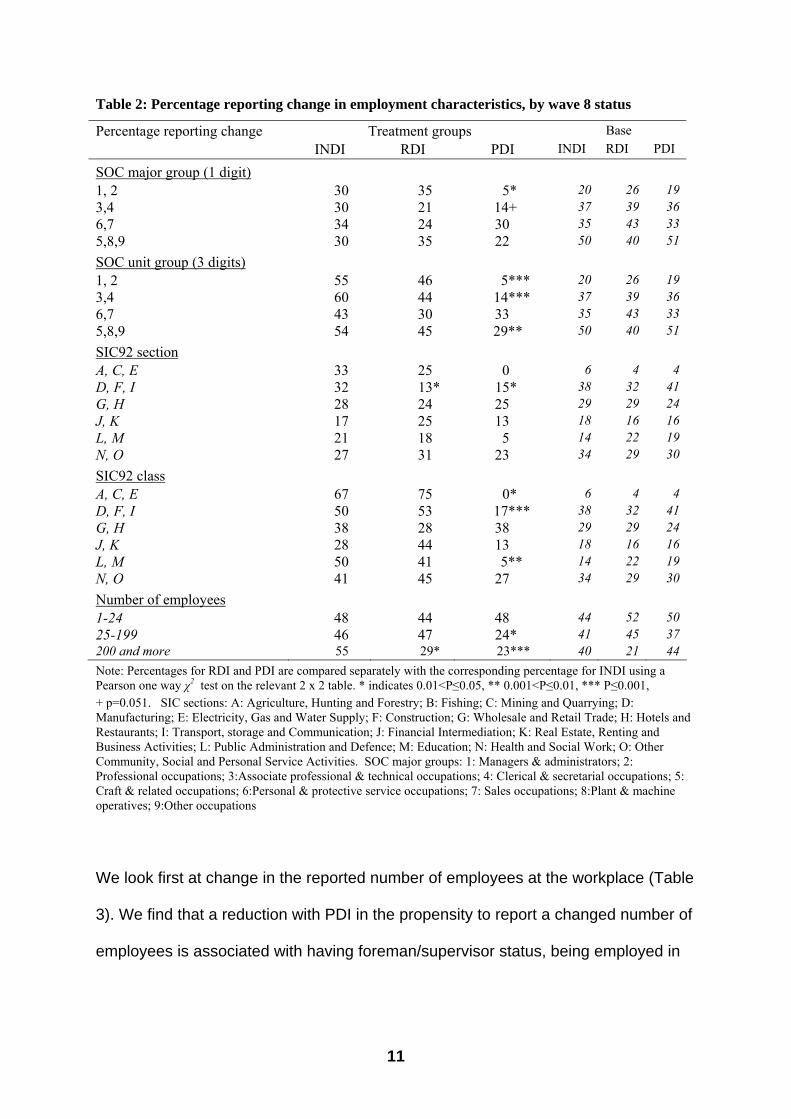
Table 2 shows the proportion in each of a number of categories of a variable (as
measured at wave 8) for whom a change in category of that variable is observed (at
ISMIE). We focus on SOC, SIC and number of employees, the variables for which
DI was seen to produce a significant reduction in the overall estimate of levels of
change (Table 1). Due to sample size restrictions, we have grouped categories of
the variables. For example, the first row shows that 30% of INDI respondents who
were classified at wave 8 as belonging to SOC major group 1 or 2 (managers,
10
administrators and professional occupations), were classified at ISMIE as belonging
to a different SOC major group.
For SOC, there is a suggestion that the reduction in measurement error is
particularly great amongst major groups 1-4. This is true both for observed change
at the major group level and at the unit group level. For SIC section, the reduction in
observed change reaches significance only for respondents in sections D, F or I
(manufacturing, construction, hotels and restaurants), though this may partly be
because the sample size is larger for this group of sections than any other. But for
SIC class, significant, and apparently large, reductions are observed with DI within
the three groups of sections (A, C, E), (D, F, I), and (L, M), but not within the other
three groups. There is therefore a suggestion that the extent to which DI reduces
measurement error varies across the industries in which respondents are employed.
Regarding number of employees, there is a suggestion that spurious change with
INDI is greater the larger the number of employees (Table 2).
5.2 Correlates of change
Here we seek to identify employment characteristics (other than the target variable)
that are associated with a tendency for DI to reduce the observed level of change.
We do this for SOC, SIC and number of employees, the variables for which DI
produced a significant reduction in the estimate of levels of change (Table 1). For
each of those three variables, we look for associations of the reduction in observed
change achieved with DI with the other five employment variables analysed in
section 3.
11
Table 2: Percentage reporting change in employment characteristics, by wave 8 status
Percentage reporting change Treatment groups Base INDI RDI PDI INDI RDI PDI
SOC major group (1 digit) 1, 2 30 35 5* 20 26 19 3,4 30 21 14+ 37 39 36 6,7 34 24 30 35 43 33 5,8,9 30 35 22 50 40 51
SOC unit group (3 digits) 1, 2 55 46 5*** 20 26 19 3,4 60 44 14*** 37 39 36 6,7 43 30 33 35 43 33 5,8,9 54 45 29** 50 40 51
SIC92 section
A, C, E 33 25 0 6 4 4 D, F, I 32 13* 15* 38 32 41 G, H 28 24 25 29 29 24 J, K 17 25 13 18 16 16 L, M 21 18 5 14 22 19 N, O 27 31 23 34 29 30
SIC92 class
A, C, E 67 75 0* 6 4 4 D, F, I 50 53 17*** 38 32 41 G, H 38 28 38 29 29 24 J, K 28 44 13 18 16 16 L, M 50 41 5** 14 22 19 N, O 41 45 27 34 29 30
Number of employees
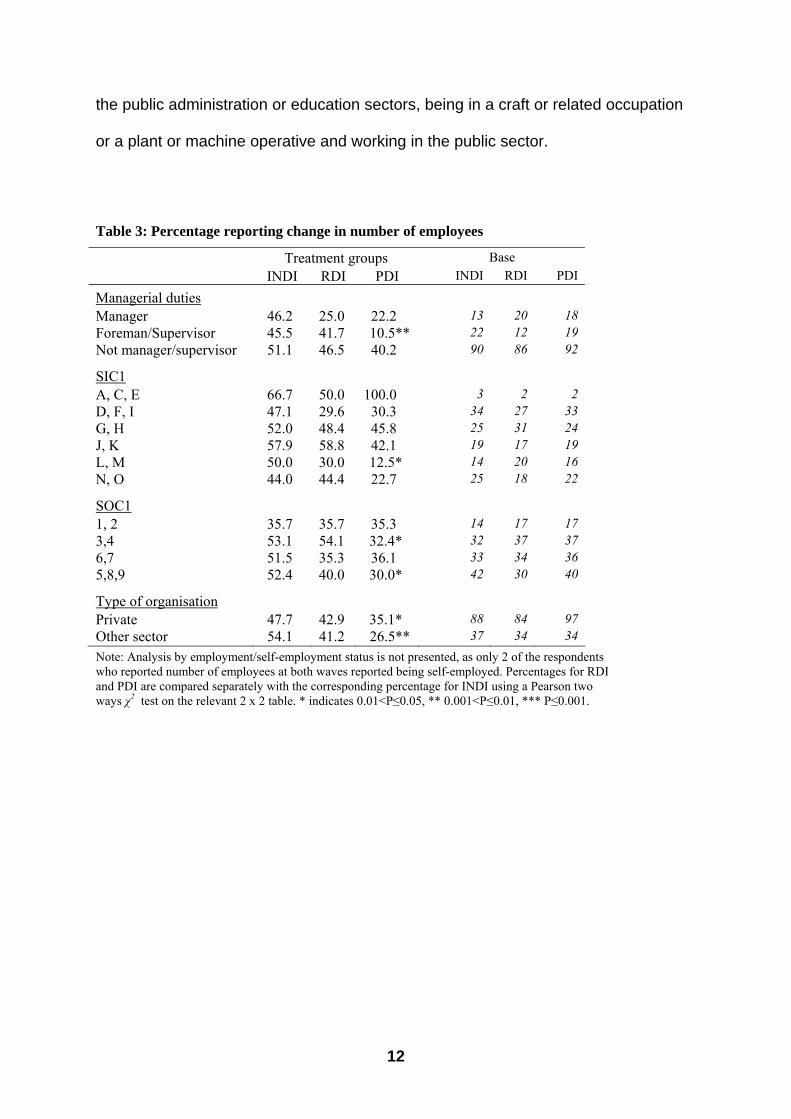
1-24 48 44 48 44 52 50 25-199 46 47 24* 41 45 37 200 and more 55 29* 23*** 40 21 44 Note: Percentages for RDI and PDI are compared separately with the corresponding percentage for INDI using a Pearson one way χ2 test on the relevant 2 x 2 table. * indicates 0.01<P≤0.05, ** 0.001<P≤0.01, *** P≤0.001, + p=0.051. SIC sections: A: Agriculture, Hunting and Forestry; B: Fishing; C: Mining and Quarrying; D: Manufacturing; E: Electricity, Gas and Water Supply; F: Construction; G: Wholesale and Retail Trade; H: Hotels and Restaurants; I: Transport, storage and Communication; J: Financial Intermediation; K: Real Estate, Renting and Business Activities; L: Public Administration and Defence; M: Education; N: Health and Social Work; O: Other Community, Social and Personal Service Activities. SOC major groups: 1: Managers & administrators; 2: Professional occupations; 3:Associate professional & technical occupations; 4: Clerical & secretarial occupations; 5: Craft & related occupations; 6:Personal & protective service occupations; 7: Sales occupations; 8:Plant & machine operatives; 9:Other occupations We look first at change in the reported number of employees at the workplace (Table
3). We find that a reduction with PDI in the propensity to report a changed number of
employees is associated with having foreman/supervisor status, being employed in
12
the public administration or education sectors, being in a craft or related occupation
or a plant or machine operative and working in the public sector.
Table 3: Percentage reporting change in number of employees
Treatment groups Base INDI RDI PDI INDI RDI PDI
Managerial duties Manager 46.2 25.0 22.2 13 20 18 Foreman/Supervisor 45.5 41.7 10.5** 22 12 19 Not manager/supervisor 51.1 46.5 40.2 90 86 92
SIC1 A, C, E 66.7 50.0 100.0 3 2 2 D, F, I 47.1 29.6 30.3 34 27 33 G, H 52.0 48.4 45.8 25 31 24 J, K 57.9 58.8 42.1 19 17 19 L, M 50.0 30.0 12.5* 14 20 16 N, O 44.0 44.4 22.7 25 18 22
SOC1 1, 2 35.7 35.7 35.3 14 17 17 3,4 53.1 54.1 32.4* 32 37 37 6,7 51.5 35.3 36.1 33 34 36 5,8,9 52.4 40.0 30.0* 42 30 40
Type of organisation Private 47.7 42.9 35.1* 88 84 97 Other sector 54.1 41.2 26.5** 37 34 34 Note: Analysis by employment/self-employment status is not presented, as only 2 of the respondents who reported number of employees at both waves reported being self-employed. Percentages for RDI and PDI are compared separately with the corresponding percentage for INDI using a Pearson two ways χ2 test on the relevant 2 x 2 table. * indicates 0.01<P≤0.05, ** 0.001<P≤0.01, *** P≤0.001.
13
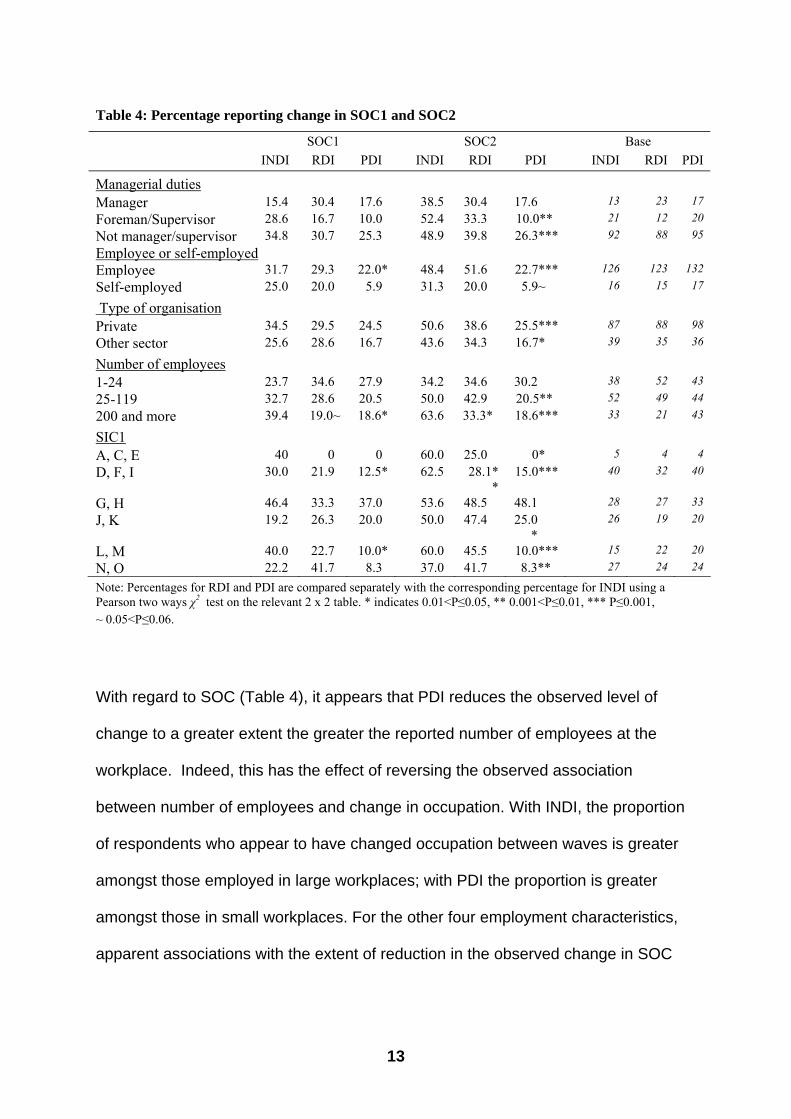
Table 4: Percentage reporting change in SOC1 and SOC2
SOC1 SOC2 Base INDI RDI PDI INDI RDI PDI INDI RDI PDI
Managerial duties
Manager 15.4 30.4 17.6 38.5 30.4 17.6 13 23 17 Foreman/Supervisor 28.6 16.7 10.0 52.4 33.3 10.0** 21 12 20 Not manager/supervisor 34.8 30.7 25.3 48.9 39.8 26.3*** 92 88 95 Employee or self-employed Employee 31.7 29.3 22.0* 48.4 51.6 22.7*** 126 123 132 Self-employed 25.0 20.0 5.9 31.3 20.0 5.9~ 16 15 17
Type of organisation
Private 34.5 29.5 24.5 50.6 38.6 25.5*** 87 88 98 Other sector 25.6 28.6 16.7 43.6 34.3 16.7* 39 35 36
Number of employees
1-24 23.7 34.6 27.9 34.2 34.6 30.2 38 52 43 25-119 32.7 28.6 20.5 50.0 42.9 20.5** 52 49 44 200 and more 39.4 19.0~ 18.6* 63.6 33.3* 18.6*** 33 21 43
SIC1
A, C, E 40 0 0 60.0 25.0 0* 5 4 4 D, F, I 30.0 21.9 12.5* 62.5 28.1*
* 15.0*** 40 32 40
G, H 46.4 33.3 37.0 53.6 48.5 48.1 28 27 33 J, K 19.2 26.3 20.0 50.0 47.4 25.0
* 26 19 20
L, M 40.0 22.7 10.0* 60.0 45.5 10.0*** 15 22 20 N, O 22.2 41.7 8.3 37.0 41.7 8.3** 27 24 24
Note: Percentages for RDI and PDI are compared separately with the corresponding percentage for INDI using a Pearson two ways χ2 test on the relevant 2 x 2 table. * indicates 0.01<P≤0.05, ** 0.001<P≤0.01, *** P≤0.001, ~ 0.05<P≤0.06.
With regard to SOC (Table 4), it appears that PDI reduces the observed level of
change to a greater extent the greater the reported number of employees at the
workplace. Indeed, this has the effect of reversing the observed association
between number of employees and change in occupation. With INDI, the proportion
of respondents who appear to have changed occupation between waves is greater
amongst those employed in large workplaces; with PDI the proportion is greater
amongst those in small workplaces. For the other four employment characteristics,
apparent associations with the extent of reduction in the observed change in SOC
14
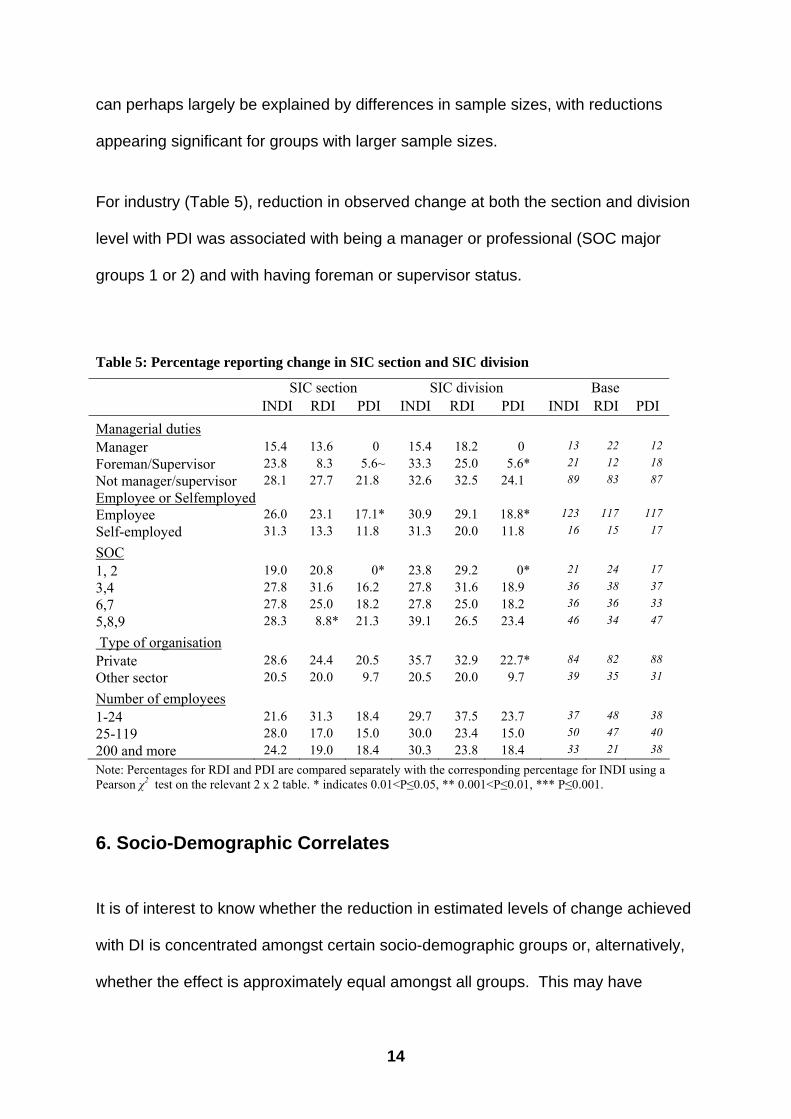
can perhaps largely be explained by differences in sample sizes, with reductions
appearing significant for groups with larger sample sizes.
For industry (Table 5), reduction in observed change at both the section and division
level with PDI was associated with being a manager or professional (SOC major
groups 1 or 2) and with having foreman or supervisor status.
Table 5: Percentage reporting change in SIC section and SIC division
SIC section SIC division Base INDI RDI PDI INDI RDI PDI INDI RDI PDI Managerial duties Manager 15.4 13.6 0 15.4 18.2 0 13 22 12 Foreman/Supervisor 23.8 8.3 5.6~ 33.3 25.0 5.6* 21 12 18 Not manager/supervisor 28.1 27.7 21.8 32.6 32.5 24.1 89 83 87 Employee or Selfemployed Employee 26.0 23.1 17.1* 30.9 29.1 18.8* 123 117 117 Self-employed 31.3 13.3 11.8 31.3 20.0 11.8 16 15 17
SOC
1, 2 19.0 20.8 0* 23.8 29.2 0* 21 24 17 3,4 27.8 31.6 16.2 27.8 31.6 18.9 36 38 37 6,7 27.8 25.0 18.2 27.8 25.0 18.2 36 36 33 5,8,9 28.3 8.8* 21.3 39.1 26.5 23.4 46 34 47
Type of organisation
Private 28.6 24.4 20.5 35.7 32.9 22.7* 84 82 88 Other sector 20.5 20.0 9.7 20.5 20.0 9.7 39 35 31
Number of employees
1-24 21.6 31.3 18.4 29.7 37.5 23.7 37 48 38 25-119 28.0 17.0 15.0 30.0 23.4 15.0 50 47 40 200 and more 24.2 19.0 18.4 30.3 23.8 18.4 33 21 38
Note: Percentages for RDI and PDI are compared separately with the corresponding percentage for INDI using a Pearson χ2 test on the relevant 2 x 2 table. * indicates 0.01<P≤0.05, ** 0.001<P≤0.01, *** P≤0.001.
6. Socio-Demographic Correlates
It is of interest to know whether the reduction in estimated levels of change achieved
with DI is concentrated amongst certain socio-demographic groups or, alternatively,
whether the effect is approximately equal amongst all groups. This may have
15
implications for survey design and for the interpretation of survey findings. In Table
6 we present estimates of the effect of interviewing method separately for subgroups
defined by sex, age and level of education. If the estimated level of change is
significantly lower with DI in one group (e.g. men) but not in the complementary
group (e.g. women), then we can conclude that the effect of DI is disproportionate
across the socio-demographic groups.
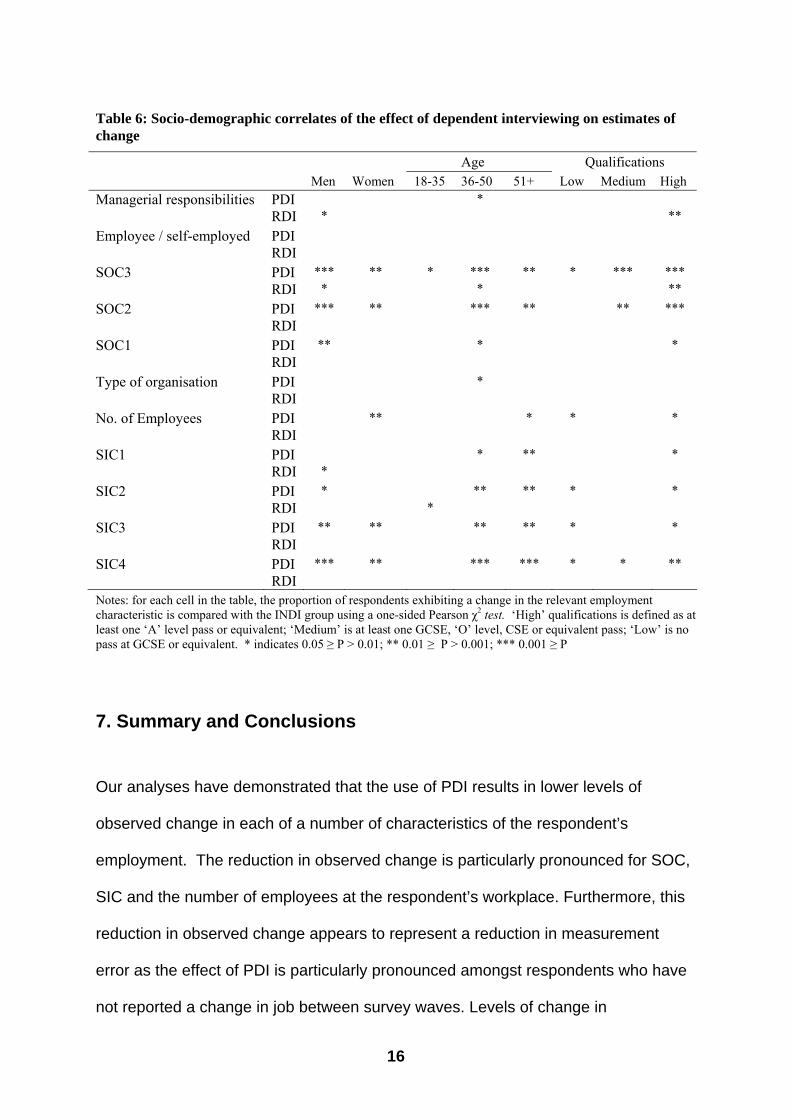
The observed findings are not completely consistent but two findings stand out.
First, it seems that PDI is less likely to make a difference to estimates of change for
respondents aged under 36 than for those aged 36 or over. For all three levels of
SIC and for SOC2, a significant reduction in the level of change is observed only for
the two older groups. For SOC1, managerial responsibilities, type of organisation
and number of employees, a significant reduction is observed for only one of the two
older groups. Second, it appears that the effect of PDI is stronger for the most highly
qualified respondents than for others. For two variables, managerial responsibilities
and SOC3, the same also seems to be true for RDI. As regards sex, DI seems to be
more likely to make a difference for men than for women, though differences are
inconsistent. There are three measures for which RDI makes a difference for men
only. With PDI, there are two measures for which only men are affected (SOC1 and
SIC2) and one for which only women are affected (number of employees).
16
Table 6: Socio-demographic correlates of the effect of dependent interviewing on estimates of change
Age Qualifications Men Women 18-35 36-50 51+ Low Medium High Managerial responsibilities PDI * RDI * ** Employee / self-employed PDI RDI SOC3 PDI *** ** * *** ** * *** *** RDI * * ** SOC2 PDI *** ** *** ** ** *** RDI SOC1 PDI ** * * RDI Type of organisation PDI * RDI No. of Employees PDI ** * * * RDI SIC1 PDI * ** * RDI * SIC2 PDI * ** ** * * RDI * SIC3 PDI ** ** ** ** * * RDI SIC4 PDI *** ** *** *** * * ** RDI Notes: for each cell in the table, the proportion of respondents exhibiting a change in the relevant employment characteristic is compared with the INDI group using a one-sided Pearson χ2 test. ‘High’ qualifications is defined as at least one ‘A’ level pass or equivalent; ‘Medium’ is at least one GCSE, ‘O’ level, CSE or equivalent pass; ‘Low’ is no pass at GCSE or equivalent. * indicates 0.05 ≥ P > 0.01; ** 0.01 ≥ P > 0.001; *** 0.001 ≥ P
7. Summary and Conclusions
Our analyses have demonstrated that the use of PDI results in lower levels of
observed change in each of a number of characteristics of the respondent’s
employment. The reduction in observed change is particularly pronounced for SOC,
SIC and the number of employees at the respondent’s workplace. Furthermore, this
reduction in observed change appears to represent a reduction in measurement
error as the effect of PDI is particularly pronounced amongst respondents who have
not reported a change in job between survey waves. Levels of change in
17
employment characteristics amongst INDI respondents who have not reported a
change in job remain implausibly high.
Some evidence has been presented that the reduction in measurement error brought
about by PDI is particularly associated with certain employment characteristics. A
reduction in the observed level of change in occupation is associated with SOC
major groups 1-4 and respondents working at workplaces with large number of
employees. A reduction in the observed level of change in industry is associated with
certain industries and with respondents who are managers or professionals (SOC
major groups 1 or 2) or have foreman or supervisor status. A reduction with PDI in
the observed level of change in number of employees at the workplace is associated
with large workplaces, having foreman/supervisor status, being employed in the
public administration or education sectors, and being in a craft or related occupation
or a plant or machine operative.
Finally, we investigated demographic correlates of the effect of PDI and found that
measurement error was particularly reduced amongst respondents aged 36 or over
and amongst the most highly qualified respondents.
In attempting to summarise the nature of the characteristics, both employment and
demographic, associated with a propensity for PDI to reduce measurement error in
estimates of change, we would suggest that many of these characteristics may be
those associated with an increased propensity to have complex jobs, the
characteristics of which are difficult to describe. This is likely to be true of more
highly qualified people, those in managerial, administrative or professional
occupations and those working at large workplaces. The more difficult it is to
describe a particular characteristic of a job, the more likely it is that it will be
18
described inconsistently in two survey interviews some time apart. This leads to
measurement error in estimates of change. Thus, perhaps what we are observing
here is simply that survey respondents who are more prone to measurement error
with traditional independent interviewing will be more likely to have reduced
measurement error if interviewed using PDI.
An alternative explanation might be PDI reduces the error disproportionately across
sample subgroups due to differences in the way the change in interviewing method
affects the cognitive processes during the interview. We find no obvious support for
this. For example, if this explanation held we might expect to find a greater reduction
in measurement error amongst respondents with lower levels of qualifications. We
find the opposite. However, we would also note that such an effect might be difficult
to identify due to the association of qualifications with employment characteristics.
For example, people with lower qualifications may indeed be prone to greater levels
of measurement error other things being equal, only for this effect to be outweighed
by the greater tendency of people with lower qualifications to be in occupations that
are easy to describe and easy for coders to recognise – i.e. occupations that are
prone to lower levels of measurement error.
We conclude that PDI is an effective questioning method for the reduction of
measurement error associated with measures of change in employment
characteristics. Additionally, we would conclude that measurement error in
measures of change from traditional independently-collected interviews is likely to be
greater amongst occupations that are difficult to describe consistently. This is likely
to include jobs where employees have a range of varied tasks, as opposed to routine
19
jobs involving a single task, or a limited number of closely-related tasks. Data
analysts might be advised to allow for this possibility.
References
Campanelli, P., Thomson, K., Moon, N. and Staples, T. (1997) The quality of
occupational coding in the United Kingdom, in L.Lyberg, P.Biemer, M.Collins,
E.de Leeuw, C.Dippo, N.Schwarz and D.Trewin (ed.s), Survey Measurement and
Process Quality, pp. 437-453 New York: John Wiley.
Central Statistical Office (1992) Standard Industrial Classification of Economic
Activities 1992. London: HMSO.
Employment Department Group and Office of Population Censuses and Surveys
(1990) Standard Occupational Classification, Volume 1: Structure and Definition
of Major, Minor and Unit Groups. London: HMSO.
Jäckle, A., Sala, E., Jenkins, S. and Lynn, P. (2004) Validation of survey data on
income and employment: the ISMIE experience. ISER Working Paper 2004-14.
Colchester: University of Essex.
http://www.iser.essex.ac.uk/pubs/workpaps/pdf/2004-14.pdf
Lynn, P., Jäckle, A., Jenkins, S.P. and Sala, E. (2004) The effects of dependent
interviewing on responses to questions on income sources, ISER Working Paper
2004-16. Colchester: University of Essex.
http://www.iser.essex.ac.uk/pubs/workpaps/pdfs/2004-16.pdf
Mathiowetz, N.A. and McGonagle, K.A. (2000) An assessment of the current state of
dependent interviewing in household surveys, Journal of Official Statistics, 16:4,
401-418.