Embed Size (px)
Citation preview

Measuring Cultural Diversity and its
Impact on Innovation: Longitudinal
Evidence from Dutch firms
Ceren Ozgen, Peter Nijkamp and Jacques Poot
NORFACE MIGRATION Discussion Paper No. 2013-03
www.norface-migration.org
Measuring Cultural Diversity and its Impact on Innovation:Longitudinal Evidence from Dutch firms*
Ceren Ozgena, Peter Nijkampb and Jacques Pootc
Abstract
To investigate econometrically whether cultural diversity of a firm’s employees boosts innovation,
we create a unique linked employer-employee dataset that combines data from two innovation
surveys in The Netherlands with administrative and tax data. We calculate three distinct measures of
diversity. We find that firms that employ fewer foreign workers are generally more innovative, but
that diversity among a firm’s foreign workers is positively associated with innovation activity. The
positive impact of diversity on product or process innovations is greater among firms in knowledge-
intensive sectors and in internationally-oriented sectors. The impact is robust to accounting for
endogeneity of foreign employment.
JEL code: D22, F22, O31
Keywords: immigration, innovation, cultural diversity, knowledge spillovers, linked administrative
and survey data
2 January 2013
_______________________________
* This research is part of the Migrant Diversity and Regional Disparity in Europe (MIDI-REDIE) project, funded by theNORFACE research programme Migration in Europe – Social, Economic, Cultural and Policy Dynamics. Earlier versions ofthis paper have been presented at the 50th European Congress of the Regional Science Association International,Barcelona, Spain, August 30-September 3, 2011, and at the International Workshop on Economic Impacts of Immigrationand Population Diversity, National Institute of Demographic and Economic Analysis (NIDEA), University of Waikato,Hamilton, New Zealand, April 11-13, 2012.Corresponding Author: Ceren Ozgen ([email protected])a,b
Department of Spatial Economics, VU University Amsterdam, De Boelelaan 1105, 1081 HV Amsterdam, The Netherlands.cNational Institute of Demographic and Economic Analysis, University of Waikato, Private Bag 3105, Hamilton 3240, New
Zealand.
1
1. Introduction
A recent strand of the migration literature has focused on the association between innovation and
the presence of foreign workers. There are several ways in which culturally diverse foreign workers
can impact on innovation. Some of these are positive, while others are negative (for a review, see
e.g. Alesina and La Ferrara, 2005). A positive impact could be due to immigrants being positively self-
selected in terms of their abilities and attitudes, for example, in terms of entrepreneurship and risk
taking. Secondly, immigrant recruitment policies of developed countries increasingly favour highly
skilled young migrants. Thirdly, immigrants bring to the workplace different ideas and perspectives
from their cultural backgrounds. Fourthly, foreign workers can facilitate trade with their home
countries and/or encourage the production of ethnic goods and services in host countries. Finally,
immigrants often exhibit high labour mobility, particularly in their early years in the host country.
This speeds up the inter-firm dissemination of new ideas.
On the negative side, cultural diversity can impede communication between workers, or lower levels
of trust within or between firms. Secondly, discrimination and non-transferability of skills, or non-
recognition of qualifications, can be barriers to free exchange of ideas and the accumulation of new
knowledge. Thirdly, co-ethnic networks can lead to spatial or occupational segregation and
clustering of migrant groups, which may also impede the contribution of immigrants to firm
innovation.
Given such a mixture of positive and negative effects, it is clear that the overall impact of
immigration on innovation is largely an empirical matter. In this context, various approaches are
possible. The first is to test whether there is more innovation, ceteris paribus, in geographical areas
(cities, regions) that are more culturally diverse. Several empirical case studies do suggest that
agglomerations with greater cultural diversity among their foreign born residents have higher levels
of innovation (Ottaviano and Peri, 2006; Suedekum et al., 2009; Niebuhr, 2010; Ozgen et al., 2012).
On the other hand, a larger share of immigrants in the labour force is often associated with lower
levels of innovation, particularly when the issue of endogeneity of migrant settlement (with migrants
predominantly settling in larger agglomerations that are more innovative) is taken into account
(Ozgen et al., 2012).
The second approach to identifying benefits of immigration for innovation is to focus on foreign
knowledge workers themselves and to compare the innovation activity of these workers, e.g. the
extent to which they generate patents, with those of native-born knowledge workers. The evidence
is fairly conclusive that host countries benefit from attracting highly able knowledge workers from
abroad (e.g., Zucker and Darby, 2007; Hunt and Gauthier-Loiselle, 2010; Kerr, 2010; Kerr and Lincoln,
2010).
The third approach is to consider the ethnic composition of staff at the workplace level within firms.
This is arguably the toughest test of spillover benefits of cultural diversity on co-workers, since it
attempts to empirically identify localised spillover benefits of foreign workers who mostly only
represent a small minority of the employees. At this level, the evidence to date is less conclusive.
Ozgen et al. (2011) find – using micro-level cross-sectional data in The Netherlands – that firms with
a greater share of foreign workers are on average less innovative, but that cultural diversity among a
firm’s foreign employees enhances innovation. Similar evidence has been found by Niebuhr and
Peters (2012) for Germany, by Parotta et al. (2011) for Denmark, and by Lee and Nathan (2010) for
firms in London. However, using similar data as Ozgen et al. (2011) utilize for The Netherlands,
2
Østergaard et al. (2011) find no significant effect of ethnic diversity on innovation at the firm level in
Denmark. Moreover, Maré et al. (2011) find no evidence that cultural diversity of New Zealand firms
boosts innovation.
Managers themselves often attest to a diverse workforce being crucial for encouraging different
perspectives and ideas that drive innovation (e.g. Forbes, 2011). However, the evidence is not
conclusive that management practices that encourage ethnic diversity have a positive impact on a
firm’s performance. Considering explicitly how teams perform within firms, a meta-analysis by Bell
et al. (2011) concludes that ethnic diversity negatively impacts on team performance. On the other
hand, taking the very specific case of sports teams, Alvarez et al. (2011) provide evidence that the
recruitment of foreign players in European basketball teams benefits the overall performance of
these teams. In any case, various measures are suggested in the literature to mitigate the possible
negative impacts of diversity (Ely and Thomas, 2001). These varying results seem to point out that
the positive impacts of diversity are likely to emerge in special context.
In this paper we extend the analysis of Ozgen et al. (2011) in four ways. Firstly, we are able to
construct a much larger data set on firm level innovation than in our previous paper. This is achieved
by combining the results of two successive innovation surveys (in 2002 and 2006, respectively) with
migrant characteristics and by imputing a skill level to migrants and the native born based on their
annual wages obtained from tax registers, rather than by restricting the observations to those who
were included in the Dutch labour force survey and of whom, therefore, the skill level was explicitly
recorded. Secondly, the larger data set permits us to exploit a panel structure in which we can
account for unobserved time-invariant heterogeneity of firms in the standard way. Thirdly, we
introduce a wider range of distinct measures of diversity than has hitherto been the case. By doing
so, we are able to decompose the concept of diversity, and show now how the composition of
labour with respect to diversity impacts on innovation. Finally, we focus on specific sectors and types
of firms through disaggregating results according to market orientation of the firm (domestic versus
international), industry and the type of innovation (general, product or process).
We find that firms that employ many foreign workers are generally less innovative, but that diversity
among foreign workers is positively associated with innovation activity. This effect is greater among
firms in knowledge-intensive sectors and in internationally-oriented sectors, and is robust to
accounting for endogeneity of foreign employment. We conclude that the recruitment of high-skilled
talent, which is a cornerstone of current immigration policy in many developed countries, is
particularly beneficial for innovation when such immigrants represent a variety of cultural
backgrounds.
The next section provides a brief discussion of the ways in which immigrants and cultural diversity
among foreign born or second-generation ethnic workers may influence innovation. Section 3
describes the econometric model, while section 4 outlines how the dataset was constructed and
how cultural diversity has been measured. Section 5 discusses the results of the regression analysis,
while section 6 offers concluding remarks.
3
2. Migrant Diversity and the Determinants of Innovation
Innovation is the process by which firms create better products, processes, services, technologies, or
ideas. There is a vast literature that discusses the determinants of innovation, starting with a seminal
contribution by Acs and Audretsch (1988) and a review by Dosi (1988). Innovation can be thought of
as the output of a knowledge production function, with major inputs consisting of the funds devoted
to R&D, combined with the appropriate capital and skilled labour. More generally, theoretical
modelling and empirical evidence to date suggests that available indicators of innovation activity at
the firm level are linked to firm size, market structure, R&D investment, gross fixed capital formation,
the availability and composition of skilled labour, the nature of the industry, the domestic and
foreign networks of firm owners and employees, features of the area in which the firm is located,
and institutional factors.
Generally, a firm will employ workers of many types defined by skills, experience and occupation.
Employment plays an important role in innovation, as technological advances come from things that
people do (Romer, 1990). Standard neoclassical labour demand theory shows that the demand for
each type of worker is determined by the demand for output, the wages to be paid, the production
technology and the related extent of substitutability or complementarity between the different
types of labour. Even without spillover benefits from cultural diversity and with workers of different
cultural backgrounds for given skill levels being perfect substitutes in production, the firm’s labour
force may exhibit a cultural mix that reflects the cultural composition of the workforce in the local
labour market. For reasons linked with networks, past migratory behaviour, international airport
locations and job opportunities, migrants – and particularly skilled ones – are disproportionally
attracted to large metropolitan areas (e.g., Poot et al. 2008). Because such metropolitan areas are
also the areas where much innovation activity takes place (e.g. Lobo and Strumsky, 2008; Audretsch
and Feldman, 2004), a spatial correlation between cultural diversity and innovation may be observed,
even when there is no causal link.
A positive causal link from diversity to innovation may nonetheless exist for various reasons. The first
is that firm expansion may be constrained by local scarcity of highly skilled and specialised labour, in
which case recruitment from abroad may essential (Beaverstock and Hall, 2012). The growth in
knowledge-intensive industries has led to global competition for talent, which is complementary to
locally available skills and can therefore contribute to firm expansion and the associated innovation
activity.
Besides these direct effects of diversity on innovation, there are also likely to be knowledge
spillovers from the employment of workers with different cultural backgrounds. Similarly, successful
migrant entrepreneurship can also spill over to host country entrepreneurs (Jaeger and Duleep,
2010). Moreover, with different perspectives and approaches to problem solving, migrants may
contribute to better decision making (Page, 2007). Of course, the effectiveness of such spillovers are
contingent on production conditions, such as the organisational culture, labour market structure and
institutions that jointly determine the receptivity of foreign knowledge at the destination (Jones and
Romer, 2010).
In contrast to these positive effects, there are also negative effects of cultural diversity that were
already briefly alluded to in the introduction. The first point is that the lower reservation wages of
immigrants may have a negative impact on long-run growth, when the availability of cheaper labour
makes it rational for firms to adopt more labour-intensive production technologies and thereby
4
discourage investment in new and technologically superior machines and equipment. This effect
would operate particularly with respect to the employment of lower skilled employees. High skilled
immigrants are likely to exhibit complementarity with new technology in production.
Secondly, cultural diversity at the workplace can create communication problems, either simply due
to linguistic difficulties but also due to misunderstandings associated with differences in tastes,
norms and values between immigrants and the native born. Such misunderstandings could
negatively impact on the effectiveness of day to day interactions and the productivity of team work.
Heterogeneity in norms and values may also lead to distrust or even outright conflict. In any case,
decision making in a diverse workplace may be more time consuming and therefore more costly.
Cultural diversity of staff may also trigger discrimination of minority groups, which in turn lowers the
productivity of the firm.
Migrants are generally young and have a high degree of labour mobility. While this ‘greases the
wheels’ of the local labour market (Borjas, 2001), it also implies that at the workplace level
immigrants often have less job tenure and therefore less job-specific training. If they contemplate
repeated migration, they may also exhibit less commitment to the firm. Such phenomena could
negatively impact on knowledge spillovers.
A further consequence of growing ethnic diversity is that it tends to lead to greater geographical
clustering and segregation (see e.g. Cutler et al. 2008). While ethnic precincts may have positive
urban consumption externalities, it may also limit the supply of foreign workers outside the
precincts or increase commuting distances of ethnic workers employed elsewhere in the city, with
associated increased employment costs.
We have identified a range of positive and negative impacts of cultural diversity on innovation and
firm performance. The overall impact remains an open question, both in terms of firm profitability
and in terms of general welfare. Some studies suggest an inverted U-shape relationship between
diversity and economic performance (see e.g. de Graaff and Nijkamp, 2010), leading to the notion of
optimal diversity. The evidence presented in this paper suggests that at the firm level, and for the
levels of immigration observed in the last decade, the impact of diversity on innovation at the firm
level has been positive, but with insufficient within-firm variation over the 2002-2006 period to
detect it in firm fixed effects models. However, a wide range of random effects models find a
significantly positive impact of diversity, particularly in the case of high skilled migrants in
knowledge-intensive sectors. The firm level evidence presented here complements the evidence of a
positive impact of diversity on innovation at the city level already mentioned in the introductory
section. The latter points to broader spillover benefits in consumption, production and endogenous
institutions, such as had already been highlighted by Jacobs (1969).
3. Specification of the Econometric Model
To estimate the impact of foreign workers on innovation we utilize a linear probability model
estimated with a two-wave panel data set. In our model, whether or not a firm reports any
innovation is a function of various firm characteristics, employee characteristics and characteristics
of the local economy (for summary statistics see Table 1). Given a large sample of data and the
incidence of innovation being relatively high, we estimate a linear probability model in which the
5
coefficients can be directly interpreted as marginal effects (e.g. Angrist, 2001). In any case, logit
estimation revealed highly similar results.1 The Dutch community innovation surveys (CIS) does not
provide patent applications or patents granted, or other quantitative measures of innovation.
Instead, the response variable is binary and reports whether a firm introduced any innovation, new
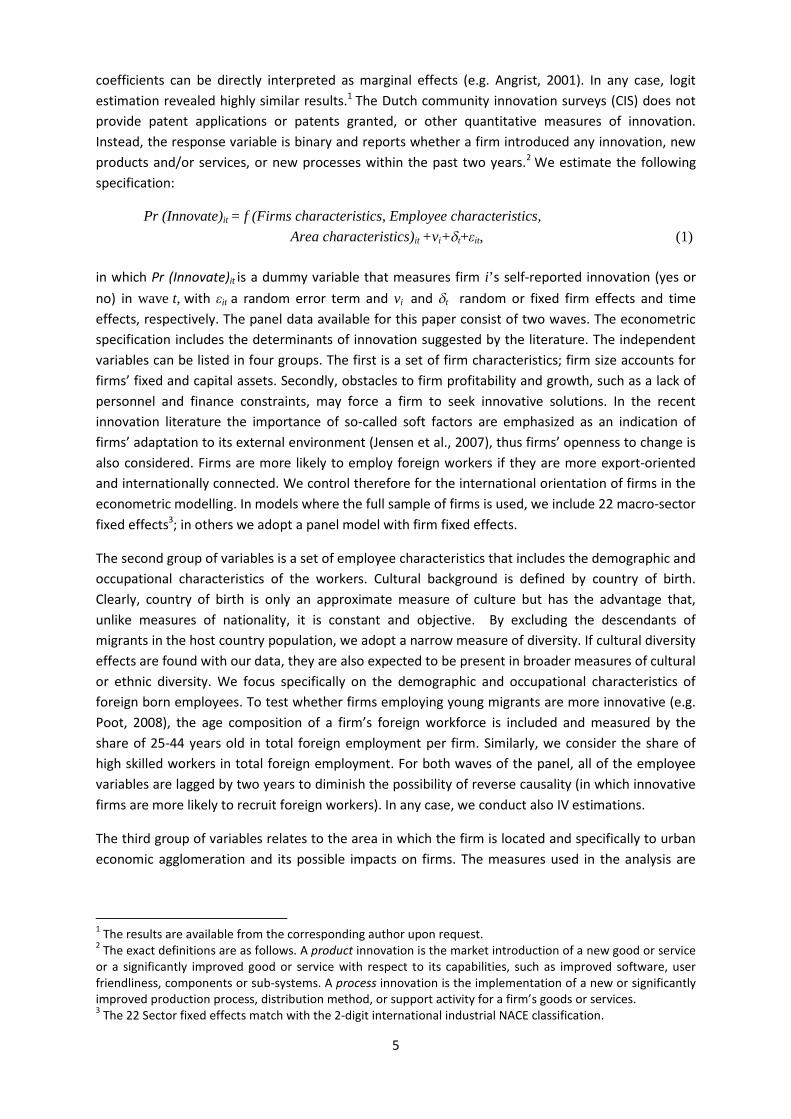
products and/or services, or new processes within the past two years.2 We estimate the following
specification:
Pr (Innovate)it = f (Firms characteristics, Employee characteristics,
Area characteristics)it +vi+t+εit, (1)
in which Pr (Innovate)it is a dummy variable that measures firm i’s self-reported innovation (yes or
no) in wave t, with εit a random error term and vi and t random or fixed firm effects and time
effects, respectively. The panel data available for this paper consist of two waves. The econometric
specification includes the determinants of innovation suggested by the literature. The independent
variables can be listed in four groups. The first is a set of firm characteristics; firm size accounts for
firms’ fixed and capital assets. Secondly, obstacles to firm profitability and growth, such as a lack of
personnel and finance constraints, may force a firm to seek innovative solutions. In the recent
innovation literature the importance of so-called soft factors are emphasized as an indication of
firms’ adaptation to its external environment (Jensen et al., 2007), thus firms’ openness to change is
also considered. Firms are more likely to employ foreign workers if they are more export-oriented
and internationally connected. We control therefore for the international orientation of firms in the
econometric modelling. In models where the full sample of firms is used, we include 22 macro-sector
fixed effects3; in others we adopt a panel model with firm fixed effects.
The second group of variables is a set of employee characteristics that includes the demographic and
occupational characteristics of the workers. Cultural background is defined by country of birth.
Clearly, country of birth is only an approximate measure of culture but has the advantage that,
unlike measures of nationality, it is constant and objective. By excluding the descendants of
migrants in the host country population, we adopt a narrow measure of diversity. If cultural diversity
effects are found with our data, they are also expected to be present in broader measures of cultural
or ethnic diversity. We focus specifically on the demographic and occupational characteristics of
foreign born employees. To test whether firms employing young migrants are more innovative (e.g.
Poot, 2008), the age composition of a firm’s foreign workforce is included and measured by the
share of 25-44 years old in total foreign employment per firm. Similarly, we consider the share of
high skilled workers in total foreign employment. For both waves of the panel, all of the employee
variables are lagged by two years to diminish the possibility of reverse causality (in which innovative
firms are more likely to recruit foreign workers). In any case, we conduct also IV estimations.
The third group of variables relates to the area in which the firm is located and specifically to urban
economic agglomeration and its possible impacts on firms. The measures used in the analysis are
1The results are available from the corresponding author upon request.
2The exact definitions are as follows. A product innovation is the market introduction of a new good or service
or a significantly improved good or service with respect to its capabilities, such as improved software, userfriendliness, components or sub-systems. A process innovation is the implementation of a new or significantlyimproved production process, distribution method, or support activity for a firm’s goods or services.3
The 22 Sector fixed effects match with the 2-digit international industrial NACE classification.
6
market structure (the ratio of firms over jobs per COROP region4) and a density variable (the number
of firms per municipality). The former measures the extent of local competition while the latter
measures the extent of agglomeration.
The fourth group of measures refer to the diversity of employees of a firm. There is no one way in
measuring such diversity. The selection of a diversity measure depends on the research question and
the nature of the data (see Nijkamp and Poot, 2012). We aim to disentangle different aspects of
diversity; for example a sample can be very diverse yet have significant clustering with respect to
same groups. Therefore, we scrutinize three aspects of a diverse population; i) an aggregate
measure of the diversity of the whole population; ii) homogeneity of the foreign workers; iii)
richness of the foreign composition.
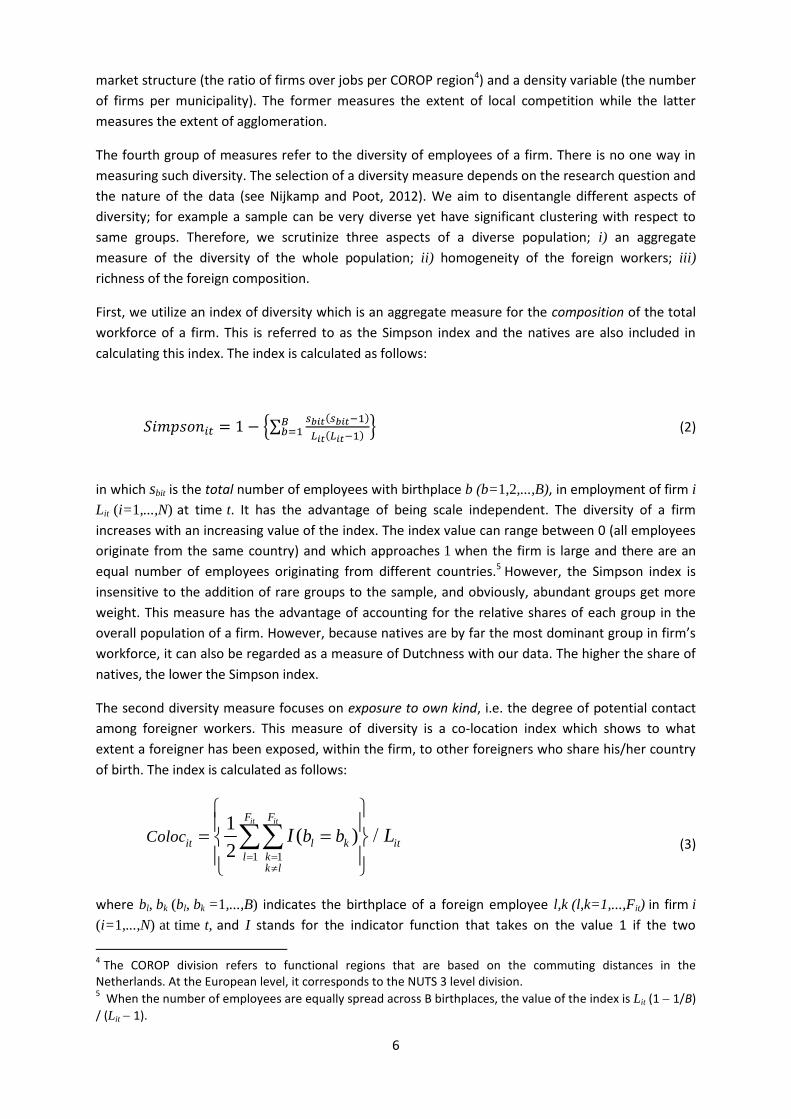
First, we utilize an index of diversity which is an aggregate measure for the composition of the total
workforce of a firm. This is referred to as the Simpson index and the natives are also included in
calculating this index. The index is calculated as follows:
ݏ ௧= 1 − ቄ∑௦ (௦ ଵ)
( ଵ)ୀଵ ቅ (2)
in which sbit is the total number of employees with birthplace b (b=1,2,...,B), in employment of firm i
Lit (i=1,...,N) at time t. It has the advantage of being scale independent. The diversity of a firm
increases with an increasing value of the index. The index value can range between 0 (all employees
originate from the same country) and which approaches 1 when the firm is large and there are an
equal number of employees originating from different countries.5 However, the Simpson index is
insensitive to the addition of rare groups to the sample, and obviously, abundant groups get more
weight. This measure has the advantage of accounting for the relative shares of each group in the
overall population of a firm. However, because natives are by far the most dominant group in firm’s
workforce, it can also be regarded as a measure of Dutchness with our data. The higher the share of
natives, the lower the Simpson index.
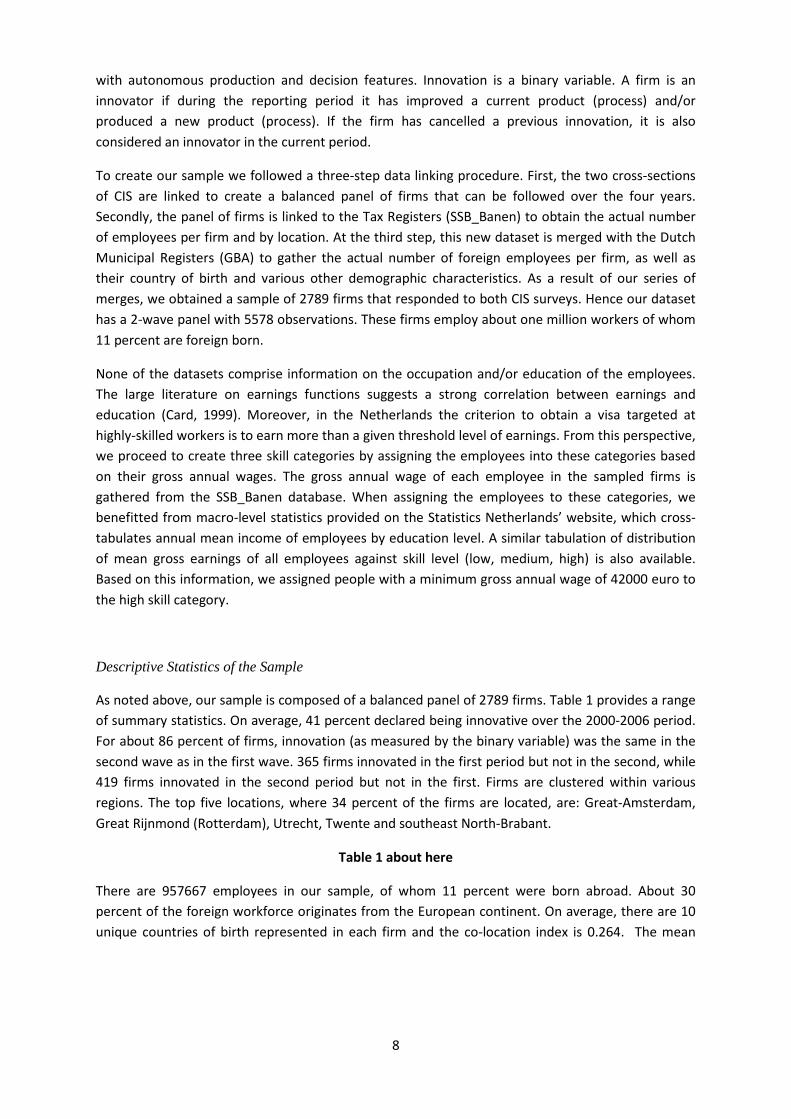
The second diversity measure focuses on exposure to own kind, i.e. the degree of potential contact
among foreigner workers. This measure of diversity is a co-location index which shows to what
extent a foreigner has been exposed, within the firm, to other foreigners who share his/her country
of birth. The index is calculated as follows:
1 1
1( )
2
it itF F
it l k itl k
k l
Coloc b bI L
(3)
where bl, bk (bl, bk =1,...,B) indicates the birthplace of a foreign employee l,k (l,k=1,...,Fit) in firm i
(i=1,...,N) at time t, and I stands for the indicator function that takes on the value 1 if the two
4The COROP division refers to functional regions that are based on the commuting distances in the
Netherlands. At the European level, it corresponds to the NUTS 3 level division.5
When the number of employees are equally spread across B birthplaces, the value of the index is Lit (1 1/B)
/ (Lit 1).

7
employees l and k within the firm have the same country of birth and zero otherwise. The co-
location index takes on the value zero if the firm has no two foreign workers sharing the same
country of birth, or when the firm is composed of natives only. The index value is equal to the sum of
the number of coincidences per firm divided by the total number of employees, Lit, in firm i. If all Fit
foreign workers were born in the same country Colocit is ½[(Fit(Fit-1))/Lit]. It is clear that the larger
the value of Colocit is, the higher the homogeneity of foreign employment in firm i.6
Third, we argue that the richness of the birthplace variety is another important component of a
diverse population. If one considers that each country has its own distinct features, the way people
think, act, and work will vary with the number of countries represented in each firm. A Nobel
Laureate Linus Pauling said: “the best way to have a good idea is to have a lot of ideas” (Uzzi and
Dunlap, 2005). Thus, a simple count of the unique number of countries of birth represented in each
firm is an alternative measure of diversity at the firm level:
1
B
it bitb
Unique U
(4)
in which Ubit is a dummy variable that is equal to one when country b is represented in firm i at time
t and zero otherwise. With the increasing cultural diversity at the firm level, the value of unique
increases. Its value ranges between 1 and B.7
The following section describes the creation of the linked employer-employee dataset (LEED) and
the sample statistics.
4. Data and Construction of the Sample
We combine three confidential high-quality firm/individual level micro-datasets obtained from
Statistics Netherlands. The firms in our dataset come from the Community Innovation Surveys CIS
3.5 (2000-2002) and CIS 4.5 (2004-2006) which provide the anchor of our empirical strategy. The
innovations surveys monitor periodically the innovativeness of Dutch firms. The surveys straddle
over two years between the time the questionnaires are sent to firms and the results are reported.
Each survey provides about 11000 firm observations.8 The employee data are retrieved from the Tax
Register in the Netherlands (SSB_Banen) which is a census of employees in the Dutch labour market.
This dataset covers about 10 million employees, who can be observed multiple times (for more
details see Ozgen et al., 2011). Finally, the ethnic and demographic background information of the
employees is obtained from the Dutch Municipal Registers (GBA) which provides a census of people
living in the Netherlands, with about 16 million observations. Firms are company establishments
6Accordingly, in our sample, at the very right tail of the distribution for Coloc, most coincidences occur in the
Low-skilled business services sector, while on the left tail of the distribution least coincidences occur inWholesale trade and repair sector.7
The number of countries of birth represented in a firm varies between 1 (Netherlands only) and 197.8
To create the sample, Statistics Netherlands selects the firms from the General Business Register. Public-sector and NGO-type of activities are excluded. A further selection is based on firm size. Firms employing lessthan 10 persons are not included in the sample. Firms employing more than 50 persons are all included in thesample, i.e. for such firms the survey is a census. For firms employing 10 to 50 persons, only a fraction israndomly selected into the sample. The size of this fraction depends on the industry and the firm size.
8
with autonomous production and decision features. Innovation is a binary variable. A firm is an
innovator if during the reporting period it has improved a current product (process) and/or
produced a new product (process). If the firm has cancelled a previous innovation, it is also
considered an innovator in the current period.
To create our sample we followed a three-step data linking procedure. First, the two cross-sections
of CIS are linked to create a balanced panel of firms that can be followed over the four years.
Secondly, the panel of firms is linked to the Tax Registers (SSB_Banen) to obtain the actual number
of employees per firm and by location. At the third step, this new dataset is merged with the Dutch
Municipal Registers (GBA) to gather the actual number of foreign employees per firm, as well as
their country of birth and various other demographic characteristics. As a result of our series of
merges, we obtained a sample of 2789 firms that responded to both CIS surveys. Hence our dataset
has a 2-wave panel with 5578 observations. These firms employ about one million workers of whom
11 percent are foreign born.
None of the datasets comprise information on the occupation and/or education of the employees.
The large literature on earnings functions suggests a strong correlation between earnings and
education (Card, 1999). Moreover, in the Netherlands the criterion to obtain a visa targeted at
highly-skilled workers is to earn more than a given threshold level of earnings. From this perspective,
we proceed to create three skill categories by assigning the employees into these categories based
on their gross annual wages. The gross annual wage of each employee in the sampled firms is
gathered from the SSB_Banen database. When assigning the employees to these categories, we
benefitted from macro-level statistics provided on the Statistics Netherlands’ website, which cross-
tabulates annual mean income of employees by education level. A similar tabulation of distribution
of mean gross earnings of all employees against skill level (low, medium, high) is also available.
Based on this information, we assigned people with a minimum gross annual wage of 42000 euro to
the high skill category.
Descriptive Statistics of the Sample
As noted above, our sample is composed of a balanced panel of 2789 firms. Table 1 provides a range
of summary statistics. On average, 41 percent declared being innovative over the 2000-2006 period.
For about 86 percent of firms, innovation (as measured by the binary variable) was the same in the
second wave as in the first wave. 365 firms innovated in the first period but not in the second, while
419 firms innovated in the second period but not in the first. Firms are clustered within various
regions. The top five locations, where 34 percent of the firms are located, are: Great-Amsterdam,
Great Rijnmond (Rotterdam), Utrecht, Twente and southeast North-Brabant.
Table 1 about here
There are 957667 employees in our sample, of whom 11 percent were born abroad. About 30
percent of the foreign workforce originates from the European continent. On average, there are 10
unique countries of birth represented in each firm and the co-location index is 0.264. The mean
9
Simpson index is 0.185. Comparing the two waves, all measures of diversity increase (see Table 2).9
An increase in the size of the eastern-Europeans and east-Asians is noticeable (not shown in the
table). Innovation activity increased also between 2002 and 2006. The foreigners are predominantly
young and the share of high skilled foreign workers among the total foreign workforce is 19 percent
on average (Table 1), but decreased from 21 percent in 2002 to 16 percent in 2006 (Table 2). This
coincides with a period during which overall immigration in The Netherlands declined (e.g., Berkhout
and Sudulich, 2011).
Table 2 about here
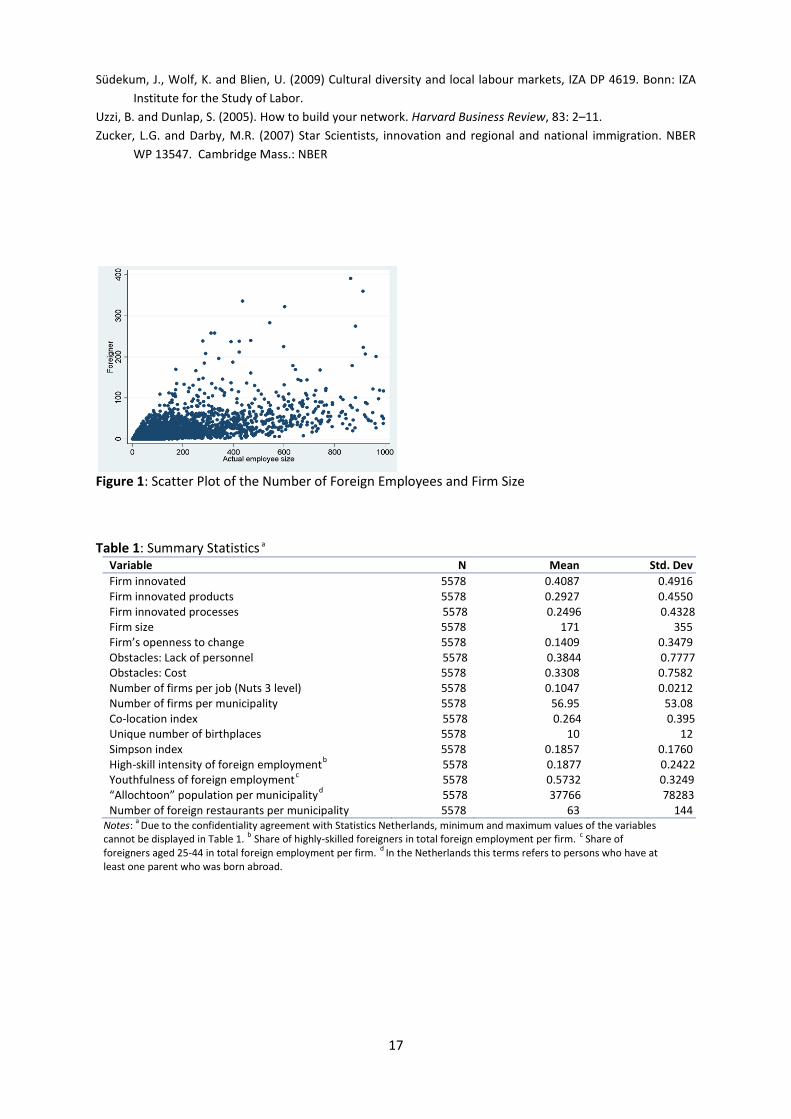
Our data predominantly comprise firms with 100 employees or more. The average firm size is 171.
Therefore, the results are suggestive mostly for large firms. There is no simple relationship between
firm size and the number of foreigners the firm employs (See Figure 1). Instead, the foreign born are
clustered in certain sectors. Large firms, however, are more likely to be diverse in terms of the
unique number of countries of birth present, while they are not necessarily the most diverse in
terms of overall composition.
Figure 1 about here
5. Results of the Regression Analysis
In this section, we proceed with reporting the regression analysis of the panel data. As described
before, we are using a two-wave panel from 2000-2002 and 2004-2006 data and estimate linear
probability models.
5.1.All Firms
The panel data regressions are estimated by means of fixed and random effects models with the
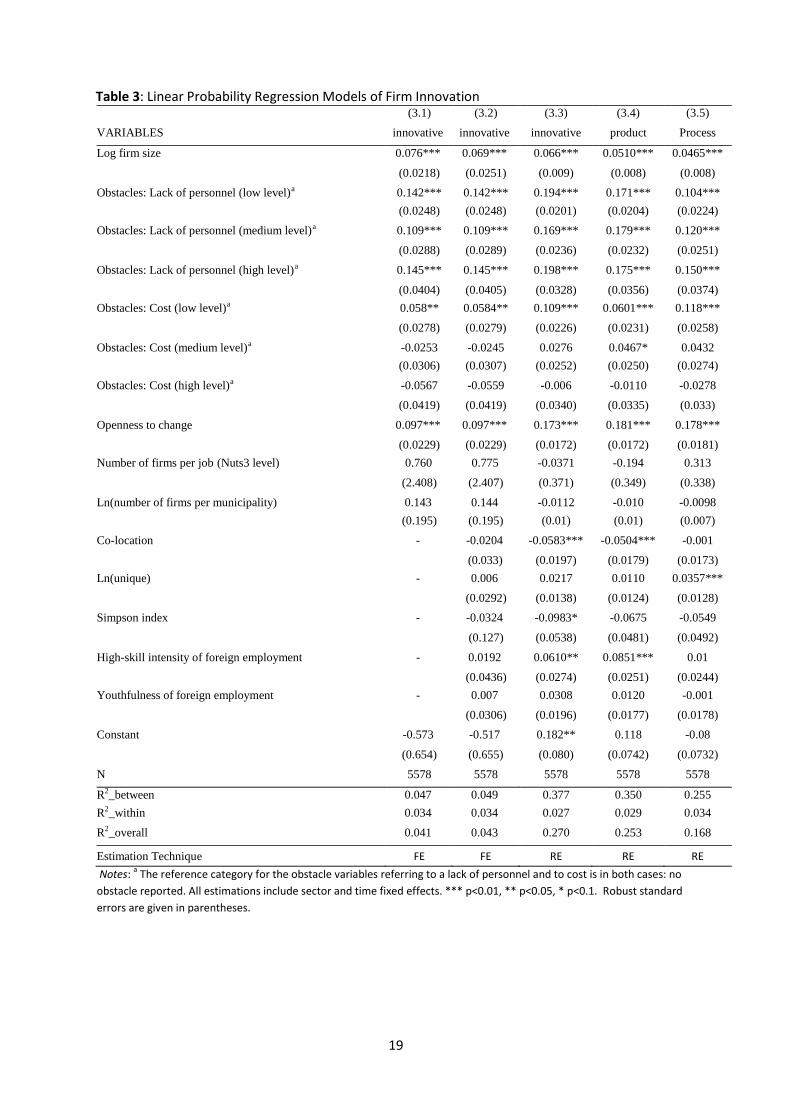
data consisting of a balanced panel of 2789 firms observed twice. Table 3 shows 5 regressions.
Specification 3.1 is a fixed effects model of innovation incidence with firm-level variables, regional
controls and time fixed effects, but not employee characteristics. The results are in conformity with
the innovation literature in that the firm’s characteristics are important drivers of innovation. Firm
size is, as expected, a significant factor (at the 1 percent level) that boosts innovation. A 10 percent
increase in firm size increases the chances to innovate by 0.76 percent. Recently, the innovation
literature emphasizes the importance of so-called soft factors, such as organizational restructuring,
as the means through which a firm’s prospect to innovate are increased. Regression 3.1 shows that
firms that are open to change their organizational structure in relation to the third parties are 0.1
percentage points more likely to raise their innovation outputs than those which did not experience
any organizational restructuring. Similarly, firms which reported costs and lack of personnel as
obstacles to firm profitability and growth, appear to be more innovative. The reference values are no
lack of personnel and no cost obstacles respectively. The results suggest that a lack of personnel is
9The Simpson index is uncorrelated with the natural logarithm of the unique number of birthplaces and with
the co-location measure. The correlation coefficient between the natural logarithm of the unique number ofbirthplaces and the co-location is about -0.6.
10
an important driver of innovation (but differences between the low, medium and high levels of
personnel shortage are not statistically significant). With respect to costs, the impact is nonlinear. A
limited concern about costs raises innovation (relative to an absence of cost constraints), but with
medium or high cost obstacles innovation is less (as it is also when there are no cost obstacles). We
do not find a statistically significant impact of the competition and agglomeration variables in
Specification (3.1) and subsequent specifications.
Table 3 about here
In specification 3.2 we add two measures for employee characteristics and three diversity measures.
These are: the skill level and youthfulness of the foreign employees; the Simpson diversity index, co-
location of foreign workers in total employment, and unique number of birthplaces in a firm, as
defined in equations (2), (3) and (4), respectively. We do not find that within-firm changes in
employee characteristics affect innovation. The likely reason is that the within-firm change in these
variables over the four year period is rather small, compared with changes in firm characteristics
such as due to restructuring and obstacles. Unfortunately, our empirical design does not constitute a
natural experiment in which in a randomly selected number of firms, the number of foreigners is
increased substantially. By and large, the change in innovation is triggered by a change in firm size,
firm restructuring or by changes in personnel or cost obstacles. To better capture the impact of
variables that change little over time, we use the random effects model (OLS gives qualitatively
similar results but assumes an absence of unobserved firm heterogeneity). Therefore, all the
following results are obtained through random effects estimation.
Specification 3.3 shows the results of the random effects model with the same specification as in 3.2.
In addition to the variables mentioned already, 22 macro-sector dummies are included in these
regressions to account for structural differences in innovation across sectors. We observe that the
coefficients of firm variables are slightly larger while the significance levels are unchanged. One
employee variable, however, now becomes statistically significant. Higher skilled foreign workers
have a positive impact on innovation at the 5 percent level. A 1 percentage point increase in the
intensity of high-skilled foreign employment in a firm leads to 0.06 percentage point increase in the
probability to innovate.
The co-location index is also statistically significant. This is a measure of exposure to own kind, i.e. a
measure of homogeneity of the foreign workforce. Our results suggest that the innovativeness of
the firms is likely to decrease with increasing homogeneity of the foreign workforce at the firm level.
The co-location index is negative and significant at the 1 percent level. The literature argues that
clustering of workers from the similar origin may lead to grouping internally, exclusion of ‘others’
(non-group members), and create integration problems, since grouping with own-kind is mostly
preferred over opening up to new cultures.
We find a negative effect of Simpson diversity index on probability to innovate. The coefficient is
negative and significant at the 10 percent level. This index includes natives and is sensitive to the
presence of the dominant groups. So, since the natives in the total employment of a firm are highly
represented, the impact of this measure is likely to be influenced by the natives. We conclude that,
on average, firms with a greater share of foreign-born are less innovative. This is consistent with
earlier evidence, such as Ozgen et al. (2011). It is important to emphasize that the sample consist of
all sectors in the economy including service sectors with predominantly low skilled foreign
employees. Finally we do not find an impact of the unique variable and the youthfulness of the
11
foreign employment in a firm for innovations as a whole. The time dummy coefficient (not reported
in Table 3) is significant and negative; suggesting that the upward trend in innovation reported in
Table 2 is due to changing firm and employee characteristics rather than a secular national increase
in innovativeness. Sector dummies (also not reported due to space constraints) are as expected in
terms of the literature. Firms in the Chemicals sector as well as in the Machinery and Equipment
sectors are more likely to innovate than other sectors.
The data allow us to look into the impact of the various diversity measures on different innovation
types. In specification 3.4 and 3.5, we report the results for product and process innovations,
respectively. Since the coefficients of firm characteristics are robust over all the estimations, we will
only discuss the impact of employee characteristics in the following regressions. We find that firms
with a diverse composition of the foreign workforce generate more product and service innovations,
but that such diversity has no impact on process innovations. The co-location variable is negative
and significant at the 1 percent level for product innovations. In contrast, the unique number of
birthplaces positively affects process innovations but not product innovations. A 1 percent increase
in the number of birthplaces represented in a firm increases the probability to innovate by about
0.04 percentage points. Finally, the skill intensity of the foreign employees proves to be a crucial
input that increases product innovations (significant at the 1 percent level). These results suggest
that what matters for process innovation is the generation of new ideas and new perspectives that
can come potentially from having a wider range of birthplaces represented among the firm’s
employees.
5.2.Alternative Samples: Selected Group of Firms
Foreigners tend to cluster more in some sectors than others, and innovation activity also varies
considerably across sectors. Even if immigrants are concentrated in sectors that are not innovative
(such as cleaning services) and an inverse relationship is therefore found at the macro level between
the employment of foreigners and innovation, there may still be benefits of a diverse workforce for
firms in sectors that are highly innovative. To explore sector-driven heterogeneity, we take some
sub-samples from our firm data. These sub-samples are obtained by considering the migration and
innovation literatures. We are also guided by what our panel data suggest in the case of Netherlands,
since every country has to some extent different economic and social dynamics. This section reports
the regression results based on these selected sub-samples.
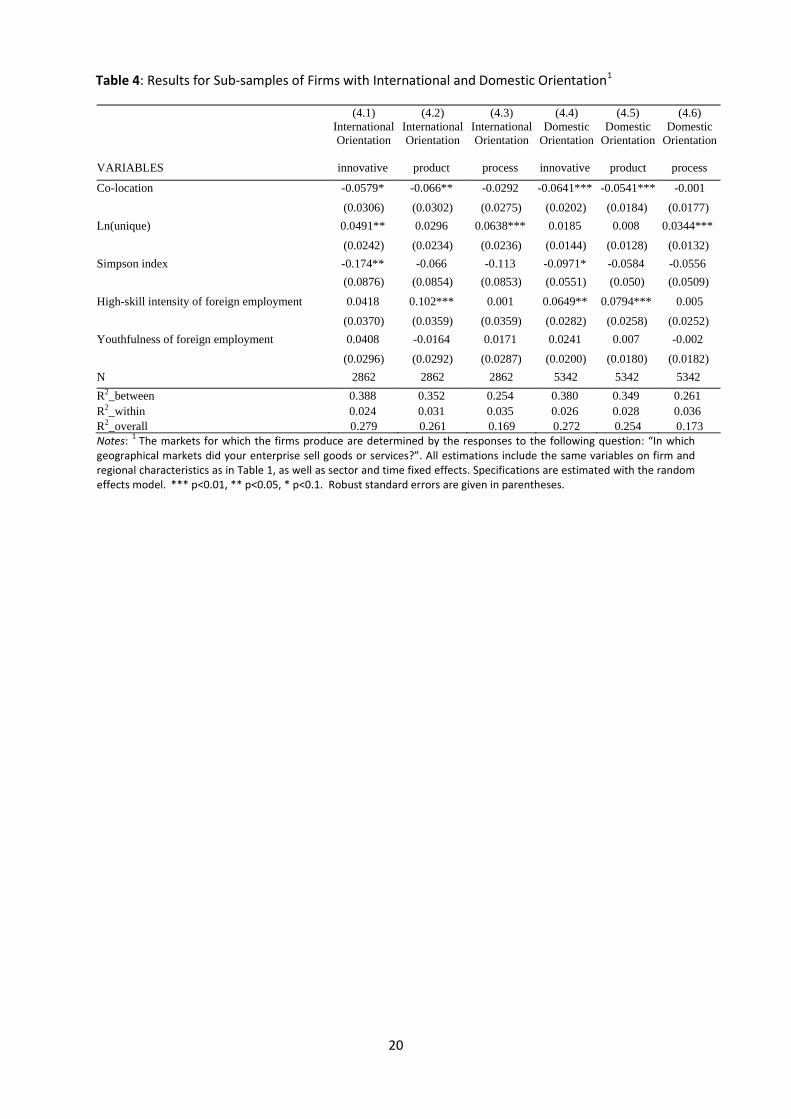
The first set of regressions refers to the orientation of the markets in which the firms sell their
products and services. There is a large literature focusing on firms’ trade links, and how they benefit
from immigrant/foreign workers (Genc et al., 2012). Table 4 reports the impact of workforce
diversity on various innovation types, once the market orientation of the firms is considered. The CIS
surveys ask the firms explicitly to indicate for which market(s) they target to sell their goods. The
first 3 regressions, (4.1)-(4.3), are based on a sub-sample of 1431 firms that focus on international
markets (countries of the European Union and European Free Trade Association; EU candidate
countries; and all other countries) while specifications (4.4)-(4.6) refer to firms that report a
domestic orientation. These firms report that they sell good/services and/or processes for domestic
markets (local/regional and national markets of the Netherlands). For clarity, the table shows only
results with respect to diversity and the characteristics of immigrant employees.
12
Qualitatively, the results are quite similar between an international orientation and a domestic
orientation (note that the two are not mutually exclusive: the total number of firms is 2739, of who
1431 report an international orientation and 2671 a domestic orientation). The table shows that the
impact of the co-location index is negative and very significant, except for process innovations,
among firms that have an international or domestic markets orientation. On the other hand, the
richness of the labour force, in the form of the unique number of birthplaces represented in a firm,
is a significant driver of process innovations at the 1 percent level, while it has no impact on product
innovations (but is significant for innovations overall among internationally oriented firms).
Table 4 about here
The big difference between an international orientation and a domestic orientation is the coefficient
of co-location (which is larger in absolute value for product innovations among internationally
oriented firms) and the impact of high-skill intensity of foreign employment, which affects firms with
an international orientation more than firms with a domestic orientation. Homogeneity of foreign
employees (as measured by the co-location variable) particularly hinders product innovation of
internationally oriented firms, as the trade facilitation literature suggests. Firms in both categories
benefit from highly-skilled employees, particularly, in terms of product innovations.
Our second sub-sample excludes the sectors in which low-skilled foreign labour is mostly
concentrated. Low-skilled foreign labour may cluster in sectors such as construction, cleaning and
retail trade that are not necessarily striving to reach an innovative edge. The top four sectors where
the fraction of low-skilled foreign workers per firm is the highest are: Low-skilled Business Services
(Cleaning, security, call centres, secretaries, photography developers etc); Retail Trade; Hotels and
Restaurants; and Manufacturing not elsewhere classified (Furniture, Recycling, etc.). These sectors
are excluded from the sub-sample. Once these sectors with low-skilled foreigners are excluded, we
observe that the coefficients of the diversity measures become slightly more significant and larger
(Table 5). The exposure to own-kind measure - co-location index- is significant and negative, except
for process innovations, at the 1 percent level, while the coefficient of the natural logarithm of the
number of countries of birth represented in the firm is positive and significant for process
innovations and for innovations as a whole. High skill intensity of foreign employment continues to
benefit product innovation.
Table 5 about here
5.3.Robustness Checks
With the regressions presented so far the question remains whether the innovativeness of the firms
is increasing due to the diversity of the employee composition or whether immigrant workers are
sorted into firms that are more innovative. We address this potential endogeneity problem in two
different ways. First, we re-estimate specifications (3.3)-(3.5) by fixing the diversity measures at their
value in year 2000. We therefore control for possible endogenous sorting over the 2002-2006 period
during which innovation is measured. The results are reported in Table 6. Secondly, we utilize an
instrumental variables (IV) estimation in which we instrument the Simpson index with two
exogenous variables. Those results are reported in Table 7.
13
Table 6 about here
Econometric Specifications with Time-Invariant Diversity Measures
Our panel data set is composed of two waves with four years in between. It is possible that the
innovation output of the first period influences the sorting of foreign labour across firms in the
second period, thereby biasing the estimated impact of diversity on innovation. Hence, we repeat
the econometric specifications (3.3)-(3.5) in Table 3, but fix all of the measures on the composition
and richness of diversity at their values in 2000 (see Table 6). This provides in column (6.1) additional
evidence that extensive homogeneity (co-location) is bad for innovation, while ln(unique) has
positive and statistically significant coefficients. A high value of the Simpson index implies a low
share of native born, and this also lowers innovation in regressions (6.1) and (6.2) as in previous
regressions. High-skill intensity and youthfulness have also positive impacts on the innovation
propensity, specifically product innovations. Hence these regressions confirm that the youthfulness
of foreign employees (the share of those aged 25-44) has a positive impact on innovation.
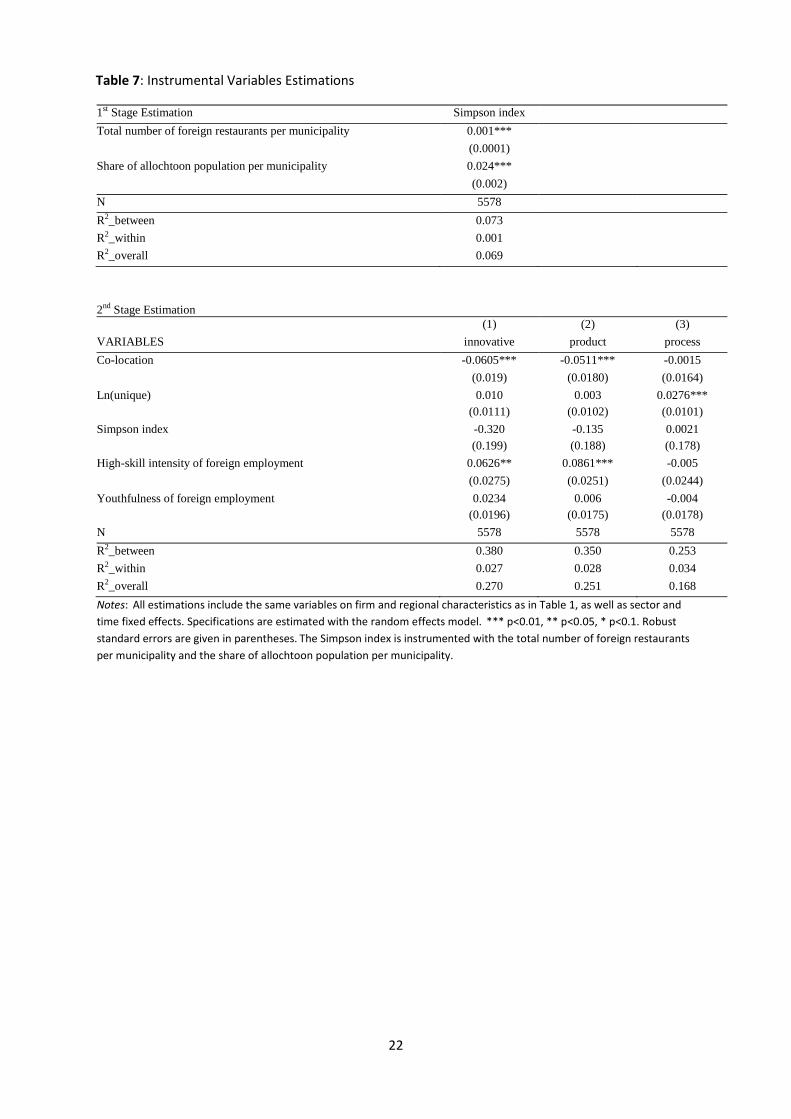
Instrumental Variables Estimations
The strongest assumption we made so far is that our estimations do not suffer from a reverse
causality in the relationship between migration and innovation. Finding a country-wide natural
experiment at the firm level to avoid this reverse causality is simply not realistic. It is, however,
possible to account for potential bias by instrumental variables estimation which is by far the most
common technique to address the endogeneity issues in non-experimental studies. We instrument
the Simpson index with two exogenous variables that do not correlate with the error term of the
regression but that are good predictors of the composition of the overall workforce in firms.
Firstly we introduce a novel instrument, namely the total number of foreign restaurants per
municipality. We argue that the presence of foreign restaurants in an area can be an obvious cause
of sorting the foreign workers (Clark, 2002; Shapiro, 2003; Florida, 2003). While there is some
commuting between municipalities, the supply of foreign workers is largely local. On the other hand,
it is implausible (and often impossible given zoning regulations) that innovative firms spatially sort in
terms of the availability of foreign restaurants. Of course, over the period considered innovative
firms could recruit foreign workers who trigger a demand for foreign restaurants. However, the
restaurant density is calculated at a time that preceded the panel data. Hence, for the first and
second wave of the panel data, we use restaurant density data from 1996 and 1998, respectively.
Admittedly, deeper lagging would be preferable but this is not feasible with the available data. The
source of the data on ethnic restaurant location is the HORECA dataset in the Netherlands.10
Table 7 about here
10HORECA is an acronym for Hotels, Restaurants and Cafes. This dataset covers the registered bars, restaurants, hotels and
all the other businesses in this sector. The data coverage is good. The data are currently available from 1996 until 2007.
The number of foreign restaurants is counted at the municipal level by the nationality of the cuisine at the time of
registration. For each restaurant, the main location is registered; no franchise branches are registered. This leads to unique
listing, and excludes double counting. Moreover, restaurants with a combined Dutch/French cuisine are excluded from the
total.
14
Secondly, we also use the natural logarithm of the lagged “allochtoon” population per municipality
(again the same way we lagged the restaurant density data). The historical presence of immigrant
population act as a magnet to attract more immigrants in certain areas and foreigners motivation to
immigrate may vary substantially over time. The instruments explain 7 percent of the between-
variation in the simpson index, and the lagged total number of foreign restaurants per municipality
appears as a strong instrument with the F-test statistic is larger than 10. The results and IV test
statistics are given in Table 7. We find that our previous results are robust to IV estimation but the
instrumented Simpson index is no longer statistically significant.
It is again confirmed that the co-location measure is negative and significant for innovation as a
whole and product innovation at the 1 percent level, while these are boosted by increasing high-
skilled intensity of foreign employment. Process innovations benefit significantly from any unique
cultural background. The magnitudes of the coefficients are fairly similar to those in the previous
estimations in Table 3.
6. Conclusion
In this paper we used micro data from The Netherlands to investigate links between innovation
activity at the firm level and the presence of immigrants among the firm’s employees. We
constructed a unique dataset that linked two innovation surveys with administrative and tax data on
firms and on workers. This dataset permitted us to identify the human capital of immigrant workers
(in terms of age and broad skills) and their diversity by country of origin. The latter was defined in
three different ways: the overall diversity in firm employment measured by the Simpson index, a co-
location index (that measures cultural homogeneity among the foreign-born), and the unique
number of birthplaces present.
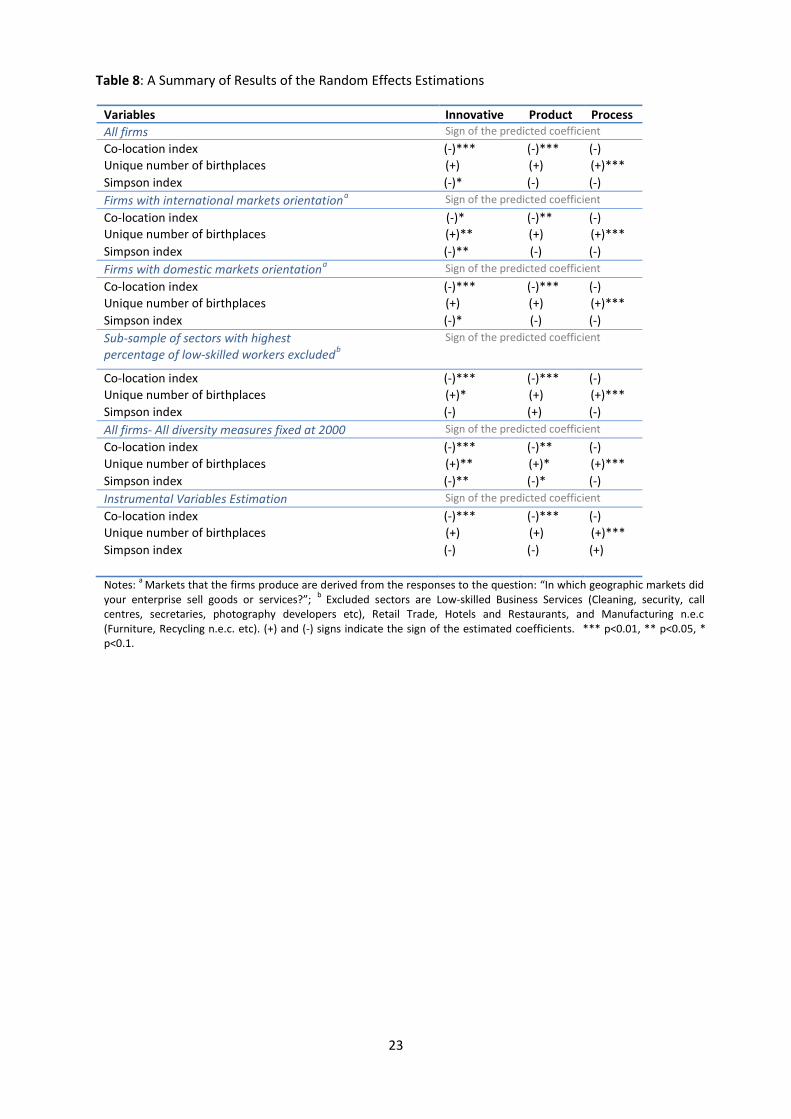
We estimated a wide range of linear probability models and found particularly robust evidence that
cultural homogeneity as measured by the co-location index has a negative effect on innovation. This
can be seen from Table 8 which summarises the results of this paper. The table shows that at the
firm level, different components of diversity benefit different types of innovation at varying
magnitudes. Not all forms of diversity are good as a whole, while not all types of innovations are
equally influenced by diversity. A greater Simpson index, roughly corresponding with a smaller share
of Netherlands-born employees, sometimes lowers innovation. However, greater diversity among
immigrant employees (measured by a smaller co-location index) has a positive impact on product
innovation, while the cultural ‘richness’ of the work force (measured by the unique number of
birthplaces present) boosts process innovation. The results also show that the skill intensity of
foreign employment enhances innovation. Skills clearly matter for innovation. The results are robust
to accounting for a possible endogeneity bias.
Table 8 about here
The positive effect of diversity should not, however, be overstated. As the literature shows,
innovation is predominantly driven by firm scale, performance, external conditions and institutions.
In any case, different types of innovations have different requirements. Moreover, the evidence
15
reported here is not informative of exactly how the employment of immigrants affects innovation.
Early in this paper we reviewed a wide range of channels through which immigrant workers can
positively or negatively impact on a firm’s ability to innovate. In order to investigate which of these
channels operate in practice and contribute most to the observed outcomes, a new research
approach might be desirable. These could include experimental designs and the analysis of surveys
at the firm level. Mixed qualitative and quantitative methods may also be helpful. The contribution
of second generation migrants, who are often better educated than new arrivals, to innovation is
also a promising avenue for further research. However, such additional research is unlikely to
overturn the key message of the present paper that policies that promote the recruitment of high-
skilled talent from abroad may not only assist in alleviating shortages in certain types of specialised
employment, but may also contribute to a nation’s innovation capacity when such talent is recruited
from a wide range of source countries.
References
Acs, A.J. and Audretsch, D.B. (1988) Innovation in large and small firms: an empirical analysis. American
Economic Review 78(4): 678-690.
Alesina, A. and La Ferrara, E. (2005) Ethnic diversity and economic performance. Journal of Economic Literature
43(3): 762-800.
Alvarez, J., Forrest, D., Sanz, I. and Tena, J.D. (2011) Impact of importing foreign talent on performance levels
of local co-workers. Labour Economics 18: 287–296.
Angrist, J.D. (2001) Estimation of limited dependent variable models with dummy endogenous regressors:
Simple strategies for empirical practice. Journal of Business and Economic Statistics 19 (1): 2–16.
Audretsch, D.B. and Feldman, M.P. (2004) Knowledge spillovers and the geography of innovation, Handbook of
Regional and Urban Economics 4: 2713-2739.
Beaverstock, J.V., Hall, S. (2012). Competing for talent: global mobility, immigration and the City of London’s
labour market. Cambridge Journal of Regions, Economy and Society, 5: (271–287).
Bell, S.T., Villado, A.J., Lukasik, M.A., Belau, L. and Briggs, A.L. (2011) Getting Specific about Demographic
Diversity Variable and Team Performance Relationships: A Meta-Analysis. Journal of Management,
37(3): 709-743.
Berkhout, J. and Sudulich,L. (2011) Demographics of Immigration: The Netherlands. SOM Working Paper No.
2011-07, University of Amsterdam.
Borjas, G.J. (2001) Does immigration grease the wheels of the labor market? Brookings Papers on Economic
Activity 2001(1): 69-119.
Card, D. (1999) The causal effect of education on earnings. In: O.C. Ashenfelter and D. Card (eds) Handbook of
Labor Economics, Volume 3, Part A, 1801–1863.
Clark, T.N., Lloyd, R., Wong, K.K., Jain, P. (2002) Amenities drive urban growth. Journal of Urban Affairs, 24:
493-515.
Cutler, D. M., Glaeser, E. L. and Vigdor, J. L. (2008) Is the melting pot still hot? Explaining the resurgence of
immigrant segregation. Review of Economics & Statistics 90(3): 478-497.
de Graaff, T. and Nijkamp, P. (2010) Socio-Economic Impacts of Migrant Clustering on Dutch Neighbourhoods:
In Search of Optimal Migrant Diversity. Socio-Economic Planning Sciences 44: 231-239
Dosi, G. (1988) Sources, procedures, and microeconomic effects of innovation. Journal of Economic Literature
26(3): 1120-1171.
Ely, R.J. and Thomas, D.A. (2001) Cultural diversity at work: the effects of diversity perspectives on work group
processes and outcomes. Administrative Science Quarterly 46(2): 229-273.
Florida, R. (2003) Cities and the Creative Class. City & Community 2:1 March.
16
Forbes (2011) Growing diversity and inclusion: fostering innovation through a diverse workforce. Forbes
Insights. New York: Forbes.
Genc, M., Gheasi, M., Nijkamp, P. and Poot, J. (2012) The impact of immigration on international trade: a
meta-analysis. In: Nijkamp P, Poot J and M Sahin (eds) Migration Impact Assessment: New Horizons.
Cheltenham UK: Edward Elgar, pp. 301-337.
Hunt, J., Gauthier-Loiselle, M. (2010) How much does immigration boost innovation? American Economic
Journal: Macroeconomics 2: 31-56.
Jacobs, J. (1969) The Economy of Cities. London: Vintage.
Jaeger, D.A. and Duleep, H.O. (2010) The Effect of Immigration on U.S. Natives’ Innovation and
Entrepreneurship. Paper presented at the 2010 conference of the European Association of Labour
Economists.
Jensen, M.B., Johnson, B., Lorenz, E., Lundvall, B.A. (2007) Forms of knowledge and modes of innovation.
Research Policy. 36: 680–693.
Jones, C.I., Romer, P.M. (2010) The New Kaldor Facts: Ideas, Institutions, Population, and Human Capital.
American Economic Journal: Macroeconomics. 2(1): 224-245.
Kerr, W.R. (2010) Breakthrough inventions and migrating clusters of innovation. Journal of Urban Economics 67:
46-60.
Kerr, W.R. and Lincoln, W. (2010) The supply side of innovation: H1-B visa reform and US ethnic invention.
NBER WP 15768. Cambridge Mass.: NBER.
Lee, N. and Nathan, M. (2010) Knowledge workers, cultural diversity and innovation: evidence from London.
International Journal on Knowledge-Based Development. 1 (1-2): 53-78.
Lobo, J. and Strumsky, D. (2008) Metropolitan patenting, inventor agglomeration and social networks: A tale oftwo effects. Journal of Urban Economics 63: 871–884.
Maré, D.C., Fabling, R. and Stillman, S. (2011) Immigration and innovation. IZA DP 5686. Bonn: IZA Institute for
the Study of Labor.
Niebuhr, A. (2010) Migration and innovation: Does cultural diversity matter for regional R&D activity? Papers
in Regional Science 89: 563–585.
Niebuhr, A. and Peters, C. (2012) Labour diversity and firm’s innovation: Evidence from Germany. Nuremburg:
IAB Institute for Employment Research.
Nijkamp, P. and Poot, J. (2012) Cultural diversity: a matter of measurement. Department of Spatial Economics.
VU University Amsterdam.
Østergaard, C.R., Timmermans, B. and Kristinsson, K. (2011) Does a different view create something new? The
effect of employee diversity on innovation. Research Policy 40: 500-509.
Ottaviano, G. and Peri, G. (2006) The economic value of cultural diversity: evidence from US cities. Journal of
Economic Geography 6: 9-44.
Ozgen, C., Nijkamp, P., Poot, J. (2012). Immigration and Innovation in European Regions. In Migration Impact
Assessment: New Horizons, Nijkamp, N., Poot, J., and Sahin, M. (eds). Edward Elgar Publishing.
Ozgen C., Nijkamp, P., Poot, J. (2011) The impact of cultural diversity on innovation: evidence from Dutch firm
level data. IZA DP 6000. Bonn: IZA Institute for the Study of Labor.
Page, S. (2007) The Difference: How the Power of Diversity Creates Better Groups, Firms, Schools, and Societies.
Princeton University Press.
Parotta, P., Pozzoli, D. and Pytlikova, M. (2011) The nexus between labour diversity and firm’s Innovation.
Norface Migration Discussion Paper No. 2011-5, www.norface-migration.org.
Poot, J. (2008) Demographic change and regional competitiveness: The effects of immigration and ageing.
International Journal of Foresight and Innovation Policy 4(½): 129-145.
Poot, J., Waldorf, B. and van Wissen, L. (eds) (2008) Migration and Human Capital. Edward Elgar, Cheltenham
UK.
Romer, P.M. (1990) Endogenous Technological Change. Journal of Political Economy, 98 (2): S71-S102.
Shapiro, J.M. (2003) Smart Cities: Explaining the Relationship between City Growth and Human Capital. NBER
Working paper (June 19), Cambridge Mass.: NBER.
17
Südekum, J., Wolf, K. and Blien, U. (2009) Cultural diversity and local labour markets, IZA DP 4619. Bonn: IZA
Institute for the Study of Labor.
Uzzi, B. and Dunlap, S. (2005). How to build your network. Harvard Business Review, 83: 2–11.
Zucker, L.G. and Darby, M.R. (2007) Star Scientists, innovation and regional and national immigration. NBER
WP 13547. Cambridge Mass.: NBER
Figure 1: Scatter Plot of the Number of Foreign Employees and Firm Size
Table 1: Summary Statistics a
Variable N Mean Std. Dev
Firm innovated 5578 0.4087 0.4916Firm innovated products 5578 0.2927 0.4550Firm innovated processes 5578 0.2496 0.4328Firm size 5578 171 355Firm’s openness to change 5578 0.1409 0.3479Obstacles: Lack of personnel 5578 0.3844 0.7777Obstacles: Cost 5578 0.3308 0.7582Number of firms per job (Nuts 3 level) 5578 0.1047 0.0212Number of firms per municipality 5578 56.95 53.08Co-location index 5578 0.264 0.395Unique number of birthplaces 5578 10 12Simpson index 5578 0.1857 0.1760High-skill intensity of foreign employment
b5578 0.1877 0.2422
Youthfulness of foreign employmentc
5578 0.5732 0.3249“Allochtoon” population per municipality
d5578 37766 78283
Number of foreign restaurants per municipality 5578 63 144Notes:
aDue to the confidentiality agreement with Statistics Netherlands, minimum and maximum values of the variables
cannot be displayed in Table 1. b Share of highly-skilled foreigners in total foreign employment per firm. c Share offoreigners aged 25-44 in total foreign employment per firm.
dIn the Netherlands this terms refers to persons who have at
least one parent who was born abroad.

18
Table 2: Mean Values of the Key Variables in 2002 and 2006Variables 2002 2006
Firm Variables Mean MeanFirm innovated 0.39 0.42Firm innovated products 0.28 0.29
Firm innovated processes 0.21 0.28
Employee Variables Mean Mean
Co-location 0.275 0.252Unique number of birthplaces 9.9 10.6
Simpson index 0.181 0.190
High-skill intensity of foreign employment 0.21 0.16
Youthfulness of foreign employment 0.58 0.56
Number of foreign employees 50442 55145Number of employees 466654 491013
19
Table 3: Linear Probability Regression Models of Firm Innovation(3.1) (3.2) (3.3) (3.4) (3.5)
VARIABLES innovative innovative innovative product Process
Log firm size 0.076*** 0.069*** 0.066*** 0.0510*** 0.0465***
(0.0218) (0.0251) (0.009) (0.008) (0.008)
Obstacles: Lack of personnel (low level)a 0.142*** 0.142*** 0.194*** 0.171*** 0.104***
(0.0248) (0.0248) (0.0201) (0.0204) (0.0224)
Obstacles: Lack of personnel (medium level)a 0.109*** 0.109*** 0.169*** 0.179*** 0.120***
(0.0288) (0.0289) (0.0236) (0.0232) (0.0251)
Obstacles: Lack of personnel (high level)a 0.145*** 0.145*** 0.198*** 0.175*** 0.150***
(0.0404) (0.0405) (0.0328) (0.0356) (0.0374)
Obstacles: Cost (low level)a 0.058** 0.0584** 0.109*** 0.0601*** 0.118***
(0.0278) (0.0279) (0.0226) (0.0231) (0.0258)
Obstacles: Cost (medium level)a -0.0253 -0.0245 0.0276 0.0467* 0.0432
(0.0306) (0.0307) (0.0252) (0.0250) (0.0274)
Obstacles: Cost (high level)a -0.0567 -0.0559 -0.006 -0.0110 -0.0278
(0.0419) (0.0419) (0.0340) (0.0335) (0.033)
Openness to change 0.097*** 0.097*** 0.173*** 0.181*** 0.178***
(0.0229) (0.0229) (0.0172) (0.0172) (0.0181)
Number of firms per job (Nuts3 level) 0.760 0.775 -0.0371 -0.194 0.313
(2.408) (2.407) (0.371) (0.349) (0.338)
Ln(number of firms per municipality) 0.143 0.144 -0.0112 -0.010 -0.0098
(0.195) (0.195) (0.01) (0.01) (0.007)
Co-location - -0.0204 -0.0583*** -0.0504*** -0.001
(0.033) (0.0197) (0.0179) (0.0173)
Ln(unique) - 0.006 0.0217 0.0110 0.0357***
(0.0292) (0.0138) (0.0124) (0.0128)
Simpson index - -0.0324 -0.0983* -0.0675 -0.0549
(0.127) (0.0538) (0.0481) (0.0492)
High-skill intensity of foreign employment - 0.0192 0.0610** 0.0851*** 0.01
(0.0436) (0.0274) (0.0251) (0.0244)
Youthfulness of foreign employment - 0.007 0.0308 0.0120 -0.001
(0.0306) (0.0196) (0.0177) (0.0178)
Constant -0.573 -0.517 0.182** 0.118 -0.08
(0.654) (0.655) (0.080) (0.0742) (0.0732)
N 5578 5578 5578 5578 5578
R2_between 0.047 0.049 0.377 0.350 0.255
R2_within 0.034 0.034 0.027 0.029 0.034
R2_overall 0.041 0.043 0.270 0.253 0.168
Estimation Technique FE FE RE RE RE
Notes:a
The reference category for the obstacle variables referring to a lack of personnel and to cost is in both cases: no
obstacle reported. All estimations include sector and time fixed effects. *** p<0.01, ** p<0.05, * p<0.1. Robust standard
errors are given in parentheses.
20
Table 4: Results for Sub-samples of Firms with International and Domestic Orientation1
(4.1)InternationalOrientation
(4.2)InternationalOrientation
(4.3)InternationalOrientation
(4.4)Domestic
Orientation
(4.5)Domestic
Orientation
(4.6)Domestic
Orientation
VARIABLES innovative product process innovative product process
Co-location -0.0579* -0.066** -0.0292 -0.0641*** -0.0541*** -0.001
(0.0306) (0.0302) (0.0275) (0.0202) (0.0184) (0.0177)
Ln(unique) 0.0491** 0.0296 0.0638*** 0.0185 0.008 0.0344***
(0.0242) (0.0234) (0.0236) (0.0144) (0.0128) (0.0132)
Simpson index -0.174** -0.066 -0.113 -0.0971* -0.0584 -0.0556
(0.0876) (0.0854) (0.0853) (0.0551) (0.050) (0.0509)
High-skill intensity of foreign employment 0.0418 0.102*** 0.001 0.0649** 0.0794*** 0.005
(0.0370) (0.0359) (0.0359) (0.0282) (0.0258) (0.0252)
Youthfulness of foreign employment 0.0408 -0.0164 0.0171 0.0241 0.007 -0.002
(0.0296) (0.0292) (0.0287) (0.0200) (0.0180) (0.0182)
N 2862 2862 2862 5342 5342 5342
R2_between 0.388 0.352 0.254 0.380 0.349 0.261
R2_within 0.024 0.031 0.035 0.026 0.028 0.036
R2_overall 0.279 0.261 0.169 0.272 0.254 0.173Notes: 1 The markets for which the firms produce are determined by the responses to the following question: “In whichgeographical markets did your enterprise sell goods or services?”. All estimations include the same variables on firm andregional characteristics as in Table 1, as well as sector and time fixed effects. Specifications are estimated with the randomeffects model. *** p<0.01, ** p<0.05, * p<0.1. Robust standard errors are given in parentheses.

21
Table 5: Results for a Sub-sample of Firms in which Sectors with the Highest Share of Low-skilledForeigners are Excluded
(5.1) (5.2) (5.3)
VARIABLES innovative product process
Co-location -0.0904*** -0.0803*** -0.0138
(0.0221) (0.0201) (0.0187)
Ln(unique) 0.0260* 0.0130 0.0411***
(0.0155) (0.0141) (0.0135)
Simpson index -0.0350 0.0194 -0.006
(0.0620) (0.0570) (0.0547)
High-skill intensity of foreign employment 0.0460 0.0660** -0.0108
(0.0286) (0.0266) (0.0249)
Youthfulness of foreign employment 0.007 0.002 -0.0260
(0.0221) (0.0201) (0.0196)
N 4918 4918 4918
R2_between 0.250 0.233 0.194
R2_within 0.034 0.037 0.0349
R2_overall 0.173 0.163 0.127
Notes: Excluded sectors are Low-skilled Business Services (Cleaning, security, call centres, secretaries, photographydevelopers etc), Retail Trade, Hotels and Restaurants, and Manufacturing not elsewhere classified (Furniture, Recycling,etc). All estimations include the same variables on firm and regional characteristics as in Table 1, as well as sector and timefixed effects. Specifications are estimated with the random effects model. *** p<0.01, ** p<0.05, * p<0.1. Robust standarderrors are given in parentheses.
Table 6: Results with Predetermined and Time-Invariant Diversity Measures(6.1) (6.2) (6.3)
VARIABLES innovative product process
Co-location1 -0.0529*** -0.0422** -0.0001
(0.0204) (0.0185) (0.0181)
Ln(unique)1 0.0290** 0.0242* 0.0366***
(0.0142) (0.0131) (0.0128)
Simpson index1 -0.130** -0.0964* -0.0659
(0.0552) (0.050) (0.0492)
High-skill intensity of foreign employment 0.0628** 0.0862*** -0.004
(0.0273) (0.0250) (0.0243)
Youthfulness of foreign employment 0.0361* 0.0141* 0.003
(0.0191) (0.0172) (0.0175)
N 5586 5586 5586
R2_between 0.380 0.347 0.253
R2_within 0.026 0.028 0.0340
R2_overall 0.270 0.251 0.167
Notes: 1 The variables listed above have been fixed at their 2000 values. All estimations include the same variables on firm
and regional characteristics as in Table 1, as well as sector and time fixed effects. Specifications are estimated with the
random effects model. *** p<0.01, ** p<0.05, * p<0.1. Robust standard errors are given in parentheses.
22
Table 7: Instrumental Variables Estimations
1st Stage Estimation Simpson index
Total number of foreign restaurants per municipality 0.001***
(0.0001)
Share of allochtoon population per municipality 0.024***
(0.002)
N 5578
R2_between 0.073
R2_within 0.001
R2_overall 0.069
2nd Stage Estimation(1) (2) (3)
VARIABLES innovative product process
Co-location -0.0605*** -0.0511*** -0.0015
(0.019) (0.0180) (0.0164)
Ln(unique) 0.010 0.003 0.0276***
(0.0111) (0.0102) (0.0101)
Simpson index -0.320 -0.135 0.0021
(0.199) (0.188) (0.178)
High-skill intensity of foreign employment 0.0626** 0.0861*** -0.005
(0.0275) (0.0251) (0.0244)
Youthfulness of foreign employment 0.0234 0.006 -0.004
(0.0196) (0.0175) (0.0178)
N 5578 5578 5578
R2_between 0.380 0.350 0.253
R2_within 0.027 0.028 0.034
R2_overall 0.270 0.251 0.168
Notes: All estimations include the same variables on firm and regional characteristics as in Table 1, as well as sector and
time fixed effects. Specifications are estimated with the random effects model. *** p<0.01, ** p<0.05, * p<0.1. Robust
standard errors are given in parentheses. The Simpson index is instrumented with the total number of foreign restaurants
per municipality and the share of allochtoon population per municipality.
23
Table 8: A Summary of Results of the Random Effects Estimations
Variables Innovative Product Process
All firms Sign of the predicted coefficient
Co-location index (-)*** (-)*** (-)
Unique number of birthplaces (+) (+) (+)***
Simpson index (-)* (-) (-)
Firms with international markets orientationa Sign of the predicted coefficient
Co-location index (-)* (-)** (-)Unique number of birthplaces (+)** (+) (+)***
Simpson index (-)** (-) (-)
Firms with domestic markets orientationa Sign of the predicted coefficient
Co-location index (-)*** (-)*** (-)
Unique number of birthplaces (+) (+) (+)***
Simpson index (-)* (-) (-)
Sub-sample of sectors with highestpercentage of low-skilled workers excluded
b
Sign of the predicted coefficient
Co-location index (-)*** (-)*** (-)
Unique number of birthplaces (+)* (+) (+)***
Simpson index (-) (+) (-)
All firms- All diversity measures fixed at 2000 Sign of the predicted coefficient
Co-location index (-)*** (-)** (-)
Unique number of birthplaces (+)** (+)* (+)***
Simpson index (-)** (-)* (-)
Instrumental Variables Estimation Sign of the predicted coefficient
Co-location index (-)*** (-)*** (-)
Unique number of birthplaces (+) (+) (+)***
Simpson index (-) (-) (+)
Notes:a
Markets that the firms produce are derived from the responses to the question: “In which geographic markets didyour enterprise sell goods or services?”;
bExcluded sectors are Low-skilled Business Services (Cleaning, security, call
centres, secretaries, photography developers etc), Retail Trade, Hotels and Restaurants, and Manufacturing n.e.c(Furniture, Recycling n.e.c. etc). (+) and (-) signs indicate the sign of the estimated coefficients. *** p<0.01, ** p<0.05, *p<0.1.