Embed Size (px)
Citation preview
MECHANISM OF HEAT GENERATION FROM LOADING GASEOUS HYDROGEN
ISOTOPES INTO PALLADIUM NANOPARTICLES
by
OLGA DMITRIYEVA
M.S., Physics, Voronezh State University, Voronezh, 1996
M.S., Electrical Engineering, University of Colorado, Boulder, 2010
A thesis submitted to the
Faculty of the Graduate School of the
University of Colorado in partial fulfillment
of the requirement for the degree of
Doctor of Philosophy
Department of Electrical Engineering
2012
This thesis entitled:
Mechanism of heat generation from loading gaseous hydrogen isotopes into palladium
nanoparticles
written by Olga Dmitriyeva
has been approved for the Department of Electrical Engineering
Prof. Garret Moddel
Prof. Alan Gallagher
Date______________
The final copy of this thesis has been examined by the signatories, and we
Find that both the content and the form meet acceptable presentation standards
Of scholarly work in the above mentioned discipline.
iii
Dmitriyeva, Olga (Ph.D., Electrical Engineering)
Mechanism of heat generation from loading gaseous hydrogen isotopes into palladium
nanoparticles
Thesis directed by Prof. Garret Moddel
I have carried out the study of hydrogen isotope reactions in the presence of palladium
nanoparticles impregnated into oxide powder. My goal was to explain the mechanisms of heat
generation in those systems as a result of exposure to deuterium gas. Some researchers have
associated this heating with a nuclear reaction in the Pd lattice. While some earlier experiments
showed a correlation between the generation of excess heat and helium production as possible
evidence of a nuclear reaction, the results of that research have not been replicated by the other
groups and the search for radiation was unsuccessful. Therefore, the unknown origin of the
excess heat produced by these systems is of great interest.
I synthesized different types of Pd and Pt-impregnated oxide samples similar to those
used by other research groups. I used different characterization techniques to confirm that the
fabrication method I used is capable of producing Pd nanoparticles on the surface of alumina
support. I used a custom built gas-loading system to pressurize the material with hydrogen and
deuterium gas while measuring heat output as a result of these pressurizations. My initial study
confirmed the excess heat generation in the presence of deuterium. However, the in-situ
radiometry and alpha-particle measurements did not show any abnormal increase in counts above
the background level. In the absence of nuclear reaction products, I decided to look for a
conventional chemical process that could account for the excess heat generation.
iv
It was earlier suggested that Pd in its nanoparticle form catalyzes hydrogen/deuterium
(H/D) exchange reactions in the material. To prove the chemical nature of the observed
phenomena I demonstrated that the reaction can be either exo- or endothermic based on the water
isotope trapped in the material and the type of gas provided to the system. The H/D exchange
was confirmed by RGA, NMR and FTIR analysis. I quantified the amount of energy that can be
released due to the H/D exchange and proved that the heat generated during the experiments can
be fully accounted for by this chemical reaction. Based on these results I concluded that the
origin of the excess heat generated during deuterium loading of Pd-nanoparticle materials is
chemical rather than nuclear.
I also looked at which measurement artifacts can result in apparent heat generation. I
suggested that the presence of a thermal gradient within the system can alter the temperature
measurement baseline, which would then look like anomalous heating under gas pressure. To
test the hypothesis I experimentally enhanced thermal gradients in the gas-loading system and
successfully demonstrated the effect. By using a commercially available finite element solver I
matched experimental and simulated data to quantify the magnitude of the thermal gradient
required to produce a measurable effect. Based on my observations I proposed a technique that
would ensure the proper gas-loading system calibration and help to avoid any misinterpretation
of the results.
v
ACKNOWLEDGMENTS
My deepest gratitude goes to Prof. Garret Moddel, my advisor and great mentor, who for
the last 8 years influenced my life in many ways including my decision to go back to school to
pursue my degree in Electrical Engineering.
I thank the faculty members in my committee, Profs. Alan Gallagher, Alan Mickelson
Charles Musgrave, and Won Park for sharing their expertise on various aspects of my thesis.
This work would never be completed without the support of Coolescence’s team. My
very special thanks go to Matt McConnell and Rick Cantwell for the opportunity to work on the
project and to learn from their engineering talents. I sincerely thank Garry Stanish for shaping up
my sometimes vague ideas into a solid form of experimental apparatus and measurement setup. I
also thank Judy Bebber for her enthusiasm towards my research and her ability to keep my spirit
up during the uneasy times.
I thank Dr. David Kidwell for his generous invitation to visit the Naval Research
Laboratory where a big part of my process characterization work was done. I also would like to
thank Drs. Dennis Eberl, Alex Blum, Hans Funke and Natalia Varaksa along with Troy Gould for
their assistance in the characterization of my samples. I also thank Joshua Solomon for our
collaboration.
I wish to thank current and former members of the Quantum Engineering Lab including
Sachit Grover, David Doroski, James Zhu, Saumil Joshi, Weiming Peng, Bradley Pelz, and
Michael Cromar for their helpful comments, ideas, and criticism, and most importantly for
making my grad school years an enjoyable experience.
I also thank my friends Ginni Sharma, Yulyia Kokoshinskiy, Anna Belous, and Maria
Pereskokova for being supportive and caring.

vi
I am eternally grateful to my mother, Veronika for her love and everlasting support. Even
though my father, Yuri, did not live long enough to witness my work, his memory was giving me
strength throughout these years. I thank my husband, Michael, for believing in me and being
there for me. Finally, with all my heart, I thank my son Zakhar for his love, patience and
understanding, and for looking up to me while always encouraging me to move forward.
vii
TABLE OF CONTENTS
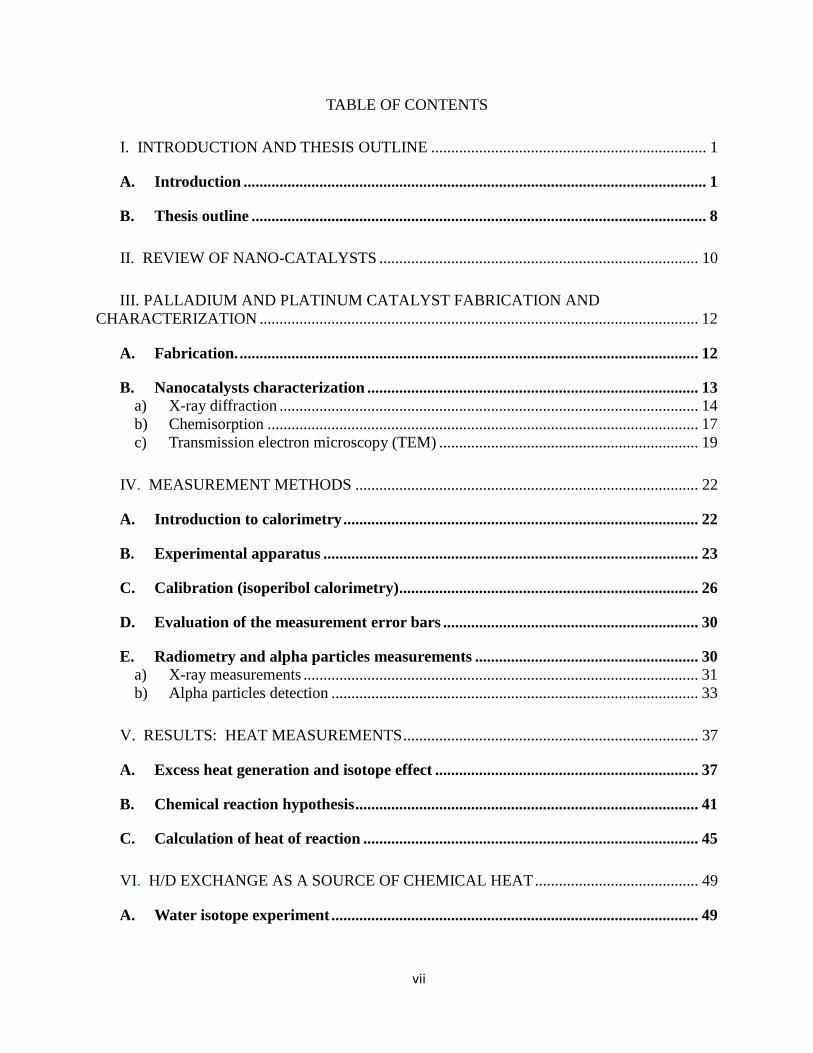
I. INTRODUCTION AND THESIS OUTLINE ..................................................................... 1
A. Introduction .................................................................................................................... 1
B. Thesis outline .................................................................................................................. 8
II. REVIEW OF NANO-CATALYSTS ................................................................................ 10
III. PALLADIUM AND PLATINUM CATALYST FABRICATION AND
CHARACTERIZATION .............................................................................................................. 12
A. Fabrication. ................................................................................................................... 12
B. Nanocatalysts characterization ................................................................................... 13 a) X-ray diffraction ......................................................................................................... 14
b) Chemisorption ............................................................................................................ 17
c) Transmission electron microscopy (TEM) ................................................................. 19
IV. MEASUREMENT METHODS ...................................................................................... 22
A. Introduction to calorimetry ......................................................................................... 22
B. Experimental apparatus .............................................................................................. 23
C. Calibration (isoperibol calorimetry)........................................................................... 26
D. Evaluation of the measurement error bars ................................................................ 30
E. Radiometry and alpha particles measurements ........................................................ 30 a) X-ray measurements ................................................................................................... 31
b) Alpha particles detection ............................................................................................ 33
V. RESULTS: HEAT MEASUREMENTS .......................................................................... 37
A. Excess heat generation and isotope effect .................................................................. 37
B. Chemical reaction hypothesis ...................................................................................... 41
C. Calculation of heat of reaction .................................................................................... 45
VI. H/D EXCHANGE AS A SOURCE OF CHEMICAL HEAT ......................................... 49
A. Water isotope experiment ............................................................................................ 49
viii
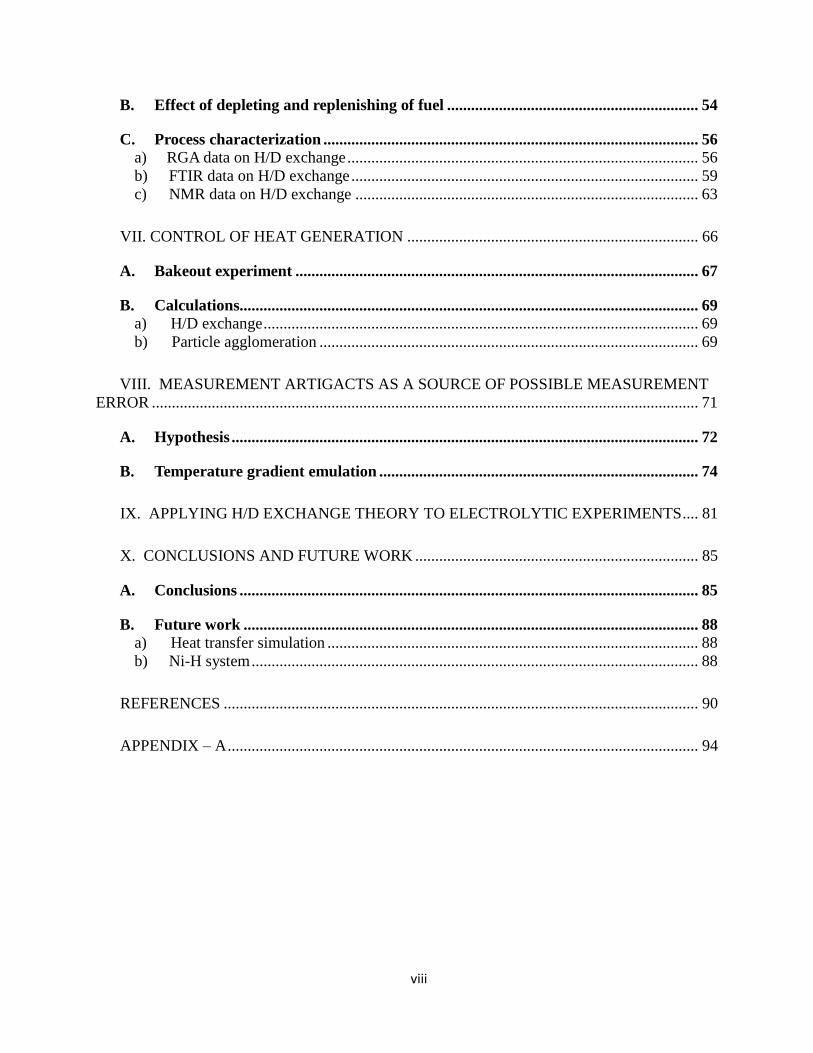
B. Effect of depleting and replenishing of fuel ............................................................... 54
C. Process characterization .............................................................................................. 56 a) RGA data on H/D exchange ........................................................................................ 56
b) FTIR data on H/D exchange ....................................................................................... 59
c) NMR data on H/D exchange ...................................................................................... 63
VII. CONTROL OF HEAT GENERATION ......................................................................... 66
A. Bakeout experiment ..................................................................................................... 67
B. Calculations................................................................................................................... 69 a) H/D exchange ............................................................................................................. 69
b) Particle agglomeration ............................................................................................... 69
VIII. MEASUREMENT ARTIGACTS AS A SOURCE OF POSSIBLE MEASUREMENT
ERROR ......................................................................................................................................... 71
A. Hypothesis ..................................................................................................................... 72
B. Temperature gradient emulation ................................................................................ 74
IX. APPLYING H/D EXCHANGE THEORY TO ELECTROLYTIC EXPERIMENTS .... 81
X. CONCLUSIONS AND FUTURE WORK ....................................................................... 85
A. Conclusions ................................................................................................................... 85
B. Future work .................................................................................................................. 88 a) Heat transfer simulation ............................................................................................. 88
b) Ni-H system ................................................................................................................ 88
REFERENCES ....................................................................................................................... 90
APPENDIX – A ...................................................................................................................... 94
ix
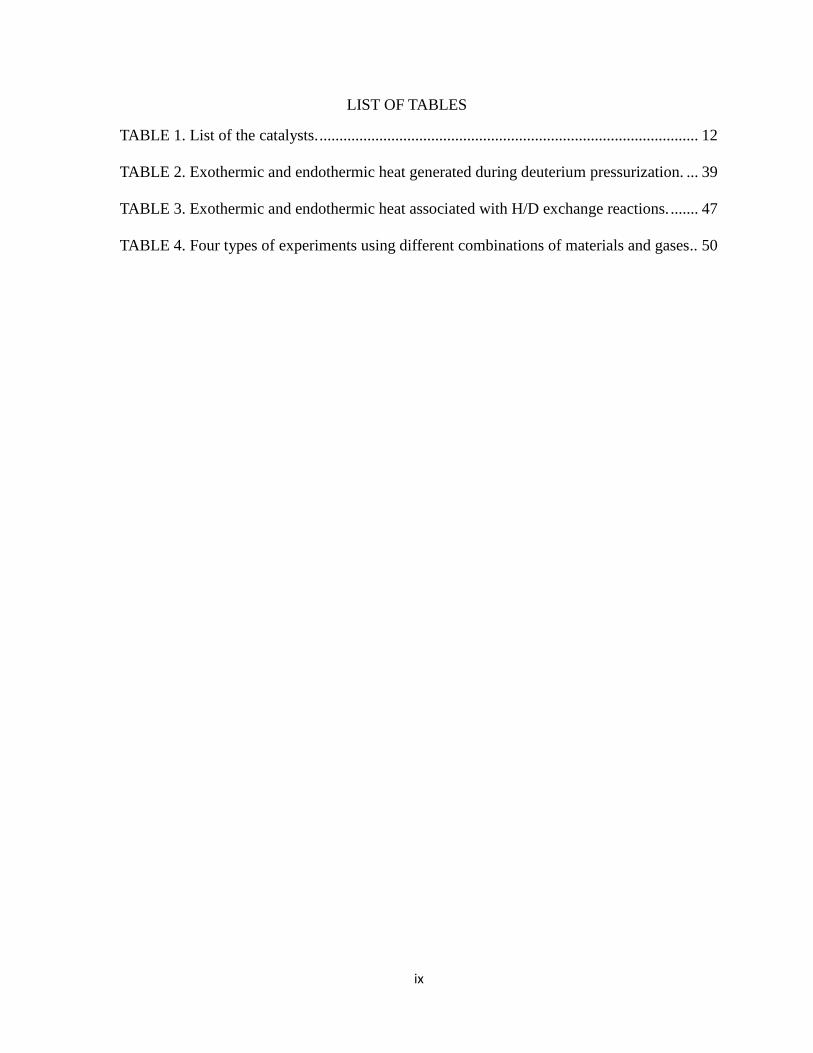
LIST OF TABLES
TABLE 1. List of the catalysts. ............................................................................................... 12
TABLE 2. Exothermic and endothermic heat generated during deuterium pressurization. ... 39
TABLE 3. Exothermic and endothermic heat associated with H/D exchange reactions. ....... 47
TABLE 4. Four types of experiments using different combinations of materials and gases.. 50
x
LIST OF FIGURES
Figure I - 1 Heat evolution after exposing ZrO2+Pd and Zr+Ni+Pd to hydrogen and
deuterium. ....................................................................................................................................... 4
Figure I - 2 QMS mass spectroscope data. ............................................................................... 5
Figure I - 3 Schematic representation of the vacuum-energy extraction process.. ................... 8
Figure III - 1 X-ray diffraction scan of 2%Pd impregnated alumina sample. ........................ 15
Figure III - 2 MudMaster analysis result on Pd(111) crystallite size distribution. ................ 17
Figure III - 3 TEM image of 2% Pd-impregnated high crystalline alumina. .......................... 20
Figure IV - 1 Gas-loading system for excess heat measurements. ......................................... 24
Figure IV - 2 Vessels containing material inside the isothermal chambers. ........................... 26
Figure IV - 3 Experimental curve for the low-temperature system set-up ............................. 28
Figure IV - 4 The cooling portion of the curve from Figure IV - 3. ....................................... 29
Figure IV - 5 The stainless steel vessel and the Geiger detector. ............................................ 32
Figure IV - 6 The radiation counts and deuterium pressure changes inside the vessel.. ........ 33
Figure IV - 7 The alpha spectrometer. .................................................................................... 34
Figure IV - 8 The range of alpha particles in hydrogen at 2.7x10⁴ Pa and 25˚C, represented in
terms of their initial energy. .......................................................................................................... 35
Figure IV - 9 The alpha-particles emission spectra. ............................................................... 36
Figure V - 1 Pressure and temperature change in the system. ................................................ 38
Figure V - 2 Pressure and temperature change in the system for deuterium and hydrogen
pressurization.. .............................................................................................................................. 41
Figure V - 3 Schematic representation of the H/D exchange process. ................................... 42
Figure V - 4 Potential energy diagram of hydrogen isotopes dissociation and PdH (or PdD)
formation. ...................................................................................................................................... 43
Figure V - 5 Potential energy diagram of hydrogen isotope spillover from metal to alumina.
....................................................................................................................................................... 45
Figure V - 6 Potential energy diagram of hydrogen isotope migration on the surface of
alumina. ......................................................................................................................................... 45
xi
Figure VI - 1 Power in/out and pressure during hydrogen and deuterium runs on H-rich
material as a function of time........................................................................................................ 51
Figure VI - 2 Power in/out and pressure during deuterium and hydrogen runs on D-rich
material as a function of time........................................................................................................ 53
Figure VI - 3 Excess heat generated in H-rich material during deuterium and hydrogen
pressurizations, as a function of run number.. .............................................................................. 55
Fig. VI - 4 RGA data showing: (a) water isotopes and (b) hydrogen gas isotopes as a function
of deuterium and hydrogen run sequences.. .................................................................................. 58
Figure VI - 5 Change of absorbance as a result of D2 exposure to Pd-impregnated H-rich
material. ........................................................................................................................................ 60
Figure VI - 6 Time-resolved FTIR transmittance spectra of Pd-impregnated H-rich material
exposed to D2 gas for two hours. .................................................................................................. 61
Figure VI - 7 Change of absorbance as a result of H2 exposures done on Pd-impregnated D-
rich material. ................................................................................................................................. 62
Figure VI - 8 NMR scan representing the change of protium and deuterium concentration in
Pd-impregnated H-rich material. .................................................................................................. 64
Figure VII - 1 Heat generated by the material during deuterium and hydrogen pressurizations.
....................................................................................................................................................... 69
Figure VIII - 1 Temperature changes due to hydrogen and deuterium pressurizations done on
material at 390˚C........................................................................................................................... 72
Figure VIII - 2 The vessel inside the oven with a (a) dissipative resistor, (b) cooling element
and (c) heat sleeve attached to its surfaces. .................................................................................. 75
Figure VIII - 3 Temperature changes due to gas-loading of Pd-impregnated alumina. .......... 76
Figure VIII - 4 COMSOL simulations of the temperature gradient. ....................................... 78
Figure VIII - 5 Temperature changes due to gas-loading of Pd-impregnated alumina in a
vessel wrapped in heat sleeve.. ..................................................................................................... 79
Figure IX - 1 The electrochemical cell.. ................................................................................. 82
1
CHAPTER I
INTRODUCTION AND THESIS OUTLINE
A. Introduction
According to the International Energy Outlook 2011 (IEO2011) reference case (U.S.
Department of Energy, 2011) the world energy consumption is expected to grow by 53% from
2008 to 2035. As a result of growing demand and limited supply conventional energy sources’
prices are on the rise. Once again we are in a search for alternative energy sources. Shifts from
primary to alternative energy sources have happened before; the reason for the transition from
wood to soft coal in the early 19th
century was economic: coal was cheap and abundant. These
days society is looking for not only cost-effective, but also environmentally friendly and safe
alternative energy sources that have an inexhaustible supply.
Alternative energy is a broad term usually applied to nuclear power and renewable
sources such as solar, wind, hydro, and geothermal. My research interests lie within a couple of
less common options. The two cases which I will discuss are (1) the investigation of the results
from deuterium loading in palladium-based powdered materials associated with low energy
nuclear reaction (LENR), and (2) the observation of a zero-point energy (ZPE) radiation from
Casimir cavities as a potential vehicle for vacuum energy harvesting.
1) Hydrogen isotopes loading into Pd
In 1989 two electrochemists, Profs. Martin Fleischmann and Stanley Pons, ran an
experiment that resulted in thermal energy production that could not be explained by
conventional chemistry. The two scientists used an electrochemical cell with a Pd cathode
submerged in a D2O + LiOD electrolyte (Fleischmann, et al., 1989). The process proposed to
involve a nuclear fusion reaction between deuterons, resulting in helium production at low
2
radiation levels. The phenomenon was called cold fusion, or a low energy nuclear reaction
(LENR). The idea of harvesting clean energy in the absence of harmful nuclear products or
waste was an attractive alternative to the known energy generation approaches. The
announcement made by Fleischmann and Pons in 1989 resulted in a massive experimental effort
undertaken by scientists around the world. After multiple unsuccessful replications and
withdrawal of some positive results, a US Department of Energy (DOE) review panel statement
was issued in 1989: “the evidence for the discovery of a new nuclear process was not persuasive
enough to start a special program”. The following DOE review, organized in 2004 to look at
new research, reached similar conclusions, adding that, “internal inconsistencies and lack of
predictability and reproducibility remain serious concerns” (U.S. Department of Energy, 2004).
The statement issued by DOE reflected the skepticism of mainstream science towards the cold
fusion phenomenon. From that point on the research was limited and only took place after the
occasional financial infusion. In addition to the original Fleischmann-Pons electrochemical
experiments, LENR research included: co-deposition, plasma glow-discharge, D2 and H2 gas-
loading in Pd and other transition metals, metal bombardment with energetic particles, bubble
collapse of various metals in D2O using ultrasound, and more (Storms, 2007) (Storms, 2010).
Despite the scientific community’s best efforts, poor reproducibility remained a problem.
Scientists were in a search of an experiment that would produce consistent results in a repeatable
manner. In recent years attention has been focused on gas-loading in a variety of Pd-nanoparticle
materials, because they have consistently exhibited anomalous heat production.
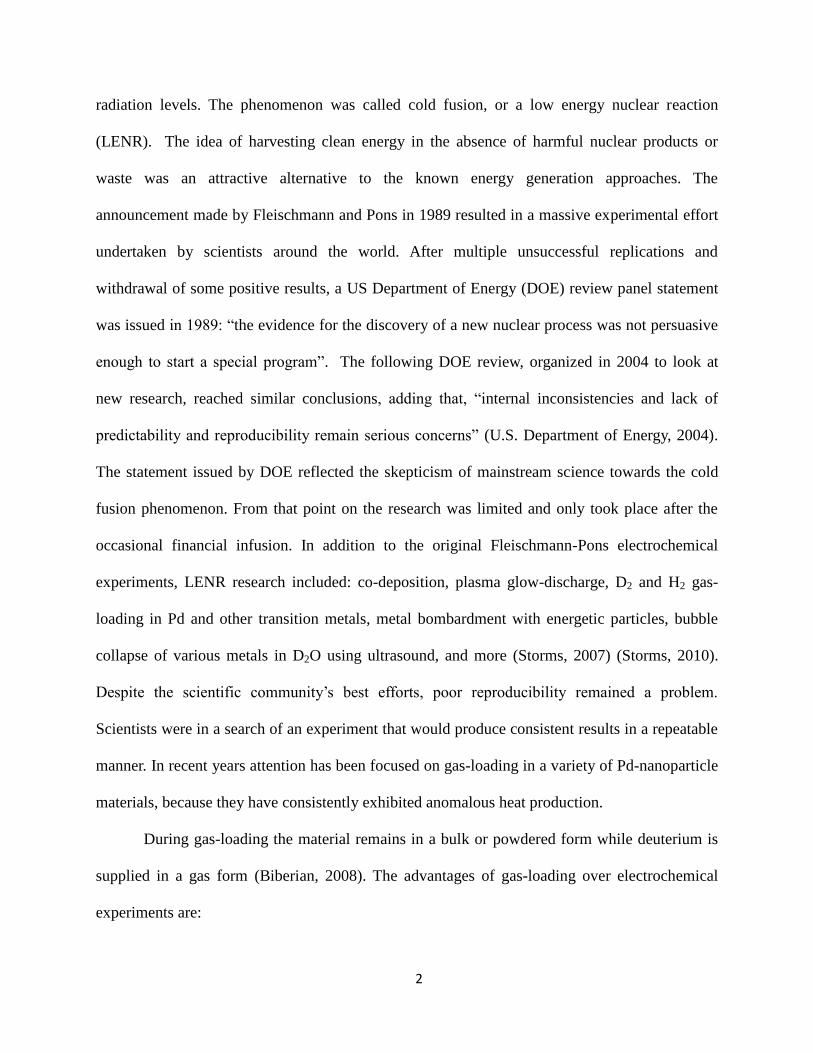
During gas-loading the material remains in a bulk or powdered form while deuterium is
supplied in a gas form (Biberian, 2008). The advantages of gas-loading over electrochemical
experiments are:
3
pressures are easily controlled,
operational temperatures can be high,
clean environment: the experiment is sealed in the vacuum chamber,
somewhat easier analysis: the gaseous reaction products can be analyzed with a residual
gas analyzing (RGA) unit.
The disadvantages are:
it is difficult to achieve very high pressures,
an advanced vacuum system is required,
hydrogen isotopes, pressurized at high temperatures, possess potential danger if handled
without care.
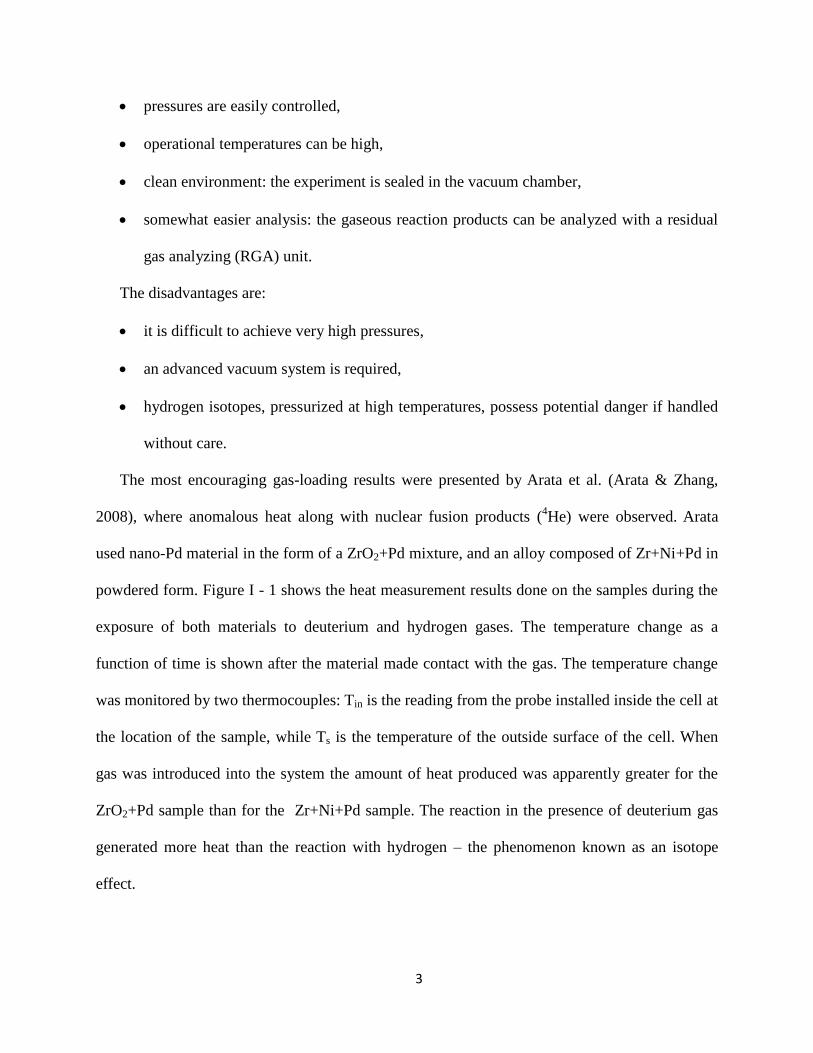
The most encouraging gas-loading results were presented by Arata et al. (Arata & Zhang,
2008), where anomalous heat along with nuclear fusion products (4He) were observed. Arata
used nano-Pd material in the form of a ZrO2+Pd mixture, and an alloy composed of Zr+Ni+Pd in
powdered form. Figure I - 1 shows the heat measurement results done on the samples during the
exposure of both materials to deuterium and hydrogen gases. The temperature change as a
function of time is shown after the material made contact with the gas. The temperature change
was monitored by two thermocouples: Tin is the reading from the probe installed inside the cell at
the location of the sample, while Ts is the temperature of the outside surface of the cell. When
gas was introduced into the system the amount of heat produced was apparently greater for the
ZrO2+Pd sample than for the Zr+Ni+Pd sample. The reaction in the presence of deuterium gas
generated more heat than the reaction with hydrogen – the phenomenon known as an isotope
effect.
4
Figure I - 1 Heat evolution after exposing ZrO2+Pd and Zr+Ni+Pd to hydrogen
and deuterium (Arata & Zhang, 2008).
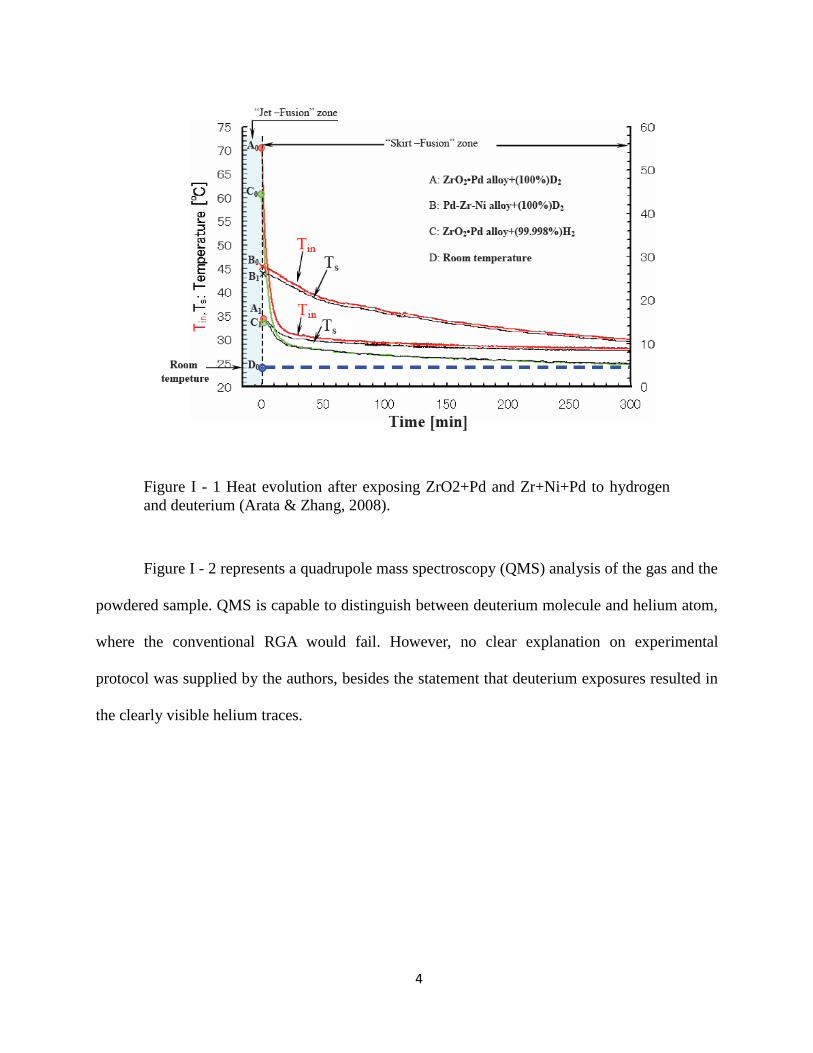
Figure I - 2 represents a quadrupole mass spectroscopy (QMS) analysis of the gas and the
powdered sample. QMS is capable to distinguish between deuterium molecule and helium atom,
where the conventional RGA would fail. However, no clear explanation on experimental
protocol was supplied by the authors, besides the statement that deuterium exposures resulted in
the clearly visible helium traces.
5
Figure I - 2 QMS mass spectroscope data: cases [A] and [B] show relative
concentration of 4He found in the gas and the powder as a result of hydrogen
exposure, while [C] and [D] show 4He concentration in the gas and the powder
due to deuterium exposures (Arata & Zhang, 2008).
Important details were missing from the report, which diminish the value of this work.
No data were given on the QMS detector calibration, and there was no information on the time
scale of the helium generation events or their correlation with the gas cycling. Still, the reported
6
results (even with the patches of missing information), generated a great deal of interest in nano-
materials.
In the years that followed, several groups reported very similar results on Pd nanoparticle
materials. A. Kitamura and his colleagues from Kobe University, Japan, in collaboration with A.
Takahashi from Osaka University, Japan, constructed a system to replicate Arata’s results on heat
and helium generation in nano-sized Pd powders, and to investigate the underlying physics. Pd-
Zr oxide nano-powder demonstrated an anomalous heating in the presence of deuterium, but
“nothing other than steady background both in neutron counter and scintillation probe [used for
the ionizing radiation measurements] was observed” (Kitamura, et al., 2008). Scientists from the
Naval Research Laboratory, USA, reported exothermic heat generation during gas-loading
experiments on Pd enriched zeolite and alumina powders using a high precision calorimeter
(Kidwell, et al., 2009). Toyota’s Central Research and Development Laboratories Inc., Japan,
used Pd-ZrO2 nanocomposites and reported anomalous heating in the presence of deuterium
(Hioki, et al., 2009).
All of the previously reported works has provided enough evidence that gas-loading
systems are capable of producing excess heat in a repeatable manner, which can be studied and
evaluated in a laboratory setup.
2) Zero-point energy radiation detection
In quantum mechanics the energy of the system at temperature T=0 K (or at its lowest
quantized energy level) is called zero-point (ZP) energy. ZP energy is the energy that remains
when all other energy is removed from a system. The most frequently used examples are (i) the
current noise in a resistively shunted Josephson junction, (ii) the fact that helium remains liquid
7
at absolute zero and atmospheric pressure, and (iii) the Casimir force, which is now
experimentally measured to the very high precision.
ZP radiation has a frequency-cubed dependence, and assuming that ZP fluctuations
continue to the Planck frequency (1043
Hz), the density of ZP field is enormous. Different
approaches were suggested for harvesting ZP energy to use it as a power source (Davis, et al.,
2006), (Moddel, 2009).
A recently issued patent (Haisch & Moddel, May 27, 2008) describes a method by which
vacuum energy is extracted from gas flowing through a Casimir cavity. According to stochastic
electrodynamics (SED) the ground state of an electron orbital is assumed to emit Larmor
radiation, which would cause the electron to spiral inward if it were not balanced by absorption
of ZP energy from the vacuum. Mode suppression of quantum vacuum radiation is known to take
place in Casimir cavities, which gives a rise to already mentioned Casimir force.
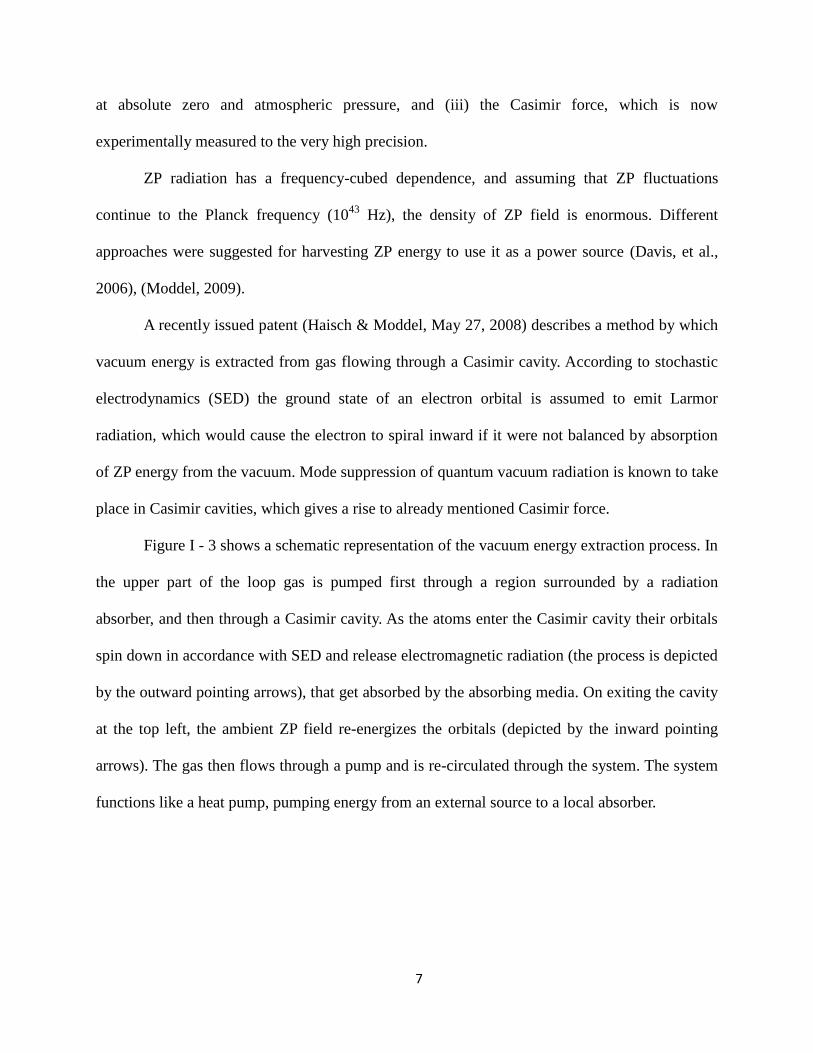
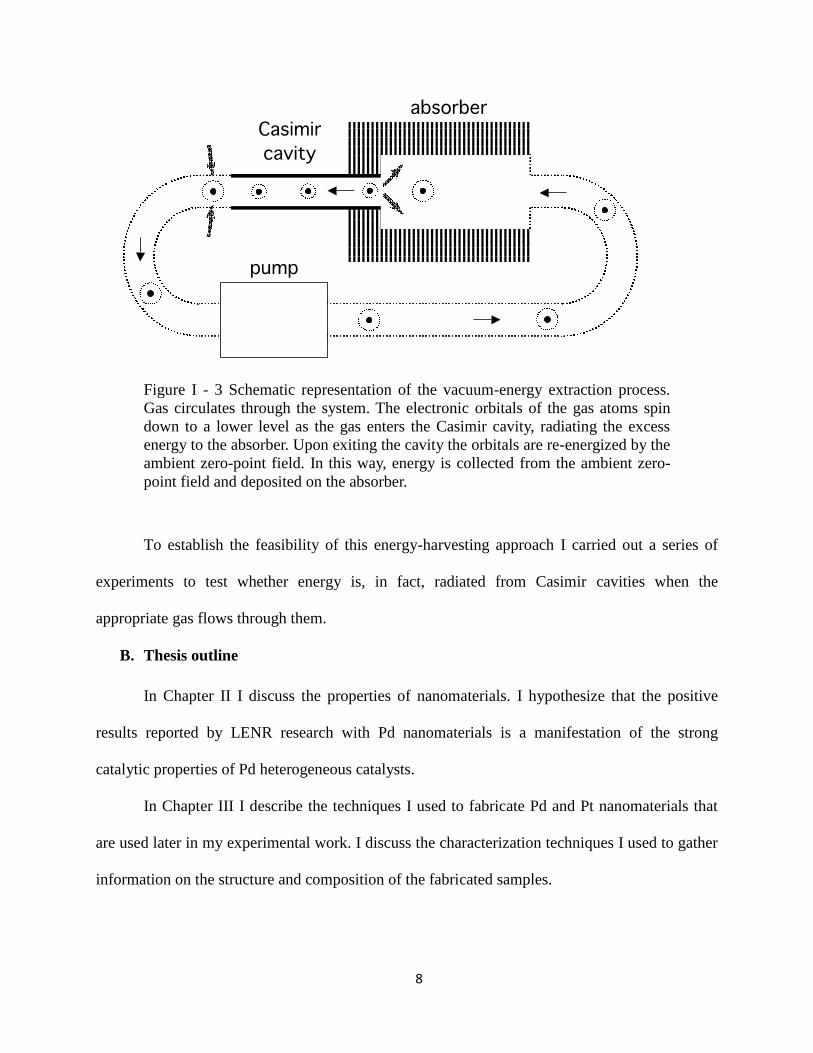
Figure I - 3 shows a schematic representation of the vacuum energy extraction process. In
the upper part of the loop gas is pumped first through a region surrounded by a radiation
absorber, and then through a Casimir cavity. As the atoms enter the Casimir cavity their orbitals
spin down in accordance with SED and release electromagnetic radiation (the process is depicted
by the outward pointing arrows), that get absorbed by the absorbing media. On exiting the cavity
at the top left, the ambient ZP field re-energizes the orbitals (depicted by the inward pointing
arrows). The gas then flows through a pump and is re-circulated through the system. The system
functions like a heat pump, pumping energy from an external source to a local absorber.
8
Figure I - 3 Schematic representation of the vacuum-energy extraction process.
Gas circulates through the system. The electronic orbitals of the gas atoms spin
down to a lower level as the gas enters the Casimir cavity, radiating the excess
energy to the absorber. Upon exiting the cavity the orbitals are re-energized by the
ambient zero-point field. In this way, energy is collected from the ambient zero-
point field and deposited on the absorber.
To establish the feasibility of this energy-harvesting approach I carried out a series of
experiments to test whether energy is, in fact, radiated from Casimir cavities when the
appropriate gas flows through them.
B. Thesis outline
In Chapter II I discuss the properties of nanomaterials. I hypothesize that the positive
results reported by LENR research with Pd nanomaterials is a manifestation of the strong
catalytic properties of Pd heterogeneous catalysts.
In Chapter III I describe the techniques I used to fabricate Pd and Pt nanomaterials that
are used later in my experimental work. I discuss the characterization techniques I used to gather
information on the structure and composition of the fabricated samples.
9
In Chapter IV I describe the measurement methods I used throughout the experimental
phase.
Chapter V is dedicated to the discussion of the heat measurements I did while
pressurizing Pd-infused oxide powders with deuterium and hydrogen. In the absence of nuclear
byproducts an H/D exchange chemical reaction was proposed to explain the heat production in
Pd material in the presence of deuterium, but not hydrogen.
I proceed with a discussion of the H/D exchange in Chapter VI. I support the heat
measurements with an extensive process characterization study.
The suggested concept of fuel, consisting of water isotopes trapped in the material that
react with gas, is discussed in Chapter VII. By measuring the material weight loss as a result of
a bakeout I assessed the amount of water and the reaction’s energy content. I confirm that
generated heat can be fully accounted for by the H/D exchange reaction.
In Chapter VIII I describe the study of measurement artifacts that can be misinterpreted
as excess energy production during gas-loading experiments at elevated temperature.
In Chapter IX I apply the H/D exchange theory to electrolytic experiments to quantify the
H/D exchange contribution in excess heat generation.
Conclusions and directions for future work are discussed in Chapter X.
In Appendix - A, I describe the experimental work on detection of the zero-point energy
radiation as a result of the gas flowing through the Casimir cavities. The Appendix - A contains a
reprint of a paper published earlier.
10
CHAPTER II
REVIEW OF NANO-CATALYSTS
The anomalous effects described in the previous chapter were demonstrated in nano-Pd-
on-oxide materials, which are well known catalytic systems. Catalysis is a surface phenomenon,
and hence an efficient catalyst must have a large surface area, implying that the active particles
must be small. Small metal particles can be unstable and prone to sintering in order to reduce
their surface area. Therefore, most heterogeneous catalysts consist of particles inside the pores of
inert substrates such as alumina, silica, titania, magnesia, zinc oxide, zirconia, zeolite and others.
Thus, Pd-impregnated alumina appears to be a suitable system to promote chemical reactions in
the presence of hydrogen isotopes.
Let us look closer at the important parameters to consider for a successful catalyst:
high activity per unit of volume,
sufficiently long lifetime before a catalyst is considered to be “dead” or needed to be
reactivated,
cheap and reproducible synthesis.
Obviously, a high volume manufacturer will impose more strict and detailed requirements
on catalyst’s properties, but these three still will be valid.
Metal catalysts (the system I was dealing with) are used in the fine-chemical industry to
perform hydrogenations and oxidations. The ability of a metal catalyst to dissociate hydrogen
and oxygen molecules is directly related to this study and will be discussed in great detail in
Chapter V.
Elements forming groups VIII and I-B of the periodic system are considered to be the
most important metals for catalytic applications. I was especially interested in Pd, Pt and Ni in
11
conjunction with LENR research. All three of these metals have face-centered cubic crystal
structure (fcc). The reactivity properties of catalytic surface depend on the number of unsaturated
bonds, available for reaction. An atom of fcc (100) surface would have four neighbors missing,
which makes it more active than the atom in (111) orientation. However, there are other factors
that come into play during the synthesis. The morphology of the particle determined by the
surface energy of the particle itself and the oxide support, on which the particle is deposited.
These two factors determine the thermodynamically most stable configuration and the surface
planes that the particle will expose.
Energy is needed to create a surface, because bonds need to be broken. Thus, in an ideal
situation in free space, small metal particles will always want to agglomerate to minimize the
surface energy. The oxide surface support is what prevents particles from clumping together.
Minimization of the surface free energy is a driving mechanism of the surface processes.
For Pd and other group VIII fcc metals the smallest free surface energy is associated with (111)
crystal plane. For example, the surface free energy values for Pd at different crystal face
orientation are (Vitos, et al., 1998):
J m 2 J m 2 J m 2
However, in the presence of support, the interface energy also plays a role in metal
particle formation. For example, for Pd particles on the surface of alumina the interface energy
was found to be J m-2 (Hansen, et al., 1999), which is higher than , , or . That
means that Pd on alumina surface forms particles exhibiting (111) facets rather than spreading
over the support, which was experimentally confirmed by the STM imaging (Hansen, et al.,
1999). I observed similar results on crystal plane orientation using XRD technique (discussed in
Chapter III).
12
CHAPTER III
PALLADIUM AND PLATINUM CATALYST FABRICATION AND CHARACTERIZATION
A. Fabrication.
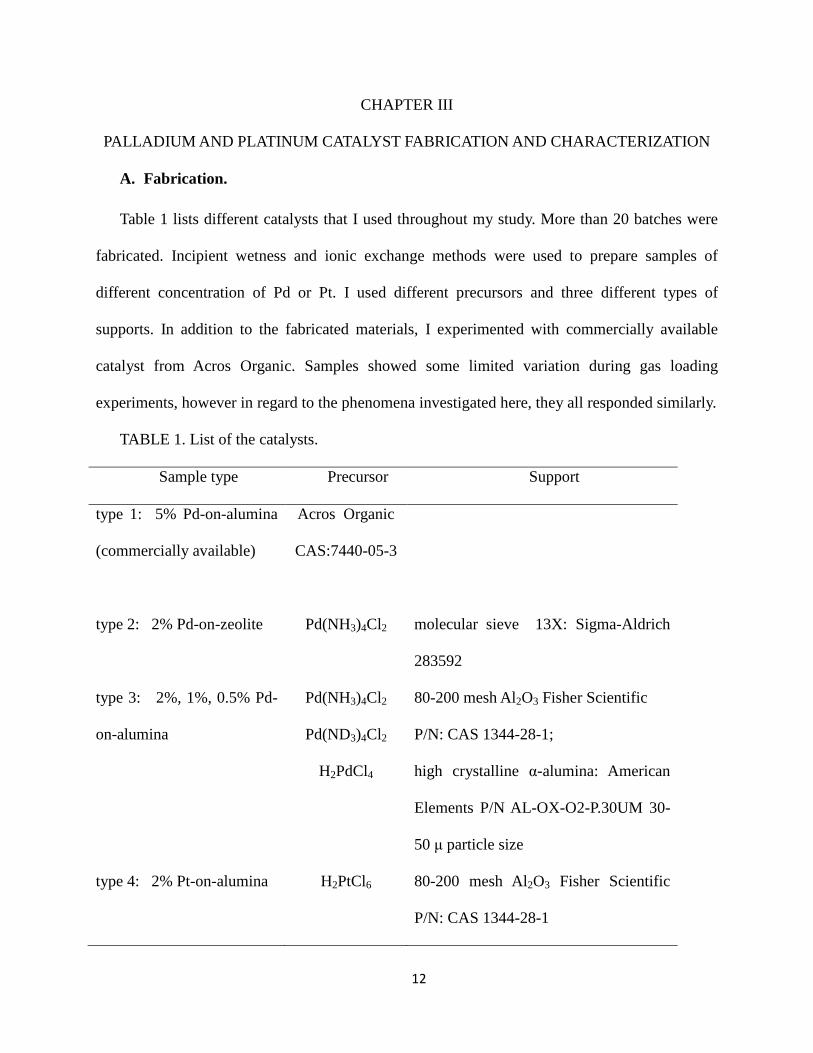
Table 1 lists different catalysts that I used throughout my study. More than 20 batches were
fabricated. Incipient wetness and ionic exchange methods were used to prepare samples of
different concentration of Pd or Pt. I used different precursors and three different types of
supports. In addition to the fabricated materials, I experimented with commercially available
catalyst from Acros Organic. Samples showed some limited variation during gas loading
experiments, however in regard to the phenomena investigated here, they all responded similarly.
TABLE 1. List of the catalysts.
Sample type Precursor Support
type 1: 5% Pd-on-alumina
(commercially available)
Acros Organic
CAS:7440-05-3
type 2: 2% Pd-on-zeolite
Pd(NH3)4Cl2 molecular sieve 13X: Sigma-Aldrich
283592
type 3: 2%, 1%, 0.5% Pd-
on-alumina
Pd(NH3)4Cl2
Pd(ND3)4Cl2
H2PdCl4
80-200 mesh Al2O3 Fisher Scientific
P/N: CAS 1344-28-1;
high crystalline α-alumina: American
Elements P/N AL-OX-O2-P.30UM 30-
50 μ particle size
type 4: 2% Pt-on-alumina H2PtCl6
80-200 mesh Al2O3 Fisher Scientific
P/N: CAS 1344-28-1
13
Wet impregnation and ionic exchange methods are based on the loading of the high
surface area oxide support with a catalytically active phase (precursor). The way the catalytic
material is loaded into the support is a several step process that includes filling the pores of the
support with liquid precursor followed by baking out the sample at elevated temperature. The
chemical interactions between the solid support and the precursor may play a significant role in
the quality of the resulting material (Chorkendoff & Niemantsverdriet, 2007). The precursor may
be chosen based on the charge state of the hydroxyl groups on the surface of the support. For
example, negatively charged PdCl42-
or PtCl62-
will exchange readily with basic OH groups in
alumina. In the case of the zeolite the ionic-exchange takes place between the positive Pd+ ions
and the sodium ions in the zeolite cage.
For the catalyst’s synthesis I mostly used 80-200 mesh Al2O3. The blank alumina was
baked in vacuum at 350° C for 12 hours to remove residual water. Samples containing different
percentages of Pd by weight were fabricated by impregnating alumina powder with hot
Pd(NH3)4Cl2 or H2PdCl4 in water, forming a slurry. This slurry was later dried either in air or in
an argon atmosphere at room temperature without calcination. Prior to loading into the
measurement apparatus, all the samples were baked in a vacuum oven at 120° C for 24 hours.
This prebaking step results in 2% weight loss due to water evaporation, based on
thermogravimetric analysis (TGA). Some water was still trapped in the material even after
prebake. During the loading there was a 2-5 minutes period during which the samples were
exposed to air, which resulted in an additional absorption of the moisture from air. I will discuss
this in more details in Chapter VI and VII.
B. Nanocatalysts characterization
14
I carried out the material characterization to establish the basic understanding of the structure
and composition of the fabricated samples. There are several standard methods for characterizing
metals in the catalysts. The three most widely used are: X-ray diffraction, chemisorptions, and
electron microscopy. The combination of these three techniques provides the information on the
metal particles’ size distribution, dispersion, phase and predominant crystal structure. Another
purpose for characterizing the material was to establish a correlation between the sample’s
performance and structural features modification as a result of an experiment.
a) X-ray diffraction
The primary purpose of the X-ray measurement was to identify the size of the Pd metal
particles in alumina powder. All measurements were carried out at the US Geological Survey
(courtesy of Dr. Alex Blum). The powdered sample was wetted with alcohol and dried on the
surface of a polished Si wafer, forming a film. The wafer was loaded into the X-ray apparatus
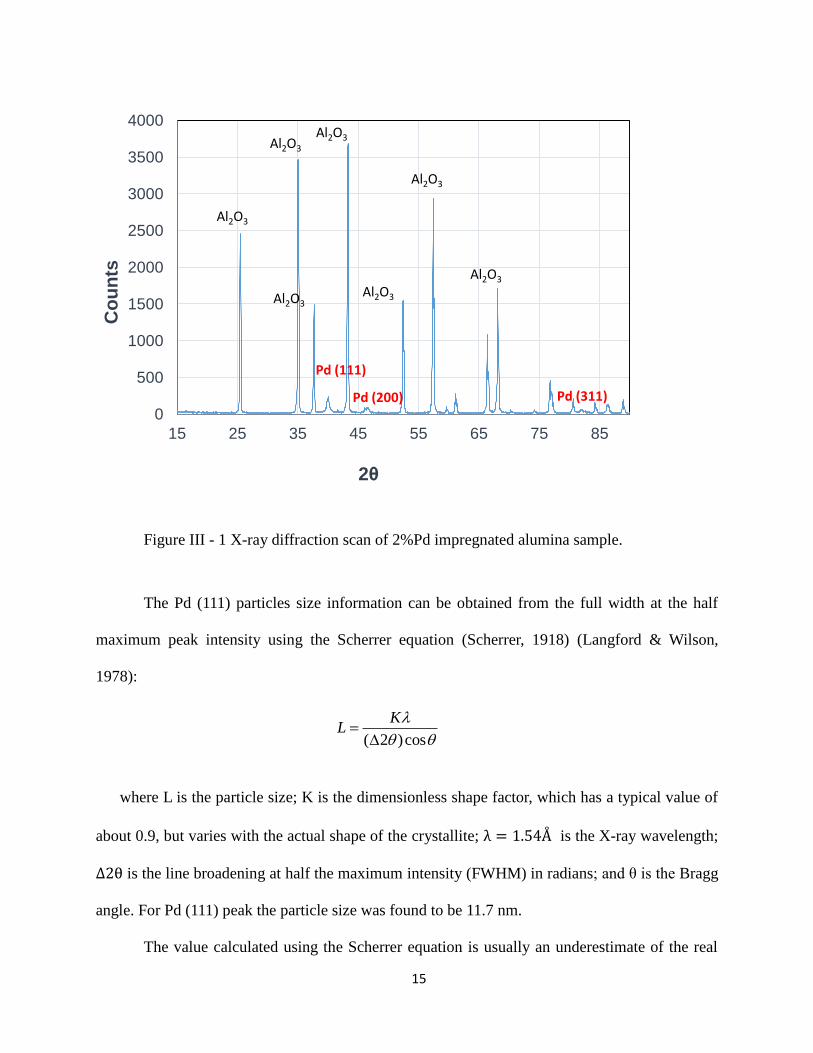
and scanned at angles . Figure III - 1 shows the scan of 2% Pd by weight
impregnated into highly crystalline alumina powder – type 2 sample from Table 1. The major
peaks on the scan were identified as alumina and Pd of different facet formation which agrees
with the study by Datye et al. (Datye, et al., 2000).
15
Figure III - 1 X-ray diffraction scan of 2%Pd impregnated alumina sample.
The Pd (111) particles size information can be obtained from the full width at the half
maximum peak intensity using the Scherrer equation (Scherrer, 1918) (Langford & Wilson,
1978):
where L is the particle size; K is the dimensionless shape factor, which has a typical value of
about 0.9, but varies with the actual shape of the crystallite; is the X-ray wavelength;
is the line broadening at half the maximum intensity (FWHM) in radians; and θ is the Bragg
angle. For Pd (111) peak the particle size was found to be 11.7 nm.
The value calculated using the Scherrer equation is usually an underestimate of the real
( 2 )cos
KL
0
500
1000
1500
2000
2500
3000
3500
4000
15 25 35 45 55 65 75 85
Co
un
ts
2θ
Al2O3
Al2O3
Al2O3
Al2O3 Al2O3
Al2O3
Al2O3
Pd (111)
Pd (200) Pd (311)
16
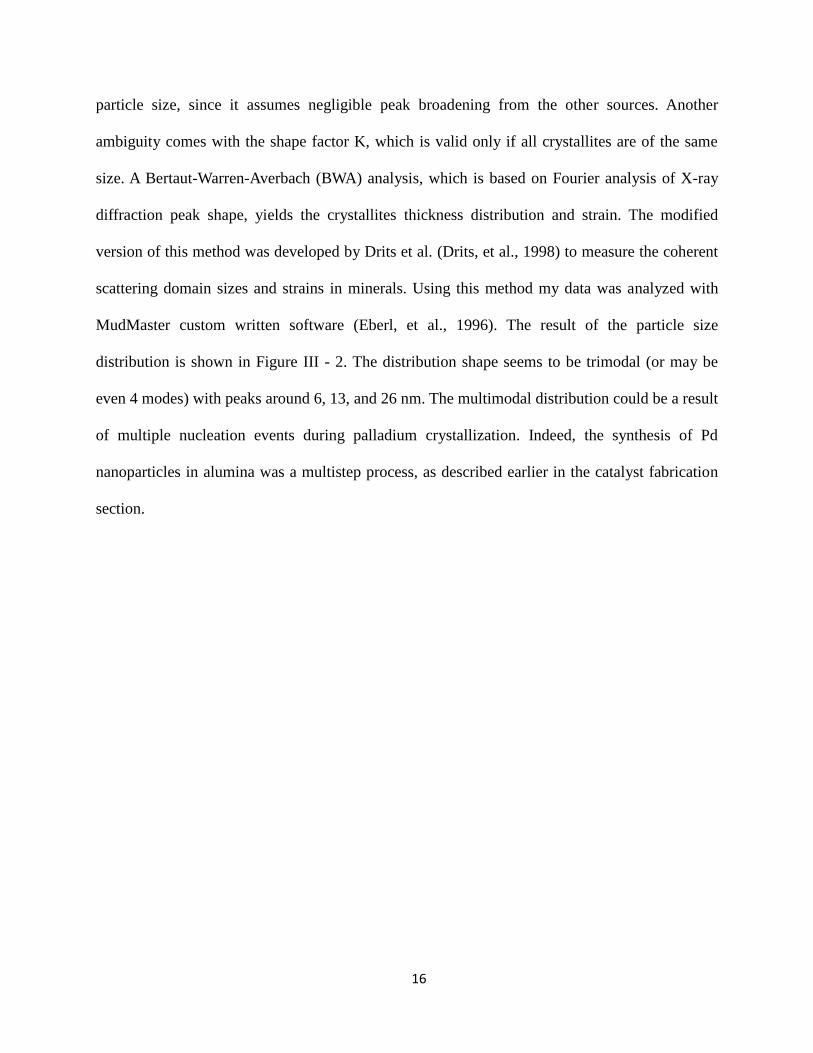
particle size, since it assumes negligible peak broadening from the other sources. Another
ambiguity comes with the shape factor K, which is valid only if all crystallites are of the same
size. A Bertaut-Warren-Averbach (BWA) analysis, which is based on Fourier analysis of X-ray
diffraction peak shape, yields the crystallites thickness distribution and strain. The modified
version of this method was developed by Drits et al. (Drits, et al., 1998) to measure the coherent
scattering domain sizes and strains in minerals. Using this method my data was analyzed with
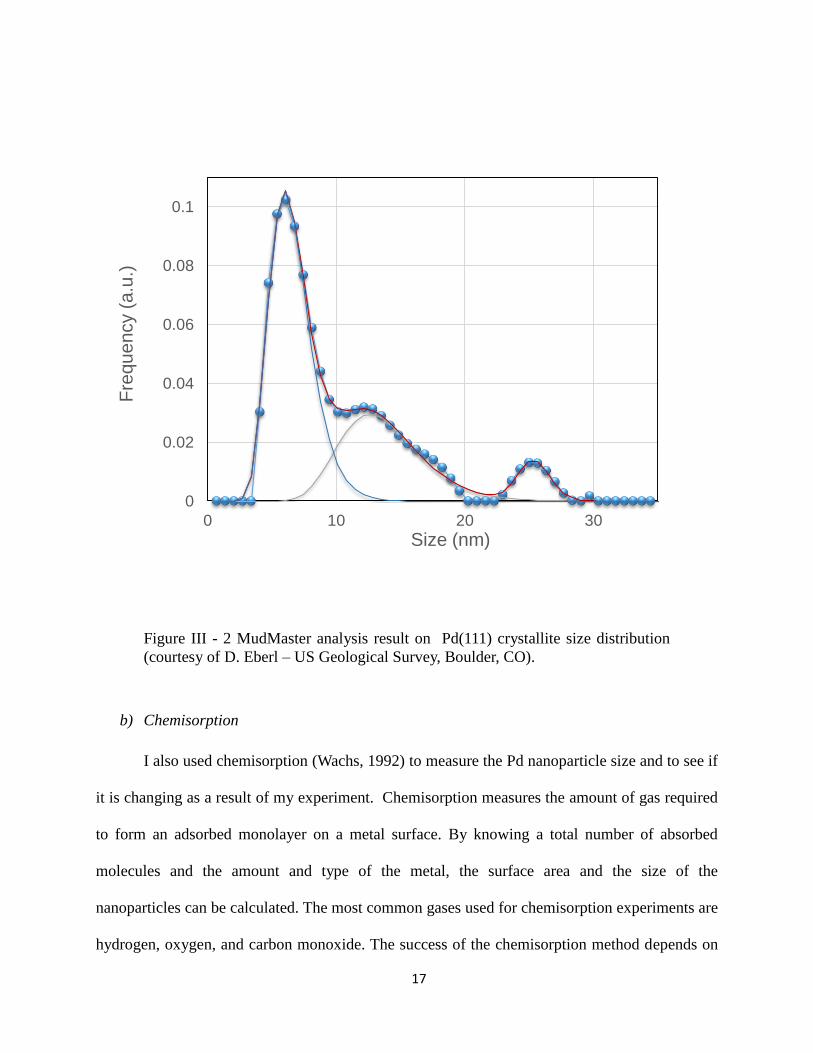
MudMaster custom written software (Eberl, et al., 1996). The result of the particle size
distribution is shown in Figure III - 2. The distribution shape seems to be trimodal (or may be
even 4 modes) with peaks around 6, 13, and 26 nm. The multimodal distribution could be a result
of multiple nucleation events during palladium crystallization. Indeed, the synthesis of Pd
nanoparticles in alumina was a multistep process, as described earlier in the catalyst fabrication
section.
17
Figure III - 2 MudMaster analysis result on Pd(111) crystallite size distribution
(courtesy of D. Eberl – US Geological Survey, Boulder, CO).
b) Chemisorption
I also used chemisorption (Wachs, 1992) to measure the Pd nanoparticle size and to see if
it is changing as a result of my experiment. Chemisorption measures the amount of gas required
to form an adsorbed monolayer on a metal surface. By knowing a total number of absorbed
molecules and the amount and type of the metal, the surface area and the size of the
nanoparticles can be calculated. The most common gases used for chemisorption experiments are
hydrogen, oxygen, and carbon monoxide. The success of the chemisorption method depends on
0
0.02
0.04
0.06
0.08
0.1
0 10 20 30
Fre
quency (
a.u
.)
Size (nm)
18
knowledge of the conditions under which gases adsorb on the metal. Hydrogen dissociates on the
surface of metal, and thus adsorbs atomically, forming palladium hydride with stoichiometry
ratio of one (adsorption stoichiometry is the number of the gas atoms bonded to one Pd atom).
The accuracy of the CO chemisorption measurements is often disputed due to the unknown
adsorption stoichiometry. CO on the surface of Pd can be linearly or bridge-bonded.
The chemisorption measurement requires a metal surface to be free of contamination.
Prior to the measurements my material was baked in-situ at 250°C and 390°C for 2 hours in the
presence of hydrogen. After that the gas was evacuated and the temperature reduced to 40°C.
The static volumetric chemisorption method was used to measure the particle size and
dispersion. The measurements were done at Prof. J. Falconer’s Research facility at the Chemistry
and Biological Engineering department at University of Colorado, Boulder (courtesy of Dr. Hans
Funke). In the static volumetric method the pressure of a known gas is measured; then the gas is
expanded into an evacuated known volume that contains a catalyst, and the pressure is measured
again. The step is repeated several times for different pressures (in my case up to atmospheric
pressure). The measured uptakes describe a dependency of the adsorbed volume vs. equilibrium
pressure, known as an isotherm curve. Two different mechanisms contribute to the adsorption in
the material. One is a chemisorptions, which is a strong bonding between gas molecules and
active sites on the surface of the metallic particle (pressure increase should not affect the amount
of the chemisorbed gas molecules); the second mechanism is a weak physiosorption, when gas is
adsorbed on the surface of the substrate (generally this additional physisorption increases linearly
as a function of gas pressure). I was interested in the amount of the chemisorbed gas, which can
be extracted from the isotherm data by the extrapolation or bracketing methods (Quantachrome
Instruments, 2007). Both methods evaluate the contribution of the chemi- and physiosorption to
19
the total adsorption on the surface of the Pd nanoparticles and alumina substrate. Using both
methods would insure the accuracy of the characterization technique. This is if both methods
were to give similar answers, but in the case of hydrogen adsorption, the bracketing method was
giving consistently larger particle size values compared to extrapolation. This was due to the
nature of the process of the PdH formation: at the temperatures and pressures used in the
chemisorption experiment H2 gets absorbed not only on the surface but also in the bulk of the Pd
metal. That is why the surface area was greatly overestimated using the extrapolation method and
the results were also skewed using the bracketing method. The solution was to switch to CO gas
exposures. I used two as an adsorption stoichiometry for CO (Canton, et al., 2002). The results
were again rather scattered: the particle size was between 6.8 and 11.4 nm and the dispersion
between 9.8 and 16.5%.
To monitor the evolution of the particle size as a result of the multiple experimental runs,
two samples were compared. One sample was fresh, and another one was exposed to more than
40 experimental cycles (see Chapter V for detailed explanation on the experimental procedure). I
expected that the Pd particle size would increase due to the particles’ agglomeration as a result of
my experiments. The chemisorption measurements confirmed my hypothesis: the particles grew
from 5.7 nm to 11.5 nm (the quantitative analysis may be off due to the issues described earlier,
but the qualitative trend was confirmed).
c) Transmission electron microscopy (TEM)
TEM measurements were done to confirm the size of the Pd nanoparticles. TEM imaging
was done in the Molecular, Cellular, and Development Biology center at University of Colorado,
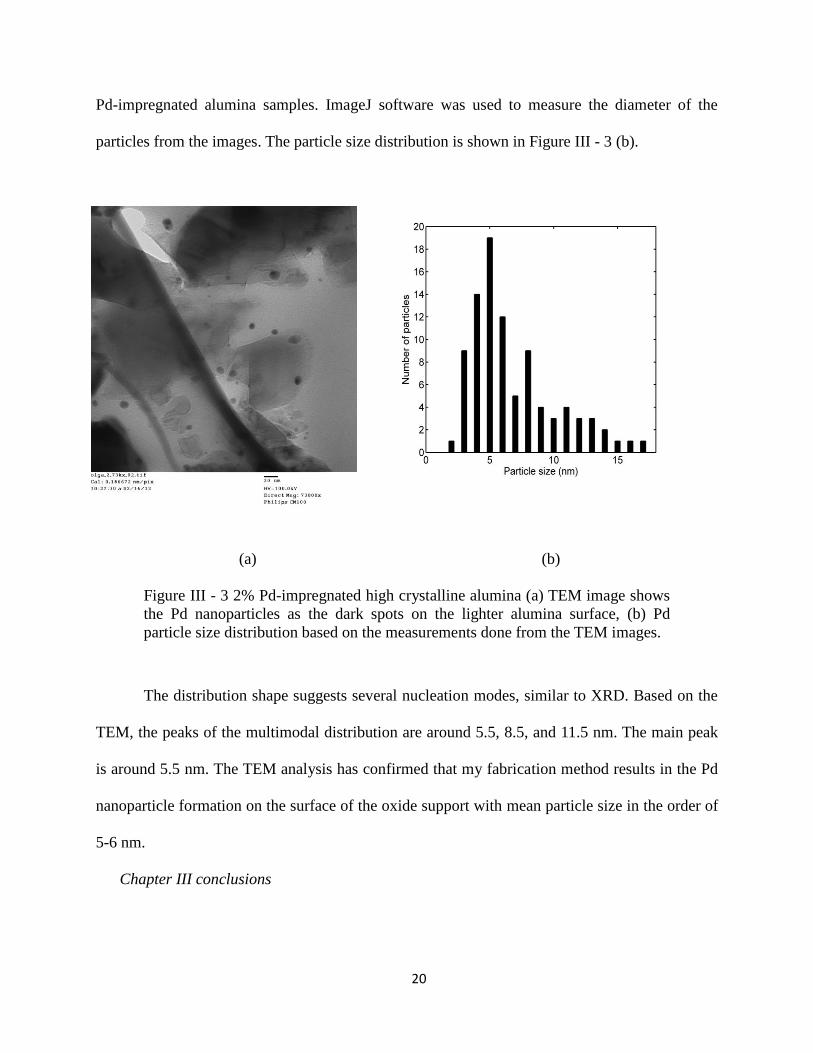
Boulder (courtesy of Troy Gould). Figure III - 3 (a) shows one of the several images of the 2%
20
Pd-impregnated alumina samples. ImageJ software was used to measure the diameter of the
particles from the images. The particle size distribution is shown in Figure III - 3 (b).
(a) (b)
Figure III - 3 2% Pd-impregnated high crystalline alumina (a) TEM image shows
the Pd nanoparticles as the dark spots on the lighter alumina surface, (b) Pd
particle size distribution based on the measurements done from the TEM images.
The distribution shape suggests several nucleation modes, similar to XRD. Based on the
TEM, the peaks of the multimodal distribution are around 5.5, 8.5, and 11.5 nm. The main peak
is around 5.5 nm. The TEM analysis has confirmed that my fabrication method results in the Pd
nanoparticle formation on the surface of the oxide support with mean particle size in the order of
5-6 nm.
Chapter III conclusions
21
Material characterization was done using XRD, chemisorption and TEM imaging to establish
a basic understanding of the catalyst’s structural features. I have confirmed that the fabrication
method described in Chapter II was capable of producing Pd nanoparticles incorporated into
alumina powder. Based on TEM analysis, the mean size of the metal nanoparticles was 5-6 nm.
Chemisorption analysis showed agglomeration of nanoparticles as a result of multiple H2/D2
exposures. The significance of the last statement will be discussed in Chapter VII.
22
CHAPTER IV
MEASUREMENT METHODS
In the absence of a unified LENR theory, the question of possible reaction products is still
unanswered. A variety of measurement techniques were used to detect radiation or transmutation
products (Storms, 2007), but what seems to unite all LENR experiments is the excess heat
generation events. This fact explains why the majority of the experimental LENR work relies
heavily on calorimetric measurements.
A. Introduction to calorimetry
Calorimetry is defined as the measurement of heat (Hemminger & Hohne, 1984) and is
associated with a heat flux. By measuring heat exchange between two systems we can
quantitatively assess the amount of energy (chemical, nuclear, electric) generated or absorbed
inside the calorimeter. In the case of the gas-loading experiments the amount of released heat is
usually small compared to the rather large applied power, which makes precise calorimetry very
important.
The two systems involved in heat exchange are the measuring system, and its
surroundings. The heat flux between the measuring system and its surroundings is mediated by
thermal resistance.
Three operational modes of calorimeters are available:
isothermal,
adiabatic,
isoperibol.
Each of these operational modes is described by three parameters:
temperature of the surroundings,
23
temperature of the measuring system,
thermal resistance between the measuring system and the surroundings.
I worked in isoperibol operational mode, which is described by a constant temperature of
the surroundings, with a possibly different temperature of the measuring system, and a finite
non-zero thermal resistance between two. To satisfy the requirements of the constant
surroundings’ temperature I used an isothermal oven capable of maintaining the stable
temperature baseline within 0.01˚C. The oven contained a measuring system made up of a
stainless steel vessel filled with reactive material. This set-up is described in more detail in the
next section.
B. Experimental apparatus
I used two apparatuses for my gas-loading experiments, and two different types of the
sample holders (vessels). The gas-loading experiments in one apparatus were completed in a
range of temperatures from 40˚C to 390˚C, while the experiments completed in the other
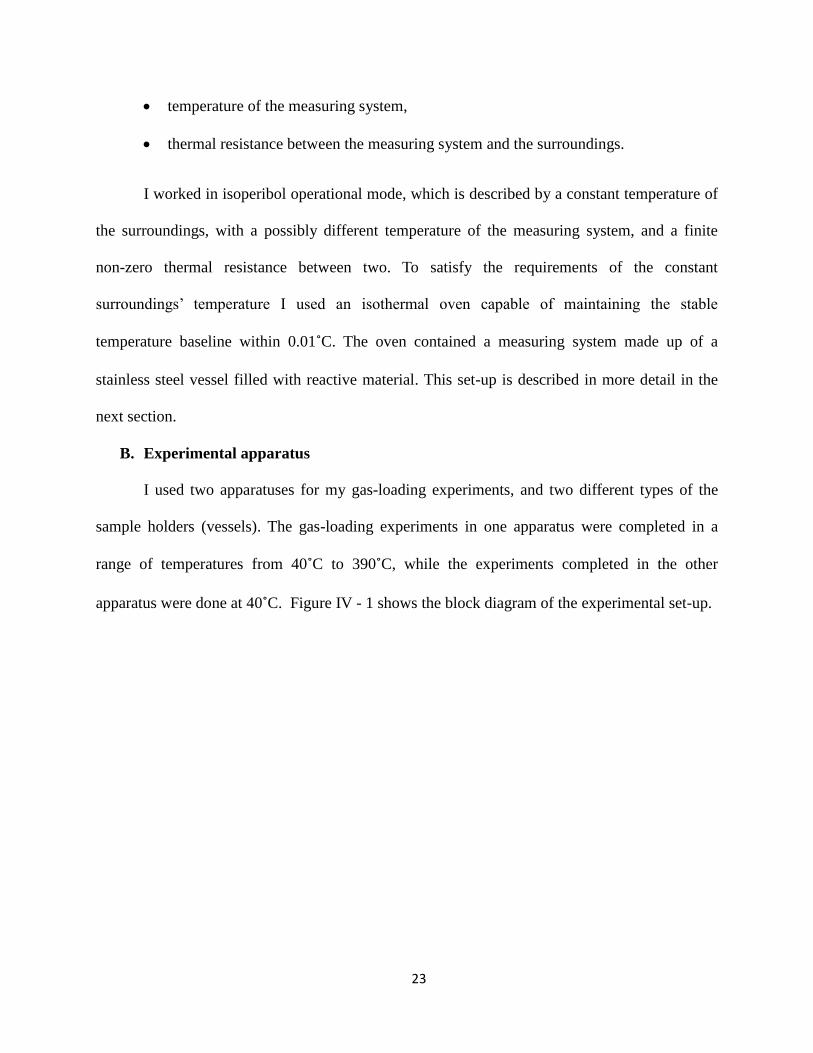
apparatus were done at 40˚C. Figure IV - 1 shows the block diagram of the experimental set-up.
24
Figure IV - 1 Gas-loading system for excess heat measurements.
The main components of my gas-loading apparatus were:
An isothermal chamber (an HP 5890A gas chromatograph oven) to provide constant
temperature surroundings with a temperature baseline stable within 0.01˚C. The
temperature uniformity across the oven was achieved by constant air flow produced
by a heater and a fan on the back panel of the oven. The temperature of the oven
could be set anywhere between 40˚C and 400˚C.
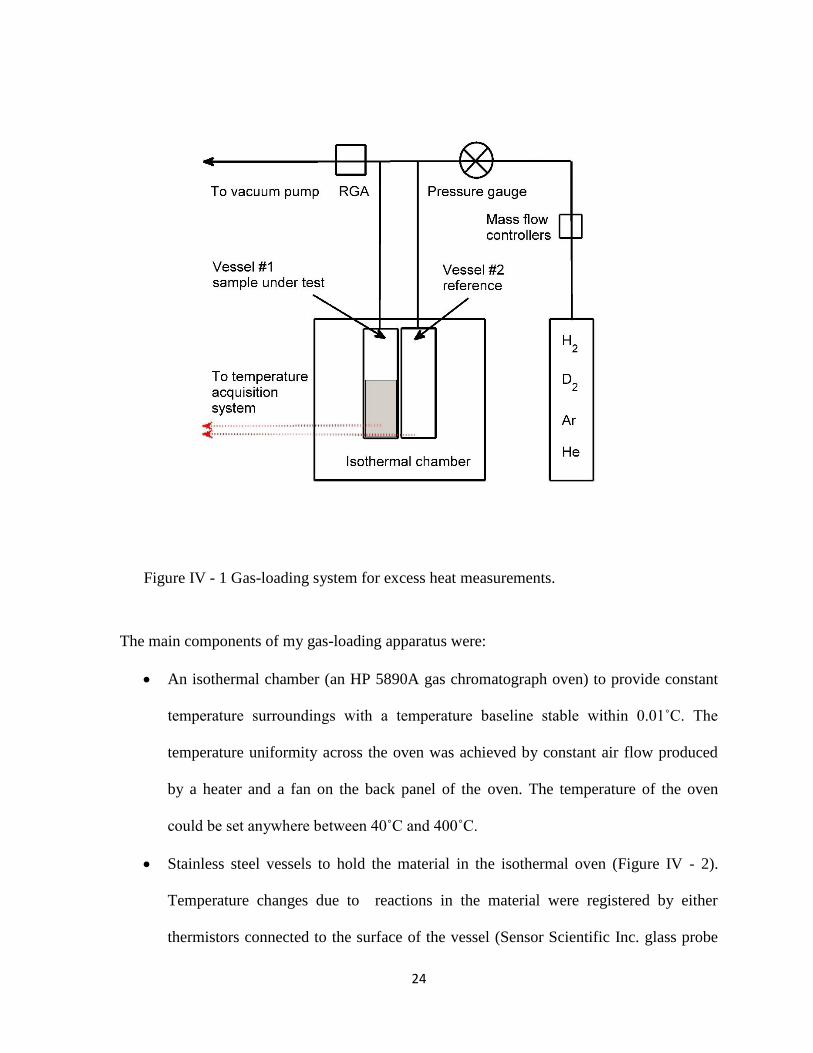
Stainless steel vessels to hold the material in the isothermal oven (Figure IV - 2).
Temperature changes due to reactions in the material were registered by either
thermistors connected to the surface of the vessel (Sensor Scientific Inc. glass probe
25
10 kΩ thermistors p/n: SP43A10310), or with resistance temperature devices
(Omega RTD-NPT-72-E-MTP-HT) screwed into the bottom of the vessels. Figure IV
- 2 shows the inside of the isothermal chamber where the vessels were attached to the
gas line. Temperature changes that exceeded the oven’s background temperature
fluctuations were associated with exothermic or endothermic heat generated in the
system.
A gas line to connect the vessels to the gas-supply cylinders. Four different gases
were supplied to the vessels. H2 and D2 were supplied through an oxygen-removing
hydrogen purifier. The D2 gas was 99.9% pure and the H2 gas was 99.99% pure. Ar
and He were supplied directly through the gas lines bypassing the purifier. The
system could be pressurized up to 2.7x10⁵ Pa (2000 torr). Evacuation of the system
was done using a turbo-molecular pump down to the 10-5
Pa (10-7
torr) level. With the
valve to the pump closed, the stainless steel vacuum system would outgas to the 10-4
Pa (10-6
torr) level. There was a section of the pipeline connected to the vessels that
was shared by the gases. However, the pressure of the gas in the pipeline during the
pressurization step was nine orders of magnitude higher than while evacuated, which
made the residual gas contribution negligible.
Mass flow controllers to control gas flow, pressure gauges, and a residual gas
analyzer (SRC RGA200) to collect the data on byproducts of the reaction were also
used.
26
(a) (b)
Figure IV - 2 Vessels containing material inside the isothermal chambers: (a) the
high temperature set-up for experiments run up to 390˚C; (b) the low temperature
set-up for experiments run at 40˚C. The temperature uniformity across the oven is
achieved by constant air flow produced by a heater and a fan that can be seen at
the back panel of the oven.
A typical run consisted of (1) pressurization by a gas of choice, (2) a period of time when
the vacuum system remained under pressure, and (3) an evacuation step. Heat production or
consumption, as a result of the reaction with the gas, was determined from temperature changes
in the vessel, whose transient temperature can deviate from the constant oven temperature
baseline. Net positive temperature change as measured by the temperature sensors was
considered as heating, and negative change as cooling.
System control, temperature and pressure data acquisition were carried out with LabView
software.
C. Calibration (isoperibol calorimetry)
27
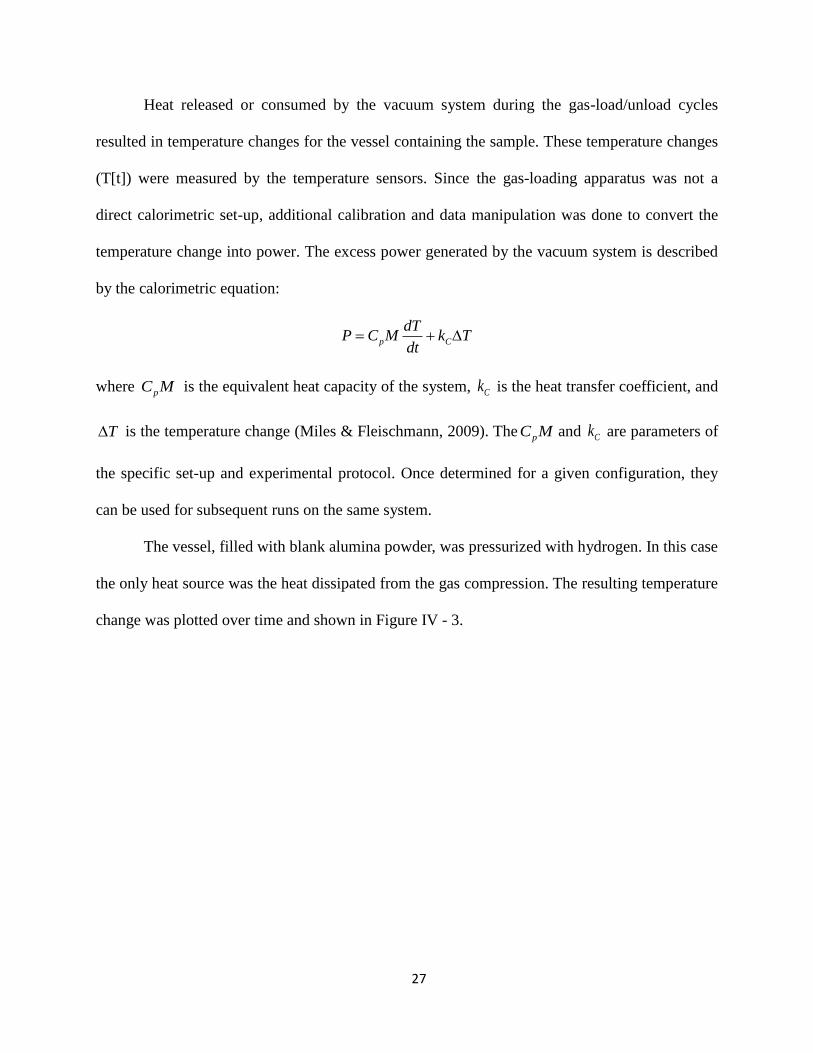
Heat released or consumed by the vacuum system during the gas-load/unload cycles
resulted in temperature changes for the vessel containing the sample. These temperature changes
(T[t]) were measured by the temperature sensors. Since the gas-loading apparatus was not a
direct calorimetric set-up, additional calibration and data manipulation was done to convert the
temperature change into power. The excess power generated by the vacuum system is described
by the calorimetric equation:
p C
dTP C M k T
dt
where pC M is the equivalent heat capacity of the system, Ck is the heat transfer coefficient, and
T is the temperature change (Miles & Fleischmann, 2009). The pC M and Ck are parameters of
the specific set-up and experimental protocol. Once determined for a given configuration, they
can be used for subsequent runs on the same system.
The vessel, filled with blank alumina powder, was pressurized with hydrogen. In this case
the only heat source was the heat dissipated from the gas compression. The resulting temperature
change was plotted over time and shown in Figure IV - 3.
28
Figure IV - 3 Experimental curve for the low-temperature system set-up: (a) the
temperature change due to pressurization of the system up to 1200 torr.
Using the known vessel parameters (volume and pressure) I linked the measured
temperature change to the heat of the compression, which was 2.3 J. During pressurization some
of the heat dissipated due to conduction. That data allowed me to calculate the heat transfer
coefficient ( ).
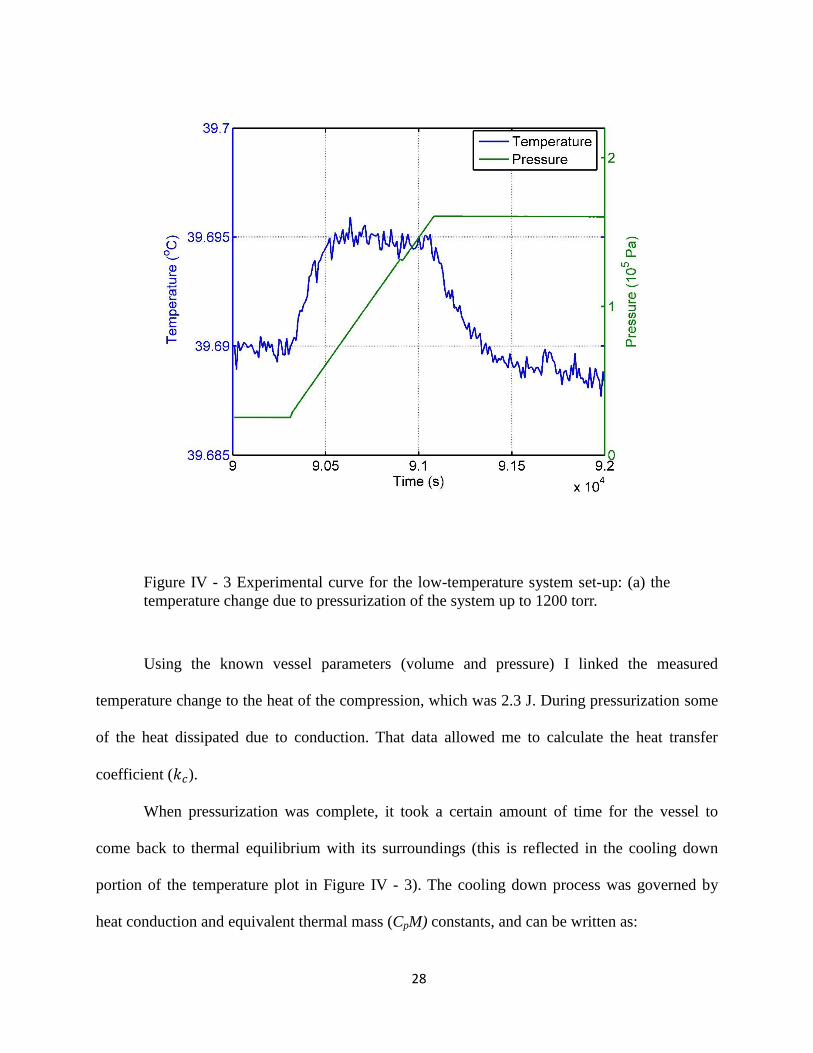
When pressurization was complete, it took a certain amount of time for the vessel to
come back to thermal equilibrium with its surroundings (this is reflected in the cooling down
portion of the temperature plot in Figure IV - 3). The cooling down process was governed by
heat conduction and equivalent thermal mass (CpM) constants, and can be written as:
29
This differential equation can be rearranged to
,
and when integrated becomes
.
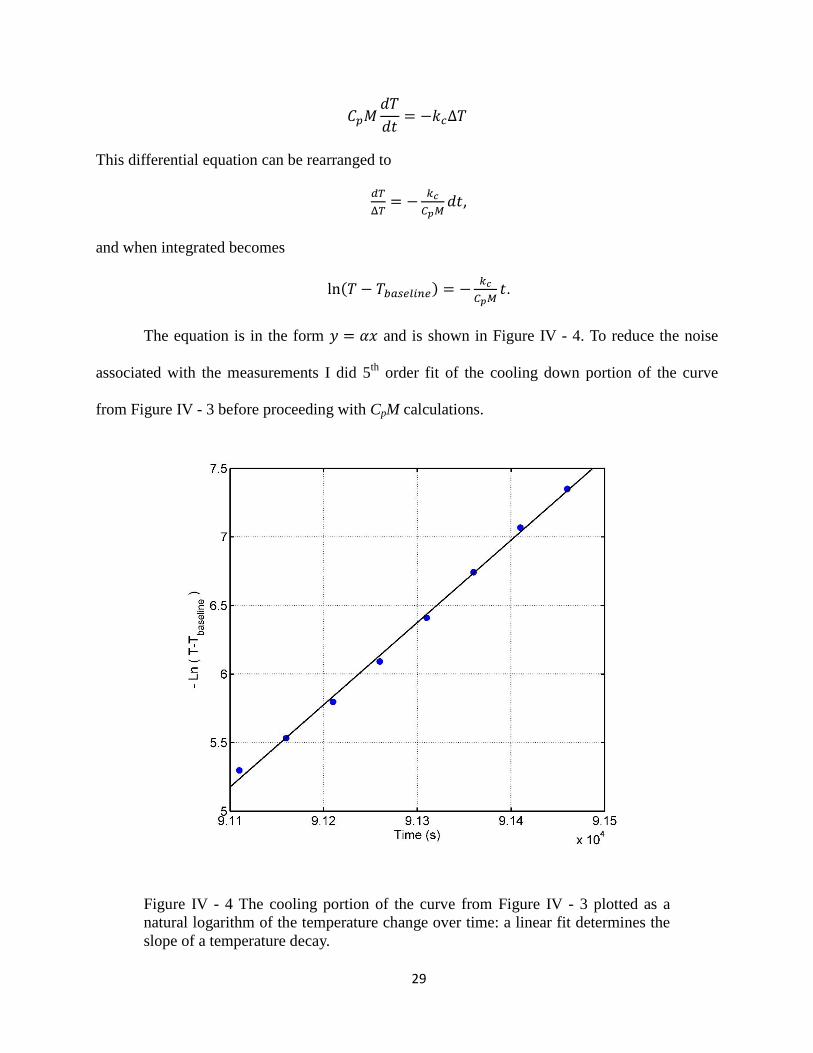
The equation is in the form and is shown in Figure IV - 4. To reduce the noise
associated with the measurements I did 5th
order fit of the cooling down portion of the curve
from Figure IV - 3 before proceeding with CpM calculations.
Figure IV - 4 The cooling portion of the curve from Figure IV - 3 plotted as a
natural logarithm of the temperature change over time: a linear fit determines the
slope of a temperature decay.
30
The value of CpM was derived based on the temperature decay slope, ,
where kc was calculated earlier. Tbaseline is the temperature of the vessel before the pressurization
started. For the system that was equipped with vessels for the low temperature (40˚C)
measurements, the calculated parameters were: W K-1
and J K-1
. For
the high-temperature measurement apparatus the coefficients were: W K-1
and
J K-1
.
D. Evaluation of the measurement error bars
Excess heat was calculated for each run by summing up heat released during
pressurization step and heat consumed during evacuation which follows the chemical notion
where exothermic heat is a negative value, while endothermic heat is positive. The temperature
change over time T(t) was converted into power change over time P(t) using the calibration
coefficients calculated in the previous section. By integrating P(t) signal over time, I evaluated
the amount of heat produced/consumed by the system. Integration was done over fixed time
intervals: 4000 s during pressurization and 5000 s during evacuation. Second time interval was
longer since desorption of the hydrogen isotopes is slower process compare to almost
instantaneous absorption.
Variation within the integration was calculated as a root mean square (RMS) of heat of
desorption values from 20 different runs and was found to be 2.2 J.
The systematic error was accounted for when calibration constants and were
derived. Thus, the system is considered to be free of the systematic error.
E. Radiometry and alpha particles measurements
According to some LENR theories, alpha particle generation and energy release are the
result of conventional deuteron fusion:
31
To test these theories, I measured radiation levels and alpha particle emission during gas
pressurization cycles to trace possible nuclear products. Following the isotope effect
assumptions, the nuclear products should have been released during the exposure of the material
to deuterium gas, and not during exposure to hydrogen.
a) X-ray measurements
Using a Geiger counter (Ludlum Measurements model 2241, LND tube model 07-27) I
tested 2%Pd-impregnated alumina in the presence of H2 and D2 gases to detect a radiation signal.
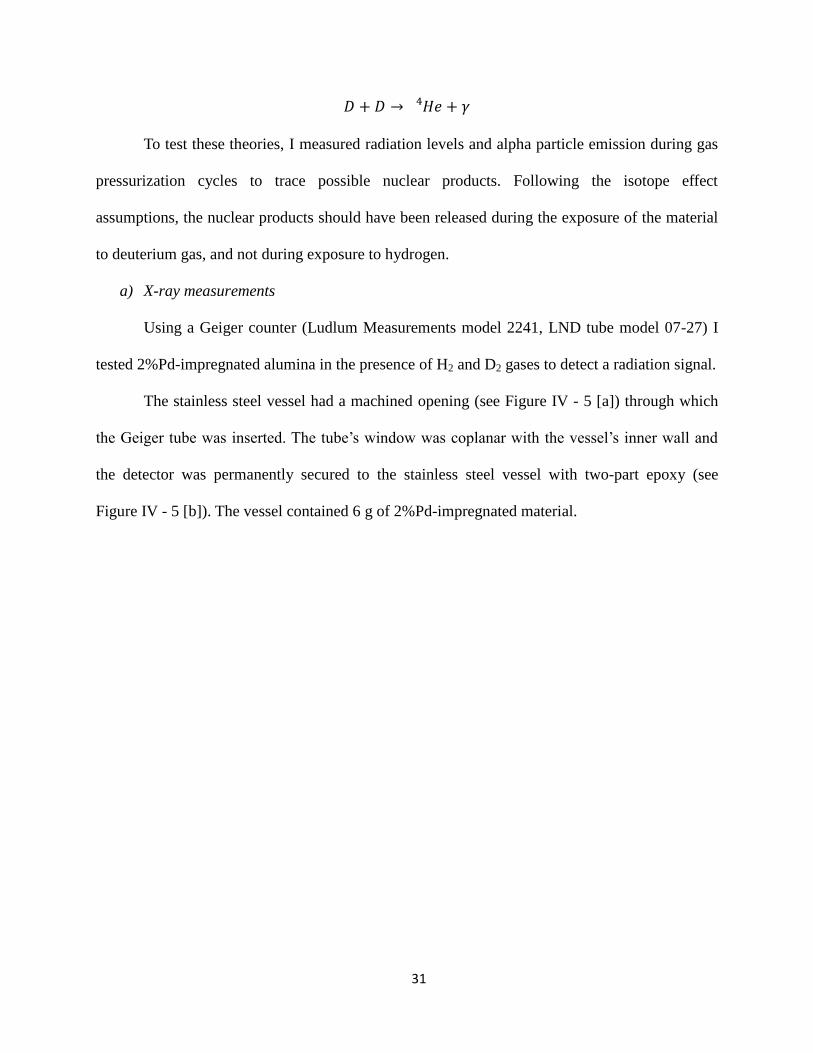
The stainless steel vessel had a machined opening (see Figure IV - 5 [a]) through which
the Geiger tube was inserted. The tube’s window was coplanar with the vessel’s inner wall and
the detector was permanently secured to the stainless steel vessel with two-part epoxy (see
Figure IV - 5 [b]). The vessel contained 6 g of 2%Pd-impregnated material.
32
(a) (b)
Figure IV - 5 (a) The stainless steel vessel and the Geiger detector; (b) the
stainless steel vessel with the Geiger detector inside the oven and ready for
testing.
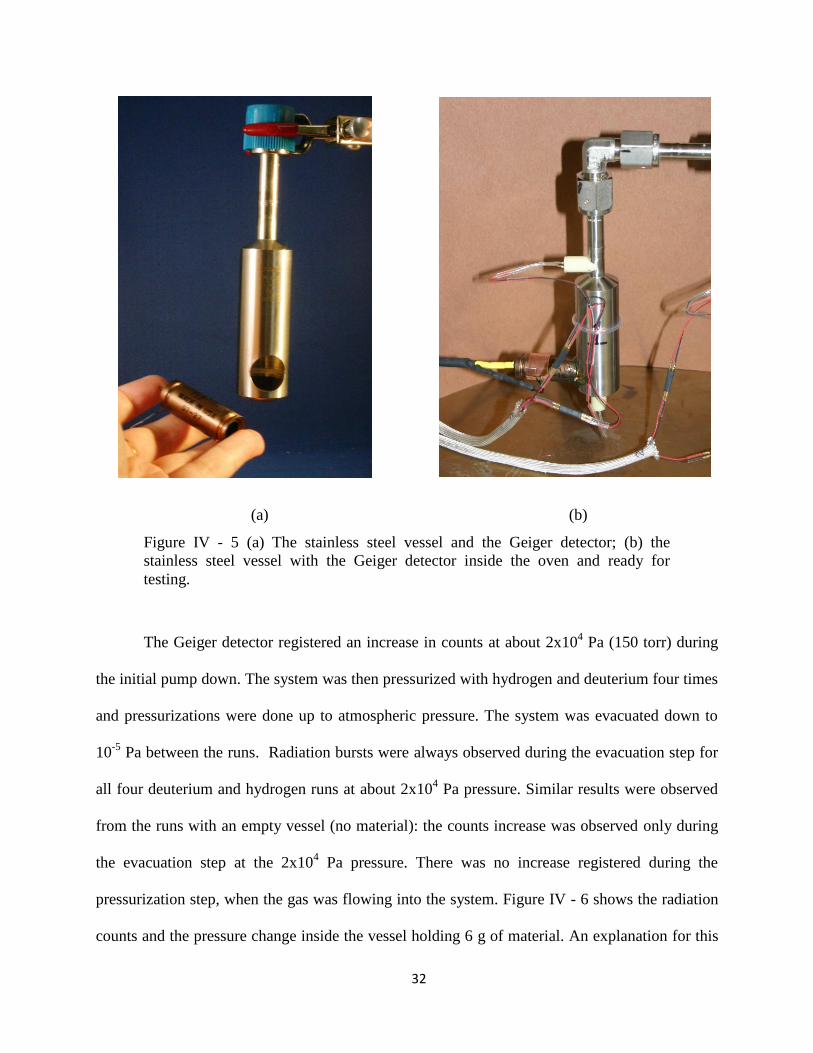
The Geiger detector registered an increase in counts at about 2x10⁴ Pa (150 torr) during
the initial pump down. The system was then pressurized with hydrogen and deuterium four times
and pressurizations were done up to atmospheric pressure. The system was evacuated down to
10-5
Pa between the runs. Radiation bursts were always observed during the evacuation step for
all four deuterium and hydrogen runs at about 2x10⁴ Pa pressure. Similar results were observed
from the runs with an empty vessel (no material): the counts increase was observed only during
the evacuation step at the 2x10⁴ Pa pressure. There was no increase registered during the
pressurization step, when the gas was flowing into the system. Figure IV - 6 shows the radiation
counts and the pressure change inside the vessel holding 6 g of material. An explanation for this
33
observed effect could be a leaking Geiger tube, with gas that was ionized when pressure dropped
to the certain point. The question on why the same effect was not observed when the pressure
was rising during the pressurization remains unanswered.
Figure IV - 6 The radiation counts and deuterium pressure changes inside the
vessel. The radiation spike was observed at 2x10⁴ Pa during the evacuation step.
b) Alpha particles detection
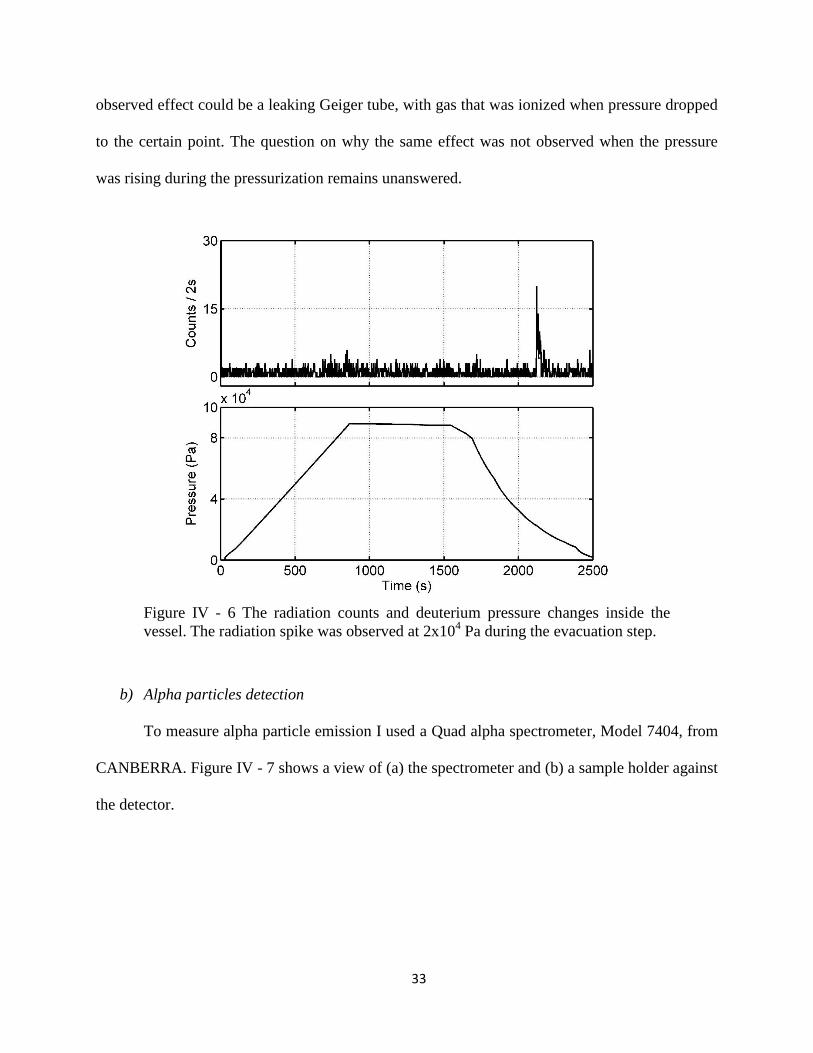
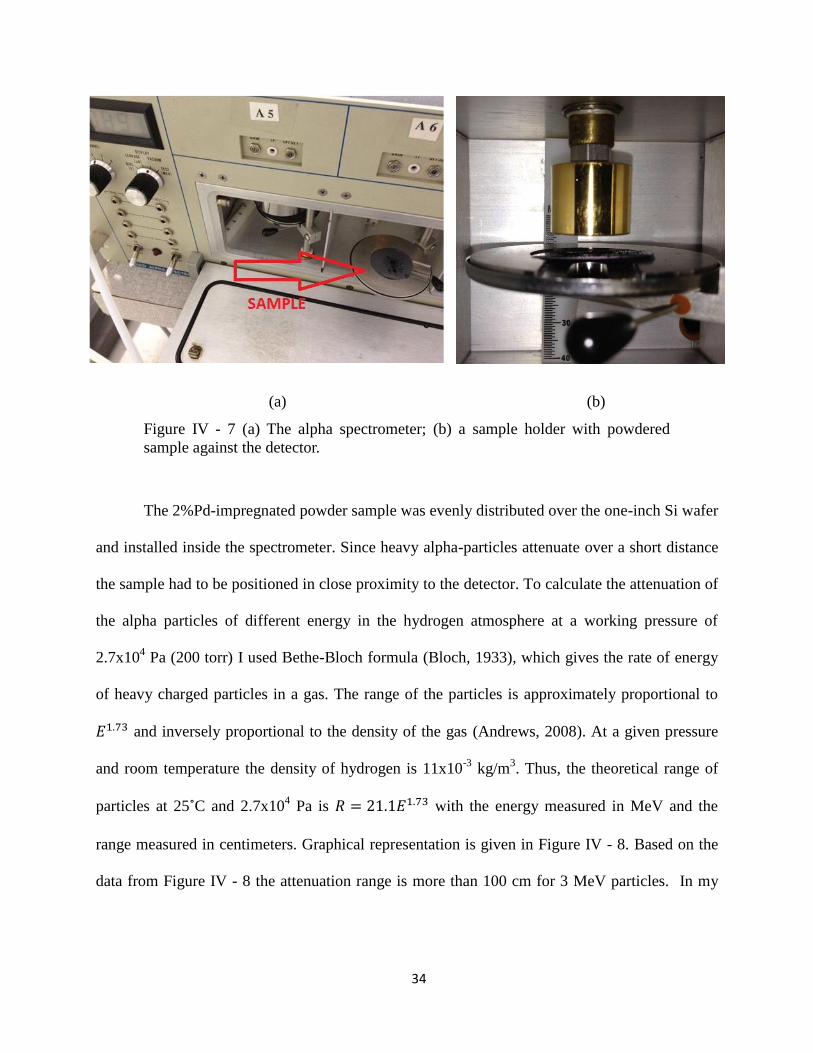
To measure alpha particle emission I used a Quad alpha spectrometer, Model 7404, from
CANBERRA. Figure IV - 7 shows a view of (a) the spectrometer and (b) a sample holder against
the detector.
34
(a) (b)
Figure IV - 7 (a) The alpha spectrometer; (b) a sample holder with powdered
sample against the detector.
The 2%Pd-impregnated powder sample was evenly distributed over the one-inch Si wafer
and installed inside the spectrometer. Since heavy alpha-particles attenuate over a short distance
the sample had to be positioned in close proximity to the detector. To calculate the attenuation of
the alpha particles of different energy in the hydrogen atmosphere at a working pressure of
2.7x10⁴ Pa (200 torr) I used Bethe-Bloch formula (Bloch, 1933), which gives the rate of energy
of heavy charged particles in a gas. The range of the particles is approximately proportional to
and inversely proportional to the density of the gas (Andrews, 2008). At a given pressure
and room temperature the density of hydrogen is 11x10-3
kg/m3. Thus, the theoretical range of
particles at 25˚C and 2.7x10⁴ Pa is with the energy measured in MeV and the
range measured in centimeters. Graphical representation is given in Figure IV - 8. Based on the
data from Figure IV - 8 the attenuation range is more than 100 cm for 3 MeV particles. In my
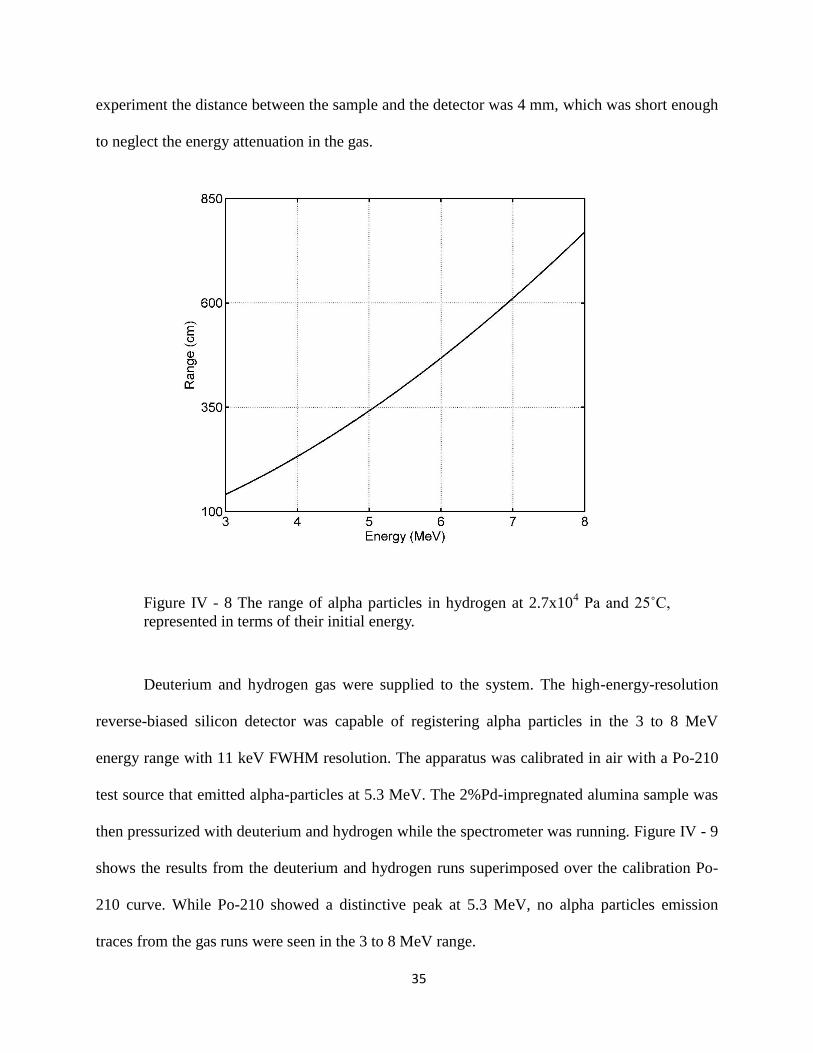
35
experiment the distance between the sample and the detector was 4 mm, which was short enough
to neglect the energy attenuation in the gas.
Figure IV - 8 The range of alpha particles in hydrogen at 2.7x10⁴ Pa and 25˚C,
represented in terms of their initial energy.
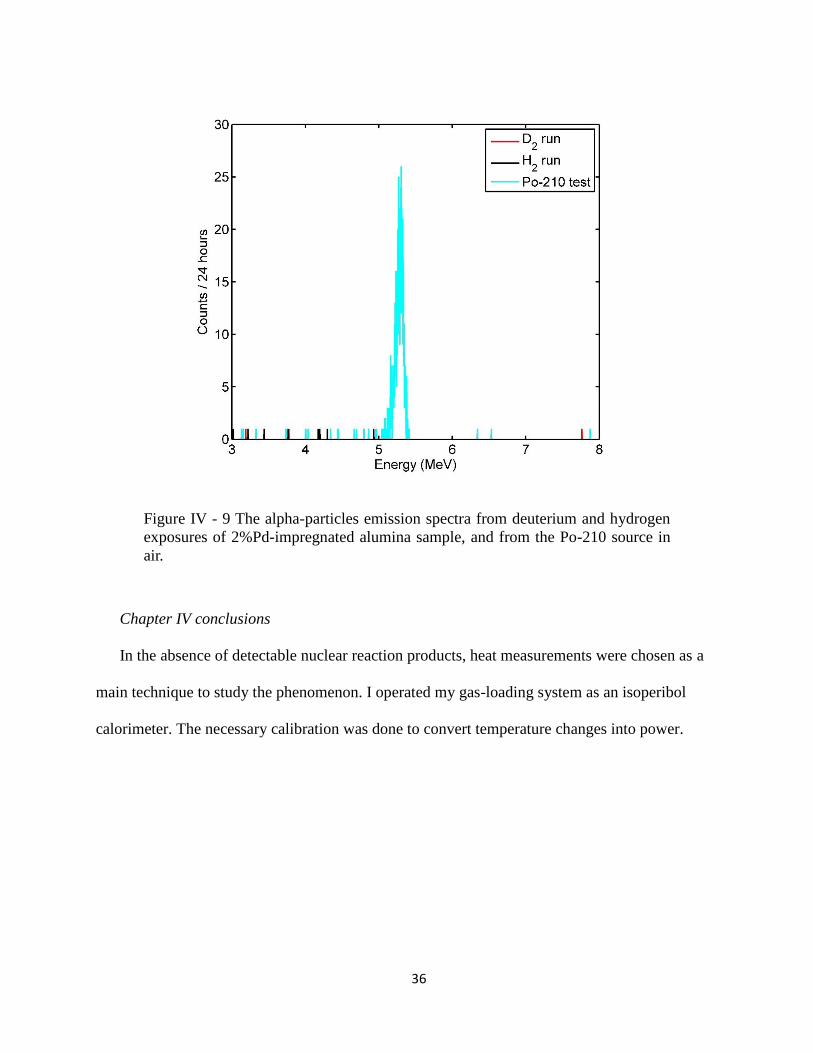
Deuterium and hydrogen gas were supplied to the system. The high-energy-resolution
reverse-biased silicon detector was capable of registering alpha particles in the 3 to 8 MeV
energy range with 11 keV FWHM resolution. The apparatus was calibrated in air with a Po-210
test source that emitted alpha-particles at 5.3 MeV. The 2%Pd-impregnated alumina sample was
then pressurized with deuterium and hydrogen while the spectrometer was running. Figure IV - 9
shows the results from the deuterium and hydrogen runs superimposed over the calibration Po-
210 curve. While Po-210 showed a distinctive peak at 5.3 MeV, no alpha particles emission
traces from the gas runs were seen in the 3 to 8 MeV range.
36
Figure IV - 9 The alpha-particles emission spectra from deuterium and hydrogen
exposures of 2%Pd-impregnated alumina sample, and from the Po-210 source in
air.
Chapter IV conclusions
In the absence of detectable nuclear reaction products, heat measurements were chosen as a
main technique to study the phenomenon. I operated my gas-loading system as an isoperibol
calorimeter. The necessary calibration was done to convert temperature changes into power.
37
CHAPTER V
RESULTS: HEAT MEASUREMENTS
A. Excess heat generation and isotope effect
I started my experimental work by confirming the excess heat production in Pd-
impregnated materials in the presence of deuterium. Using the set-up described in Chapter IV, I
pressurized the material with either deuterium or hydrogen, while measuring the temperature
change (Dmitriyeva, et al., 2012, Mechanisms for heat generation during deuterium and
hydrogen loading of palladium nanostructures).
The typical pressurization cycle consisted of 3 steps: (1) pressurization with hydrogen or
deuterium, (2) the period of time while the system was under pressure and (3) an evacuation step.
A conclusion on excess heat generation was made by comparing the amount of heat generated
during the pressurization step to the amount of heat consumed during the evacuation step. The
assumption was that any reversible heat released upon pressurization (heat of pressurization, heat
of absorption/adsorption of hydrogen isotopes in material) would be compensated for upon
evacuation. Any irreversible heat would result in a net energy excess/deficit, which I was
interested in examining.
Initially, the system was checked with alumina and zeolite powders, without any Pd
added. In the presence of hydrogen and deuterium I found that the exothermic heat due to the
work of pressurization (pV- work) and the endothermic heat (recovery of pV-work) during
evacuation equally balanced one another, and no excess heat was produced.
Figure V - 1 shows a typical run done with the 2% Pd-impregnated alumina powder in
the presence of deuterium gas. A two-slope pressurization was needed to separate the process of
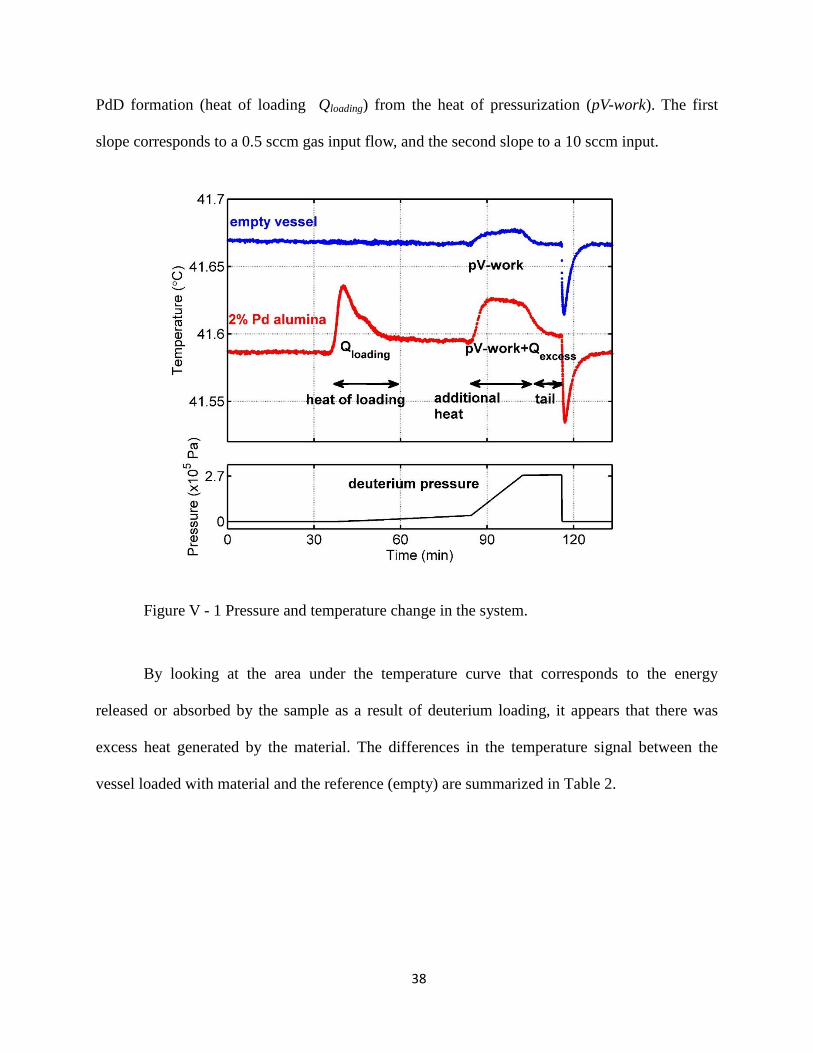
38
PdD formation (heat of loading Qloading) from the heat of pressurization (pV-work). The first
slope corresponds to a 0.5 sccm gas input flow, and the second slope to a 10 sccm input.
Figure V - 1 Pressure and temperature change in the system.
By looking at the area under the temperature curve that corresponds to the energy
released or absorbed by the sample as a result of deuterium loading, it appears that there was
excess heat generated by the material. The differences in the temperature signal between the
vessel loaded with material and the reference (empty) are summarized in Table 2.
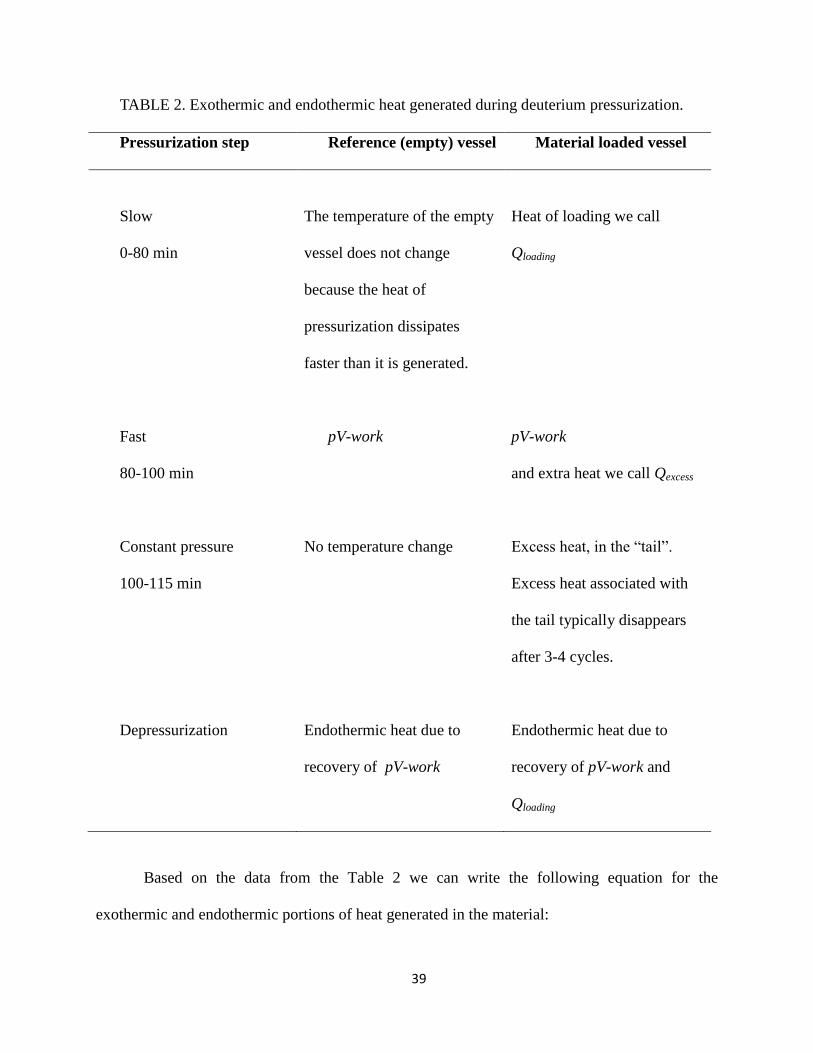
39
TABLE 2. Exothermic and endothermic heat generated during deuterium pressurization.
Pressurization step Reference (empty) vessel Material loaded vessel
Slow
0-80 min
The temperature of the empty
vessel does not change
because the heat of
pressurization dissipates
faster than it is generated.
Heat of loading we call
Qloading
Fast
80-100 min
pV-work pV-work
and extra heat we call Qexcess
Constant pressure
100-115 min
No temperature change Excess heat, in the “tail”.
Excess heat associated with
the tail typically disappears
after 3-4 cycles.
Depressurization Endothermic heat due to
recovery of pV-work
Endothermic heat due to
recovery of pV-work and
Qloading
Based on the data from the Table 2 we can write the following equation for the
exothermic and endothermic portions of heat generated in the material:
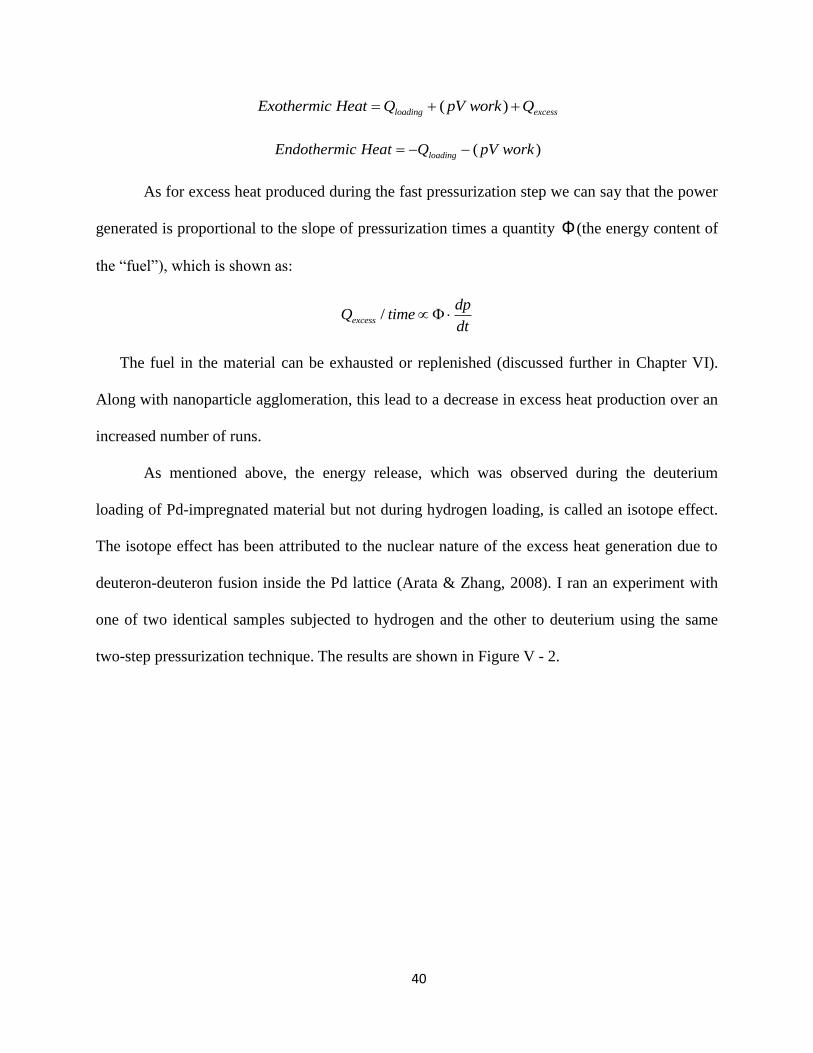
40
( )loading excessExothermic Heat Q pV work Q
( )loadingEndothermic Heat Q pV work
As for excess heat produced during the fast pressurization step we can say that the power
generated is proportional to the slope of pressurization times a quantity F (the energy content of
the “fuel”), which is shown as:
/excess
dpQ time
dt
The fuel in the material can be exhausted or replenished (discussed further in Chapter VI).
Along with nanoparticle agglomeration, this lead to a decrease in excess heat production over an
increased number of runs.
As mentioned above, the energy release, which was observed during the deuterium
loading of Pd-impregnated material but not during hydrogen loading, is called an isotope effect.
The isotope effect has been attributed to the nuclear nature of the excess heat generation due to
deuteron-deuteron fusion inside the Pd lattice (Arata & Zhang, 2008). I ran an experiment with
one of two identical samples subjected to hydrogen and the other to deuterium using the same
two-step pressurization technique. The results are shown in Figure V - 2.
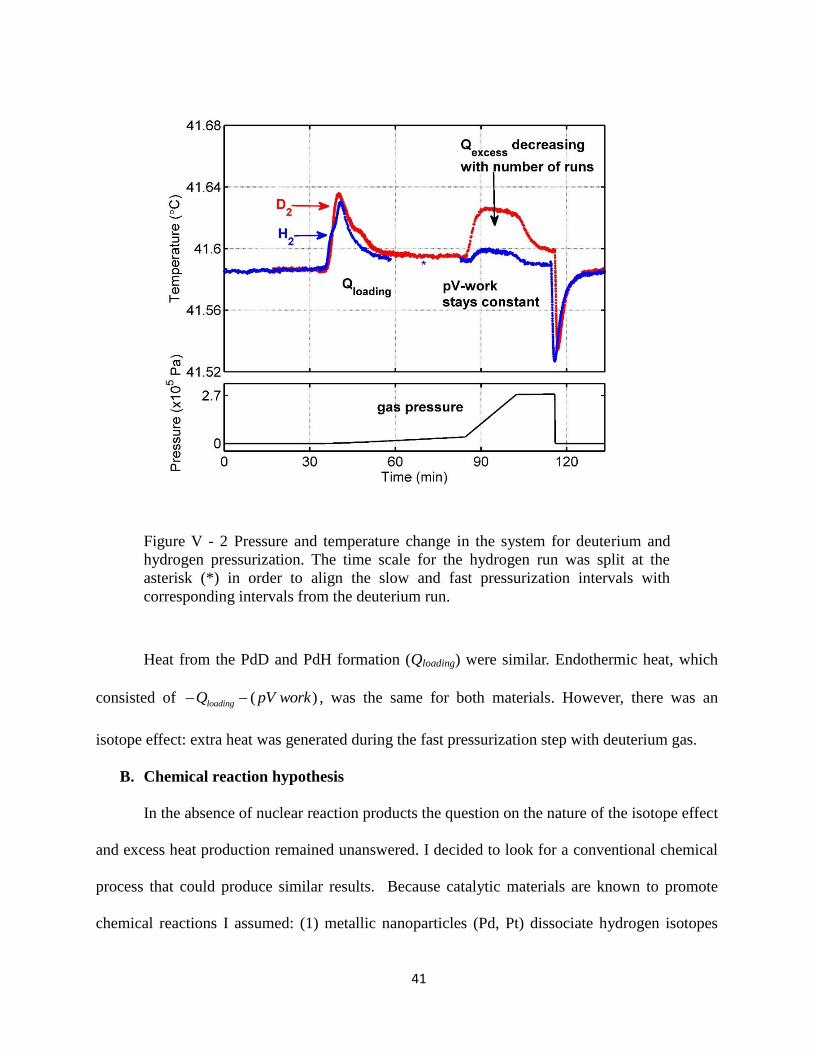
41
Figure V - 2 Pressure and temperature change in the system for deuterium and
hydrogen pressurization. The time scale for the hydrogen run was split at the
asterisk (*) in order to align the slow and fast pressurization intervals with
corresponding intervals from the deuterium run.
Heat from the PdD and PdH formation (Qloading) were similar. Endothermic heat, which
consisted of ( )loadingQ pV work , was the same for both materials. However, there was an
isotope effect: extra heat was generated during the fast pressurization step with deuterium gas.
B. Chemical reaction hypothesis
In the absence of nuclear reaction products the question on the nature of the isotope effect
and excess heat production remained unanswered. I decided to look for a conventional chemical
process that could produce similar results. Because catalytic materials are known to promote
chemical reactions I assumed: (1) metallic nanoparticles (Pd, Pt) dissociate hydrogen isotopes
42
molecules to form metal hydride and (2) initiate a spillover when deuterium and hydrogen atoms
are transferred from the metal to the oxide support, and (3) the remaining water that is trapped in
the material along with the OH groups on the face of the alumina act as a fuel to support a
hydrogen/deuterium (H/D) exchange reaction. The H/D exchange reaction is an exothermic
reaction in which deuterium substitutes for a hydrogen atom in a chemical compound. An
explanation of an anomalous heating and isotope effect using the concept of H/D exchange was
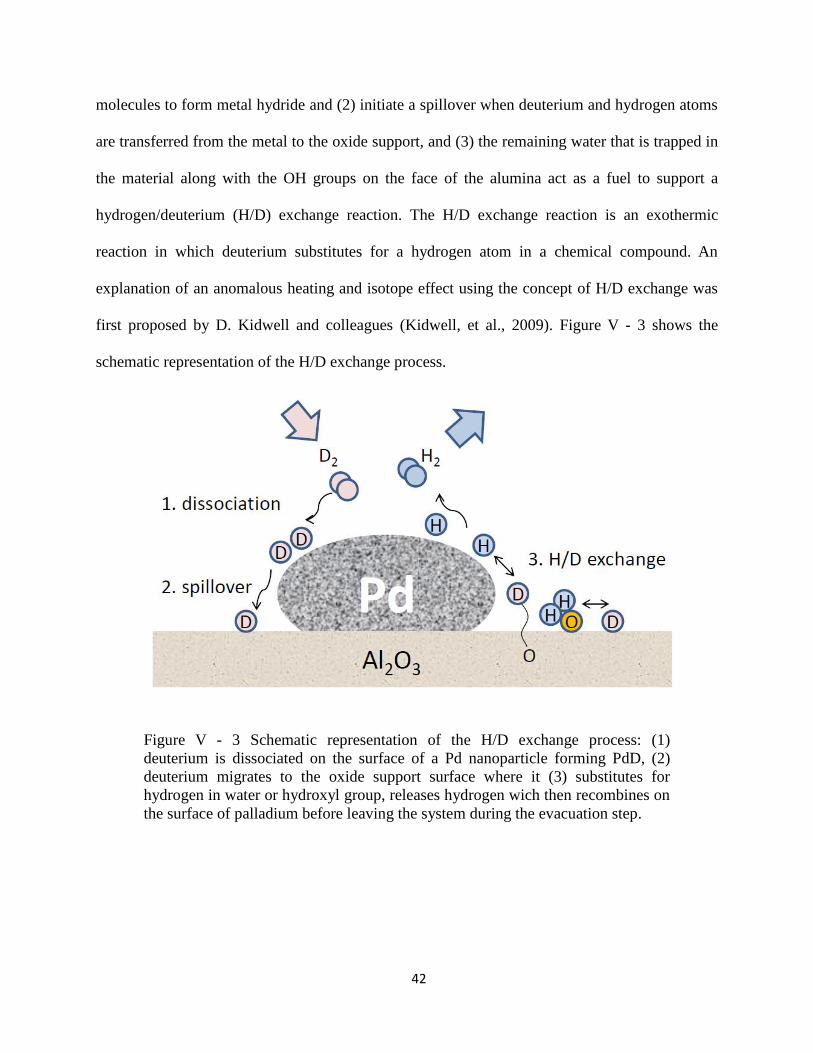
first proposed by D. Kidwell and colleagues (Kidwell, et al., 2009). Figure V - 3 shows the
schematic representation of the H/D exchange process.
Figure V - 3 Schematic representation of the H/D exchange process: (1)
deuterium is dissociated on the surface of a Pd nanoparticle forming PdD, (2)
deuterium migrates to the oxide support surface where it (3) substitutes for
hydrogen in water or hydroxyl group, releases hydrogen wich then recombines on
the surface of palladium before leaving the system during the evacuation step.
43
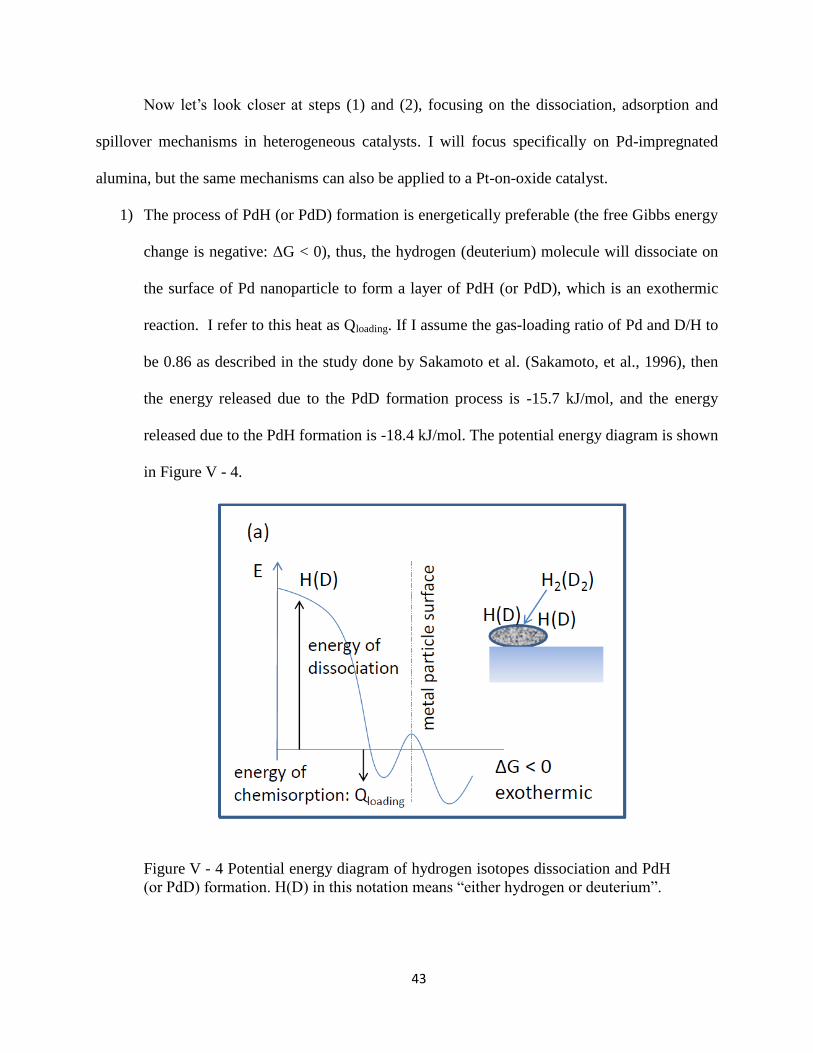
Now let’s look closer at steps (1) and (2), focusing on the dissociation, adsorption and
spillover mechanisms in heterogeneous catalysts. I will focus specifically on Pd-impregnated
alumina, but the same mechanisms can also be applied to a Pt-on-oxide catalyst.
1) The process of PdH (or PdD) formation is energetically preferable (the free Gibbs energy
change is negative: ΔG < 0), thus, the hydrogen (deuterium) molecule will dissociate on
the surface of Pd nanoparticle to form a layer of PdH (or PdD), which is an exothermic
reaction. I refer to this heat as Qloading. If I assume the gas-loading ratio of Pd and D/H to
be 0.86 as described in the study done by Sakamoto et al. (Sakamoto, et al., 1996), then
the energy released due to the PdD formation process is -15.7 kJ/mol, and the energy
released due to the PdH formation is -18.4 kJ/mol. The potential energy diagram is shown
in Figure V - 4.
Figure V - 4 Potential energy diagram of hydrogen isotopes dissociation and PdH
(or PdD) formation. H(D) in this notation means “either hydrogen or deuterium”.
44
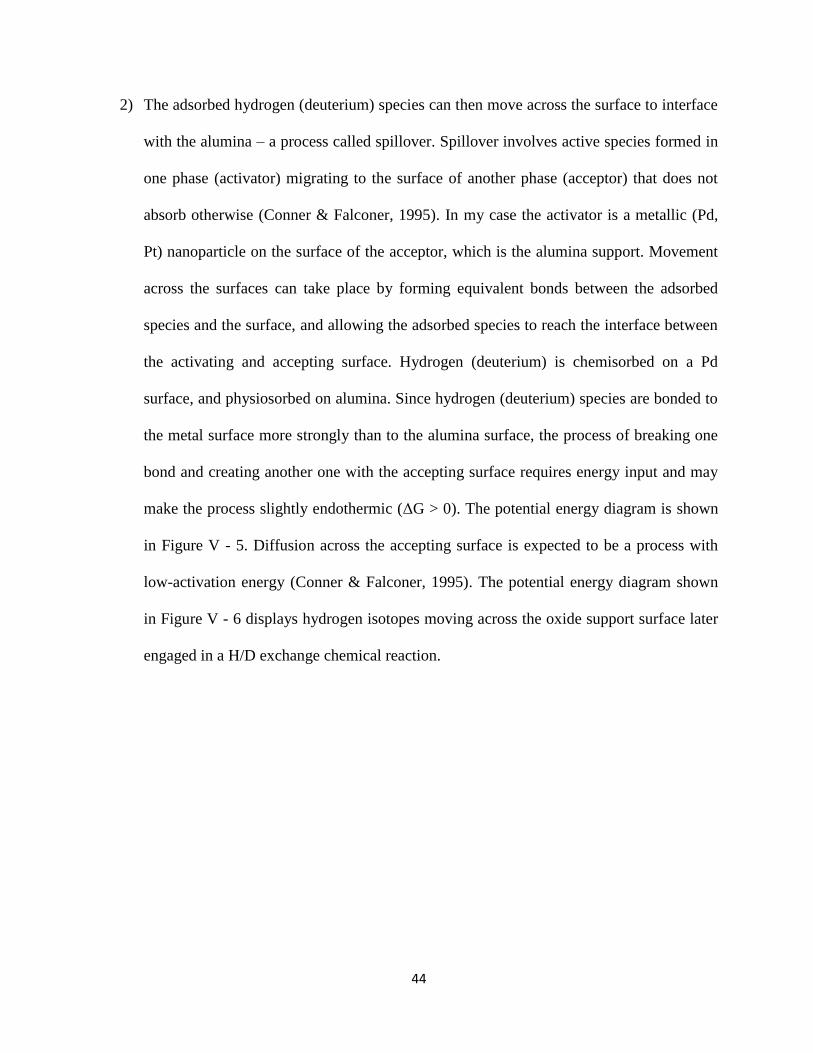
2) The adsorbed hydrogen (deuterium) species can then move across the surface to interface
with the alumina – a process called spillover. Spillover involves active species formed in
one phase (activator) migrating to the surface of another phase (acceptor) that does not
absorb otherwise (Conner & Falconer, 1995). In my case the activator is a metallic (Pd,
Pt) nanoparticle on the surface of the acceptor, which is the alumina support. Movement
across the surfaces can take place by forming equivalent bonds between the adsorbed
species and the surface, and allowing the adsorbed species to reach the interface between
the activating and accepting surface. Hydrogen (deuterium) is chemisorbed on a Pd
surface, and physiosorbed on alumina. Since hydrogen (deuterium) species are bonded to
the metal surface more strongly than to the alumina surface, the process of breaking one
bond and creating another one with the accepting surface requires energy input and may
make the process slightly endothermic (ΔG > 0). The potential energy diagram is shown
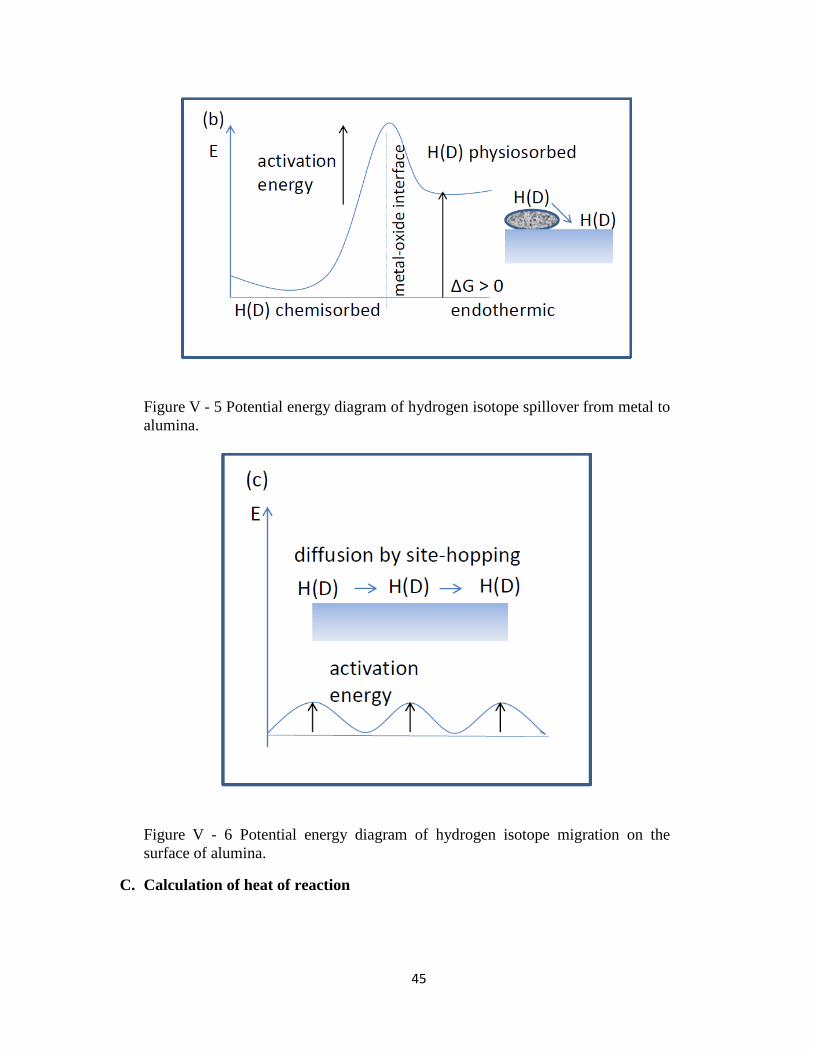
in Figure V - 5. Diffusion across the accepting surface is expected to be a process with
low-activation energy (Conner & Falconer, 1995). The potential energy diagram shown
in Figure V - 6 displays hydrogen isotopes moving across the oxide support surface later
engaged in a H/D exchange chemical reaction.
45
Figure V - 5 Potential energy diagram of hydrogen isotope spillover from metal to
alumina.
Figure V - 6 Potential energy diagram of hydrogen isotope migration on the
surface of alumina.
C. Calculation of heat of reaction
46
The heat of reaction is the change in the enthalpy of a chemical reaction that occurs at a
constant pressure. It is a thermodynamic unit of measurement used to calculate the amount of
energy per mole either emitted or produced in a reaction and is typically denoted by the unit
kJ/mol. When calculating the enthalpy of reaction the enthalpies of formation for reactants and
products are used. The enthalpy of formation is a function of temperature (and so is the enthalpy
of reaction). The temperature dependence can be calculated from the specific heat capacity of the
products and reactants. The specific heat capacity of materials depends upon the temperature.
For a given phase of a material the heat capacity increases with temperature. The concept comes
from statistical thermodynamics: as the temperature increases, molecules can exist in a larger
number of states and access various energy levels of rotation and vibration. At a finite
temperature, the vibrational and rotational degrees of freedom are not fully available but when
the temperature increases so does the ability of the molecules to absorb energy (thus the specific
heat capacity increases with the temperature). Heat capacity data can be found using the shomate
equation:
where T is the temperature in Kelvin and the quantities a, b, and c are constants which depend
only on the material of interest and can be found in in thermodynamic tables.
The enthalpy change of the reaction can be written as:
The derivative with respect to temperature can be written as:
Using the heat capacity terms:
47
and integrating:
and substituting
, the enthalpy of the reaction as a function of
temperature can be written as:
where are calculated from the known a, b, and c coefficients for the products and
the reactants of the reaction in the same way as ; t = T(K)/1000; is the enthalpy change
for the reaction at standard conditions in units kJ/mol.
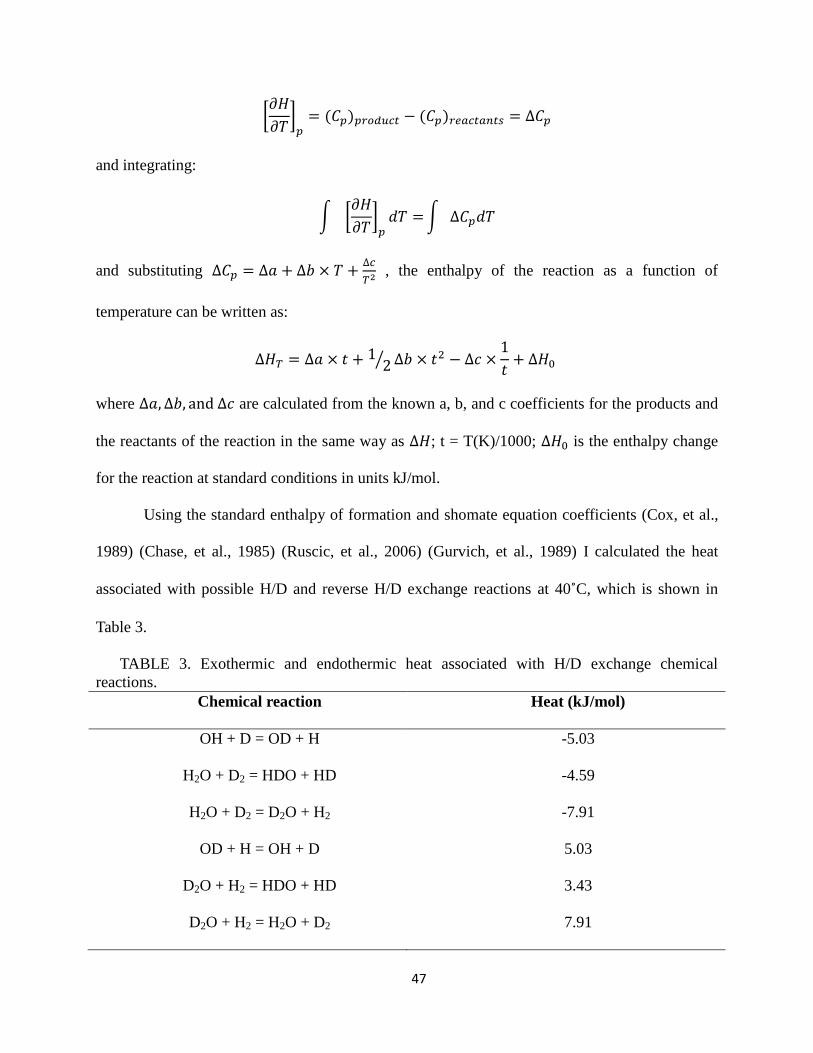
Using the standard enthalpy of formation and shomate equation coefficients (Cox, et al.,
1989) (Chase, et al., 1985) (Ruscic, et al., 2006) (Gurvich, et al., 1989) I calculated the heat
associated with possible H/D and reverse H/D exchange reactions at 40˚C, which is shown in
Table 3.
TABLE 3. Exothermic and endothermic heat associated with H/D exchange chemical
reactions.
Chemical reaction Heat (kJ/mol)
OH + D = OD + H -5.03
H2O + D2 = HDO + HD -4.59
H2O + D2 = D2O + H2 -7.91
OD + H = OH + D 5.03
D2O + H2 = HDO + HD 3.43
D2O + H2 = H2O + D2 7.91
48
As shown in the table, the reaction can be either exothermic (negative value) or
endothermic (positive value). If the source of the anomalous heat in Pd nanosystems is the H/D
exchange reaction, then by controlling the particular water isotope in the material and exposing it
to either hydrogen or deuterium we should be able to demonstrate both exothermic and
endothermic heat production in the system. Results are discussed in the following section.
Chapter V conclusions
I have confirmed the excess heat production and the isotope effect in Pd and Pt on
alumina and zeolite supports. The excess heat is released during the fast pressurization step and
proportional to the slope of pressurization times a quantity - the energy content of the fuel. In
the absence of a nuclear reaction product I looked at an H/D exchange reaction, which was a
conventional chemical process that could explain the results. The heterogeneous catalyst
provided a perfect environment for the H/D reaction. The oxide support is a source of the
exchange sites (fuel: OH, OD, H2O, and D2O), while metallic nanoparticles ensure the delivery
of the atomic hydrogen isotopes to the exchange sites through dissociation and spillover. Based
on the enthalpy of formation I expect both, exo- and endothermic exchange reactions to happen.
The concept of fuel and the way it can be controlled within the material are described in full
detail in the next two chapters.
49
CHAPTER VI
H/D EXCHANGE AS A SOURCE OF CHEMICAL HEAT
A. Water isotope experiment
As stated in the previous chapter, the H/D exchange reaction can be either exothermic or
endothermic based on which isotope is exchanged. Therefore, by controlling the particular
isotope in the material and exposing it to either hydrogen or deuterium, I should be able to
confirm both exothermic and endothermic heat production. The fact that material can generate or
absorb heat based on a particular isotope concentration will prove that H/D exchange chemical
reaction is indeed a driving mechanism for the excess heat production observed in LENR
experiments.
Two different approaches were taken when loading Pd into the alumina powder
(Dmitriyeva, et al., 2012, Origin of excess heat generation during loading Pd-impregnted
alumina powder with deuteriu and hydrogen). My goal was to make two materials: one rich in
hydrogen with very little deuterium, and the other rich in deuterium with very little hydrogen.
The H-rich material was virtually free of deuterons: the material was fabricated in H2O-based
solution as described in Chapter III and any moisture absorbed from the air also came in H2O
form. I assumed that H-rich material was virtually 100% “protonated” (protium accounts for
more than 99.98% of all the naturally occurring hydrogen).
The D-rich material was fabricated from D-based chemicals in argon atmosphere;
however, with all the precautions used to prevent exposure to air it was only partially
“deuterated”. This partial deuteration was confirmed by nuclear magnetic resonance (NMR)
measurements. The NMR showed the concentration ratio of the deuterons to the protons in D-
rich material to be close to 2.2. Based on this information the material was 70% deuterated.
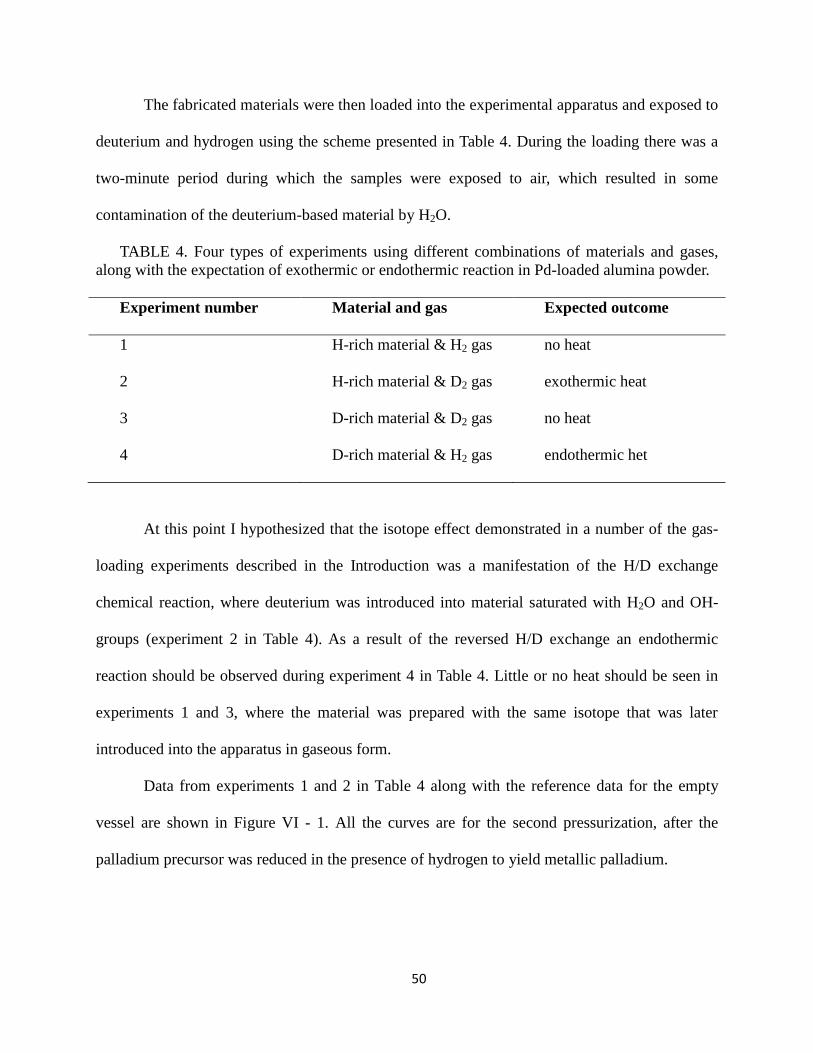
50
The fabricated materials were then loaded into the experimental apparatus and exposed to
deuterium and hydrogen using the scheme presented in Table 4. During the loading there was a
two-minute period during which the samples were exposed to air, which resulted in some
contamination of the deuterium-based material by H2O.
TABLE 4. Four types of experiments using different combinations of materials and gases,
along with the expectation of exothermic or endothermic reaction in Pd-loaded alumina powder.
Experiment number Material and gas Expected outcome
1 H-rich material & H2 gas no heat
2 H-rich material & D2 gas exothermic heat
3 D-rich material & D2 gas no heat
4 D-rich material & H2 gas endothermic het
At this point I hypothesized that the isotope effect demonstrated in a number of the gas-
loading experiments described in the Introduction was a manifestation of the H/D exchange
chemical reaction, where deuterium was introduced into material saturated with H2O and OH-
groups (experiment 2 in Table 4). As a result of the reversed H/D exchange an endothermic
reaction should be observed during experiment 4 in Table 4. Little or no heat should be seen in
experiments 1 and 3, where the material was prepared with the same isotope that was later
introduced into the apparatus in gaseous form.
Data from experiments 1 and 2 in Table 4 along with the reference data for the empty
vessel are shown in Figure VI - 1. All the curves are for the second pressurization, after the
palladium precursor was reduced in the presence of hydrogen to yield metallic palladium.
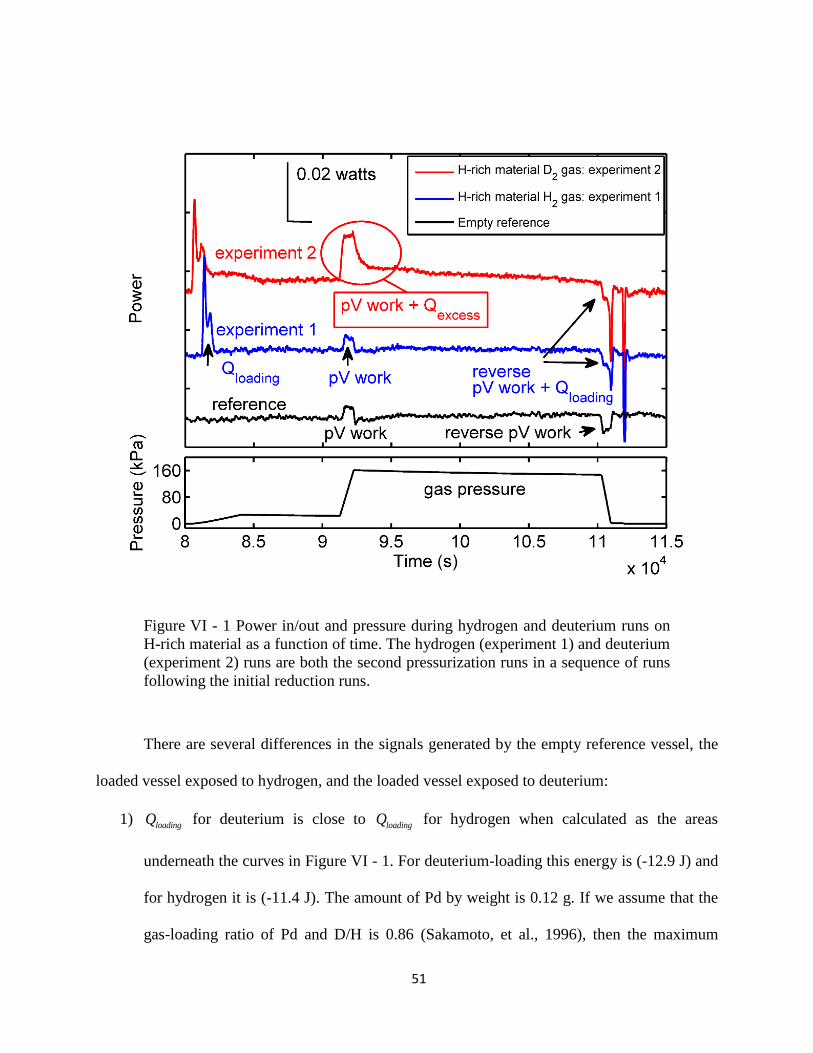
51
Figure VI - 1 Power in/out and pressure during hydrogen and deuterium runs on
H-rich material as a function of time. The hydrogen (experiment 1) and deuterium
(experiment 2) runs are both the second pressurization runs in a sequence of runs
following the initial reduction runs.
There are several differences in the signals generated by the empty reference vessel, the
loaded vessel exposed to hydrogen, and the loaded vessel exposed to deuterium:
1) loadingQ for deuterium is close to loadingQ for hydrogen when calculated as the areas
underneath the curves in Figure VI - 1. For deuterium-loading this energy is (-12.9 J) and
for hydrogen it is (-11.4 J). The amount of Pd by weight is 0.12 g. If we assume that the
gas-loading ratio of Pd and D/H is 0.86 (Sakamoto, et al., 1996), then the maximum
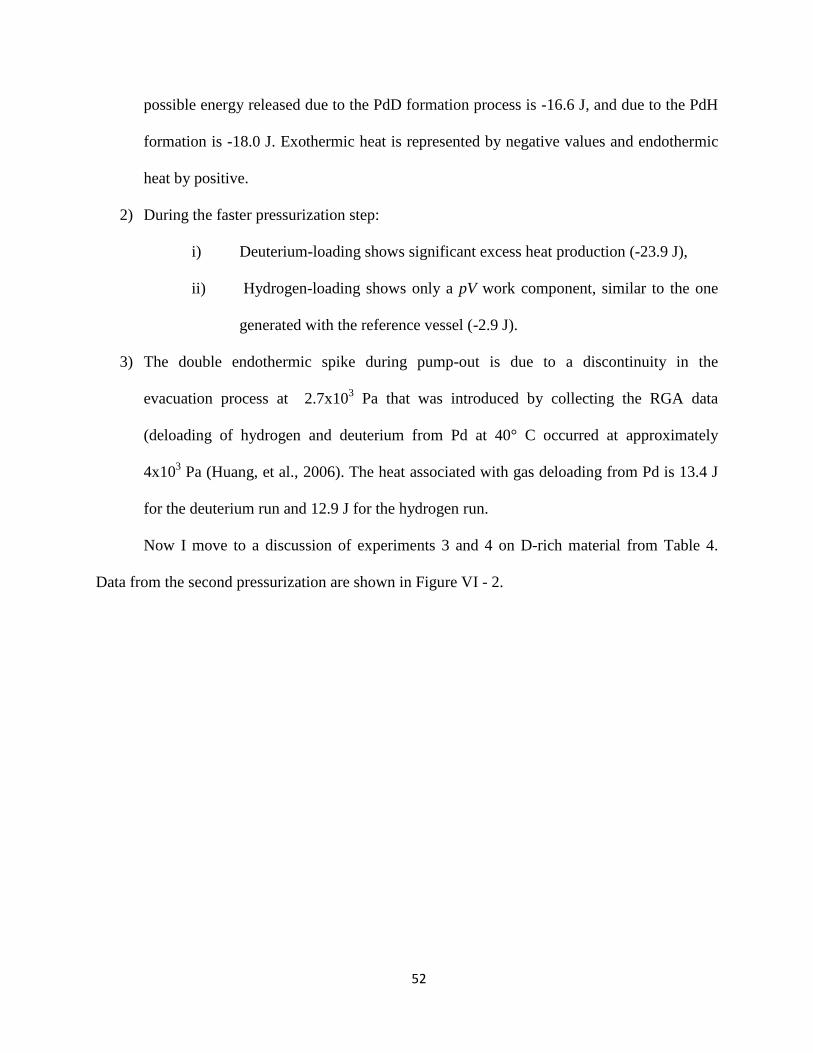
52
possible energy released due to the PdD formation process is -16.6 J, and due to the PdH
formation is -18.0 J. Exothermic heat is represented by negative values and endothermic
heat by positive.
2) During the faster pressurization step:
i) Deuterium-loading shows significant excess heat production (-23.9 J),
ii) Hydrogen-loading shows only a pV work component, similar to the one
generated with the reference vessel (-2.9 J).
3) The double endothermic spike during pump-out is due to a discontinuity in the
evacuation process at 2.7x10³ Pa that was introduced by collecting the RGA data
(deloading of hydrogen and deuterium from Pd at 40° C occurred at approximately
4x10³ Pa (Huang, et al., 2006). The heat associated with gas deloading from Pd is 13.4 J
for the deuterium run and 12.9 J for the hydrogen run.
Now I move to a discussion of experiments 3 and 4 on D-rich material from Table 4.
Data from the second pressurization are shown in Figure VI - 2.
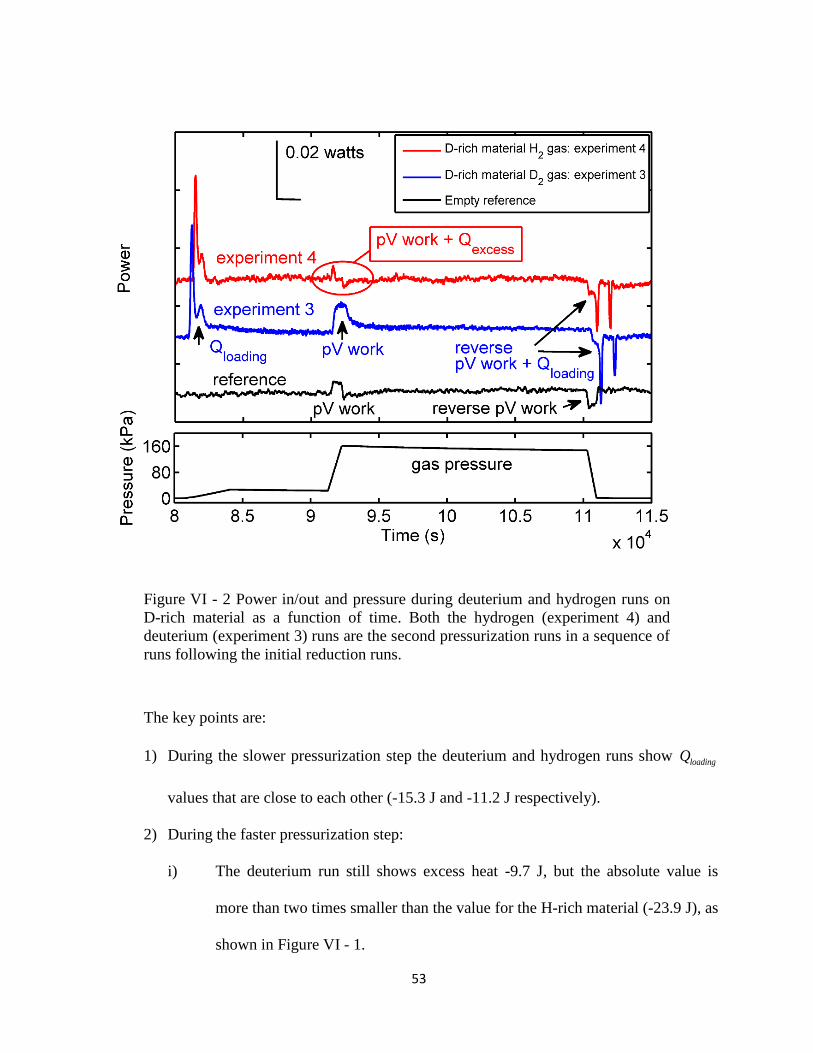
53
Figure VI - 2 Power in/out and pressure during deuterium and hydrogen runs on
D-rich material as a function of time. Both the hydrogen (experiment 4) and
deuterium (experiment 3) runs are the second pressurization runs in a sequence of
runs following the initial reduction runs.
The key points are:
1) During the slower pressurization step the deuterium and hydrogen runs show loadingQ
values that are close to each other (-15.3 J and -11.2 J respectively).
2) During the faster pressurization step:
i) The deuterium run still shows excess heat -9.7 J, but the absolute value is
more than two times smaller than the value for the H-rich material (-23.9 J), as
shown in Figure VI - 1.
54
ii) The hydrogen run shows endothermic heat during the faster pressurization
step 5.4 J. The plot does not show a large endothermic dip because the heat of
pressurization and the endothermic reaction heat are close in magnitude and
almost compensate for each other.
3) The double endothermic spike during pump-out is the same as discussed previously
(10.4 J for deuterium run and 8.2 J for hydrogen run).
Therefore, I have experimentally demonstrated a significant reduction of exothermic heat
in D-rich material in the presence of deuterium (experiment 3 from Table 4) as well as
endothermic heat production during the faster pressurization step (experiment 4 from Table 4).
B. Effect of depleting and replenishing of fuel
In a previous section I demonstrated that the material composition (whether fabricated
with H-rich or D-rich water) affects the sign of excessQ . Based on the concept of H/D exchange I
suggest that the fuel is of two types: it is either H2O and OH hydroxyl groups with its energy
content, D <0, or D2O and OD groups with its energy content, H >0 (subscript refers to the
reacting gas).
By using H-rich material and switching between deuterium and hydrogen gas I found that
fuels can be depleted or replenished within the material during repeated gas-loading cycles. The
quantitative data are shown in Figure VI - 3 for the faster pressurization step of three sets of gas-
loadings done with deuterium, hydrogen, and again with deuterium.
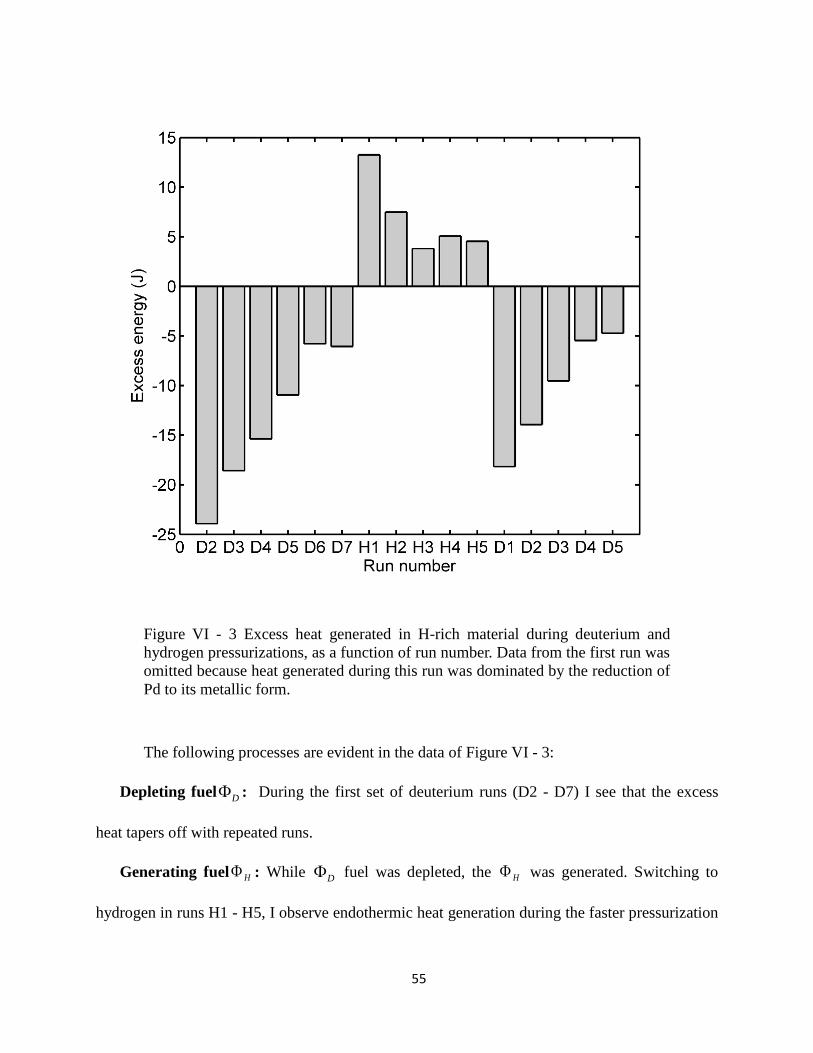
55
Figure VI - 3 Excess heat generated in H-rich material during deuterium and
hydrogen pressurizations, as a function of run number. Data from the first run was
omitted because heat generated during this run was dominated by the reduction of
Pd to its metallic form.
The following processes are evident in the data of Figure VI - 3:
Depleting fuel D : During the first set of deuterium runs (D2 - D7) I see that the excess
heat tapers off with repeated runs.
Generating fuel H : While D fuel was depleted, the H was generated. Switching to
hydrogen in runs H1 - H5, I observe endothermic heat generation during the faster pressurization
56
step. As the number of hydrogen runs increases, the amount of the endothermic heat decreases in
absolute value, indicating H fuel depletion.
Replenishing fuelD : After switching back to deuterium in runs D1 - D5 (second series),
the system is recharged with the fuel D that supports the exothermic reaction. Notice that the
excess heat levels recover only partially.
C. Process characterization
a) RGA data on H/D exchange
Residual gas analysis is an analytical technique used to identify the gaseous products
present in a vacuum. A residual gas analyzer (RGA) is a mass spectrometer of small physical
dimensions that can be connected directly to a vacuum system to analyze the gases inside the
vacuum chamber. A small fraction of the gas molecules are ionized inside the RGA, and the
resulting ions are separated, detected and measured according to their molecular masses. For
each molecular mass the RGA gives partial pressure of the component.
Both of my apparatuses were equipped with SRS RGA 200 units. RGA data was
collected during evacuation, first by discrete sampling every 3 min at 2.7x10³ Pa through a
capillary tube, and then every 5 min during pump-out when the pressure in the system was below
20 Pa.
The RGA data confirms the depleting and replenishing processes, as shown in Figures VI
- 4 (a) and (b). These data were obtained during the evacuation step for the experimental runs of
Figure VI - 3.
The processes evident in the data of Figure VI - 3 give rise to the following effects in the
RGA data of Figure VI - 4:
57
Depleting fuelD : From the first set of deuterium runs (D1 - D7) in Figure VI - 4 (a). I see
the depletion of H2O from the material. At the same time, exchanged hydrogen is released as a
result of this reaction, as shown in Figure VI - 4 (b).
Generating fuel H : The D2O concentration increases during runs D1 - D7 as H2O is
converted to D2O through H/D exchange. During the pump-out phase of each run only a fraction
of this D2O is removed, and so it builds up in the system.
Replenishing fuel D : The H2O concentration increases during runs H1 - H5 as D2O is
converted to H2O and releases exchanged deuterium, as shown in Figure VI - 4 (b). As in the
previous process only a fraction of the H2O is removed during the pump-out step, and so it builds
up in the system.
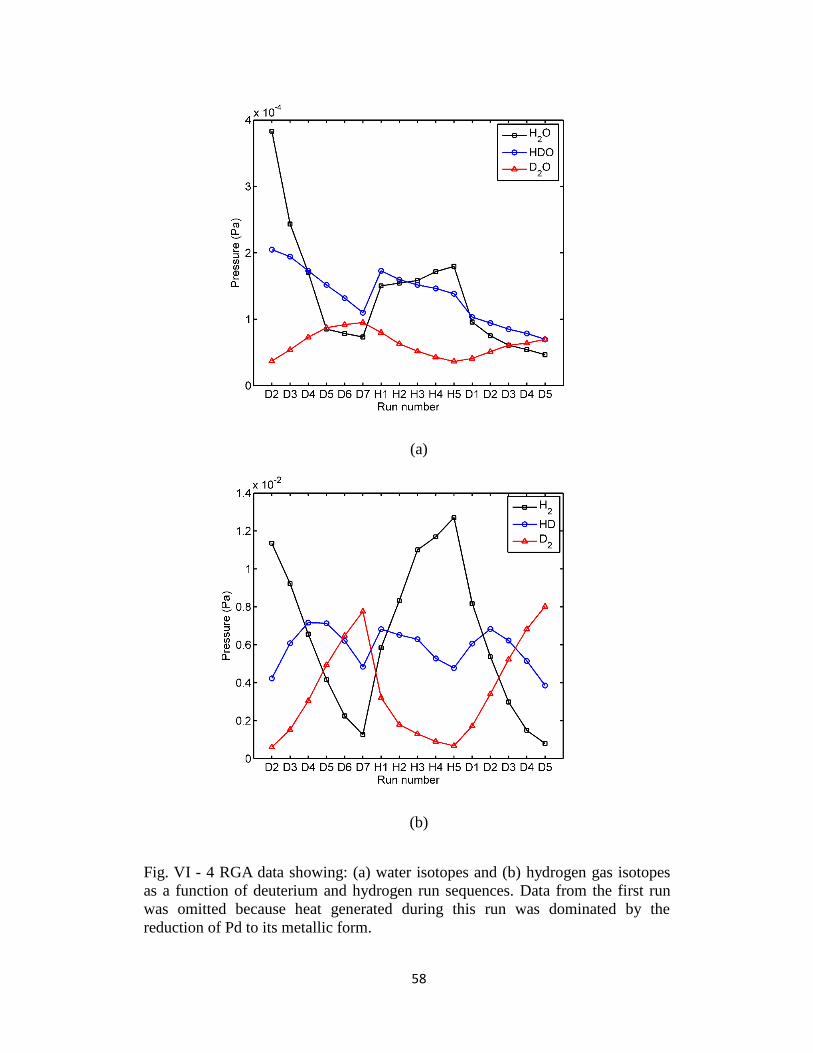
58
(a)
(b)
Fig. VI - 4 RGA data showing: (a) water isotopes and (b) hydrogen gas isotopes
as a function of deuterium and hydrogen run sequences. Data from the first run
was omitted because heat generated during this run was dominated by the
reduction of Pd to its metallic form.
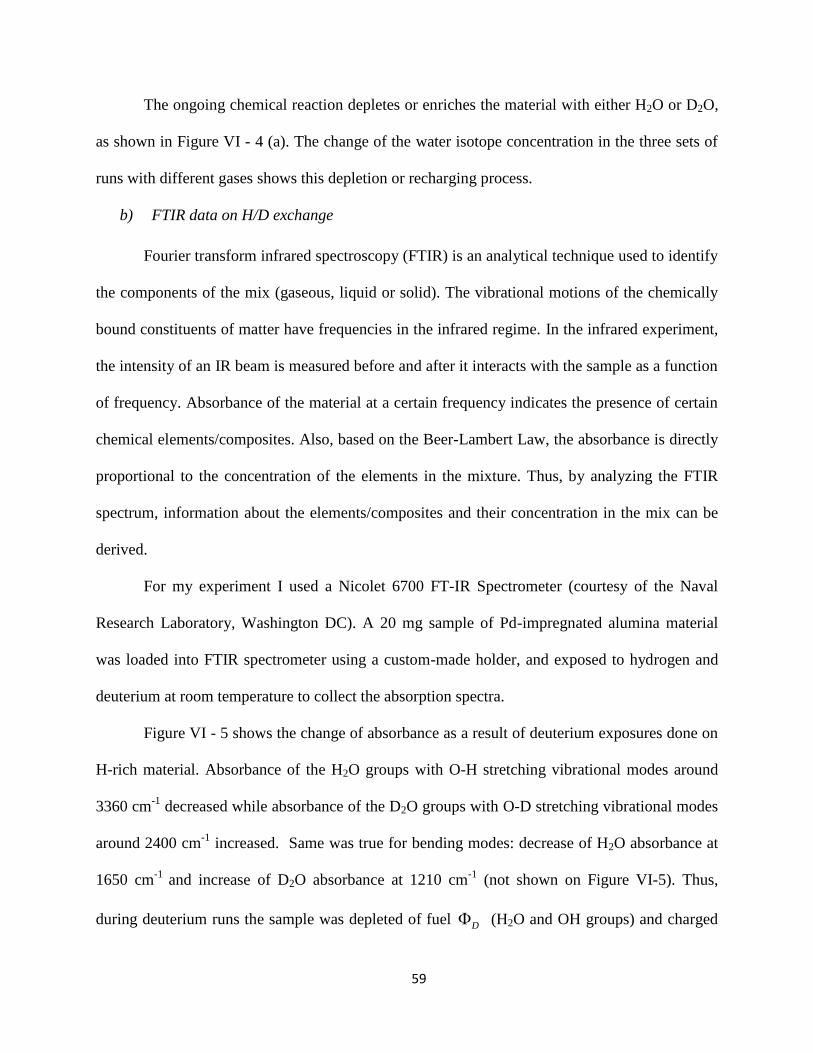
59
The ongoing chemical reaction depletes or enriches the material with either H2O or D2O,
as shown in Figure VI - 4 (a). The change of the water isotope concentration in the three sets of
runs with different gases shows this depletion or recharging process.
b) FTIR data on H/D exchange
Fourier transform infrared spectroscopy (FTIR) is an analytical technique used to identify
the components of the mix (gaseous, liquid or solid). The vibrational motions of the chemically
bound constituents of matter have frequencies in the infrared regime. In the infrared experiment,
the intensity of an IR beam is measured before and after it interacts with the sample as a function
of frequency. Absorbance of the material at a certain frequency indicates the presence of certain
chemical elements/composites. Also, based on the Beer-Lambert Law, the absorbance is directly
proportional to the concentration of the elements in the mixture. Thus, by analyzing the FTIR
spectrum, information about the elements/composites and their concentration in the mix can be
derived.
For my experiment I used a Nicolet 6700 FT-IR Spectrometer (courtesy of the Naval
Research Laboratory, Washington DC). A 20 mg sample of Pd-impregnated alumina material
was loaded into FTIR spectrometer using a custom-made holder, and exposed to hydrogen and
deuterium at room temperature to collect the absorption spectra.
Figure VI - 5 shows the change of absorbance as a result of deuterium exposures done on
H-rich material. Absorbance of the H2O groups with O-H stretching vibrational modes around
3360 cm-1
decreased while absorbance of the D2O groups with O-D stretching vibrational modes
around 2400 cm-1
increased. Same was true for bending modes: decrease of H2O absorbance at
1650 cm-1
and increase of D2O absorbance at 1210 cm-1
(not shown on Figure VI-5). Thus,
during deuterium runs the sample was depleted of fuel D (H2O and OH groups) and charged
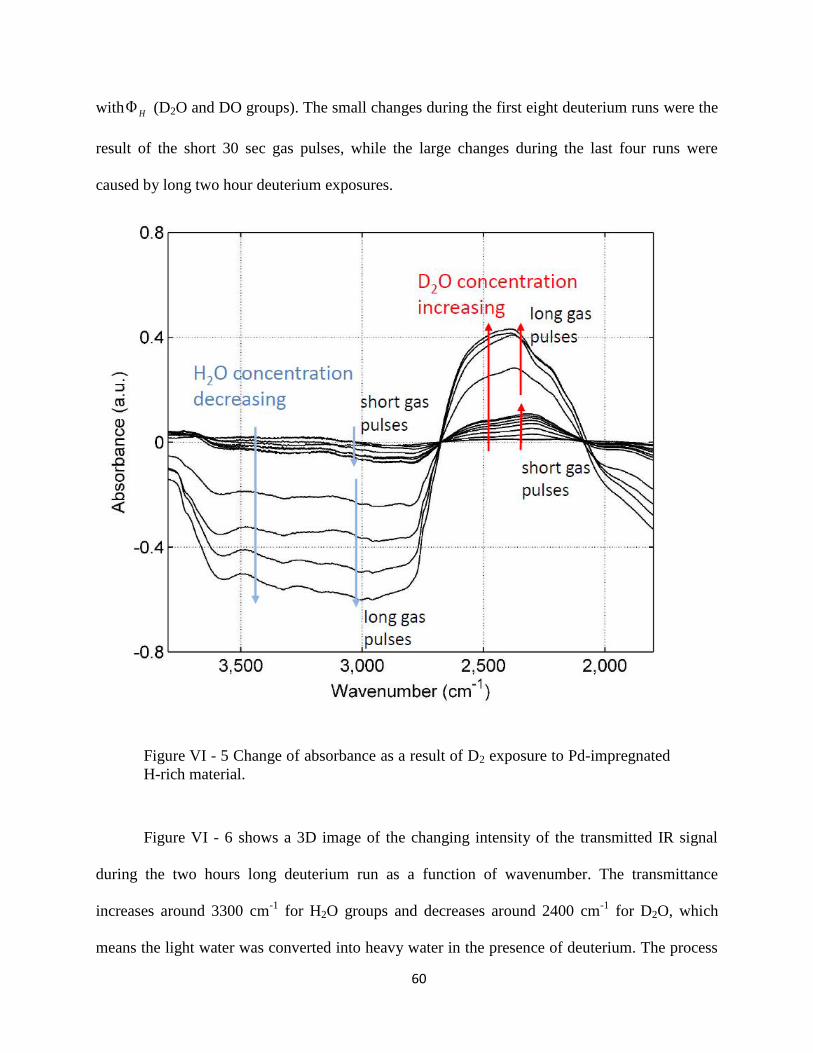
60
with H (D2O and DO groups). The small changes during the first eight deuterium runs were the
result of the short 30 sec gas pulses, while the large changes during the last four runs were
caused by long two hour deuterium exposures.
Figure VI - 5 Change of absorbance as a result of D2 exposure to Pd-impregnated
H-rich material.
Figure VI - 6 shows a 3D image of the changing intensity of the transmitted IR signal
during the two hours long deuterium run as a function of wavenumber. The transmittance
increases around 3300 cm-1
for H2O groups and decreases around 2400 cm-1
for D2O, which
means the light water was converted into heavy water in the presence of deuterium. The process
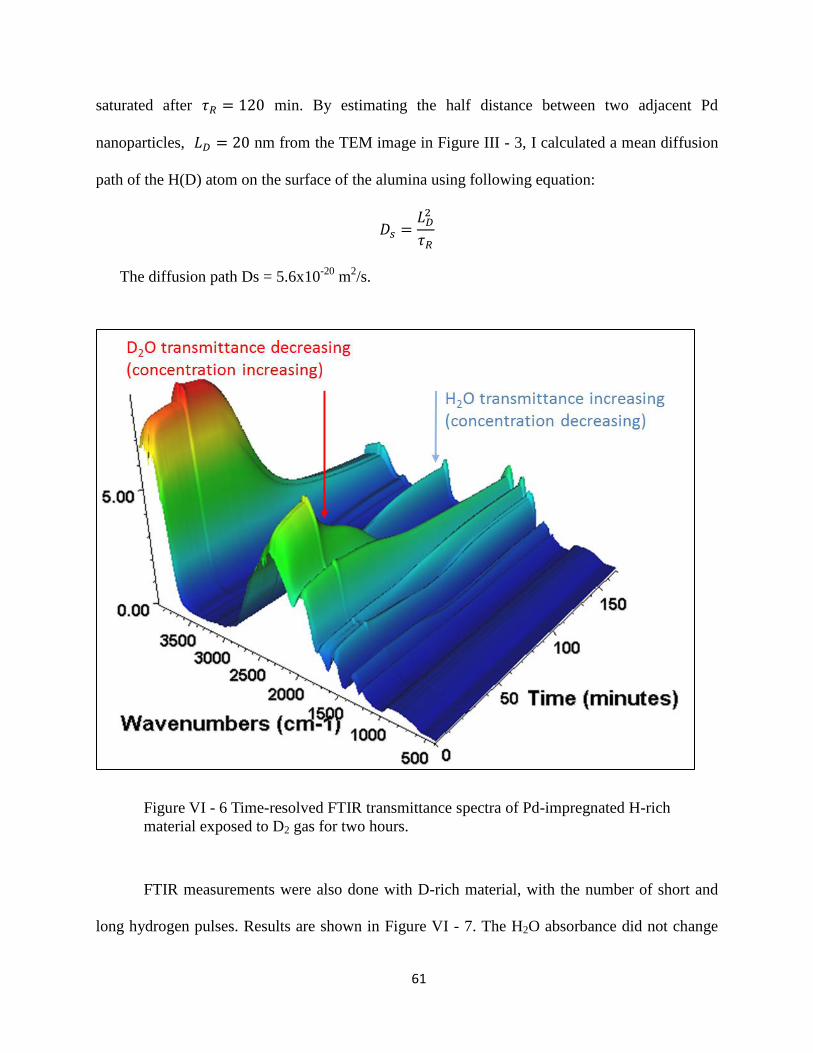
61
saturated after min. By estimating the half distance between two adjacent Pd
nanoparticles, nm from the TEM image in Figure III - 3, I calculated a mean diffusion
path of the H(D) atom on the surface of the alumina using following equation:
The diffusion path Ds = 5.6x10⁻²⁰
m2/s.
Figure VI - 6 Time-resolved FTIR transmittance spectra of Pd-impregnated H-rich
material exposed to D2 gas for two hours.
FTIR measurements were also done with D-rich material, with the number of short and
long hydrogen pulses. Results are shown in Figure VI - 7. The H2O absorbance did not change
62
much, possibly because the material was exposed to air and “contaminated” with protons during
the loading step. However, the D2O absorbance visibly decreased during the hydrogen
exposures, which indicated a depletion of the material from D2O - thus, the reverse H/D
exchange. The last two curves shown in red are the deuterium exposures that were done after ten
hydrogen runs to show that material was hydrogenated enough to start reacting with deuterium.
The reverse change of absorbance can be explained by the fuel generation process in the same
manner observed with RGA.
Figure VI - 7 Change of absorbance as a result of H2 exposures done on Pd-
impregnated D-rich material.
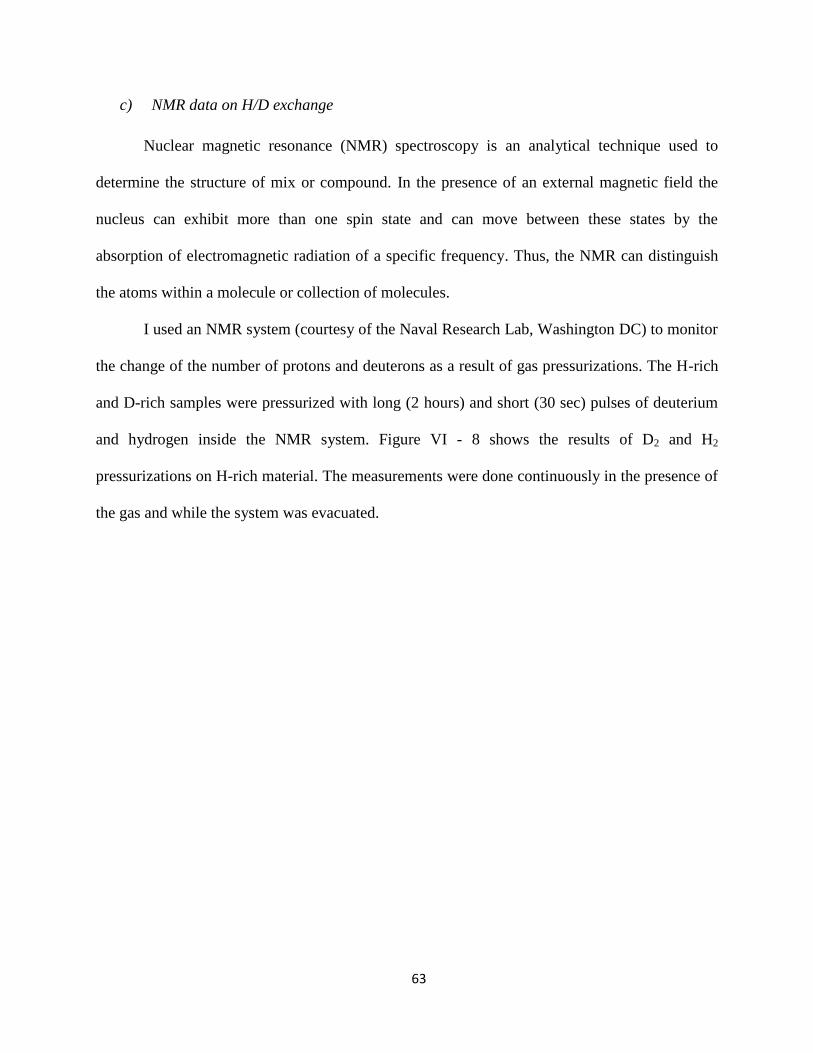
63
c) NMR data on H/D exchange
Nuclear magnetic resonance (NMR) spectroscopy is an analytical technique used to
determine the structure of mix or compound. In the presence of an external magnetic field the
nucleus can exhibit more than one spin state and can move between these states by the
absorption of electromagnetic radiation of a specific frequency. Thus, the NMR can distinguish
the atoms within a molecule or collection of molecules.
I used an NMR system (courtesy of the Naval Research Lab, Washington DC) to monitor
the change of the number of protons and deuterons as a result of gas pressurizations. The H-rich
and D-rich samples were pressurized with long (2 hours) and short (30 sec) pulses of deuterium
and hydrogen inside the NMR system. Figure VI - 8 shows the results of D2 and H2
pressurizations on H-rich material. The measurements were done continuously in the presence of
the gas and while the system was evacuated.
64
Figure VI - 8 NMR scan representing the change of protium and deuterium
concentration in Pd-impregnated H-rich material as a result of deuterium and
hydrogen exposures.
Five short deuterium pulses caused a slight upward shift in deuterium concentration
corresponding to downward shift in hydrogen. Three long two-hour deuterium runs resulted in
more pronounced shifts. During deuterium runs the sample was depleted of fuel D and charged
with H . Deuterium runs were followed by two hydrogen runs, which caused a change in
65
hydrogen and deuterium concentration again, but in the opposite direction now, indicating a
reverse H/D exchange.
Chapter VI conclusions
Several mechanisms are responsible for heat generation in Pd-loaded alumina material at
different stages of the gas-loading process. While two of them (heat of loading and heat
associated with the work of pressurization) are reversible, there is an additional source of excess
heat that can be either exothermic or endothermic.
I fabricated different batches of material rich in protium or deuterium constituents. Using
H-rich and D-rich material batches in combination with hydrogen and deuterium loading gases, I
was able to demonstrate both exothermic and endothermic heat generation. I associated the
particular water isotope provided to the system with a fuel, which engaged in an H/D exchange
chemical reaction. RGA, FTIR and NMR time-resolved measurements independently confirmed
the H/D exchange in H-rich and D-rich materials as well as the fuel depletion or generation.
66
CHAPTER VII
CONTROL OF HEAT GENERATION
In previous chapters I discussed the isotope dependence of heat generation in Pd-
impregnated alumina and showed that Pd nanoparticles catalyze H/D exchange chemical
reactions. One of the necessary reactants is a gas atom (deuterium or hydrogen), while the other
reactant is a particular water isotope trapped in the material due to its hydroscopic nature. I
called the water isotope fuel. This fuel can be supplied to the material in two ways: (1) the
material can be enriched with a particular water isotope during the fabrication, or (2) by
subsequent exposures to deuterium or hydrogen gas. The remaining question was to how to
quantify the contribution of the H/D exchange in the overall heat production? One approach
would be to look at the products of the reaction that occurred between the gas and the sample
inside the vessel. To make a quantitative analysis using this approach I would need to know how
much gas was supplied to the system, and the amount and type of gas and water isotopes that
were released due to the reaction. I could calculate the energy and then compare it to the
experimentally measured heat. However, there are certain obstructions associated with this
approach that can seriously affect the precision of the measurements. For example, any outgasing
of the stainless steel material that makes up the vessels and pipes would skew the analysis of the
water content. I took a different approach to avoid these kinds of errors associated with
measuring the reaction products and instead quantified the amount of fuel. In this chapter I
present an approach that allowed control of the amount of water absorbed in the material, while
measuring generated heat in order to quantify the contribution of the H/D exchange reaction
(Dmitriyeva, et al., 2012, Using bakeout to eliminate heat from H/D exchange during hydrogen
isotope loading of Pd-impregnated alumina powder).
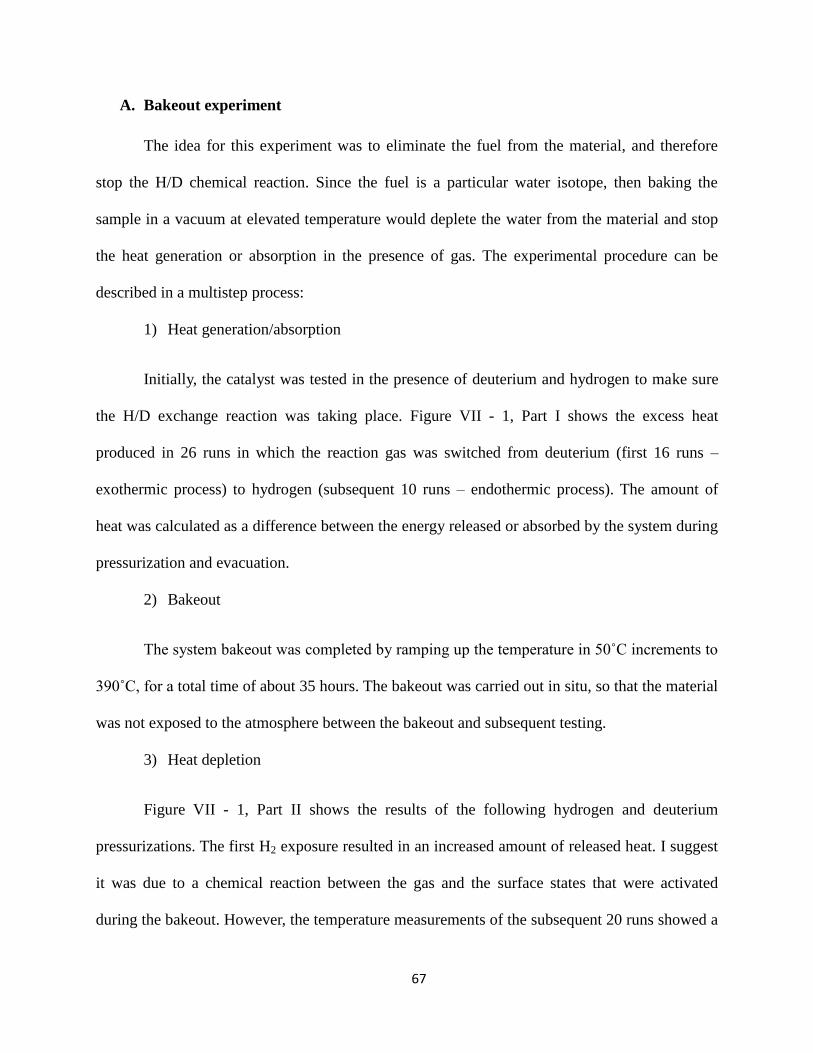
67
A. Bakeout experiment
The idea for this experiment was to eliminate the fuel from the material, and therefore
stop the H/D chemical reaction. Since the fuel is a particular water isotope, then baking the
sample in a vacuum at elevated temperature would deplete the water from the material and stop
the heat generation or absorption in the presence of gas. The experimental procedure can be
described in a multistep process:
1) Heat generation/absorption
Initially, the catalyst was tested in the presence of deuterium and hydrogen to make sure
the H/D exchange reaction was taking place. Figure VII - 1, Part I shows the excess heat
produced in 26 runs in which the reaction gas was switched from deuterium (first 16 runs –
exothermic process) to hydrogen (subsequent 10 runs – endothermic process). The amount of
heat was calculated as a difference between the energy released or absorbed by the system during
pressurization and evacuation.
2) Bakeout
The system bakeout was completed by ramping up the temperature in 50˚C increments to
390˚C, for a total time of about 35 hours. The bakeout was carried out in situ, so that the material
was not exposed to the atmosphere between the bakeout and subsequent testing.
3) Heat depletion
Figure VII - 1, Part II shows the results of the following hydrogen and deuterium
pressurizations. The first H2 exposure resulted in an increased amount of released heat. I suggest
it was due to a chemical reaction between the gas and the surface states that were activated
during the bakeout. However, the temperature measurements of the subsequent 20 runs showed a
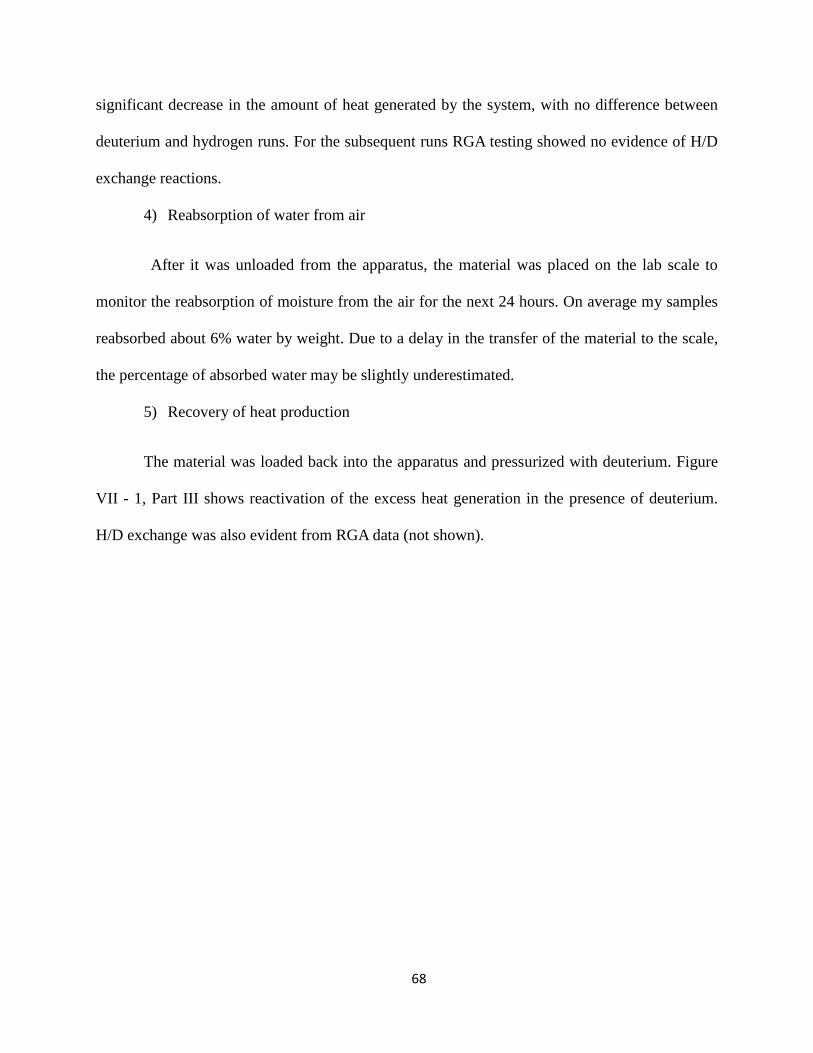
68
significant decrease in the amount of heat generated by the system, with no difference between
deuterium and hydrogen runs. For the subsequent runs RGA testing showed no evidence of H/D
exchange reactions.
4) Reabsorption of water from air
After it was unloaded from the apparatus, the material was placed on the lab scale to
monitor the reabsorption of moisture from the air for the next 24 hours. On average my samples
reabsorbed about 6% water by weight. Due to a delay in the transfer of the material to the scale,
the percentage of absorbed water may be slightly underestimated.
5) Recovery of heat production
The material was loaded back into the apparatus and pressurized with deuterium. Figure
VII - 1, Part III shows reactivation of the excess heat generation in the presence of deuterium.
H/D exchange was also evident from RGA data (not shown).
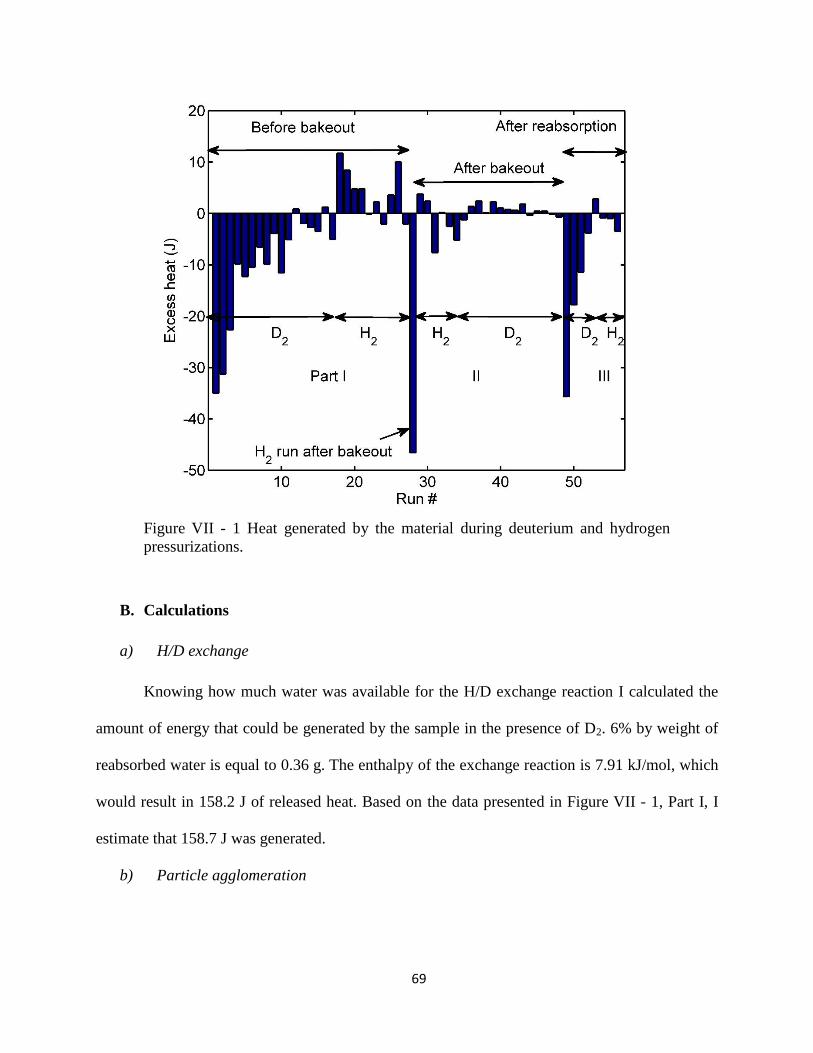
69
Figure VII - 1 Heat generated by the material during deuterium and hydrogen
pressurizations.
B. Calculations
a) H/D exchange
Knowing how much water was available for the H/D exchange reaction I calculated the
amount of energy that could be generated by the sample in the presence of D2. 6% by weight of
reabsorbed water is equal to 0.36 g. The enthalpy of the exchange reaction is 7.91 kJ/mol, which
would result in 158.2 J of released heat. Based on the data presented in Figure VII - 1, Part I, I
estimate that 158.7 J was generated.
b) Particle agglomeration
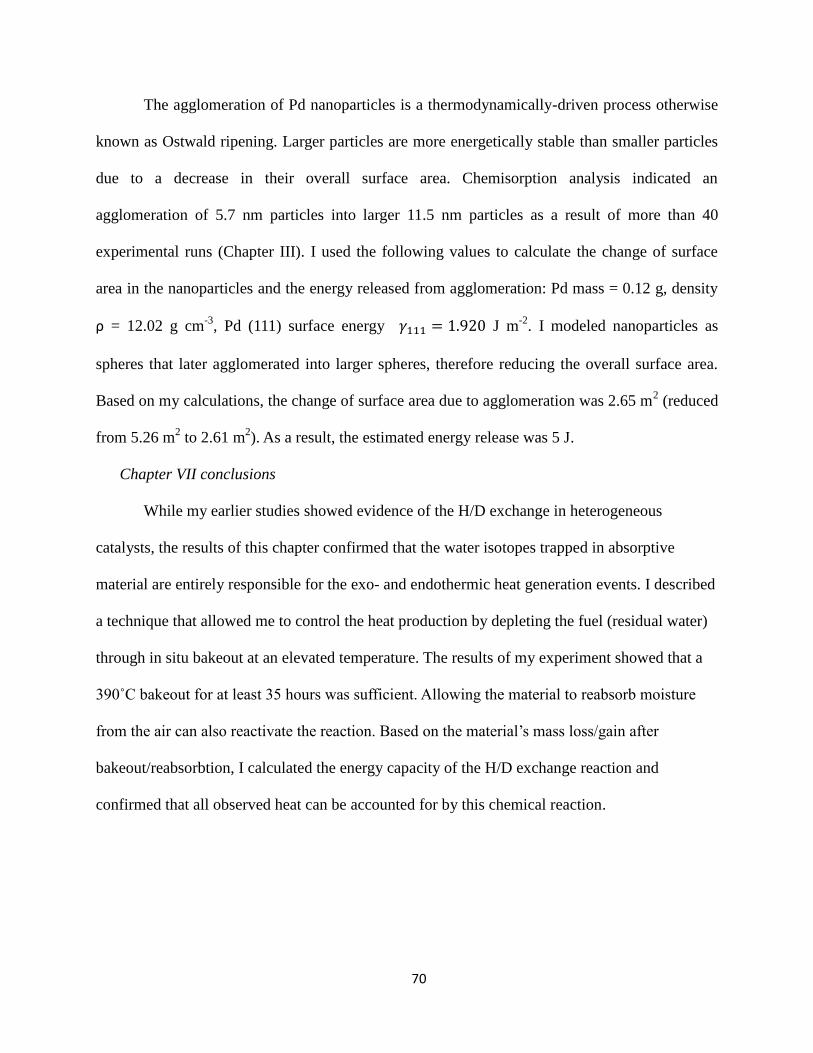
70
The agglomeration of Pd nanoparticles is a thermodynamically-driven process otherwise
known as Ostwald ripening. Larger particles are more energetically stable than smaller particles
due to a decrease in their overall surface area. Chemisorption analysis indicated an
agglomeration of 5.7 nm particles into larger 11.5 nm particles as a result of more than 40
experimental runs (Chapter III). I used the following values to calculate the change of surface
area in the nanoparticles and the energy released from agglomeration: Pd mass = 0.12 g, density
ρ = 12.02 g cm-3
, Pd (111) surface energy J m-2
. I modeled nanoparticles as
spheres that later agglomerated into larger spheres, therefore reducing the overall surface area.
Based on my calculations, the change of surface area due to agglomeration was 2.65 m2 (reduced
from 5.26 m2 to 2.61 m
2). As a result, the estimated energy release was 5 J.
Chapter VII conclusions
While my earlier studies showed evidence of the H/D exchange in heterogeneous
catalysts, the results of this chapter confirmed that the water isotopes trapped in absorptive
material are entirely responsible for the exo- and endothermic heat generation events. I described
a technique that allowed me to control the heat production by depleting the fuel (residual water)
through in situ bakeout at an elevated temperature. The results of my experiment showed that a
390˚C bakeout for at least 35 hours was sufficient. Allowing the material to reabsorb moisture
from the air can also reactivate the reaction. Based on the material’s mass loss/gain after
bakeout/reabsorbtion, I calculated the energy capacity of the H/D exchange reaction and
confirmed that all observed heat can be accounted for by this chemical reaction.
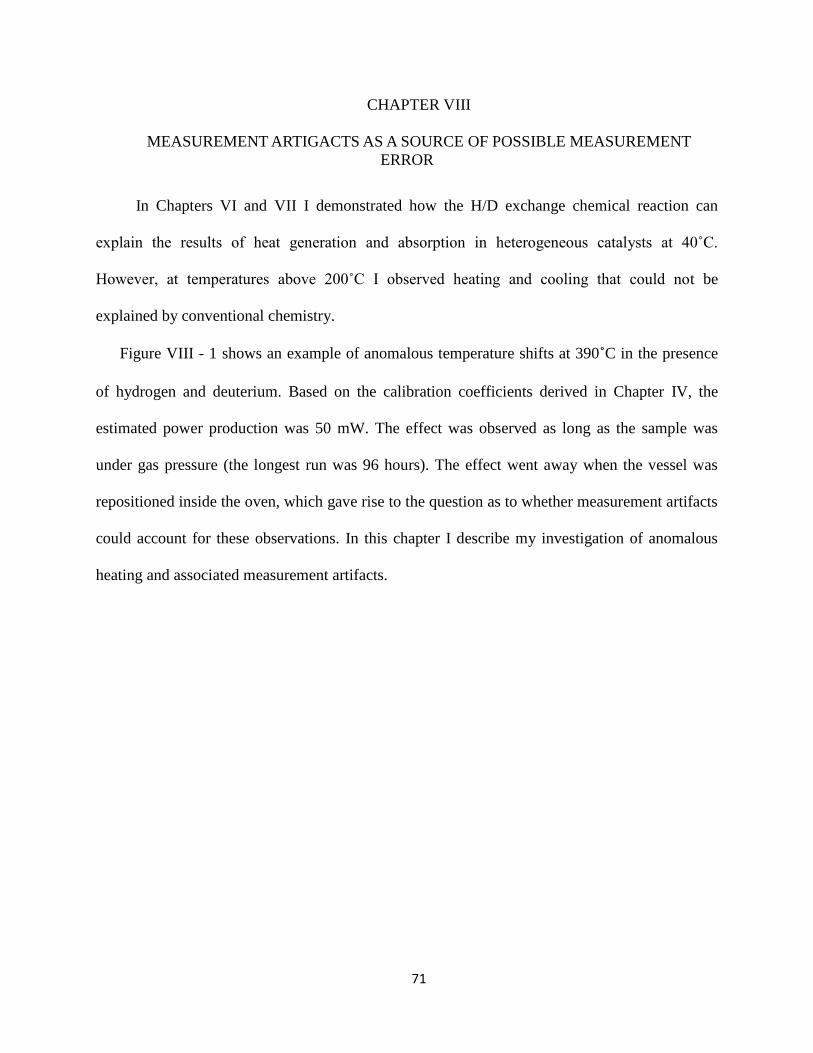
71
CHAPTER VIII
MEASUREMENT ARTIGACTS AS A SOURCE OF POSSIBLE MEASUREMENT
ERROR
In Chapters VI and VII I demonstrated how the H/D exchange chemical reaction can
explain the results of heat generation and absorption in heterogeneous catalysts at 40˚C.
However, at temperatures above 200˚C I observed heating and cooling that could not be
explained by conventional chemistry.
Figure VIII - 1 shows an example of anomalous temperature shifts at 390˚C in the presence
of hydrogen and deuterium. Based on the calibration coefficients derived in Chapter IV, the
estimated power production was 50 mW. The effect was observed as long as the sample was
under gas pressure (the longest run was 96 hours). The effect went away when the vessel was
repositioned inside the oven, which gave rise to the question as to whether measurement artifacts
could account for these observations. In this chapter I describe my investigation of anomalous
heating and associated measurement artifacts.
72
Figure VIII - 1 Temperature changes due to hydrogen and deuterium
pressurizations done on material at 390˚C. There is a visible temperature baseline
shift, which corresponds to 50mW of apparent excess power generated inside the
vessel. The baseline shift is similar for both gases.
A. Hypothesis
The experiment was conducted in an isothermal oven. This is a high precision temperature
control oven, with temperature variation kept within 10 mK. The sample vessel inside the oven
went through gas pressurization/depressurization cycles to detect a temperature change due to the
gas-loading process. The assumption in gas-loading experiments is that heat produced under gas
pressure is an indication of a reaction inside the vessel. This is a valid assumption as long as a
stable temperature baseline is established and temperature is uniform across the oven. However,
73
at an elevated temperature this uniformity is broken due to location-dependent variations in hot
air flow from the oven heater. The effect becomes more noticeable as the temperature setting is
raised. The variation can be a result of a partial blocking of hot air flow by plumbing and wiring
associated with the vacuum system placed inside the oven. Local hot and cold spots are created
as a result of this lack of uniformity. Because the stainless steel vessel is a poor heat conductor
when it is evacuated, such hot and cold spots couple poorly to the temperature probe installed
inside the vessel. However, when the vessel is pressurized, the presence of gas drastically
changes the heat conduction inside it and causes the probe to couple more efficiently to the hot
or cold spots in the oven than when under vacuum. This results in channeling of heat to or from
the oven environment. This channeling effect can artificially shift the measurement baseline up
or down, which can be mistaken for anomalous heating or anomalous cooling.
To test this hypothesis I artificially created and enhanced the hot and cold spot effect by
placing a local heating or cooling element on the surface of the vessel that would later be
pressurized with hydrogen, deuterium, helium, or argon. If this hypothesis is correct, the
measurement baseline would shift upwards in the presence of the hot spot (dissipative resistor)
when the vacuum system was pressurized, and in the presence of the cold spot (Peltier element)
it would shift downwards. Moreover, the difference in the heat conduction coefficients of
supplied gases would affect the magnitude of the baseline shift. While hydrogen, deuterium and
helium have similar thermal conduction coefficients, argon’s thermal conductivity is ten times
smaller. If my assumption was correct, an argon run would show a smaller baseline shift. The
presence of material inside the vessel should also affect the conduction characteristics of the
vacuum system, and thus the magnitude of a baseline shift. When evacuated, a loose powdered
material is a poor heat conductor due to the spacing between the particles. When under pressure,
74
however, the gas establishes a thermally conductive channel between particles. I expected the
effect to be the result of a combination of the different factors such as the powder’s packing
density and the thermal conductivity of the sample.
B. Temperature gradient emulation
The hot spot was formed by placing a 150 Ω resistor on the surface of a vessel containing
6 g of Pd-impregnated alumina powder. Figure VIII - 2 (a) shows the view inside the oven, with
the resistor attached on the surface of the vessel.
The oven was kept at 100˚C, and 1 W was dissipated in the resistor. In Figure VIII - 3
plot (a) shows the results of the gas pressurizations carried out in the absence of an artificially
created thermal gradient. When no power was dissipated through the resistor the only
temperature changes during pressurization cycles were due to absorption/desorption of the
hydrogen isotopes in the Pd and the gas compression/expansion. Since neither helium nor argon
is absorbed in Pd, the runs with those gases showed only temperature change associated with gas
compression/expansion. However, the picture changed drastically when I powered the resistor.
Figure VIII - 3 plot (b) shows a visible baseline shift whenever the vacuum system was
pressurized. The baseline shift was similar for the deuterium, hydrogen and helium runs and
different for argon.
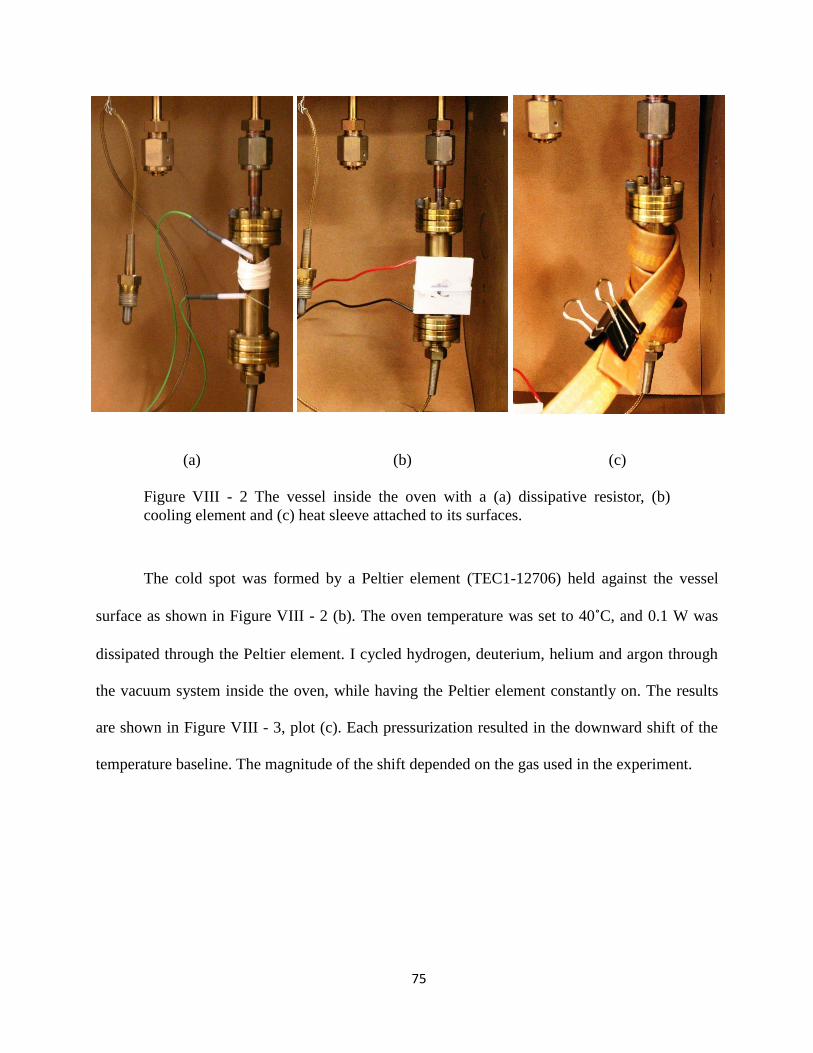
75
(a) (b) (c)
Figure VIII - 2 The vessel inside the oven with a (a) dissipative resistor, (b)
cooling element and (c) heat sleeve attached to its surfaces.
The cold spot was formed by a Peltier element (TEC1-12706) held against the vessel
surface as shown in Figure VIII - 2 (b). The oven temperature was set to 40˚C, and 0.1 W was
dissipated through the Peltier element. I cycled hydrogen, deuterium, helium and argon through
the vacuum system inside the oven, while having the Peltier element constantly on. The results
are shown in Figure VIII - 3, plot (c). Each pressurization resulted in the downward shift of the
temperature baseline. The magnitude of the shift depended on the gas used in the experiment.
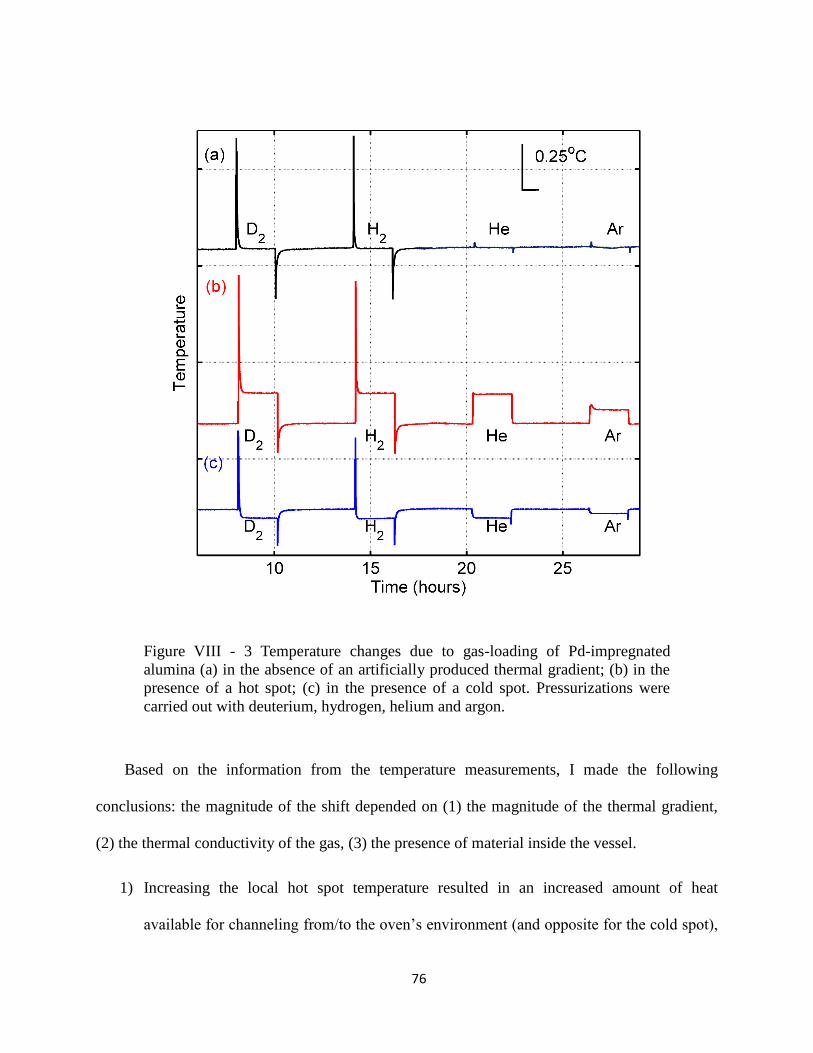
76
Figure VIII - 3 Temperature changes due to gas-loading of Pd-impregnated
alumina (a) in the absence of an artificially produced thermal gradient; (b) in the
presence of a hot spot; (c) in the presence of a cold spot. Pressurizations were
carried out with deuterium, hydrogen, helium and argon.
Based on the information from the temperature measurements, I made the following
conclusions: the magnitude of the shift depended on (1) the magnitude of the thermal gradient,
(2) the thermal conductivity of the gas, (3) the presence of material inside the vessel.
1) Increasing the local hot spot temperature resulted in an increased amount of heat
available for channeling from/to the oven’s environment (and opposite for the cold spot),
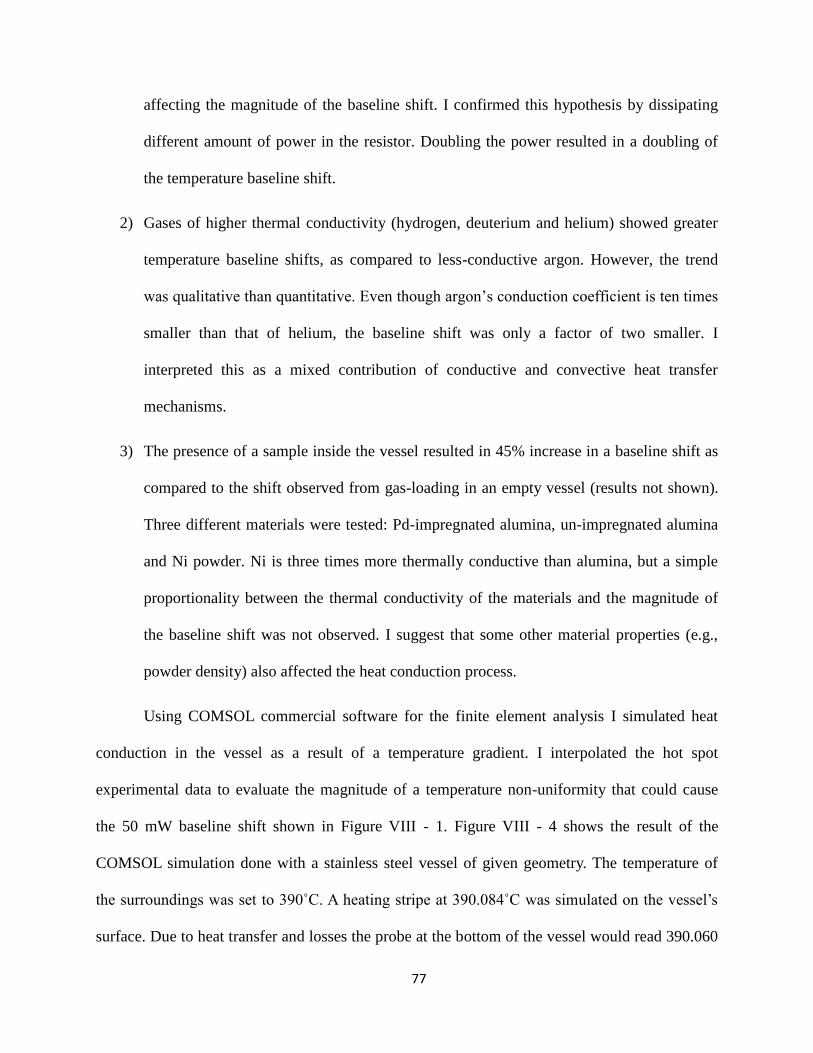
77
affecting the magnitude of the baseline shift. I confirmed this hypothesis by dissipating
different amount of power in the resistor. Doubling the power resulted in a doubling of
the temperature baseline shift.
2) Gases of higher thermal conductivity (hydrogen, deuterium and helium) showed greater
temperature baseline shifts, as compared to less-conductive argon. However, the trend
was qualitative than quantitative. Even though argon’s conduction coefficient is ten times
smaller than that of helium, the baseline shift was only a factor of two smaller. I
interpreted this as a mixed contribution of conductive and convective heat transfer
mechanisms.
3) The presence of a sample inside the vessel resulted in 45% increase in a baseline shift as
compared to the shift observed from gas-loading in an empty vessel (results not shown).
Three different materials were tested: Pd-impregnated alumina, un-impregnated alumina
and Ni powder. Ni is three times more thermally conductive than alumina, but a simple
proportionality between the thermal conductivity of the materials and the magnitude of
the baseline shift was not observed. I suggest that some other material properties (e.g.,
powder density) also affected the heat conduction process.
Using COMSOL commercial software for the finite element analysis I simulated heat
conduction in the vessel as a result of a temperature gradient. I interpolated the hot spot
experimental data to evaluate the magnitude of a temperature non-uniformity that could cause
the 50 mW baseline shift shown in Figure VIII - 1. Figure VIII - 4 shows the result of the
COMSOL simulation done with a stainless steel vessel of given geometry. The temperature of
the surroundings was set to 390˚C. A heating stripe at 390.084˚C was simulated on the vessel’s
surface. Due to heat transfer and losses the probe at the bottom of the vessel would read 390.060
78
˚C. Based on the simulations a 0.5 K/m temperature gradient would result in 50 mW of apparent
heating under the gas pressure. I did not simulate the gas flow or the change of the heat transfer
inside the vessel due to the presence of the gas, but rather used the data from the hot and cold
spot experiments to scale the effect. More accurate approach would be simulating pressurization
of the system in the presence of the temperature gradient by linking the heat transfer to the fluid
dynamics of the gas. Such direct simulations of the measurement artifacts including convection
of the gas inside the vessel can be done using the CFD COMSOL Module and may be a subject
of a future work.
(a)
(b)
Figure VIII - 4 COMSOL simulations of the temperature gradient as a result of
the local heating around the neck of the vessel. (a) 3D simulation of the
temperature gradient in the stainless steel vessel; (b) the temperature gradient in
the vessel along z direction.
In addition, I experimented with a heat sleeve (shown in Figure VIII - 2 [c]) that
sometimes is used for LENR gas-loading experiments at elevated temperatures. I supplied 37 W
of AC power to the heat sleeve. The heat sleeve created a temperature gradient across the
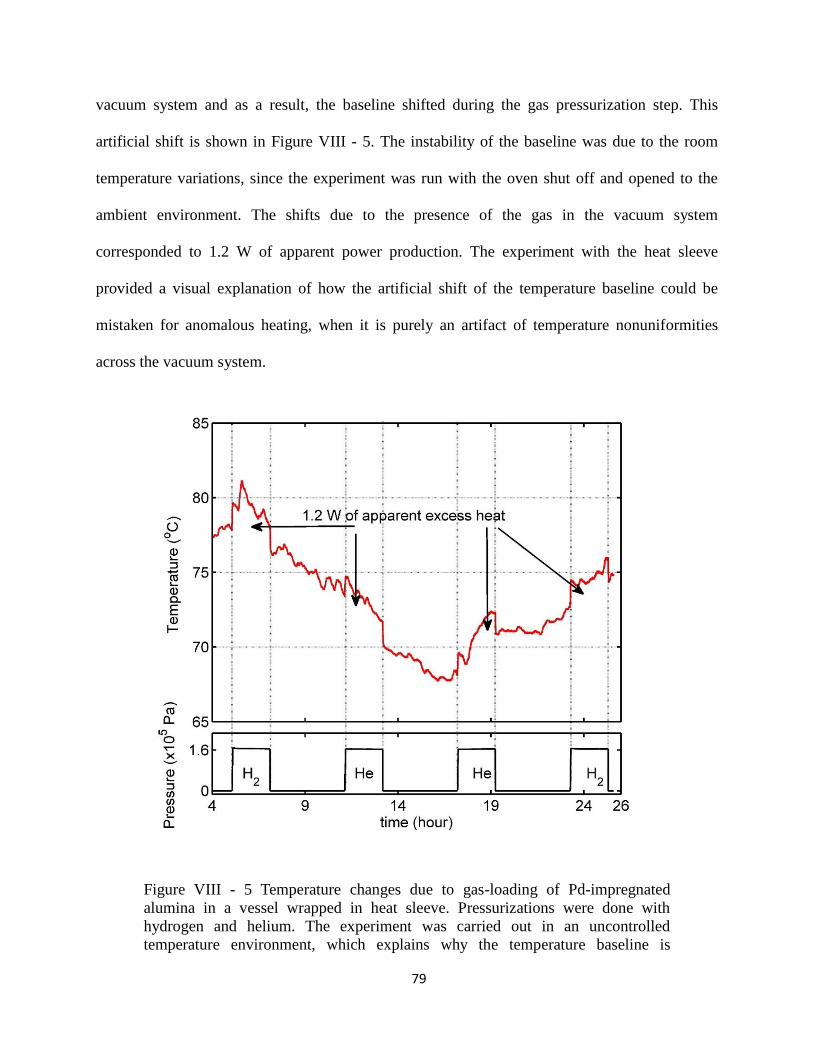
79
vacuum system and as a result, the baseline shifted during the gas pressurization step. This
artificial shift is shown in Figure VIII - 5. The instability of the baseline was due to the room
temperature variations, since the experiment was run with the oven shut off and opened to the
ambient environment. The shifts due to the presence of the gas in the vacuum system
corresponded to 1.2 W of apparent power production. The experiment with the heat sleeve
provided a visual explanation of how the artificial shift of the temperature baseline could be
mistaken for anomalous heating, when it is purely an artifact of temperature nonuniformities
across the vacuum system.
Figure VIII - 5 Temperature changes due to gas-loading of Pd-impregnated
alumina in a vessel wrapped in heat sleeve. Pressurizations were done with
hydrogen and helium. The experiment was carried out in an uncontrolled
temperature environment, which explains why the temperature baseline is
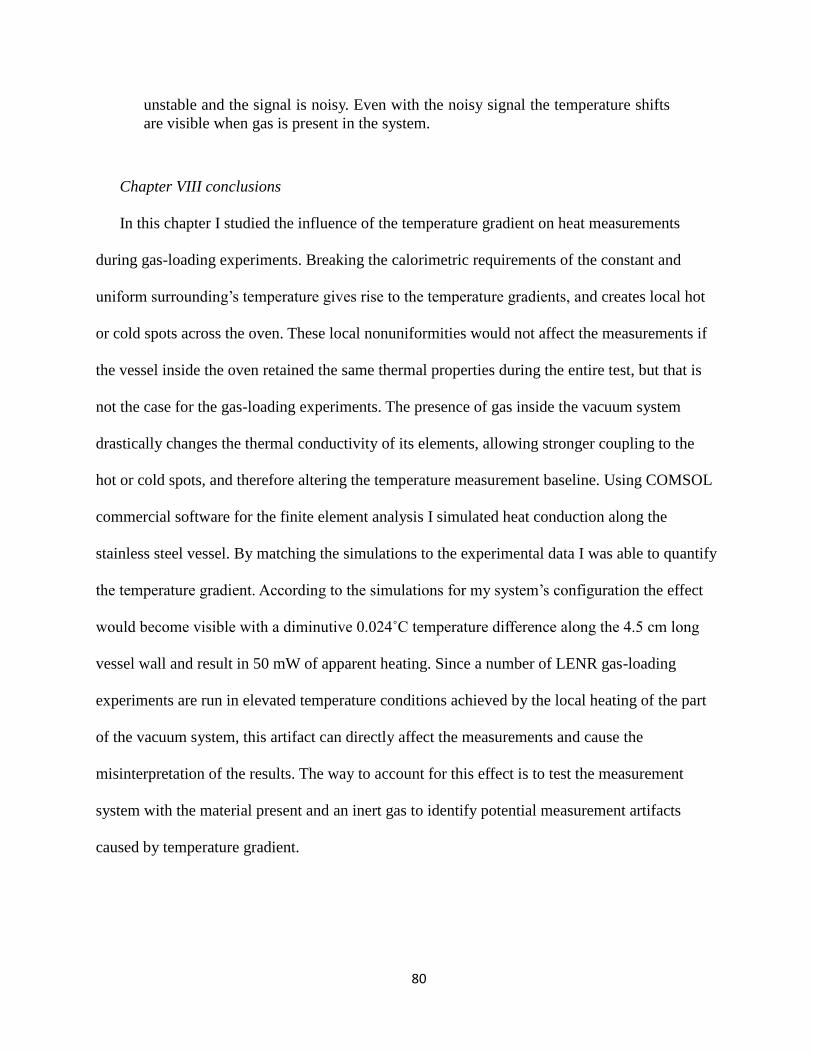
80
unstable and the signal is noisy. Even with the noisy signal the temperature shifts
are visible when gas is present in the system.
Chapter VIII conclusions
In this chapter I studied the influence of the temperature gradient on heat measurements
during gas-loading experiments. Breaking the calorimetric requirements of the constant and
uniform surrounding’s temperature gives rise to the temperature gradients, and creates local hot
or cold spots across the oven. These local nonuniformities would not affect the measurements if
the vessel inside the oven retained the same thermal properties during the entire test, but that is
not the case for the gas-loading experiments. The presence of gas inside the vacuum system
drastically changes the thermal conductivity of its elements, allowing stronger coupling to the
hot or cold spots, and therefore altering the temperature measurement baseline. Using COMSOL
commercial software for the finite element analysis I simulated heat conduction along the
stainless steel vessel. By matching the simulations to the experimental data I was able to quantify
the temperature gradient. According to the simulations for my system’s configuration the effect
would become visible with a diminutive 0.024˚C temperature difference along the 4.5 cm long
vessel wall and result in 50 mW of apparent heating. Since a number of LENR gas-loading
experiments are run in elevated temperature conditions achieved by the local heating of the part
of the vacuum system, this artifact can directly affect the measurements and cause the
misinterpretation of the results. The way to account for this effect is to test the measurement
system with the material present and an inert gas to identify potential measurement artifacts
caused by temperature gradient.
81
CHAPTER IX
APPLYING H/D EXCHANGE THEORY TO ELECTROLYTIC EXPERIMENTS
In Chapters V-VII I discussed the mechanism of H/D exchange that involves hydrogen
and water isotopes and can explain heat generation events in gas-loading experiments. The
purpose of this study was to see if the same H/D exchange mechanism can explain excess heat
production observed in electrochemical experiments.
I based my calculations on the data provided privately by Professor John Dash’s group at
Portland State University.
The “closed cell” system schematic is presented in Figure IX - 1. In this setup the cell
supposed to be isolated from the environment so that no products can escape the system. For this
purpose Pt/Al2O3 pellets were used as a catalyst to recombine H2 (or D2) and O2 gases (products
of the electrolysis) into water.
The cell used by the group was not a calorimetric setup. Instead, they used a two-cell
system where the experimental cell contained a titanium cathode and a platinum anode, while the
control cell contained a platinum cathode and a platinum anode. Each electrode was crimped to
a platinum wire. Despite the presence of the recombiner both cells lost some mass. The
composition of the lost mass was unknown. It could have been water vapor due to electrolyte
evaporation at elevated temperatures or it could have been H2 (or D2) and O2 gases escaping
before they recombined. The experimental cell was calibrated using the control where both the
cathode and anode were made of inert platinum and no other processes except conventional
calorimetric reactions were expected. The experimental cell showed the anomalous heat
generation, and the goal of the exercise was to look at the possible chemical reactions that could
account for this excess heat.
82
Figure IX - 1 The electrochemical cell. The electrolytic solution consists of 0.54M
H2SO4 in D2O. Positively charged cations travel towards the negatively charged
cathode, where the reduction reaction occurs [electrons (e−), from the cathode
being given to hydrogen (or deuterium) cations to form H2 (or D2) gas].
Negatively charged anions travel towards the positively charged anode where an
oxidation reaction occurs, generating oxygen gas and giving electrons to the
anode to complete the circuit. In the presence of a catalyzer (recombiner), H2 (or
D2) reacts with O2 to form water and returns back to the solution.
The cathode and anode in the experimental cell were submerged into a 130 ml solution of
0.54 M sulfuric acid in heavy water (0.07 mol of H2SO4 in 6.93 mol of D2O). The experimental
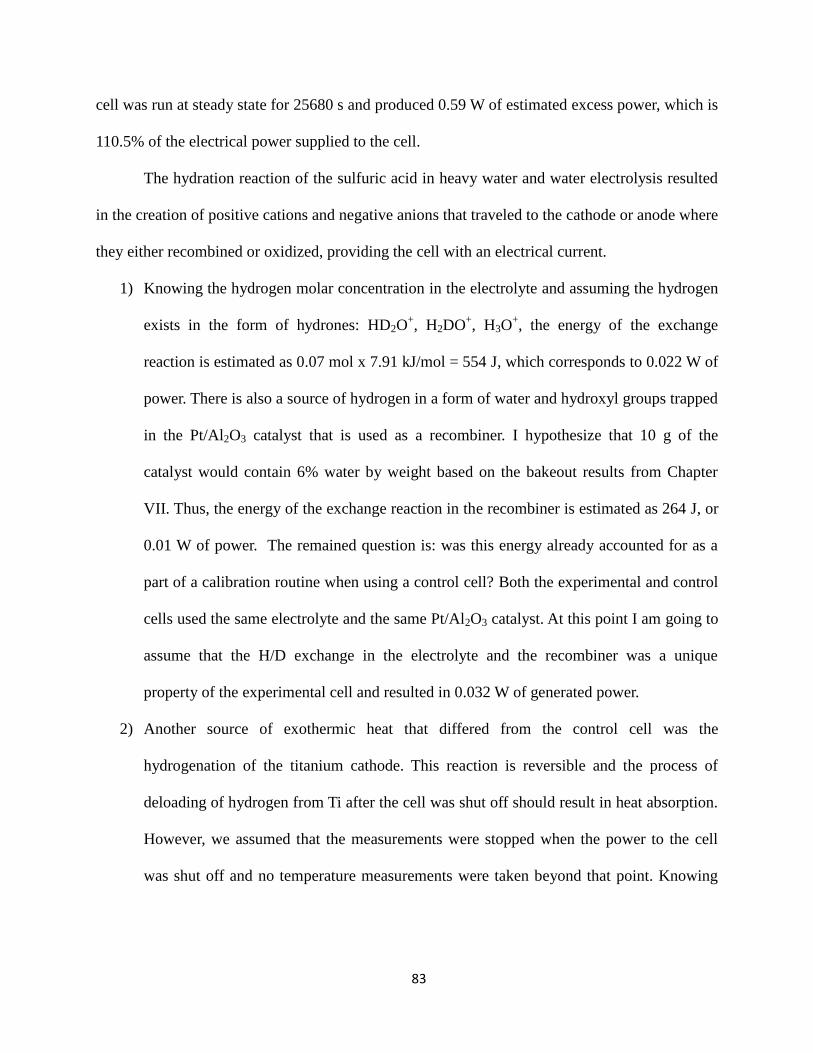
83
cell was run at steady state for 25680 s and produced 0.59 W of estimated excess power, which is
110.5% of the electrical power supplied to the cell.
The hydration reaction of the sulfuric acid in heavy water and water electrolysis resulted
in the creation of positive cations and negative anions that traveled to the cathode or anode where
they either recombined or oxidized, providing the cell with an electrical current.
1) Knowing the hydrogen molar concentration in the electrolyte and assuming the hydrogen
exists in the form of hydrones: HD2O+, H2DO
+, H3O
+, the energy of the exchange
reaction is estimated as 0.07 mol x 7.91 kJ/mol = 554 J, which corresponds to 0.022 W of
power. There is also a source of hydrogen in a form of water and hydroxyl groups trapped
in the Pt/Al2O3 catalyst that is used as a recombiner. I hypothesize that 10 g of the
catalyst would contain 6% water by weight based on the bakeout results from Chapter
VII. Thus, the energy of the exchange reaction in the recombiner is estimated as 264 J, or
0.01 W of power. The remained question is: was this energy already accounted for as a
part of a calibration routine when using a control cell? Both the experimental and control
cells used the same electrolyte and the same Pt/Al2O3 catalyst. At this point I am going to
assume that the H/D exchange in the electrolyte and the recombiner was a unique
property of the experimental cell and resulted in 0.032 W of generated power.
2) Another source of exothermic heat that differed from the control cell was the
hydrogenation of the titanium cathode. This reaction is reversible and the process of
deloading of hydrogen from Ti after the cell was shut off should result in heat absorption.
However, we assumed that the measurements were stopped when the power to the cell
was shut off and no temperature measurements were taken beyond that point. Knowing
84
the mass of the cathode and assuming its full hydrogenation: Ti + 2H -> TiH2 the
possible generated heat is 0.0124 mol x 133.874 kJ/mol = 1.66 kJ or 0.065 W of power.
3) The mass loss was registered as a result of the electrolysis. The escaped products were
unknown, however. If we assume that the electrolyte solution escaped the experimental
cell in the form of water vapor after the hydrogen and oxygen recombined, then we can
account for another 0.024 mol x 294.6 kJ/mol = 7.07 kJ or 0.275 W of power.
Based on these calculations the total power for which we can account by implying known
chemical processes in the electrochemical cell is 0.032 W + 0.065 W + 0.275W = 0.372 W. This
number represents heat that presumably was not accounted for by the control cell. However, the
number 0.38 W does not fully explain 0.59 W of observed excess heat. The H/D exchange can
account for only 5.4% of this excess generated power. The scale of the energy production in
electrochemical cells is magnitudes higher than in gas-loading systems. Thus, the contribution of
H/D exchange is insignificant, and for the particular example discussed in this chapter it cannot
explain the heat production results.
Making sure the cell is closed to the environment and using calorimetric setup instead of a
thermometry would improve the measurements and might result in different excess heat
numbers.
85
CHAPTER X
CONCLUSIONS AND FUTURE WORK
A. Conclusions
The purpose of my work was to study and explain the mechanisms of heat generation in
Pd-impregnated oxide materials as a result of their exposure to hydrogen isotopes. Several
mechanisms are responsible for heat generation at different stages of the gas-loading process.
While two of them (heat of loading and heat associated with work of pressurization) are
reversible, there is an additional source of excess heat that some researchers have associated with
a low energy nuclear reaction. The experiments that I carried out provided insights into this
excess heat generation mechanism, and proved it to be chemical rather than nuclear.
The majority of my work was done with 2%Pd-impregnated alumina fabricated by
incipient wetness impregnation. A combination of characterization methods showed that I
synthesized nanoscale Pd clusters which were embedded into the alumina support. Oxide powder
systems infused with Pd nanoparticles are well studied catalytic systems. I hypothesized that
during deuterium and hydrogen gas-loading the catalyst promotes a chemical reaction under
certain favorable conditions. If the observed reaction is indeed a manifestation of the catalytic
nature of the Pd-impregnated alumina, than I should be able to demonstrate similar results using
other heterogeneous catalysts. To prove my hypothesis, I fabricated samples using different
supports (zeolite and silica) and different metallic inclusions (Pd and Pt). I also tested a
commercially available ready-made Pd-on-alumina catalyst. The samples showed some limited
variations during the gas-loading experiments. However, they all responded similarly with
regards to the phenomena investigated here.
I have grouped my conclusions under the four bullet points listed below:
86
No radiation above the background or alpha-particle emission was observed from the gas-
loading of Pd-impregnated material, which led me to take a look at the conventional
explanation of the excess heat generated by the material in the presence of deuterium. A
hydrogen/deuterium (H/D) exchange chemical reaction was proposed to explain the
excess heat generation phenomenon. The mechanism can be described as a multistep
process: (1) deuterium gas dissociates on the surface of Pd nanoparticle, forming PdD,
(2) deuterium atoms are transferred from the metal to the alumina support through a
spillover process, and (3) the remaining water, which is trapped in the material along with
hydroxyl groups on the surface of the alumina, engages in a H/D exothermic exchange
reaction (when the hydrogen atoms are exchanged with deuterium). The H/D exchange
explains the isotope effect and an observed gradual reduction of the amount of produced
heat with repeated gas exposures. Based on these observations I proposed the concept of
chemical fuel, which is stored in the material and supports the chemical reaction in the
presence of gas.
Chemical fuel can be of two types: H2O and OH groups or D2O and OD groups that are
trapped in the material. My experiment with isotope materials proved that I can make a
system not only generate, but also absorb heat – all based on the type of fuel provided to
the sample and the hydrogen isotope used for gas-loading. Different characterization
techniques confirmed the presence of the two types of fuel, and transitioning between
depletion and regeneration of each type of fuel. The fact that the reactions could be both
endothermic and exothermic supported the hypothesis of the chemical nature of the
observed phenomenon. If a nuclear reaction initiated under these conditions had been the
cause for the excess heat, it would have been exothermic only. Furthermore, the reaction
87
would not depend on the water isotope used during the fabrication step, as long as Pd
remained in the same form and concentration and was loaded with deuterium atoms.
A water isotope fuel can be controlled/exhausted by either continued gas cycling, which
completes the H/D exchange, or by a bakeout at elevated temperature. The bakeout
experiment demonstrated this elimination of the fuel, and as a result the heat generation
stopped. The reaction was reactivated later through reabsorption of the water from
ambient. Knowing the exact amount of the reabsorbed fuel allowed me to calculate its
energy content and prove that all of the observed heat could be accounted for by the H/D
exchange. I proposed the bakeout technique as a method to assess the energy released by
the material due to a H/D exchange chemical reaction during the gas-loading
experiments.
Besides the conventional chemistry that can explain the results of the gas-loading
experiments in heterogeneous catalysts, I looked at the other processes that can be mistaken for
anomalous heating in the presence of gas:
There is a temperature measurement artifact associated with gas-loading experiments at
elevated temperatures. This artifact is a result of the temperature gradients across the gas-
loading system. The ruling assumption of gas-loading experiments is that heat produced
under the gas pressure is an indication of the reaction. However, the presence of gas
significantly changes the heat conduction inside the system. Therefore, when placed
under gas pressure, the heat transfer efficiency changes. This change in heat transfer in
the presence of temperature gradients artificially shifts the temperature measurement
baseline, which could then be mistaken for excess heating. I have demonstrated how this
88
measurement artifact can alter the measurement baseline and proposed a technique that
would ensure proper system calibration.
B. Future work
a) Heat transfer simulation
Coupling the experimental data to the software simulations is a powerful approach to
study calorimetric systems. Commercially available finite element solvers and the simulation
software package COMSOL can be used to model heat transfer inside the system via conduction,
convection, and radiation. The Computational Fluid Dynamics (CFD) COMSOL multyphysics
module does sophisticated fluid flow simulations, specifically: conjugate heat transfer with non-
isothermal flow. The software can be used to simulate the gas flow conditions inside the oven
and experimental vessel to explain and predict the rise of the measurement artifacts as described
in Chapter VIII. Hydrogen, argon or helium heat conduction coefficients can be assigned when
simulating flow inside the vessel. Coupling the CFD physics to the Heat Transfer in Solids
physics module in the software will allow to calculate the time resolved temperature change at
any point of the vacuum system.
b) Ni-H system
I looked at a gas-loading system following multiple reports of anomalous heat generated
by such systems in the presence of deuterium. However, there is another large cluster of work
that has been done with Ni and NiCu alloy materials and hydrogen, and for which H/D exchange
reaction does not provide an explanation. Hydrogen, as a reaction gas, does not satisfy the
condition for the exothermic reaction described in Table 4. Hydrogen exposure would produce
either no heat if the material is saturated with H2O, or the reaction would be endothermic if D2O
89
is trapped in the sample. I do not dismiss the chemical explanation to the excess heat observed in
Ni-H systems, but the details of the reaction are unknown.
Ongoing research of Ni nanopowders includes two decades of experimental work done
by F. Piantelli (Piantelli, 2012), (Focardi, et al., 1999). More recent results have been reported by
F. Celani, who was experimenting with NiCu Constantan wires (Celani, et al., 2012). In 2009 the
Electric Power Research Institute in Palo Alto, Calif., sponsored work of B. Ahern, who
repeatedly observed anomalous heating of nano-Ni composite powders under hydrogen pressure.
Ahern’s material was independently tested by the group of Japanese scientists from Kobe
University, Osaka University, Technova Inc. and Santoku Corp., who confirmed the effect. As a
result, the emphasis of their research was switched to Cu-Ni-ZrO2 powders and hydrogen loading
instead of Pd-D2 (Sakoh, et al., 2012). Interestingly enough, the same material was tested in our
laboratory using the protocol proposed by B. Ahern himself. I did not observe any anomalous
heating; moreover, the results I obtained testing Ahern’s material initiated the study of the
measurement artifact described in Chapter VIII.
The origin of a possible heat generation mechanism in Ni-H systems is unknown and
worth looking into. The effort should be applied into careful calibration of the gas-loading
system to avoid measurement artifacts, since excess energy generation events from Ni-H systems
were reported at the elevated temperatures. To investigate the reaction products different
characterization techniques could be used in the same manner described in Chapter VI. The fact
that the presence of the nano-features is essential to a successful demonstration of heat
production in the material makes one expect that the catalytic properties of Ni metal play a role
in initiation of a reaction.
90
REFERENCES
Andrews, D., 2008. A novel experiment to investigate the attenuation of alpha particles in air.
Eur. J. Phys. 29, pp. 1077-1083.
Arata, Y. & Zhang, Y., 2008. Establishment of the "Solid Fusion" reactor. J. High Temp Soc.,
pp. 85-39.
Biberian, J.-P., 2008. Cold fusion by gas-loading. Proceedings of 14th International
Conference on Condensed Matter Nuclear Science, pp. 370-384.
Bloch, F., 1933. Zur bremsung rasch bewegter teilchen beim durchgang durch materie. Ann.
Phys. 16, pp. 285-320.
Canton, P. et al., 2002. Pd/CO average chemisorption stoichiometry in highly dispersed
support Pd/gamma-Al2O3 catalysts. Lanfmuir, pp. 6530-6535.
Celani, F. et al., 2012. Cu-Ni-Mn alloy wires, with impoved sub-micrometric surfaces, used
as LENR device by new transport, dissipation-type, calorimeter. Proceedings of 17th
International Conference on Condensed Matter Nuclear Science, in press.
Chase, M. W. et al., 1985. JANAF Thermochemical tables (third edition). J. Phys. Chem. Ref.
Data, 14.
Chorkendoff, I. & Niemantsverdriet, L. W., 2007. Concepts of Modern Catalysis and
Kinetics. Weinheim: WILEY-VCH Verlag GmbH & Co
Conner, W. C. & Falconer, J. L., 1995. Spillover in heterogeneous catalysis. Chem. Rev. 95,
pp. 759-788.
Cox, J. D., Wagman, D. D. & Medvedev, V. A., 1989. CODATA key values for
thermodynamics. New York: Hemisphere Pub. Co.
Datye, A. et al., 2000. Catalyst microstructure and methane oxidation reactivity during the
Pd<-> PdO transformation on alumina supports. Appl. Catal. A, pp. 179-196.
91
Davis, E., Teofilo, V. L., Puthoff, H. E. & Nickisch, L. J., 2006. Review of experimental
concepts for studying the quantum vacuum field. Proc. of the STAIF-2006: 3rd Symposium on
New Frontiers and Future Concepts, AIP Conf. Proc., 813, pp. 1390-1401.
Dmitriyeva, O., Cantwell, R., McConnell, M. & Moddel, G., 2012. Mechanisms for heat
generation during deuterium and hydrogen loading of palladium nanostractures. J. Condensed
Matter Nucl. Sci., 8, pp. 29-36.
Dmitriyeva, O., Cantwell, R., McConnell, M. & Moddel, G., 2012. Origin of exces heat
generation during loading Pd-impregnated alumina powder with deuterium and hydrogen.
Thermochimica Acta 543, pp. 260-266.
Dmitriyeva, O., Cantwell, R., McConnell, M. & Moddel, G., 2012. Using bakeout to
eliminate heat from H/D exchange during hydrogen isotope loading of Pd-impregnated alumina
powder. Proceedings of 17th International Conference on Condensed Matter Nuclear Science, in
print.
Drits, V., Eberl, D. & Srodon, J., 1998. XRD measurement of mean thickness, thickness
distribution and strain for illite and illite/smectite crystallites by the Bertaut-Warren-Averbach
technique. Clays & Clay Minerals, pp. 38-50.
Eberl, D., Drits, V., Srodon, J. & Nuesch, R., 1996. MudMaster: a program for calculating
cristallite size distributions and strain from the shapes of X-ray diffraction peaks. USGS Open
File Report, pp. 96-171.
Fleischmann, M., Pons, S. & Hawkins, M., 1989. Electrochemically induced nuclear fusion
of deuterium. J.Electroanal.Chem., 261, 301 and errata in 263.
Focardi, S., Habel, R. & Piantelli, F., 1999. Anomalous heat production in Ni-H, Europian
Patent EP0767962.
Gurvich, L. V., Veyts, I. V. & Alcock, C. B., 1989. Thermodynamic properties of individual
substances. New York: Hemisphere Pub. Co.
Haisch, B. & Moddel, G., May 27, 2008. Quantum vacuum energy extraction, U.S. Patent
7,379,286.
Hansen, K. et al., 1999. Palladium Nanocrystals on Al2O3: structure and adhesion energy.
Phys. Rev. Lett., v.83, pp. 4120-4123.
92
Hemminger, W. & Hohne, G., 1984. Calorimetry - fundamentals and practice. Weinheim:
Verlag Chemie GmbH.
Hioki, T. et al., 2009. Hydrogen/deuterium adsorption property of Pd fine particle systems
and heat evolution associated with Hydrogen/deuterium loading. Proceedings of 15th
International Conference on Condensed Matter Nuclear Science, pp. 88-93.
Huang, S.-Y., Huang, C.-D., Chang, B.-T. & Yeh, C.-T., 2006. Chemical activity of palladium
clasters: sorption of hydrogen. J. Phys. Chem, Volume 110, pp. 21783-21787.
Kidwell, D., Knies, D., Moser, A. & Domingues, D., 2009. Yes, Virginia there is a heat, but it
is most likely of chemical origin. Proceedings of 15th International Conference on Condensed
Matter Nuclear Science, pp. 100-109.
Kitamura, A. et al., 2008. Anomalous effacts in charging of Pd powders with high density
hydrogen isotopes. Phys. Lett. A, pp. 3109-3112.
Langford, J. I. & Wilson, A. C., 1978. Scherrer after Sixty Years: A Survey and Some New
Results in the Determination of Crystallite Size. J. Appl. Cryst, pp. 102-113.
Miles, M. & Fleischmann, M., 2009. New approaches to isoperibolic calorimetry.
Proceedings of 15th International Conference on Condensed Matter Nuclear Science, pp. 22-26.
Moddel, G., 2009. Assessment of proposed electromagnetic quantum vacuum energy
extraction methods. arXiv, 0910.5893.
Piantelli, F., 2012. Resultes reported on Ni-H system, Siena, Italy: 10th International
Workshop on Anomalies in Hydrogen Loaded Metals.
Quantachrome Instruments, 2007. Autosorb 1C version 1.5x operation manual.
Ruscic, B. et al., 2006. Active thermodynamical tables: accurate enthalpy of formation of
hydroxyl radical, HO2. J. Phys Chem. A 110, pp. 6592-6601.
Sakamoto, Y. et al., 1996. Calorimetric enthalpies for palladium-hydrogen (deuterium)
systems at H(D) contents up to about [H]([D])/[Pd]=0.86. J.Phys.: Condens. Matter, 8, pp. 3229-
3244.
93
Sakoh, H. et al., 2012. Hydrogen isotope absorption and heat release chatacteristics of a Ni-
based sample. Proceedings of 17th International Conference on Condensed Matter Nuclear
Science, p. in press.
Scherrer, P., 1918. Bestimmung der Grösse und der inneren Struktur von Kolloidteilchen
mittels Röntgenstrahlen. Nachr.Ges.Wiss.Göttingen, pp. 98-100.
Storms, E., 2007. The science of low energy nuclear reaction. Singapore: World Scienific
Publishing Co. Pte. Ltd..
Storms, E., 2010. Status of cold fusion (2010). Naturwissenschaften, pp. 97:861-881.
U.S. Department of Energy, 2004. Report of the review of low energy nuclear reactions,
Washington, DC: Department of Energy.
U.S. Department of Energy, 2011. International Energy Outlook 2011, Report Number:
DOE/EIA-0484(2011), Washington, DC: Department of Energy.
Vitos, L., Ruban, A., Shriver, H. & Kollar, J., 1998. The surface energy of metals. Surf. Sci
411, pp. 186-202.
Wachs, I. E., 1992. Characterization of catalytic materials, Butterworth-Heinemann.
94
APPENDIX – A
Space, Propulsion & Energy Sciences International Forum - 2012
Test of zero-point energy emission from gases flowing through
Casimir cavities
Olga Dmitriyevaa, Garret Moddel
a,b,1
aDepartment of Electrical, Computer, and Energy Engineering, University of Colorado,
Boulder, CO 80309-0425, USA
bJovion Corporation, Meno Park, CA, 94025, USA
Abstract
A recently issued patent [1] describes a method by which vacuum energy is extracted from gas flowing through a Casimir cavity.
According to stochastic electrodynamics, the electronic orbitals in atoms are supported by the ambient zero-point (ZP) field.
When the gas atoms are pumped into a Casimir cavity, where long-wavelength ZP field modes are excluded, the electrons spin
down into lower energy orbitals and release energy in the process. This energy is collected in a local absorber. When the
electrons exit the Casimir cavity they are re-energized to their original orbitals by the ambient ZP fields. The process is repeated
to produce continuous power. In this way, the device functions like a heat pump for ZP energy, extracting it globally from the
electromagnetic quantum vacuum and collecting it in a local absorber. This energy can be used for heating, or converted to
electric power.
We carried out a series of experiments to test whether energy is, in fact, radiated from Casimir cavities when the appropriate gas
flows through them. The Casimir cavity devices we tested were nanopore polycarbonate membranes with submicron pores
having a density of 3x10⁸ pores/cm2. Gas was pumped through the membranes in a stainless steel vacuum system, and emitted
energy was measured using a broadband pyroelectric detector and lock-in amplifier. Emission in the infrared was clearly
observed. We analyzed the emission from different gases and cavities to determine its origin. None of the conventional
thermodynamic models we applied to our data fully explain it, leaving open the possibility that it is due to Casimir-cavity-
induced emission from ZP fields.
© 2012 Published by Elsevier B.V. Selection and/or peer-review under responsibility of Institute for
Advanced Studies in the Space, Propulsion and Energy Sciences
PACS: 84.60._h
Keywords: Zero-point energy, quantum vacuum, vacuum energy, Casimir cavity
1 Corresponding author. Tel.: +1-303-492-1889; fax: +1-303-492-2758
E-mail address: [email protected].
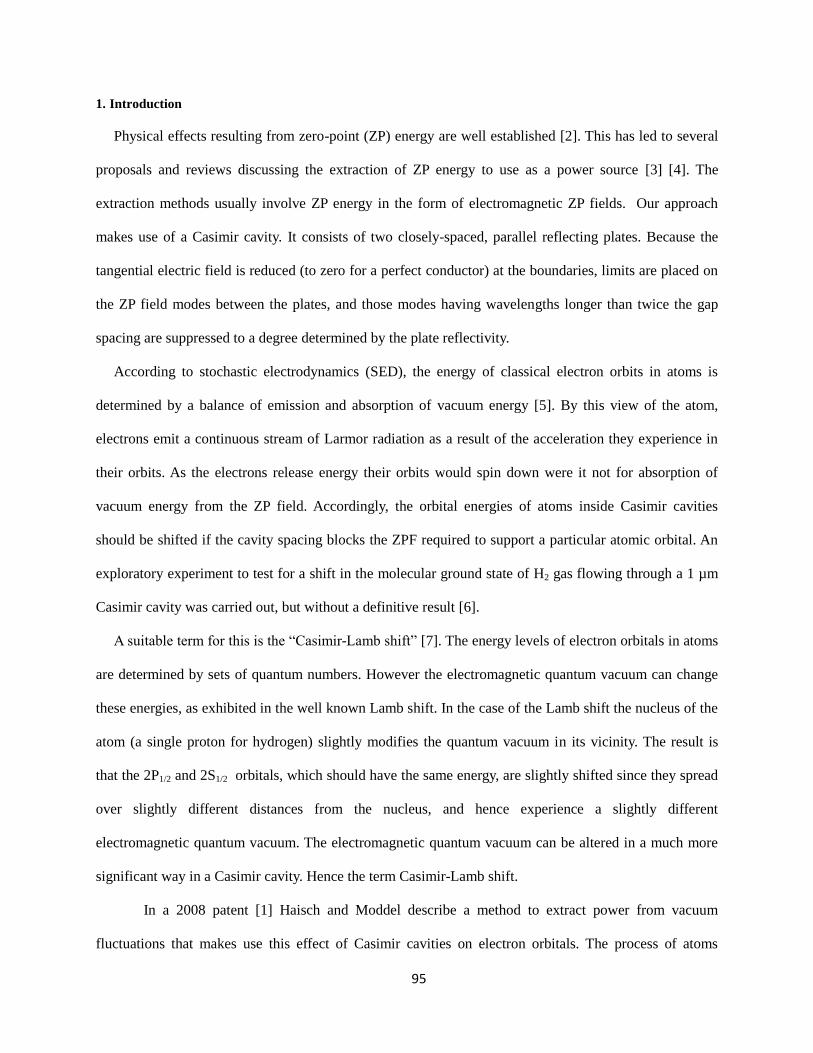
95
1. Introduction
Physical effects resulting from zero-point (ZP) energy are well established [2]. This has led to several
proposals and reviews discussing the extraction of ZP energy to use as a power source [3] [4]. The
extraction methods usually involve ZP energy in the form of electromagnetic ZP fields. Our approach
makes use of a Casimir cavity. It consists of two closely-spaced, parallel reflecting plates. Because the
tangential electric field is reduced (to zero for a perfect conductor) at the boundaries, limits are placed on
the ZP field modes between the plates, and those modes having wavelengths longer than twice the gap
spacing are suppressed to a degree determined by the plate reflectivity.
According to stochastic electrodynamics (SED), the energy of classical electron orbits in atoms is
determined by a balance of emission and absorption of vacuum energy [5]. By this view of the atom,
electrons emit a continuous stream of Larmor radiation as a result of the acceleration they experience in
their orbits. As the electrons release energy their orbits would spin down were it not for absorption of
vacuum energy from the ZP field. Accordingly, the orbital energies of atoms inside Casimir cavities
should be shifted if the cavity spacing blocks the ZPF required to support a particular atomic orbital. An
exploratory experiment to test for a shift in the molecular ground state of H2 gas flowing through a 1 µm
Casimir cavity was carried out, but without a definitive result [6].
A suitable term for this is the “Casimir-Lamb shift” [7]. The energy levels of electron orbitals in atoms
are determined by sets of quantum numbers. However the electromagnetic quantum vacuum can change
these energies, as exhibited in the well known Lamb shift. In the case of the Lamb shift the nucleus of the
atom (a single proton for hydrogen) slightly modifies the quantum vacuum in its vicinity. The result is
that the 2P1/2 and 2S1/2 orbitals, which should have the same energy, are slightly shifted since they spread
over slightly different distances from the nucleus, and hence experience a slightly different
electromagnetic quantum vacuum. The electromagnetic quantum vacuum can be altered in a much more
significant way in a Casimir cavity. Hence the term Casimir-Lamb shift.
In a 2008 patent [1] Haisch and Moddel describe a method to extract power from vacuum
fluctuations that makes use this effect of Casimir cavities on electron orbitals. The process of atoms
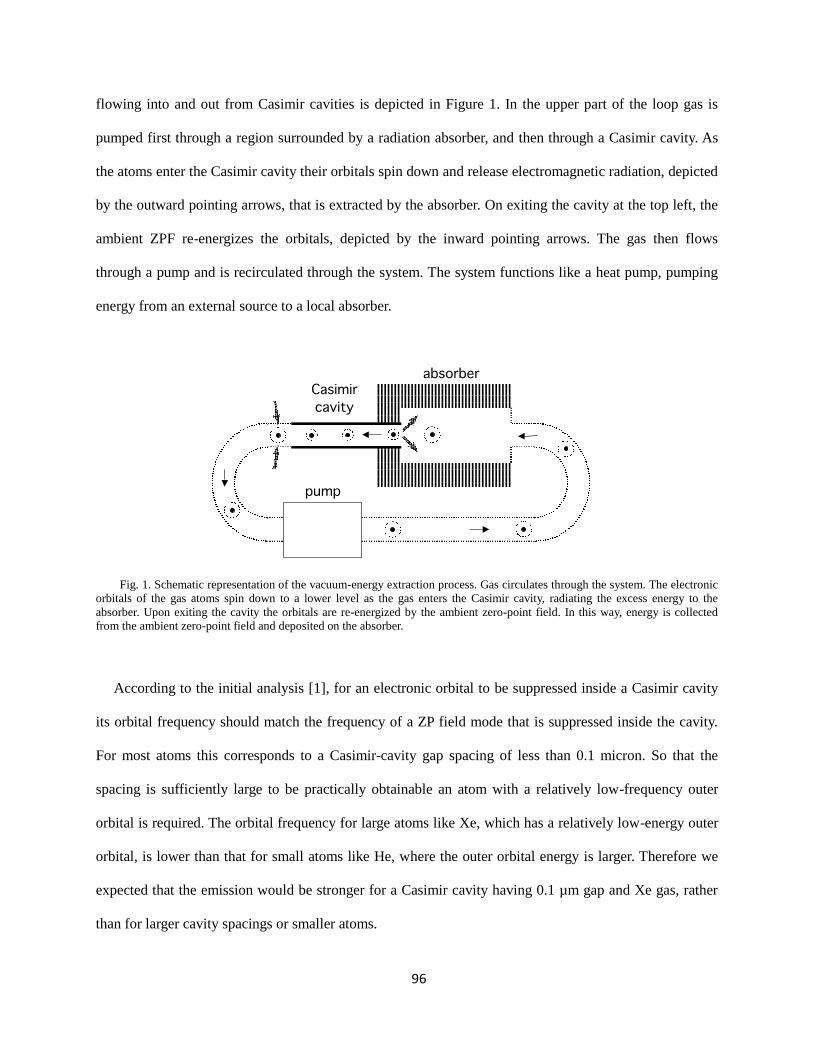
96
flowing into and out from Casimir cavities is depicted in Figure 1. In the upper part of the loop gas is
pumped first through a region surrounded by a radiation absorber, and then through a Casimir cavity. As
the atoms enter the Casimir cavity their orbitals spin down and release electromagnetic radiation, depicted
by the outward pointing arrows, that is extracted by the absorber. On exiting the cavity at the top left, the
ambient ZPF re-energizes the orbitals, depicted by the inward pointing arrows. The gas then flows
through a pump and is recirculated through the system. The system functions like a heat pump, pumping
energy from an external source to a local absorber.
Fig. 1. Schematic representation of the vacuum-energy extraction process. Gas circulates through the system. The electronic
orbitals of the gas atoms spin down to a lower level as the gas enters the Casimir cavity, radiating the excess energy to the
absorber. Upon exiting the cavity the orbitals are re-energized by the ambient zero-point field. In this way, energy is collected
from the ambient zero-point field and deposited on the absorber.
According to the initial analysis [1], for an electronic orbital to be suppressed inside a Casimir cavity
its orbital frequency should match the frequency of a ZP field mode that is suppressed inside the cavity.
For most atoms this corresponds to a Casimir-cavity gap spacing of less than 0.1 micron. So that the
spacing is sufficiently large to be practically obtainable an atom with a relatively low-frequency outer
orbital is required. The orbital frequency for large atoms like Xe, which has a relatively low-energy outer
orbital, is lower than that for small atoms like He, where the outer orbital energy is larger. Therefore we
expected that the emission would be stronger for a Casimir cavity having 0.1 µm gap and Xe gas, rather
than for larger cavity spacings or smaller atoms.
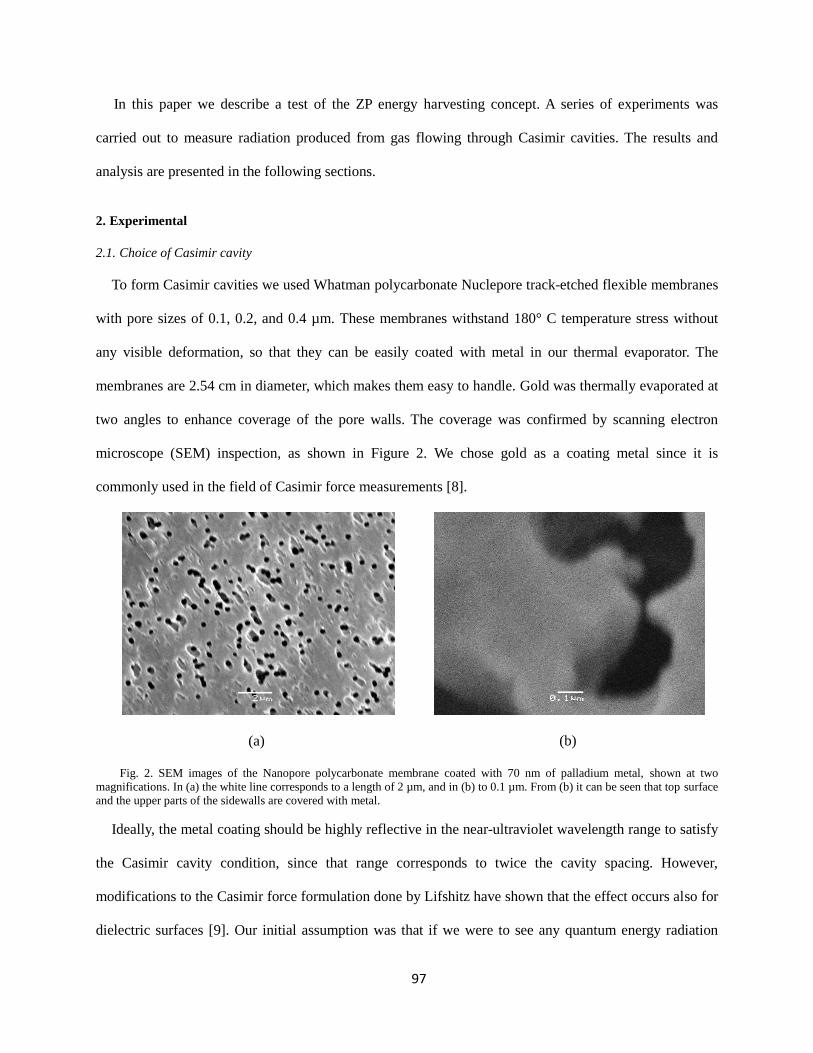
97
In this paper we describe a test of the ZP energy harvesting concept. A series of experiments was
carried out to measure radiation produced from gas flowing through Casimir cavities. The results and
analysis are presented in the following sections.
2. Experimental
2.1. Choice of Casimir cavity
To form Casimir cavities we used Whatman polycarbonate Nuclepore track-etched flexible membranes
with pore sizes of 0.1, 0.2, and 0.4 µm. These membranes withstand 180° C temperature stress without
any visible deformation, so that they can be easily coated with metal in our thermal evaporator. The
membranes are 2.54 cm in diameter, which makes them easy to handle. Gold was thermally evaporated at
two angles to enhance coverage of the pore walls. The coverage was confirmed by scanning electron
microscope (SEM) inspection, as shown in Figure 2. We chose gold as a coating metal since it is
commonly used in the field of Casimir force measurements [8].
(a)
(b)
Fig. 2. SEM images of the Nanopore polycarbonate membrane coated with 70 nm of palladium metal, shown at two
magnifications. In (a) the white line corresponds to a length of 2 µm, and in (b) to 0.1 µm. From (b) it can be seen that top surface
and the upper parts of the sidewalls are covered with metal.
Ideally, the metal coating should be highly reflective in the near-ultraviolet wavelength range to satisfy
the Casimir cavity condition, since that range corresponds to twice the cavity spacing. However,
modifications to the Casimir force formulation done by Lifshitz have shown that the effect occurs also for
dielectric surfaces [9]. Our initial assumption was that if we were to see any quantum energy radiation
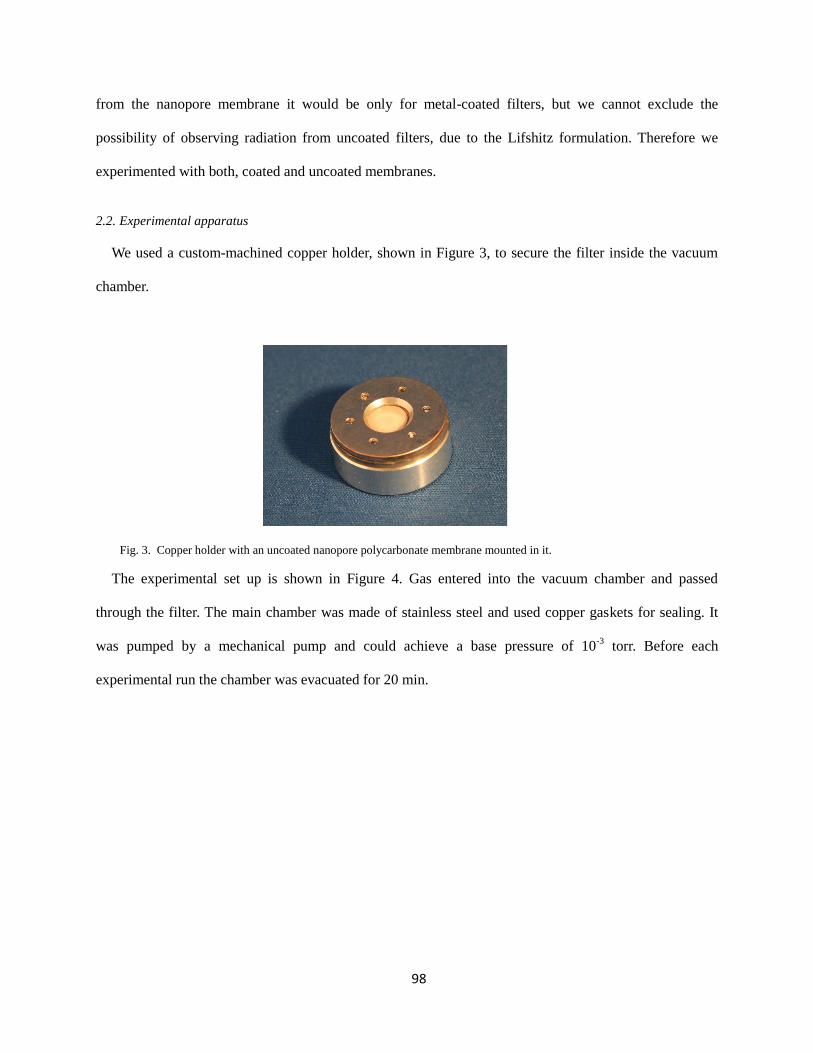
98
from the nanopore membrane it would be only for metal-coated filters, but we cannot exclude the
possibility of observing radiation from uncoated filters, due to the Lifshitz formulation. Therefore we
experimented with both, coated and uncoated membranes.
2.2. Experimental apparatus
We used a custom-machined copper holder, shown in Figure 3, to secure the filter inside the vacuum
chamber.
Fig. 3. Copper holder with an uncoated nanopore polycarbonate membrane mounted in it.
The experimental set up is shown in Figure 4. Gas entered into the vacuum chamber and passed
through the filter. The main chamber was made of stainless steel and used copper gaskets for sealing. It
was pumped by a mechanical pump and could achieve a base pressure of 10-3
torr. Before each
experimental run the chamber was evacuated for 20 min.
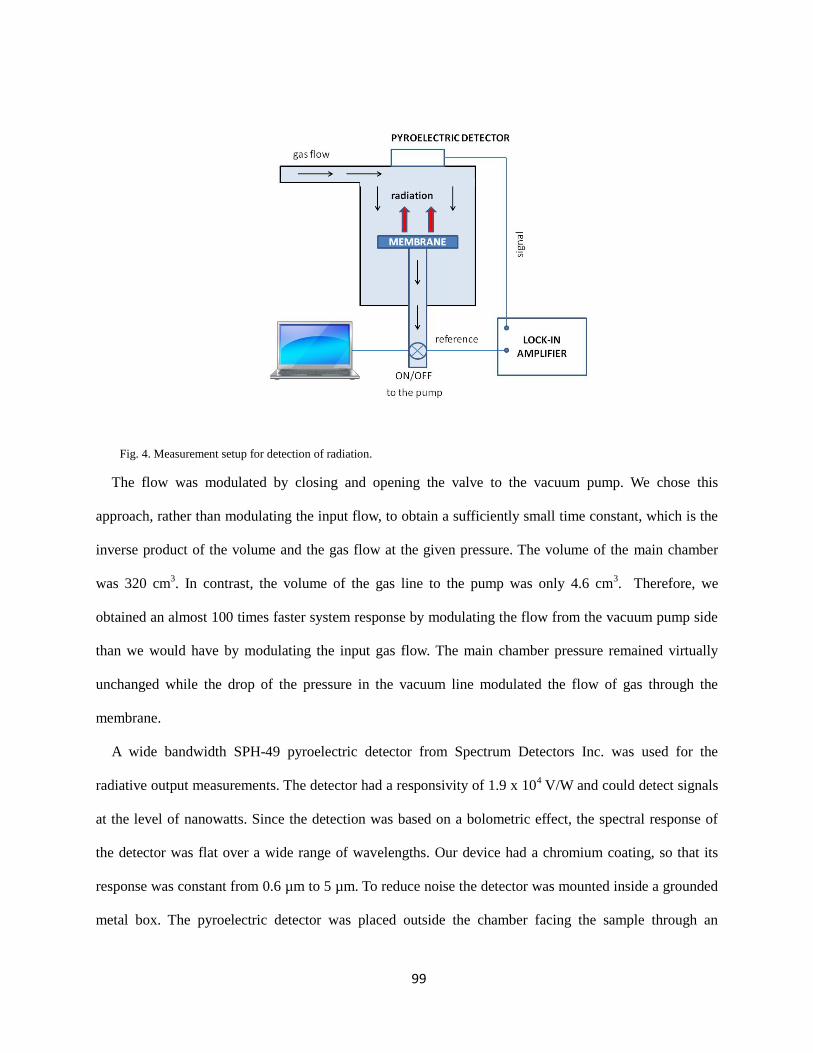
99
Fig. 4. Measurement setup for detection of radiation.
The flow was modulated by closing and opening the valve to the vacuum pump. We chose this
approach, rather than modulating the input flow, to obtain a sufficiently small time constant, which is the
inverse product of the volume and the gas flow at the given pressure. The volume of the main chamber
was 320 cm3. In contrast, the volume of the gas line to the pump was only 4.6 cm
3. Therefore, we
obtained an almost 100 times faster system response by modulating the flow from the vacuum pump side
than we would have by modulating the input gas flow. The main chamber pressure remained virtually
unchanged while the drop of the pressure in the vacuum line modulated the flow of gas through the
membrane.
A wide bandwidth SPH-49 pyroelectric detector from Spectrum Detectors Inc. was used for the
radiative output measurements. The detector had a responsivity of 1.9 x 10⁴ V/W and could detect signals
at the level of nanowatts. Since the detection was based on a bolometric effect, the spectral response of
the detector was flat over a wide range of wavelengths. Our device had a chromium coating, so that its
response was constant from 0.6 µm to 5 µm. To reduce noise the detector was mounted inside a grounded
metal box. The pyroelectric detector was placed outside the chamber facing the sample through an
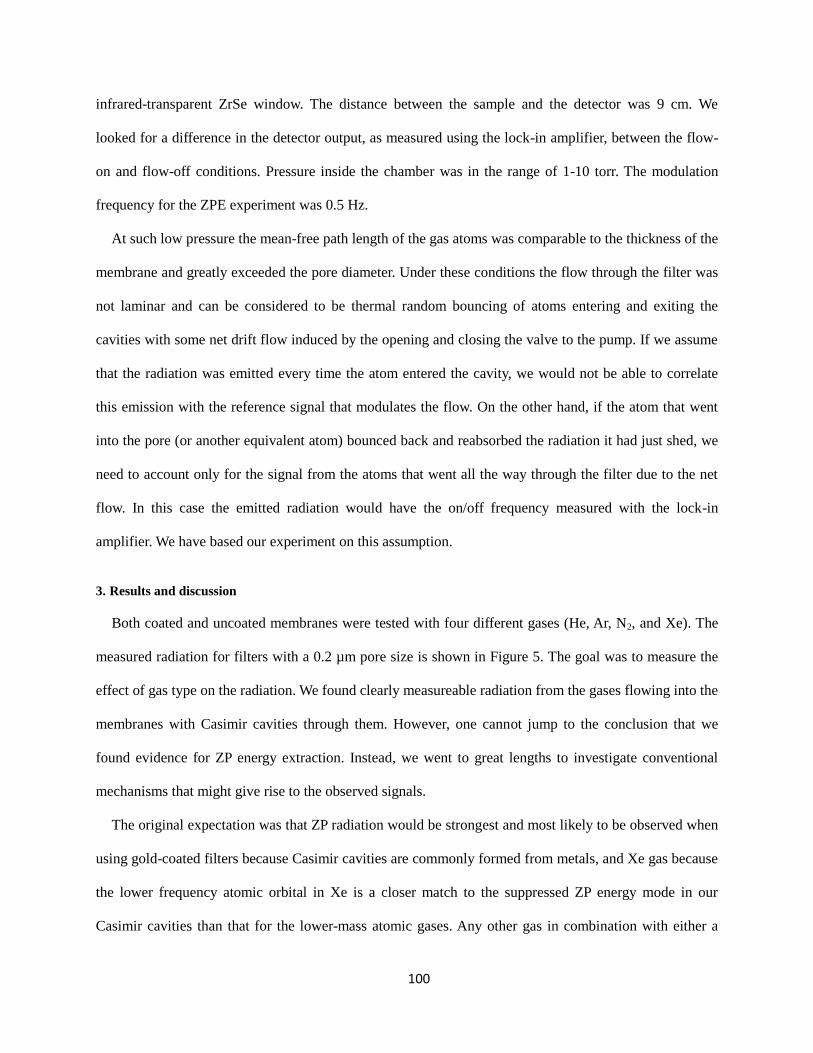
100
infrared-transparent ZrSe window. The distance between the sample and the detector was 9 cm. We
looked for a difference in the detector output, as measured using the lock-in amplifier, between the flow-
on and flow-off conditions. Pressure inside the chamber was in the range of 1-10 torr. The modulation
frequency for the ZPE experiment was 0.5 Hz.
At such low pressure the mean-free path length of the gas atoms was comparable to the thickness of the
membrane and greatly exceeded the pore diameter. Under these conditions the flow through the filter was
not laminar and can be considered to be thermal random bouncing of atoms entering and exiting the
cavities with some net drift flow induced by the opening and closing the valve to the pump. If we assume
that the radiation was emitted every time the atom entered the cavity, we would not be able to correlate
this emission with the reference signal that modulates the flow. On the other hand, if the atom that went
into the pore (or another equivalent atom) bounced back and reabsorbed the radiation it had just shed, we
need to account only for the signal from the atoms that went all the way through the filter due to the net
flow. In this case the emitted radiation would have the on/off frequency measured with the lock-in
amplifier. We have based our experiment on this assumption.
3. Results and discussion
Both coated and uncoated membranes were tested with four different gases (He, Ar, N2, and Xe). The
measured radiation for filters with a 0.2 µm pore size is shown in Figure 5. The goal was to measure the
effect of gas type on the radiation. We found clearly measureable radiation from the gases flowing into the
membranes with Casimir cavities through them. However, one cannot jump to the conclusion that we
found evidence for ZP energy extraction. Instead, we went to great lengths to investigate conventional
mechanisms that might give rise to the observed signals.
The original expectation was that ZP radiation would be strongest and most likely to be observed when
using gold-coated filters because Casimir cavities are commonly formed from metals, and Xe gas because
the lower frequency atomic orbital in Xe is a closer match to the suppressed ZP energy mode in our
Casimir cavities than that for the lower-mass atomic gases. Any other gas in combination with either a
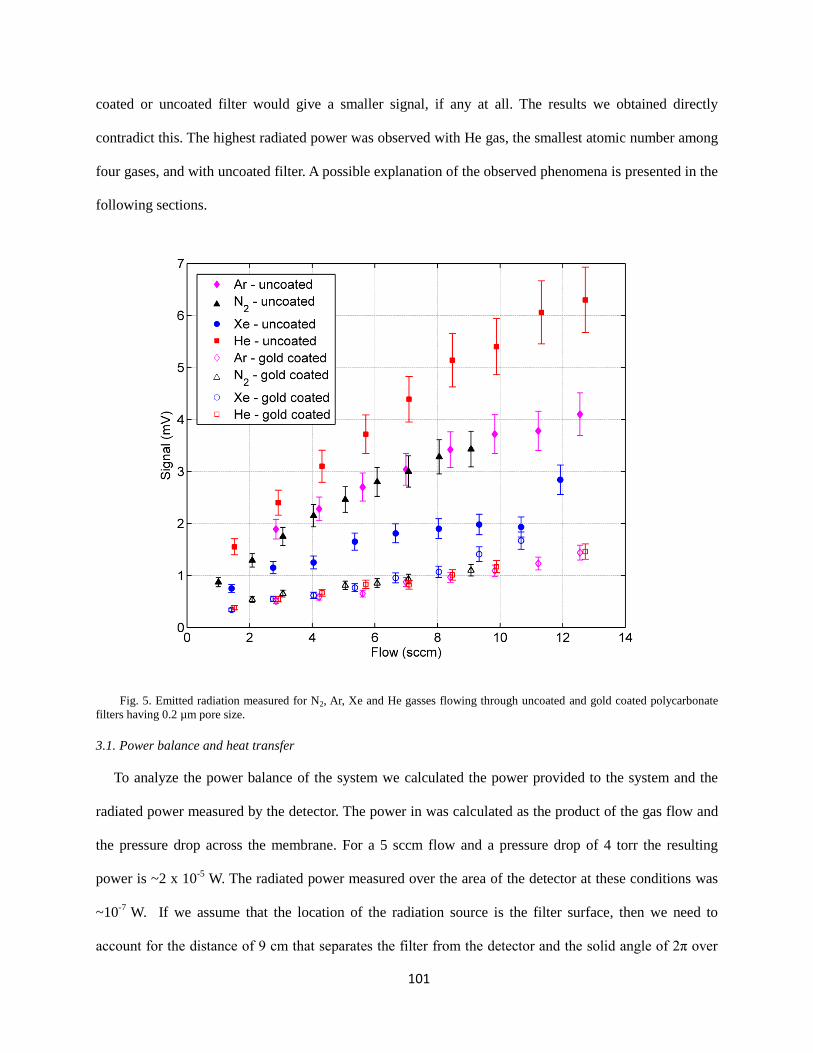
101
coated or uncoated filter would give a smaller signal, if any at all. The results we obtained directly
contradict this. The highest radiated power was observed with He gas, the smallest atomic number among
four gases, and with uncoated filter. A possible explanation of the observed phenomena is presented in the
following sections.
Fig. 5. Emitted radiation measured for N2, Ar, Xe and He gasses flowing through uncoated and gold coated polycarbonate
filters having 0.2 µm pore size.
3.1. Power balance and heat transfer
To analyze the power balance of the system we calculated the power provided to the system and the
radiated power measured by the detector. The power in was calculated as the product of the gas flow and
the pressure drop across the membrane. For a 5 sccm flow and a pressure drop of 4 torr the resulting
power is ~2 x 10⁻⁵
W. The radiated power measured over the area of the detector at these conditions was
~10-7
W. If we assume that the location of the radiation source is the filter surface, then we need to
account for the distance of 9 cm that separates the filter from the detector and the solid angle of 2π over
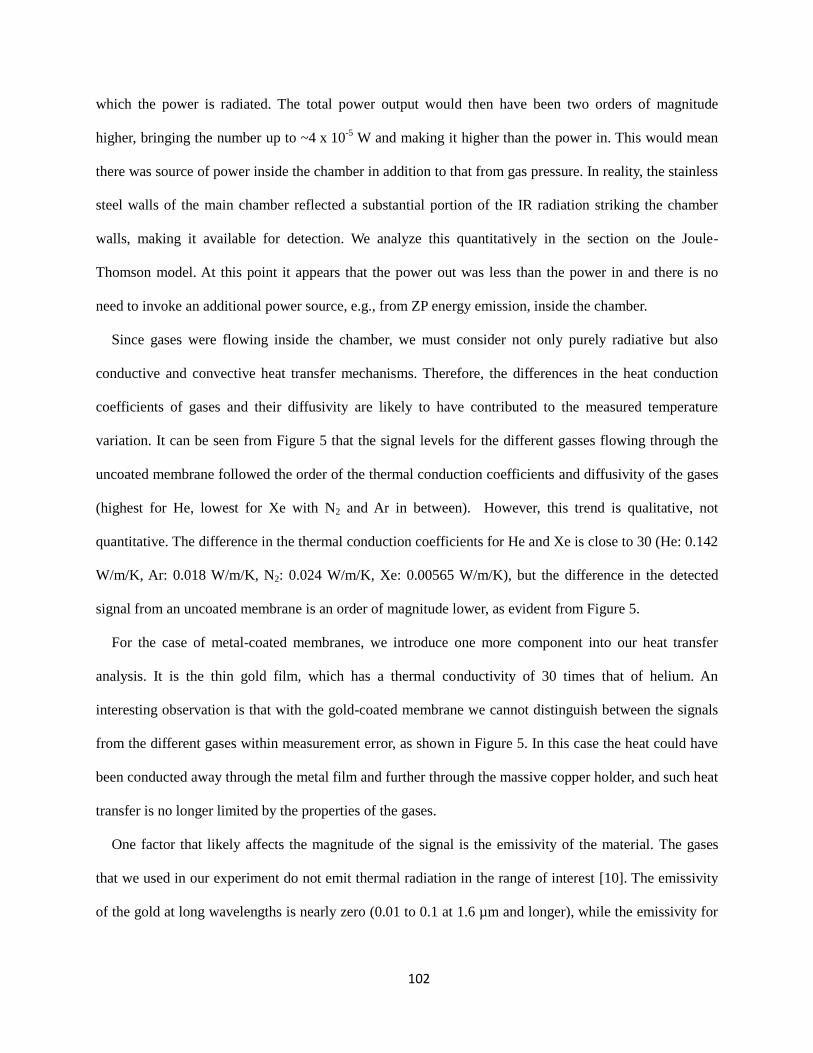
102
which the power is radiated. The total power output would then have been two orders of magnitude
higher, bringing the number up to ~4 x 10⁻⁵
W and making it higher than the power in. This would mean
there was source of power inside the chamber in addition to that from gas pressure. In reality, the stainless
steel walls of the main chamber reflected a substantial portion of the IR radiation striking the chamber
walls, making it available for detection. We analyze this quantitatively in the section on the Joule-
Thomson model. At this point it appears that the power out was less than the power in and there is no
need to invoke an additional power source, e.g., from ZP energy emission, inside the chamber.
Since gases were flowing inside the chamber, we must consider not only purely radiative but also
conductive and convective heat transfer mechanisms. Therefore, the differences in the heat conduction
coefficients of gases and their diffusivity are likely to have contributed to the measured temperature
variation. It can be seen from Figure 5 that the signal levels for the different gasses flowing through the
uncoated membrane followed the order of the thermal conduction coefficients and diffusivity of the gases
(highest for He, lowest for Xe with N2 and Ar in between). However, this trend is qualitative, not
quantitative. The difference in the thermal conduction coefficients for He and Xe is close to 30 (He: 0.142
W/m/K, Ar: 0.018 W/m/K, N2: 0.024 W/m/K, Xe: 0.00565 W/m/K), but the difference in the detected
signal from an uncoated membrane is an order of magnitude lower, as evident from Figure 5.
For the case of metal-coated membranes, we introduce one more component into our heat transfer
analysis. It is the thin gold film, which has a thermal conductivity of 30 times that of helium. An
interesting observation is that with the gold-coated membrane we cannot distinguish between the signals
from the different gases within measurement error, as shown in Figure 5. In this case the heat could have
been conducted away through the metal film and further through the massive copper holder, and such heat
transfer is no longer limited by the properties of the gases.
One factor that likely affects the magnitude of the signal is the emissivity of the material. The gases
that we used in our experiment do not emit thermal radiation in the range of interest [10]. The emissivity
of the gold at long wavelengths is nearly zero (0.01 to 0.1 at 1.6 µm and longer), while the emissivity for
103
plastic materials is approximately 0.95. This could explain why we see higher signals from the uncoated
polycarbonate filter compared to the gold-coated one, as shown in Figure 5.
3.2. Heat production inside the chamber: non-Casimir-cavity-induced mechanisms
We examine several non-Casimir-cavity-induced mechanisms that might account for the observed
radiation to see if there is a plausible explanation that requires only conventional thermodynamics.
3.2.1. Joule-Thomson model
To assess whether the Joule-Thomson effect [11] could be the source of the signal we first address
whether we have observed it. In one of our modified experiments we were able to distinguish heating
from cooling with the measurement system.
We conducted a modified experiment where the filter was replaced by a 12.5 µm thick Mylar film
having a single hole 3 mm in diameter. The gas expanded through this hole into the gas line leading to
the vacuum pump. The phase measured by the lock-in amplifier was positive and 180° off from the phase
measured in the experiment with the nanopore filter, indicating cooling. This is how we knew the effect
that we observed with gases flowing through the Casimir cavities was not due to the Joule-Thompson
effect.
The signal amplitudes for the different gases followed the sequence of the gases’ Joule-Thomson
coefficients (highest for Xe). Based on literature values [12] Xe possesses the highest coefficient, 1.87
ºC/atm at 1 atm, while He has the smallest, –0.0625 ºC/atm at 200 atm, with Ar (0.372 ºC/atm at 1 atm)
and N2 (0.2217 ºC/atm at 1 atm) in between. These numbers, however, are for pressures higher than in
our experiment. We make that assumption that for the lower pressure these coefficients follow the same
trend (Xe > Ar > N2 > He). In fact, the signal from He was so small we were not able to obtain reliable
measurements from this gas.
By knowing the pressure drop at the point of gas expansion, ~2 torr, and using the above values for the
Joule-Thomson coefficients we calculated the associated temperature changes. For Xe gas this
temperature drop was 4.9 x 10⁻³
ºC. Translating the detected signal to the temperature change using black
104
body spectrum calculations, the number comes out to be ~0.001 K. We noted earlier that not all the
radiated power reaches the detector. Our calculated value for Joule-Thomson cooling is close to the
measured one for the 3 mm hole assuming that we measure 20% of total emission, rather than the
reduction by two orders of magnitude calculated earlier on the assumption that there was no reflection by
the inner walls of the stainless steel chamber.
3.2.2. Frictional losses model
In this model we assume that our filter works as a passive element dissipating heat in analogy with a
resistor in an electrical circuit. Using this analogy the gas flow is analogous to the current and the
pressure drop across the filter is similar to the voltage drop across the resistor. The pressure drop depends
linearly on gas flow and the slope is different for different gases, with Xe being the most “resistive” and
He being the most “conductive”. These results are in agreement with the studies done by Roy and Raju on
the gas flow through microchannels [13].
If these frictional losses are what produced the heating effect and gave rise to the detector signal, the
power should depend quadratically on the gas flow (in the same way that electrical power depends
quadratically on the electrical current passing through a passive element). In our case the power depends
on the flow linearly. This does not automatically disqualify the frictional losses approach. Our system
tended to stay in thermal equilibrium with the environment, with the gas in the chamber exchanging
energy with the external environment through the walls and providing a channel for the heat/energy to
escape. This may have affected the way power depends on the flow, causing it to show a more linear
dependence.
Looking now at the variation of radiant power over different gases, the fact that the largest pressure
drop at a given flow rate was associated with Xe means that this gas should have dissipated more heat
than any other gas according to the frictional losses model. However, taking the heat conduction into
account can dramatically change the picture. The magnitude of the signal can be affected by thermal
conductivity and diffusivity of the gases, which are the highest for He and lowest for Xe. That could
105
explain why we observed the most radiation from He and the least from Xe, even though the frictional
losses model predicts the opposite outcome.
Based on the lack of a quadratic power dependence on flow and the opposite gas order for frictional
losses and measured power, it appears that the frictional losses model does not explain the observed
behaviour. However, as noted above, it may be possible to explain the result if the heat conduction and
diffusivity of the gases are included. To better assess whether these factors can account for the observed
behaviour will take additional experimental and analytical investigation.
3.2.3. Absorption/adsorption and release model
When a gas is brought into contact with a solid, molecules are pulled from the gas and are either
absorbed inside of the solid, or adsorbed on the outside, attached to the surface. The absorption/
adsorption process is exothermic. It may be possible that the heating we see is due to adsorption on the
membrane when the gas pressure rises. In the absence of gas flow we would then observe desorption,
which is an endothermic process. Adsorption is proportional to the pressure of the gas and the number of
vacant sites for adsorption. The number of such sites depends on the surface area. We used three different
pore size filters, 0.1 µm, 0.2 µm and 0.4 µm, which have surface area of 9.42 cm2, 18 cm
2 and 12.56 cm
2,
respectively. Signal from these different filters measured at pressure of ~5 torr did not follow the expected
trend of surface areas. Based on this result we have rejected the absorption/adsorption model as a possible
explanation for the radiation we observed.
3.2.4. Turbulence model
Turbulence is another possible heat source. The theory of energy dissipation in locally isotropic
turbulence was developed in the early 1940s by Kolmogorov [14]. In our experiment the rate at which the
gas flowed through the nanopore cavities was below 2 cm/s. The resulting Reynolds number is far below
what would be required to cause turbulence at the exit. Also, the viscosities of the gases used in the
experiment have values that are very close to each other (Ar: 2.1x10⁻⁴
poise, N2: 1.66x10⁻⁴
poise, Xe:
106
2.1x10⁻⁴
poise, He: 1.86x10⁻⁴
poise). This means that even if turbulence did cause the radiation from the
filter it alone could not explain the differences in signal levels for the different gases.
3.3. Heat production inside the chamber: Casimir cavity-induced model
After failing to explain the observed radiation using conventional thermodynamics, we analyze the data
as if the signal were the result of ZP energy emission. If we assume that each atom releases on the order
of 10% of its energy, approximately 1eV per transaction upon entering the cavity, it is straightforward to
calculate how much output power we should see from the gas flowing through a given nanopore filter. It
is on the order of milliwatts, which is thousands times larger than the measured power, assuming that we
detect at least 20% of emitted radiation.
If the radiation is due to Casimir cavity effects there are several factors that are likely to have reduced
the radiated power and would account for its being lower than expected:
The filters contain a range of nanopore sizes and shapes, as shown in Figure 2. Given that only a
small fraction of the nanopores within the filter satisfy the Casimir cavity conditions, the number of
atoms experiencing a large change in ZP field density was reduced substantially. Thus, the amount of
power radiated by the atoms passing through the membrane was reduced.
Atoms may need to undergo a collision in order to radiate power. Since we were running our
experiments at low pressure (several torr), the mean-free path length of the gas atoms inside the
cavity is on the order of 10 µm, which exceeds the dimension of the cavity itself. This means a
fraction of the atoms could have passed through the cavity undisturbed, retaining their electrons in
their initial unperturbed states without radiating any power.
Because the underlying SED theory is still under development, we cannot predict precisely what
wavelengths of the ZPE field support the atomic orbitals, and hence what the optimum Casimir cavity
dimensions are for shifting the orbitals. We cannot predict the emission wavelengths, and so the majority
of the emission may lie outside the range of our detector. There may be other factors that can influence
the change in the orbital size inside the Casimir cavity. Therefore the fact that the measured power was far
107
below that expected from ZP energy-induced radiation does not disqualify that as a possible source for the
observed radiation.
4. Conclusions
A clear infrared signal has been measured for gases flowing through polycarbonate Casimir cavity
nanotubes, both when uncoated and when coated with gold. The signal was obtained for all gases tested,
N2, Ar, Xe and He. In an attempt to explain the results in terms of conventional thermodynamics, we
analyzed them to see if Joule-Thomson cooling, frictional heating, adsorption/absorption heating, or
turbulence could account for the results. None of these clearly fit the data, but it is possible that a
combination of effects could. At this point it appears that ZP energy extraction from the quantum vacuum
remains a possible explanation for the observed radiation. More experimental work will be required to
determine if this is the correct explanation.
Acknowledgements
Many thanks to B. Haisch for illuminating discussions about vacuum energy, to R. Cantwell and M. McConnell
for help with the experiments, and to B. L. Katzman for comments on the manuscript. This work was supported by
HUB Lab, and based on prior work supported by DARPA under SPAWAR Grant No. N66001-06-1-2026.
References
[1] B. Haisch and G. Moddel, "Quantum vacuum energy extraction," U.S. Patent 7,379,286, May 27, 2008.
[2] P. W. Milonni, The Quantum Vacuum. Boston: Academic Press, 1994.
[3] E. Davis, V. L. Teofilo, H. E. Puthoff, and L. J. Nickisch, "Review of experimental concepts for studying the
quantum vacuum field," in Proc. of the STAIF-2006: 3rd Symposium on New Frontiers and Future Concepts,
AIP Conf. Proc., vol. 813, 2006, pp. 1390-1401.
[4] G. Moddel, "Assessment of proposed electromagnetic quantum vacuum energy extraction methods,"
arXiv:0910.5893v1, 2009.
[5] T. H. Boyer, "Random electrodynamics: the theory of classical electrodynamics with classical electromagnetic
zero-point radiation," Phys. Rev. D, vol. 11, pp. 790-808, 1975.
[6] H. E. Puthoff, S. R. Little, and M. Ibison, "Engineering the zero-point field and polarizable vacuum for
interstellar flight," J. Brit. Interplanetary Soc., vol. 55, pp. 137-44, 2002.
[7] B. Haisch, private communication.
[8] M. Bordaga, U. Mohideen, and V. M. Mostepanenko, "New developments in the Casimir effect," Phys.
Reports, vol. 353, pp. 1-205, 2001.
108
[9] V. Mostepanenko, N. N. Trunov, and R. L. Znajek, The Casimir Effect and its Application. Oxford: Clarendon,
1997.
[10] G. L. Stephens, Remote Sensing of the Lower Atmosphere: an Introduction. New York: Oxford University
Press, 1994.
[11] D. V. Schroeder, An Introduction to Thermal Physics. San Francisco: Addison Wesley, 2000.
[12] D. Green and R. Perry, Perry's Chemical Engineers' Handbook, Eighth Edition. New York: McGraw-Hill,
2007.
[13] S. Roy and R. Raju, "Modeling gas flow through microchannels and nanopores," J. Appl. Phys., vol. 93, no. 8,
pp. 4870-4879, 2003.
[14] A. Kolmogorov, "The local structure of turbulence in incompressible viscous fluid for very large Reynolds
numbers," Proc. R. Soc. London A, vol. 434, pp. 9-13, 1991, first published in Russian in Docl.Akad. Nauk
SSSR, 1941, translated by V. Levin.