Embed Size (px)
Citation preview
Report to the Legislature
Medicaid Nursing Facility Payment System: Impacts of Case Mix Methodology to Access,
Quality of Care and Quality of Life for Nursing Facility Residents
Chapter 8, Laws of 2001, E1 Section 18(2)
October 2003
Department of Social & Health Services Aging and Disability Services Administration
Management Services Division, Office of Rates Management PO Box 45600
Olympia, WA 98504-5600 (360) 725-2512
Fax: (360) 493-9484
Office of Rates Management Washington Department of Social and Health Services
Medicaid Nursing Facility Payment System: Impacts of Case Mix Methodology to Access,
Quality of Care and Quality of Life For Nursing Facility Residents
Final Report
October 2003
1
Table of Contents
Table of Contents........................................................................................ 1
I. Forward ............................................................................................... 2
II. Executive Summary ............................................................................ 4
III. Data Collection ................................................................................. 12
IV. Nursing Facility Demographics ........................................................ 17
V. Analyses and Findings ...................................................................... 25
VI. Recommendations............................................................................. 70
VII. Definitions........................................................................................ 76
VIII. Appendix........................................................................................... 78 1. Tables and Charts.......................................................................... 78 2. Study Outline Questions ............................................................... 82 3. Facilities Receiving Case Mix Payment Since Implementation ... 84 4. Facilities Receiving Case Mix Payment For Some But Not All Of The Quarters Since Implementation ................................................. 84 5. Facilities Receiving Hold Harmless Rates Through To The Removal Of The Provision ............................................................... 87 6. Facilities Not Included In The Analyses Database ....................... 88 7. Employment Statistics .................................................................. 91 8. MDS RUG-III Medicaid Case Mix States .................................... 98 9. National Survey Statistics By State, 2001 .................................... 99 10. National Quality Measures ....................................................... 101 11. Quality Measures Brief Description ......................................... 106 12.Questionnaire Summary............................................................. 108 13. Salary and Benefit Survey ........................................................ 117 14. Bibliography ............................................................................. 120
2
I. Forward Background and Purpose of the Study An early legislative report titled, “The Nursing Home and Long-Term Care-Part I: Nursing Home Reimbursement” that was dated October 21, 1994 assessed the financial stability of the nursing home industry. The report also evaluated the adequacy of the payment system for promoting cost-effective quality of care. Concerns were expressed over the skewed distribution of rates, the large variability in rates, and the 7 to 10% increase per year in the Medicaid payment rates. The study recommended a complete overhaul of the Medicaid nursing home payment system. It further recommended that the new system include a closer link to the care needs of the residents.
The legislative report required the Aging and Adult Services Administration (now known as Aging and Disability Services Administration (ADSA)) within the Department of Social and Health Services (DSHS) to design and develop alternative methodologies for establishing nursing home payment rates. Specifically, the report required:
The department shall design and develop alternative methods for matching nursing facility payments to patient care needs, while providing incentives for cost control and efficiency. The department is to consult with the nursing facility provider associations, consumer groups, and the legislative budget committee in the design and development of these alternative methods. The department shall report to the fiscal and health care policy committees of the legislature on the projected benefits and costs of these alternative methods by October 15th of 1995, 1996 and 1997. The October 1996 report shall additionally include a recommended timeline for implementing the new payment system no later than July 1, 1998.
ADSA convened a small work group comprised of members appointed by nursing facility provider associations, consumer groups, the legislative budget committee and the fiscal committees of the legislature to advise on alternative payment methods. This group, known as the Nursing Facility Payment System Executive Advisory Group (EAG), studied the case mix payment methodology and assisted ADSA in making significant progress toward implementation of a case mix payment system.
In 1998, the Washington State Legislature passed the Chapter 322, Laws of 1998, which changed the Nursing Facility Medicaid Payment System by implementing case mix effective October 1, 1998. The implementation of the new payment methodology included a hold harmless provision designed to minimize any negative impact of transitioning to the new reimbursement methodology. The hold harmless provision expired on July 1, 2002 at which time case mix payments were fully implemented within the state.

3
Section 18(2), ch. 8, Laws of 2001, 1st sp. s. required DSHS to contract with an independent and recognized organization to study and evaluate the impact of case mix Medicaid payment implementation on access, quality of care and quality of life for nursing facility residents, and the wage and benefit levels of all nursing facility employees.
ADSA contracted with Myers and Stauffer LC to complete the required study. The awarded contract is a continuation of an engagement with Myers and Stauffer that began in April 2000 during the hold harmless phase of implementation. The extension in completion of the final report was to allow more facilities to operate under case mix established payment and to report the resulting operational impacts on cost reports ended December 31, 2002.
Deliverables for the continuation of this contract included a study outline, two interim reports and a final report. This is the final report provided under this contract.
About Myers and Stauffer LC Myers and Stauffer LC, a nationally based accounting firm, specializes in health care consulting. We have consulted on payment issues for long term care facilities, home health agencies, hospitals, federally qualified health centers, rural health clinics and pharmacy providers for Medicaid programs in 36 states.
Myers and Stauffer is at the forefront of developing and implementing the case mix payment approach, which is used in Washington. Our staff has assisted in the development of case mix payment systems for the states of Kansas, Pennsylvania, Indiana, Idaho, Colorado, Montana, Kentucky, Iowa, and Louisiana. Also, the firm has consulted in the states of Hawaii, Georgia, North Dakota, New Hampshire, Nevada and North Carolina on case mix-related issues. Myers and Stauffer developed the Minimum Data Set (MDS) manual for swing bed providers and training material for the reduced-burden prospective payment form (MPAF) and updated the Resident Assessment Instrument (RAI) manual for the Centers for Medicare and Medicaid Services (CMS).
4
II. Executive Summary Background This report evaluates the impact of the Nursing Facility Medicaid Case Mix Payment System on resident access, quality of care, quality of life, and wage and benefit levels of nursing facility employees. Case mix has become a familiar term in the health care field. The “case” in case mix refers to nursing facility residents. The resident cases are classified based on characteristics (e.g., functional status, clinical condition). The term “mix” refers to the combination of different types of residents cared for in a facility.
The overall purpose of case mix classification is to provide a reliable and systematic method to determine the variation of nursing care time among residents. The Resource Utilization Group Version III (RUG-III), developed during a federal multi-state demonstration project, is considered state of the art in classification systems. The case mix classifications used in payment provide a link between rates and predicted resources needed to serve different types of residents. Case mix payment systems should recognize and adjust payment for higher levels of nursing services thus, if not providing incentive, at least minimizing concern over accepting individuals requiring more complex care.
Because of the broad language in Medicaid, each state has developed its own unique payment methodology. Currently 26 states have implemented some form of RUG-based case mix for their Medicaid program. Also, the RUG-III methodology is the basis for the Medicare Skilled Nursing Facility Prospective Payment System (PPS), which started the phased-in implementation in 1998.
Methods used to set the July 2002 nursing facility Medicaid payment rates were established in the c. 8, Laws 2001, 1st sp.s., ch. 74.46 RCW, and ch. 388-96 WAC. Like the initial case mix payment rates implemented effective October 1, 1998, the July 2002 rates were composed of seven rate components: direct care, support services, therapy care, operations, property, financing allowance and variable return. The direct care rate component comprises approximately 55% of the total rate and covers salaries, wages, payroll taxes and benefits for nursing, social services, activities, consulting, and other direct patient care staff; nursing supplies; medical records specialists; and consulting for medical directors and pharmacists. It was adjusted by a case mix index (CMI) from RUG reports for the first quarter of 2002.
The foundation upon which Washington began the case mix development was “equitable Medicaid payments for nursing facilities by matching payments to patient/resident care needs; providing incentives for cost control and efficiency by reducing nursing facility utilization by residents with light care needs, and

5
creating incentives to encourage nursing facilities to admit residents with complex care needs.”
Data Sources and Methods During the study, we compared data collected for the periods prior to full implementation of the case mix payment with data collected since full implementation effective July 1, 2002. Data sources for the report included literature reviews, interviews and questionnaires, surveys of other case mix states, facility salary and benefit surveys, MDS assessments, cost reports and rate calculations, state survey findings, and quality measures.
Since the implementation of the case mix payment system did not occur in a vacuum, we evaluated and where necessary accounted for various demographic and program considerations.
General Recommendation
As a result of our review, we recommend continuing the current methodology with the possible addition of incentives structured to assist in meeting the goals of access and quality.
The impetus for the current case mix system began as early as 1994. The system was designed and developed over several years with input from various stakeholders and interested parties. Full implementation of the system is currently only in the second year of payment. The interviews and questionnaire responses provided mixed opinions concerning the impact of case mix. Our comparisons of the available data for the time periods under consideration suggest no negative impact on access, quality of care, quality of life, or wage and benefit levels.
Case mix payment systems are complex and stakeholder goals may sometimes be conflicting. Although a given payment methodology cannot address all issues or solve all problems, systems should be developed to attain as many goals and objectives as possible. One way to encourage specific behavior is through incentive programs added to the basic rate calculation. Several incentives are discussed and could be implemented individually or as part of an overall access and quality program structured to address legislative goals.
Given the length of time to develop and implement the case mix system, the relative newness of the methodology and the lack of negative findings, we recommend continuing the methodology with the possible addition some of the incentives discussed in this report.
Many states are currently experiencing fiscal crisis making enhancement to systems difficult. Implementation of the discussed changes to the methodology without changing funding levels would reallocate available dollars. Although additional funding would make implementation of incentives easier, a budget neutral requirement should not preclude the
6
adjustments to the methodology. Any reallocation would have to be evaluated and monitored to assure that the desired incentives within the system were attained and maintained.
Analyses and Findings Access is defined as the ability of individuals seeking assistance and care to obtain appropriate services in the least restrictive environment available (or in a setting that reflects their personal preferences while meeting their needs for care). For the evaluation of this issue, we interviewed individuals directly involved in placing clients in nursing facilities as well as other interested parties.
To understand access to care by residents with varying levels of acuity, we evaluated the distribution of residents within nursing facilities, measured by the RUG-III classification system. We evaluated the distribution of resident assessments at admission using admission assessments; the distribution of all nursing facility residents using the most currently available assessment; and the distribution of Medicaid residents using Medicaid assessments, identified by responses on the MDS.
We attempted to obtain statistical data maintained on specific placement issues, for example, data on difficulties in placing individuals in nursing facilities, hospital backup information, or special arrangements that are negotiated to accommodate placement of difficult to place individuals. We found that no data is compiled. With the exception of occasional issues with obese individuals or individuals with behavior problems, placement does not appear to be a significant problem.
Using occupancy rates as an indicator of access, we reviewed occupancy by city, county and survey region and estimated available beds based on current occupancy rates and census data.
Although the interviews and questionnaires identified the feeling that placement of individuals in nursing facilities is either unchanged or harder now, requiring longer time and more effort, there is mixed opinion as to cause. It was noted that the same types of residents, who are difficult to place now, were also difficult to place prior to the implementation of case mix.
A review of available information, occupancy statistics and MDS data coupled with the lack of placement problem statistics suggest no major access issues. When looking at the types of residents being admitted to the facility and the make-up of the general population, we see some positive changes, which may be linked to the case mix system.
An evaluation of RUG distributions for admission assessments shows there has been an increase in the percentage of admission assessments that classify in the Extensive Services category and a reduction in the percentage of assessments that classify in the Reduced Physical Functioning category. This suggests more admissions of heavier care individuals compared to fewer
A C C E S S
7
admissions of lighter care individuals. This shift can also be seen when evaluating all assessments and Medicaid only assessments.
The one area of concern may be with individuals whose assessments classify as Behavioral or Cognitively Impaired. The Behavioral category reduced from 1.15% of the Medicaid population in the 1st quarter of 2000 to .71% in the 4th quarter of 2002, while resident assessments that classify as Impaired Cognition have reduced from 19.01% to 15.41%.
Recommendations
Consider developing exceptional rate criteria
Consider incentives for cognitive impairment and behavior problems
Continue to develop and encourage alternative services
The data supports a finding that access is not a major problem, with the exception of occasional issues with obesity or behavioral problems requiring special arrangements or negotiated rates in an alternate setting. Because of these occasional issues the state may want to consider developing exceptional rate criteria linked to the RUG-III classification to improve nursing home access for these few cases.
Also, comments concerning placement issues with the cognitively impaired or those with behavioral problems and the reduction of assessments coded in those RUG-III categories, may suggest an issue with the current case mix weights for those categories.
Several states, asserting that there was not sufficient weight given to these areas in the RUG methodology, increased the weights in the payment portion of the calculation. In Georgia, there was also concern over residents with cognitive impairments. Using the Cognitive Performance Scale (CPS), rate adjustments were developed to address this concern.
Washington should monitor access for the impaired cognition and behavioral categories and in the future, should it become an increased concern, the state may want to consider either adding weight to the CMI or developing other incentives.
Although not directly linked to nursing facility case mix payment, the state should continue its efforts to develop and encourage alternative services in order to serve Washington’s frail elderly population in the least restrictive setting possible.
Analyses and Findings For this evaluation, we deferred to the federal standards to define quality of care. In 42 CFR 483.25 it requires that each resident must receive, and the
Q U A L I T Y O F
C A R E

8
facility must provide, the necessary care and services to attain and maintain the highest practicable physical, mental and psychosocial well-being, in accordance with the comprehensive assessment and plan of care.
A reimbursement methodology by itself will not ensure quality of care, however, a system that distributes program dollars based on resident care needs should assist facilities in attaining and maintaining acceptable quality of care levels.
Initial interviewees were asked to compare periods prior to the implementation of the case mix system in 1998 with periods following implementation. This questionnaire asked people to compare periods prior to full implementation of case mix to periods following the sunset of the hold harmless provisions. The majority of respondents to both the interviews and the questionnaires felt the quality of care was basically unchanged.
This belief is supported by the available data found in the review of cost reports from 1994 to 2002 and the nursing home compare site at http://www.medicare.gov/NHCompare/Search/. In Washington, the level of hours of direct nursing per resident day has remained basically unchanged since 1994 when it averaged 4.23 hours per resident day. As reported on the nursing home compare website using survey data reported in 2002 and 2003, Washington facilities average a total of 4.2 hours of nursing per resident day.
That is slightly higher than the United States average of 3.9 hours or the National Citizen’s Coalition recommendation of 4.13 hours. Within the state, the levels vary from an average of 3.9 in State Survey Region 5 to an average of 4.38 in State Survey Region 2.
As reported on the cost reports, the amount of direct care spending per resident day increased from an average of $62.06 in 2001 to an average of $65.20 in 2002 or by approximately 5%. This increase is higher than the inflation rate, but consistent with prior year increases.
Although current case mix weights are higher for RUG categories with restorative nursing than comparable categories without, the percent of residents receiving restorative nursing decreased from 16% in the first quarter of 2000 to slightly less than 13% in the last quarter of 2002.
The number of health care deficiencies, although higher than the national average, is lower than reported in prior years and the quality measures, indicators measured using MDS data and reported through a national quality initiative, are comparable to other states in the region and the United States. This data is submitted by the facilities and state variations can be due to facility interpretation, training and impact of MDS verification programs.
Recommendations
Consider restorative nursing incentive
9
Consider quality of care incentive program Monitor changes and improvements to the PPS RUG calculation
Several states have felt that there was insufficient weight given to the areas of the RUG methodology linked to restorative nursing. Restorative or rehabilitation services can assist in restoring or maintaining functional status or delaying declines in health due to degenerative conditions. These states added increased weight in the payment portion of the calculation to the appropriate categories to serve as a quality incentive and encourage restorative nursing. Washington may want to consider implementation of a similar increase in weights to be an incentive to increase restorative nursing.
At this time, the rate methodology in the aggregate does not appear to have an impact on quality either positively or negatively. In addition to maintaining the case mix methodology, the state may want to consider implementing a quality incentive, such as the accountability measures program implemented in Iowa.
CMS is to evaluate the RUG system used in the PPS and recommend improvements. The state will want to monitor these efforts and potentially incorporate changes into the state payment methodology if determined appropriate.
Analyses and Findings The appraisal of one’s quality of life could be as varied as the individuals residing in the nursing facilities. A survey performed by the Jim Lehrer News Hour in partnership with the Kaiser Family Foundation, found that of people who had direct experience with nursing facilities, 72% believed that nursing facilities provided a safe and protected environment for the frail elderly and disabled, and 62% believed that nursing facilities had caring concerned staff.
Given the difficulty of defining quality of life, we again deferred to federal standard 42 CFR 483.15, which requires facilities to provide (a) dignity, (b) self-determination, (c) participation in resident and family groups, (d) participation in other activities, (e) accommodation of needs, (f) availability of facility provided activities, (g) social services and (h) a safe, clean, comfortable, and homelike environment. Quality of life is further defined in CFR 483.13(a) as freedom from chemical or physical restraints.
The majority of respondents to both the interviews and the questionnaires felt that either the quality of life was basically unchanged, had improved slightly, or had improved significantly. Approximately 16% felt quality of life had declined, while 10.5% did not have an opinion. Again opinions are mixed on the linkage between quality of life and the case mix method of payment.
Quality of care and quality of life are integrally linked. If inadequate care were provided, it would be difficult to maintain a good quality of life. Given the link, our evaluations and recommendations are the same or similar. Questions
Q U A L I T Y O F
L I F E

10
asked in the quality of care discussion were also asked about quality of life. Please refer to the discussion on these items in the prior discussion of quality of care.
Recommendations
Consider quality of life incentive program
Continue to develop and encourage alternative services
Although there is belief that quality of life has improved in nursing facilities, there is a question as to the relationship of the change and the case mix payment methodology. When evaluating the quality measures and survey deficiencies, the rate methodology does not appear at this time to have an impact either positively or negatively. In addition to maintaining the case mix methodology, the state may want to consider implementing a quality incentive, such as the accountability measures program implemented in Iowa.
As most individuals value their autonomy, living in the least restrictive setting possible should add to a person’s quality of life. For this reason, the state should continue efforts to develop and encourage alternative services.
Analyses and Findings The RUG-III indices were developed using salary weighted professional nursing and aide time expended while caring for nursing facility residents. The analyses address the question of whether or not incorporating a calculation that recognizes these differences into the rate has impacted staffing hours or dollars. In addition to evaluating nursing hours per resident day and direct care costs, as reported on the cost reports, we developed and distributed a salary and benefit survey to all nursing facilities within the state. We also included questions about wages and benefits in the questionnaire.
Although the nursing home industry reports increasing difficulty in the recruitment and retention of qualified staff, the levels of per diem direct care nursing have not changed significantly. Also when comparing composite salaries derived from cost reports or from the wage and benefit survey with a composite derived from data reported from the Bureau of Labor Statistics, it appears that in most state survey regions, salaries, although not on the high side, are comparable.
Also the Washington July 2002 Medicaid rates included a low-wage worker add-on to the rate. Per Section 206 (13) of the 2001-2003 Omnibus Budget, facilities received rate add-ons equal to .06% of their direct care rate to increase wages for the low-wage worker.
Recommendations
Consider a staff retention incentive
W A G E A N D
B E N E F I T
L E V E L S
11
According to a recent United States General Accounting Office (GAO) report on the Emerging Nurse Shortages Due to Multiple Factors, there has been a decrease of 4.9% in registered nurses per 100,000 population employed in Washington between 1996-2000.
Another GAO report, “Nursing Homes: Quality of Care More Related to Staffing than Spending”, states that Medicaid payment policies influence spending by encouraging spending on resources that most directly affect resident care and well-being, like nursing services. States encourage spending on nursing care by applying higher limits or ceilings to the direct care cost component. Washington further encourages a minimum level of spending for direct care by recouping funds if not spent.
Given that there is a national nursing shortage, that facility staffing levels are directly linked to quality of care, and that payment policies can be used to influence spending, the state may want to consider implementing some form of staffing incentive payment.
The relationship between quality and staffing is complex. Factors such as management, tenure, training, retention and turnover affect both quality of care and cost. A high turnover rate, particularly among nursing aides, is a particular concern as the CNA provide the majority of direct hands on care. This not only has implications for the care provided, but it is expensive. According to the 2002 AHCA Survey of Nursing Staff Vacancy and Turnover in Nursing Homes, staff turnover is estimated to cost approximately 4 months of an employee’s salary to train and recruit replacements, which reduce funds available to hire additional staff.
We would recommend any staffing incentive be structured to reward retention of staff.
12
III. Data Collection Literature reviews Many studies have been performed and articles written about the case mix method of reimbursement, system development and evaluations. We have reviewed many of these documents in the course of performing this evaluation. A bibliography is included in Appendix 14.
Interviews It was anticipated that interviewing individuals directly involved in placing clients in nursing facilities would help the Department determine if the new case mix system had any affect on the placement of certain populations in nursing facilities. Questions were developed by Myers and Stauffer and approved by the Department.
Individuals involved in placing residents in nursing facilities, working both prior to the October 1998 implementation of the case mix system and following the implementation of the payment system, were interviewed. The interviews were to determine if there had been a noticeable impact of the new payment system on access, quality of care or quality of life between the period prior to case mix implementation and the period post implementation.
ADSA provided Myers and Stauffer with a list of individuals to interview who had knowledge of the nursing facility industry during the study timeframes. This list included hospital discharge planners, advocates, provider association representatives, Home and Community Services (HCS) staff, and directors from various Area Agencies on Aging (AAA) representing all regions of the state.
The interview list consisted of 51 individual names. From the list provided, 40 interviews were conducted for a 78% interview completion rate.
Thirty of the individuals interviewed represented discharge planners and HCS staff from six regions in the state, the other 10 represented the provider associations, advocates and staff from various AAA’s.
Questionnaire Given the continuation of the study and the fact that the original interview responses were free flowing and could not be tabulated, a follow-up questionnaire was developed. It used the same questions as those asked in the original interviews but crafted to allow for aggregation and tabulation of the responses. A summary of the completed questionnaire is included in Appendix 12 of this report.
Of the 40 individuals originally interviewed, 25 agreed to participate in the follow-up questionnaire. Fifteen were no longer involved or unavailable to
13
complete the questionnaire. The Department added an additional seven names of individuals who agreed to participate in the questionnaire.
Questionnaires were faxed to the 32 individuals identified. This list included community nurse consultants, social workers and registered nurses working for HCS, as well as hospital discharge planners. Six other interested parties were also included.
Unfortunately, the nursing home associations chose to not encourage their membership to participate in the data collection for this report. Twenty-two questionnaires were returned (1 was only partially completed) for a response rate of 66%.
Statistical Data on Nursing Facility Placement We attempted to obtain statistical data maintained by the state on placement issues. For example, data on difficulties in placing individuals in nursing facilities, hospital backup information, or special rates that are negotiated to accommodate placement of difficult to place individuals. We found that no data is compiled, as it does not appear to be a problem. Occasionally obesity or behavior problems are an issue, but it is rare. In those instances, the state is currently negotiating an exceptional rate in alternative settings or providing specialized equipment or additional services outside the nursing home rate.
Minimum Data Set and Case Mix Information The Omnibus Budget Reconciliation Act of 1987 (OBRA ’87) mandated the development of the RAI for individuals residing in nursing facilities. The tool was required by law to produce a “comprehensive, accurate, standardized and reproducible assessment of each resident’s functional capacity.” The MDS, a resident assessment and care-planning instrument, was developed for use in all Medicaid and Medicare-certified facilities. Nursing facilities have been completing the MDS since October 1990. In Washington, facilities began submitting data to the state prior to the June 1998 implementation of the CMS data collection system.
Initially, following approval from the DSHS, Human Research Review Board, we received MDS assessment data for the time periods, January 1, 1998 to June 30, 1998 and January 1, 2000 to June 30, 2000. The data for both time periods were provided on a compact disc in Microsoft Access 2000.
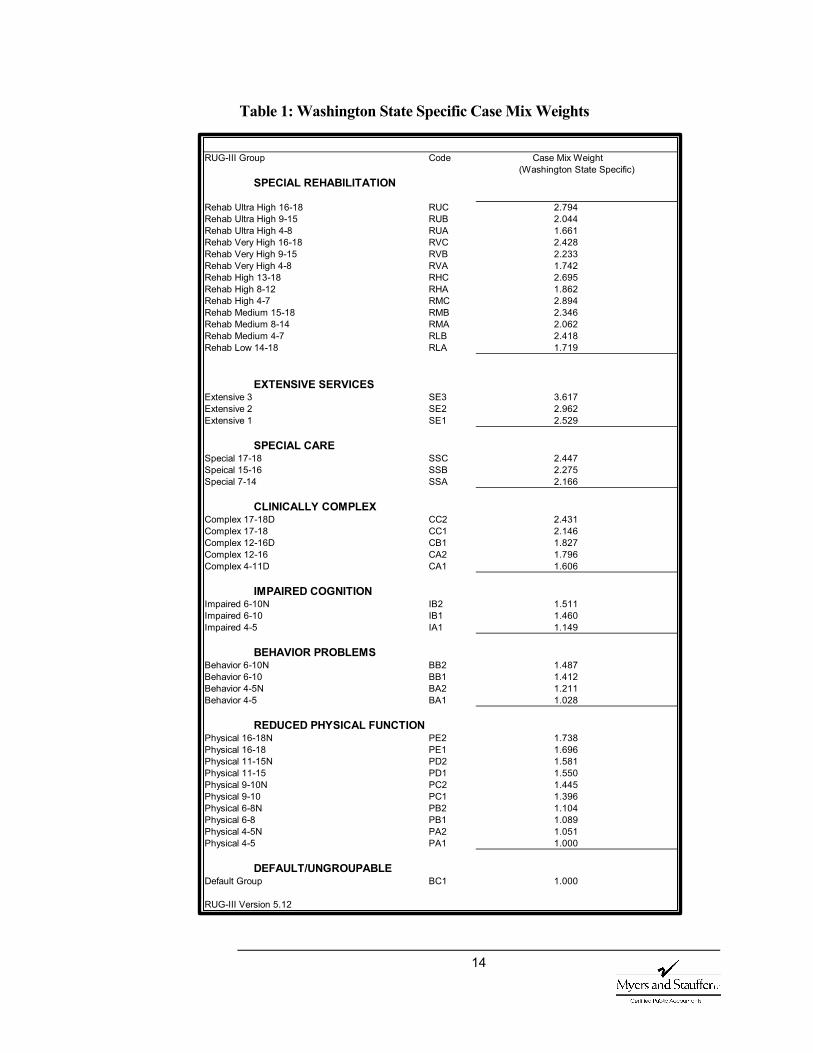
Recent data collection efforts included obtaining calendar year 2002 MDS information. This data was obtained in the same format as the previous data. All MDS assessment data was analyzed, including calculating RUG-III classification scores and the cognitive impairment (CPS) scores. Using the calculated RUG score, we assigned case mix weights based on Washington state specific weights detailed in the following table.
14
Table 1: Washington State Specific Case Mix Weights
RUG-III Group Code
SPECIAL REHABILITATION
Rehab Ultra High 16-18 RUC 2.794Rehab Ultra High 9-15 RUB 2.044Rehab Ultra High 4-8 RUA 1.661Rehab Very High 16-18 RVC 2.428Rehab Very High 9-15 RVB 2.233Rehab Very High 4-8 RVA 1.742Rehab High 13-18 RHC 2.695Rehab High 8-12 RHA 1.862Rehab High 4-7 RMC 2.894Rehab Medium 15-18 RMB 2.346Rehab Medium 8-14 RMA 2.062Rehab Medium 4-7 RLB 2.418Rehab Low 14-18 RLA 1.719
EXTENSIVE SERVICESExtensive 3 SE3 3.617Extensive 2 SE2 2.962Extensive 1 SE1 2.529
SPECIAL CARESpecial 17-18 SSC 2.447Speical 15-16 SSB 2.275Special 7-14 SSA 2.166
CLINICALLY COMPLEXComplex 17-18D CC2 2.431Complex 17-18 CC1 2.146Complex 12-16D CB1 1.827Complex 12-16 CA2 1.796Complex 4-11D CA1 1.606
IMPAIRED COGNITIONImpaired 6-10N IB2 1.511Impaired 6-10 IB1 1.460Impaired 4-5 IA1 1.149
BEHAVIOR PROBLEMSBehavior 6-10N BB2 1.487Behavior 6-10 BB1 1.412Behavior 4-5N BA2 1.211Behavior 4-5 BA1 1.028
REDUCED PHYSICAL FUNCTIONPhysical 16-18N PE2 1.738Physical 16-18 PE1 1.696Physical 11-15N PD2 1.581Physical 11-15 PD1 1.550Physical 9-10N PC2 1.445Physical 9-10 PC1 1.396Physical 6-8N PB2 1.104Physical 6-8 PB1 1.089Physical 4-5N PA2 1.051Physical 4-5 PA1 1.000
DEFAULT/UNGROUPABLEDefault Group BC1 1.000
RUG-III Version 5.12
(Washington State Specific)Case Mix Weight
15
Staffing, Deficiency and Quality Measures We obtained information from the Nursing Home Compare website sponsored by the CMS:
http://www.medicare.gov/NHCompare/Search/
This website provides detailed information about the performance of every Medicare and Medicaid certified nursing facility in the country. It includes information about the facility, such as number of beds and type of ownership; about the residents, including statistics on the CMS new quality measure initiative; nursing home inspection results including a side-by-side comparison of the total number of deficiencies the State Survey Agency found during the last three inspections; and nursing facility staffing per resident day. Quality measures report nursing facility resident functional status, pressure sores, pain, restraints, infections, and delirium. The quality measures are divided between residents in facilities for short stays and residents with stays of longer duration.
Cost Reports and Rate Calculations Cost reports are prepared in a standard manner and form that was determined by ADSA. These cost reports are prepared in accordance with generally accepted accounting principles and are intended to accurately reflect the revenues and expenditures of the nursing facility. The reports also include information on ownership, occupancy and staffing hours.
This information is examined, adjusted (where appropriate), and used to establish the rate components. We obtained public disclosure disks containing cost report data files for 1994, 1995 and 1996 data that serves as the basis for the October 1, 1998 case mix rates. We also received a series of emails that included the 2000 cost report information, the original post implementation study period. Following delivery of some information for the first interim report, the data collection was expanded to include cost data for 1997, 1998, 1999, 2001 and 2002. This expansion more than doubled the amount of data to be studied.
For longitudinal analyses, the data for the various years were merged into a common database. Over the eight-year period there have been changes in ownership, changes in licensee, tax reorganizations, changes in certification, facility closures and replacement facilities. In addition to the increase in data to be manipulated, an initial challenge was linking the data by name and vendor ID.
After linking the cost report information by facility names and vendor numbers, and eliminating any facility without a cost report available in all years in the evaluation period, the database contained information on 204 providers. (This was reduced from the number in the second interim report due to several voluntary facility closures.) As before, Bailey Boushay House is excluded from the analyses as an atypical facility. This exclusion results in an analyses database of 203 facilities. Lists of facilities included and excluded from the analyses are in Appendix 3-6.
16
Survey of Case Mix States To better understand case mix payment methodologies currently implemented, we surveyed 23 of the states that employ a case mix payment system. Three additional states have implemented case mix reimbursement since the survey. A list of all states using RUG-based case mix is included in Appendix 8.
The survey included a description of each acuity-based classification system and payment methodology, the method for developing case mix indices, a definition of the direct care cost components, details on the rate setting for the direct care component and a discussion on any verification procedures in place.
Salary and Benefit Survey The nursing facility industry reports increasing difficulty in the recruitment and retention of qualified staff, and we understand that the wage and benefit analysis is a priority of the task force.
The cost report provides summary data on staffing costs and hours of service. We also distributed a provider survey to collect more detailed information on salary and benefit levels. A copy of the survey is included in Appendix 13. Unfortunately, the nursing home associations chose to not encourage their membership to participate in the data collection for this report.
We did receive completed surveys from approximately 16% of the facilities, with a varying response rate per state survey region. The results of this survey were evaluated both statewide and by region.
Additional Sources Other sources of data and information include various ADSA reports, the Revised Code of Washington, DSHS News in Brief archived reports, Washington’s Interactive Labor Market Access (WILMA), and the US Census Bureau.
17
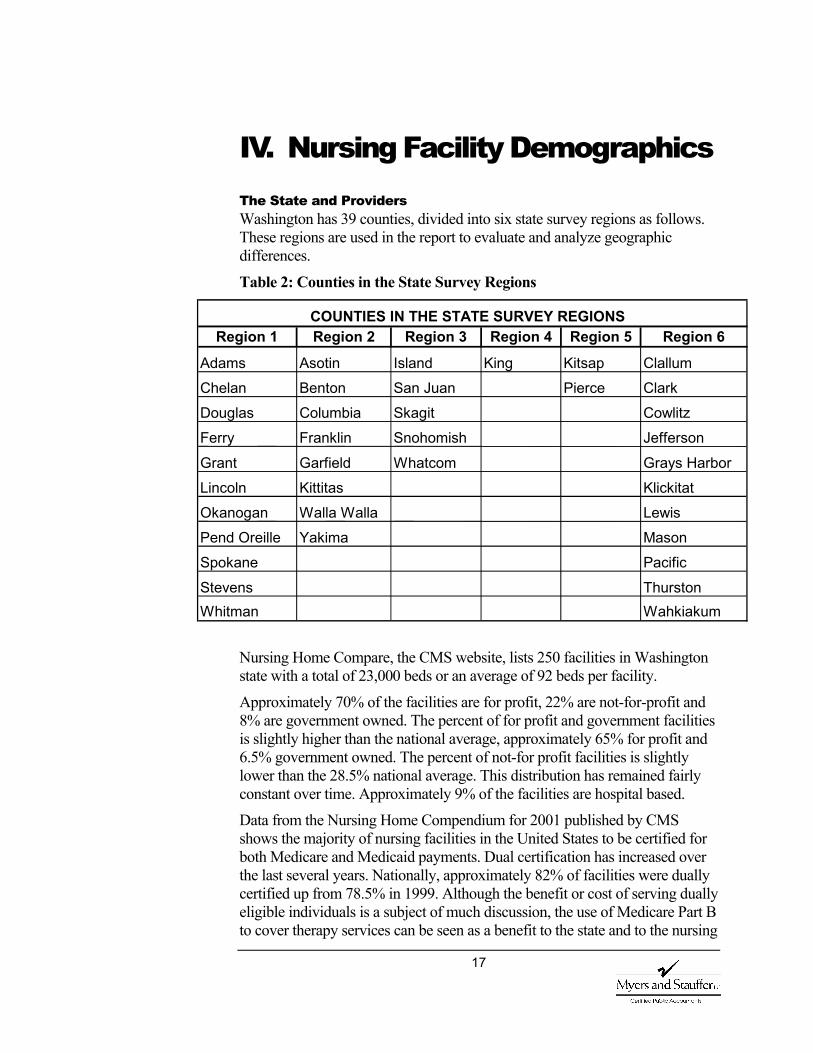
IV. Nursing Facility Demographics The State and Providers Washington has 39 counties, divided into six state survey regions as follows. These regions are used in the report to evaluate and analyze geographic differences.
Table 2: Counties in the State Survey Regions
Nursing Home Compare, the CMS website, lists 250 facilities in Washington state with a total of 23,000 beds or an average of 92 beds per facility.
Approximately 70% of the facilities are for profit, 22% are not-for-profit and 8% are government owned. The percent of for profit and government facilities is slightly higher than the national average, approximately 65% for profit and 6.5% government owned. The percent of not-for profit facilities is slightly lower than the 28.5% national average. This distribution has remained fairly constant over time. Approximately 9% of the facilities are hospital based.
Data from the Nursing Home Compendium for 2001 published by CMS shows the majority of nursing facilities in the United States to be certified for both Medicare and Medicaid payments. Dual certification has increased over the last several years. Nationally, approximately 82% of facilities were dually certified up from 78.5% in 1999. Although the benefit or cost of serving dually eligible individuals is a subject of much discussion, the use of Medicare Part B to cover therapy services can be seen as a benefit to the state and to the nursing
Region 1 Region 2 Region 3 Region 4 Region 5 Region 6
Adams Asotin Island King Kitsap ClallumChelan Benton San Juan Pierce ClarkDouglas Columbia Skagit CowlitzFerry Franklin Snohomish Jefferson
Grant Garfield Whatcom Grays HarborLincoln Kittitas KlickitatOkanogan Walla Walla LewisPend Oreille Yakima MasonSpokane Pacific
Stevens ThurstonWhitman Wahkiakum
COUNTIES IN THE STATE SURVEY REGIONS
18
facility population. Washington has fewer facilities certified Medicare-only, 1.12% in 2001 compared to 6.39% nationally and all Medicaid facilities must be dually certified. According to RCW 74.46.660, Conditions of Participation, in order to participate in the nursing facility Medicaid payment system in Washington, a facility must, in addition to other requirements, obtain and maintain Medicare certification, under Title XVIII of the Social Security Act, 42 U.S.C. Sec. 1395, as amended, for a portion of the facility’s licensed beds.
The US Census Bureau for 2000 reports the total population of Washington as 5,894,121 with an average of 10.6% living in poverty and 11.2% over age 65.
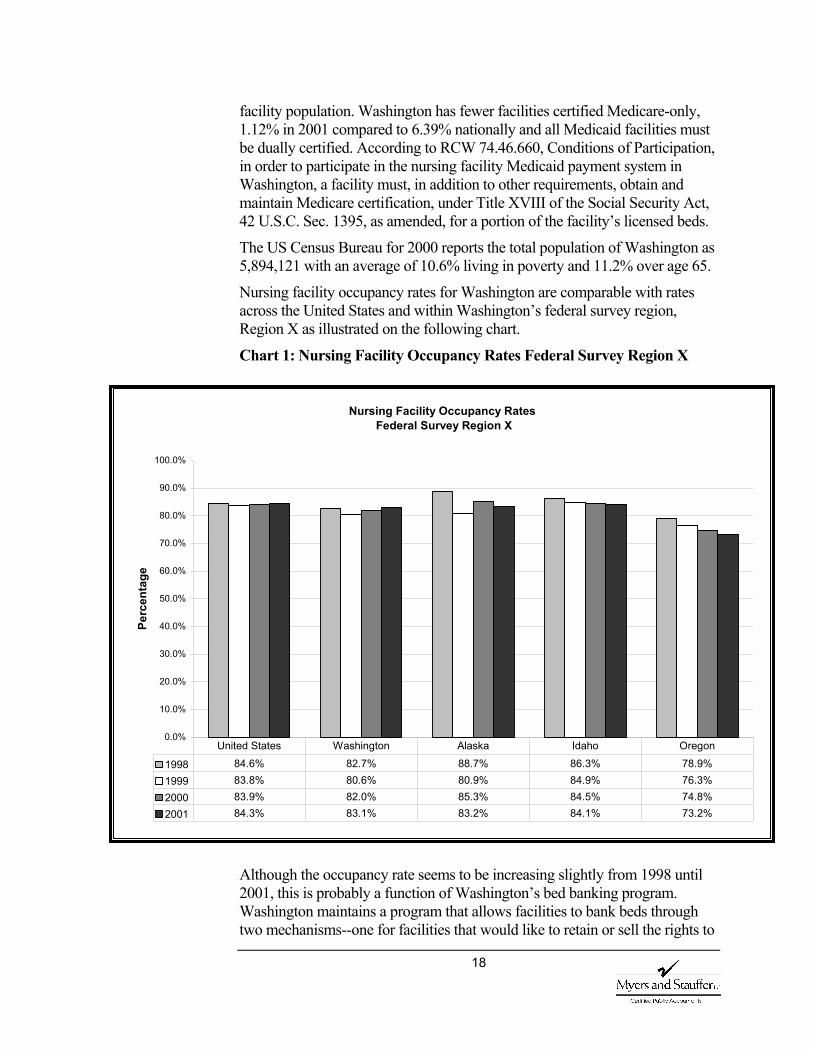
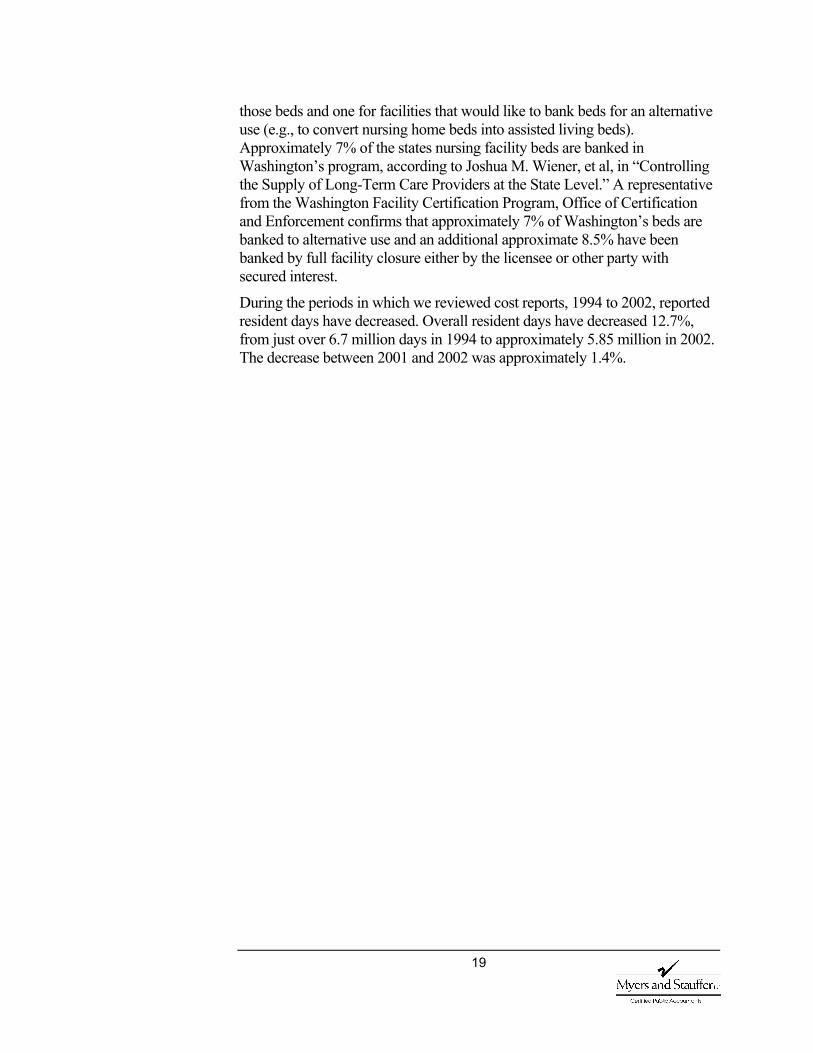
Nursing facility occupancy rates for Washington are comparable with rates across the United States and within Washington’s federal survey region, Region X as illustrated on the following chart.
Chart 1: Nursing Facility Occupancy Rates Federal Survey Region X
Although the occupancy rate seems to be increasing slightly from 1998 until 2001, this is probably a function of Washington’s bed banking program. Washington maintains a program that allows facilities to bank beds through two mechanisms--one for facilities that would like to retain or sell the rights to
Nursing Facility Occupancy Rates Federal Survey Region X
0.0%
10.0%
20.0%
30.0%
40.0%
50.0%
60.0%
70.0%
80.0%
90.0%
100.0%
Perc
enta
ge
1998 84.6% 82.7% 88.7% 86.3% 78.9%1999 83.8% 80.6% 80.9% 84.9% 76.3%2000 83.9% 82.0% 85.3% 84.5% 74.8%2001 84.3% 83.1% 83.2% 84.1% 73.2%
United States Washington Alaska Idaho Oregon
19
those beds and one for facilities that would like to bank beds for an alternative use (e.g., to convert nursing home beds into assisted living beds). Approximately 7% of the states nursing facility beds are banked in Washington’s program, according to Joshua M. Wiener, et al, in “Controlling the Supply of Long-Term Care Providers at the State Level.” A representative from the Washington Facility Certification Program, Office of Certification and Enforcement confirms that approximately 7% of Washington’s beds are banked to alternative use and an additional approximate 8.5% have been banked by full facility closure either by the licensee or other party with secured interest.
During the periods in which we reviewed cost reports, 1994 to 2002, reported resident days have decreased. Overall resident days have decreased 12.7%, from just over 6.7 million days in 1994 to approximately 5.85 million in 2002. The decrease between 2001 and 2002 was approximately 1.4%.
20
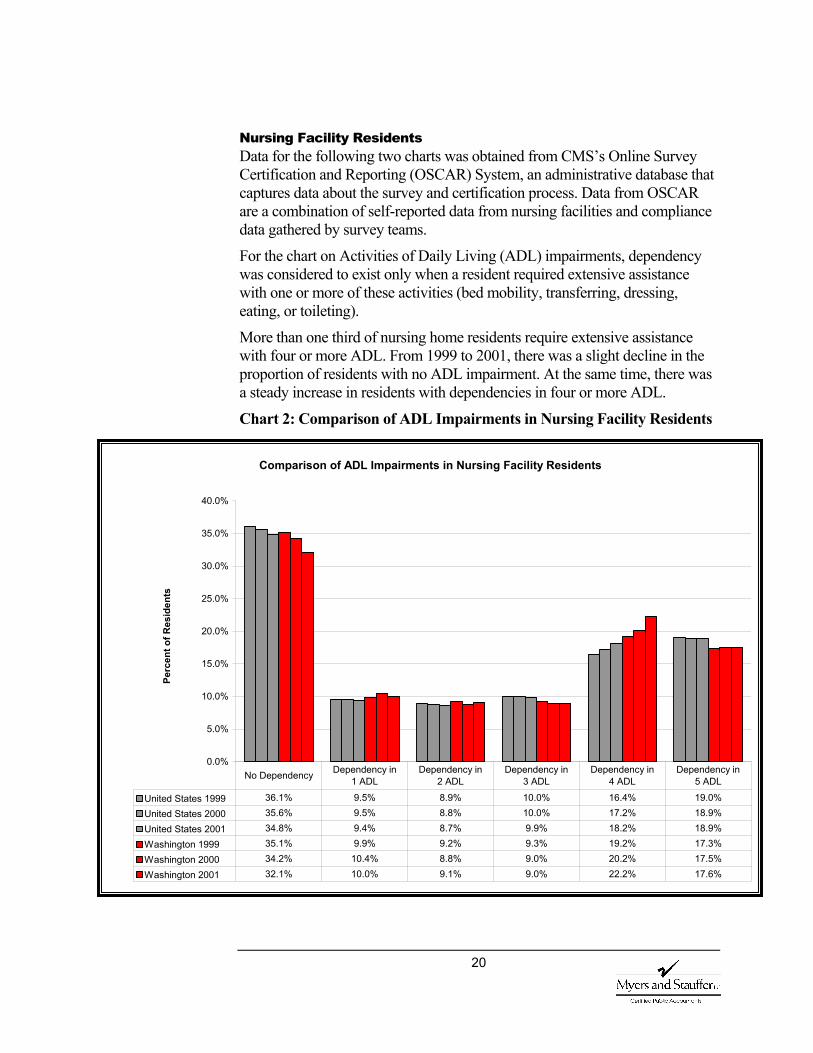
Nursing Facility Residents Data for the following two charts was obtained from CMS’s Online Survey Certification and Reporting (OSCAR) System, an administrative database that captures data about the survey and certification process. Data from OSCAR are a combination of self-reported data from nursing facilities and compliance data gathered by survey teams.
For the chart on Activities of Daily Living (ADL) impairments, dependency was considered to exist only when a resident required extensive assistance with one or more of these activities (bed mobility, transferring, dressing, eating, or toileting).
More than one third of nursing home residents require extensive assistance with four or more ADL. From 1999 to 2001, there was a slight decline in the proportion of residents with no ADL impairment. At the same time, there was a steady increase in residents with dependencies in four or more ADL.
Chart 2: Comparison of ADL Impairments in Nursing Facility Residents
Comparison of ADL Impairments in Nursing Facility Residents
0.0%
5.0%
10.0%
15.0%
20.0%
25.0%
30.0%
35.0%
40.0%
Perc
ent o
f Res
iden
ts
United States 1999 36.1% 9.5% 8.9% 10.0% 16.4% 19.0%United States 2000 35.6% 9.5% 8.8% 10.0% 17.2% 18.9%United States 2001 34.8% 9.4% 8.7% 9.9% 18.2% 18.9%Washington 1999 35.1% 9.9% 9.2% 9.3% 19.2% 17.3%Washington 2000 34.2% 10.4% 8.8% 9.0% 20.2% 17.5%Washington 2001 32.1% 10.0% 9.1% 9.0% 22.2% 17.6%
No Dependency Dependency in 1 ADL
Dependency in 2 ADL
Dependency in 3 ADL
Dependency in 4 ADL
Dependency in 5 ADL
21
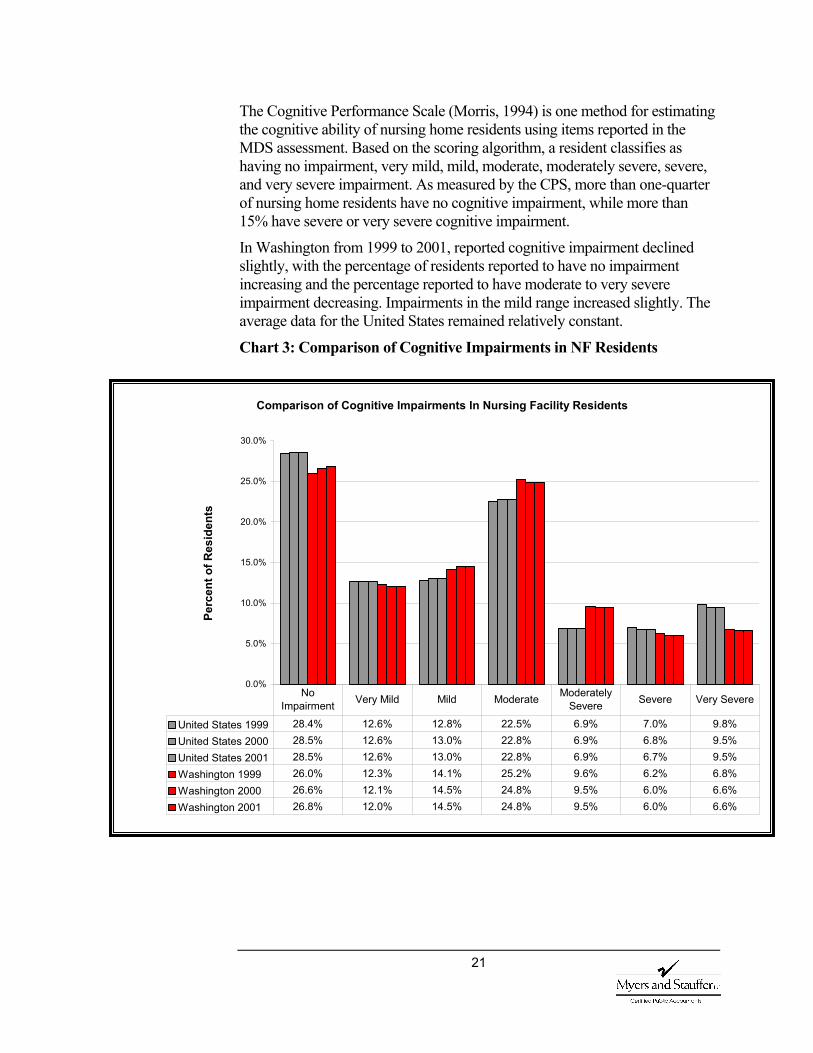
The Cognitive Performance Scale (Morris, 1994) is one method for estimating the cognitive ability of nursing home residents using items reported in the MDS assessment. Based on the scoring algorithm, a resident classifies as having no impairment, very mild, mild, moderate, moderately severe, severe, and very severe impairment. As measured by the CPS, more than one-quarter of nursing home residents have no cognitive impairment, while more than 15% have severe or very severe cognitive impairment.
In Washington from 1999 to 2001, reported cognitive impairment declined slightly, with the percentage of residents reported to have no impairment increasing and the percentage reported to have moderate to very severe impairment decreasing. Impairments in the mild range increased slightly. The average data for the United States remained relatively constant.
Chart 3: Comparison of Cognitive Impairments in NF Residents
Comparison of Cognitive Impairments In Nursing Facility Residents
0.0%
5.0%
10.0%
15.0%
20.0%
25.0%
30.0%
Perc
ent o
f Res
iden
ts
United States 1999 28.4% 12.6% 12.8% 22.5% 6.9% 7.0% 9.8%United States 2000 28.5% 12.6% 13.0% 22.8% 6.9% 6.8% 9.5%United States 2001 28.5% 12.6% 13.0% 22.8% 6.9% 6.7% 9.5%Washington 1999 26.0% 12.3% 14.1% 25.2% 9.6% 6.2% 6.8%Washington 2000 26.6% 12.1% 14.5% 24.8% 9.5% 6.0% 6.6%Washington 2001 26.8% 12.0% 14.5% 24.8% 9.5% 6.0% 6.6%
No Impairment Very Mild Mild Moderate Moderately
Severe Severe Very Severe
22
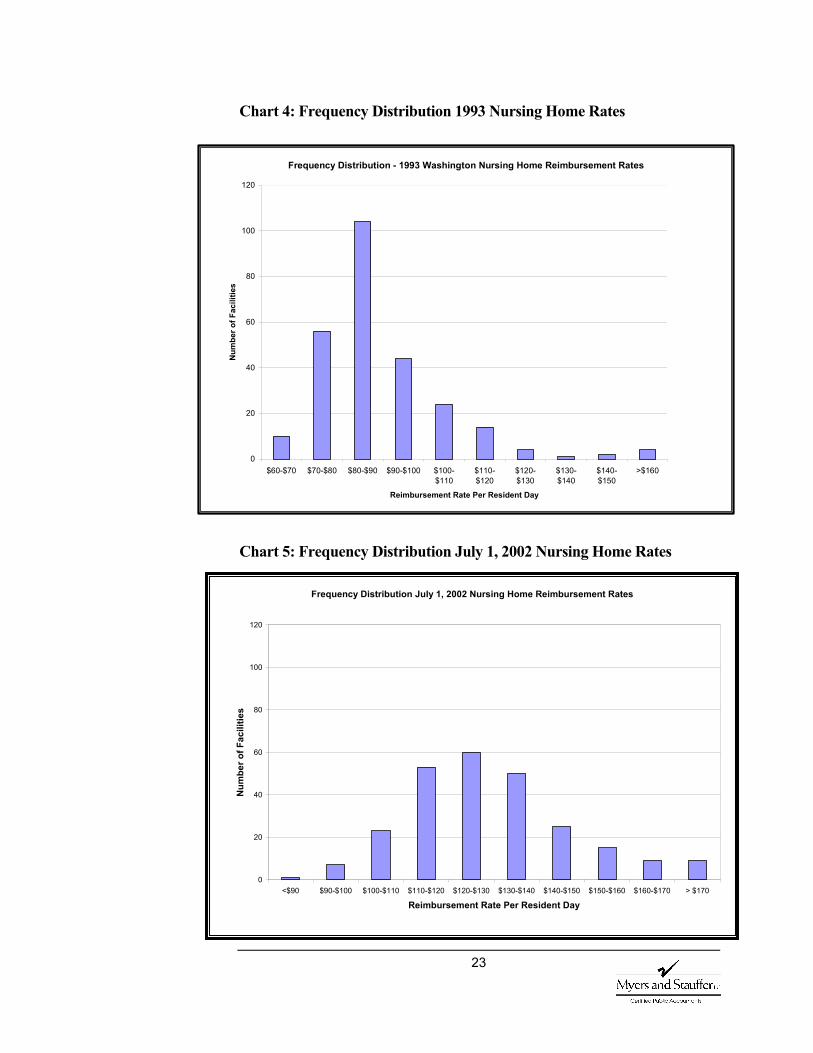
Rates and Revenue One issue highlighted in the “Nursing Home and Long-Term Care – Part 1: Nursing Home Reimbursement” report, dated October 21, 1994 was the frequency distribution of rates and the resulting skewed distribution curve. There was concern over the large range of rates. Excluding the one atypical facility with a rate of $407 per resident day, rates ranged from a low of $64 per day to a high of $267 per day. The question was whether this rate variability reflected real differences in the services provided or was it more a function of the rate setting system.
As illustrated on the following chart, copied from that report, the distribution was skewed to the low side. In 1993, approximately 68% of facilities had rates that ranged from $64 per resident day to $90 per day. The remaining approximately 32% of the facilities had rates that were more than $90 a resident day to $267 per day.
For the July 1, 2002 rates the minimum rate was approximately $88, an increase over the 1993 low of $64. This increase calculates to approximately 4.5% per year and can, for the most part, be explained by inflation. During the same time period, however, the high rate, excluding the atypical facility, increased only to $270. Subsequent quarters reflect a high rate of $289 and $295 respectively. The increase for the high facilities calculates to less than 1½% per year, meaning a narrowing of the range between the high and low rate facilities.
Also, the distribution of rates has assumed a more normal distribution curve, as illustrated on the chart below. The chart was developed using rates effective July 1, 2002. It reflects 68% of the facilities receiving rates ranging from $110 per resident day to $140 per day. Approximately 16% of the facilities have rates lower than the $110 and 16% with rates that are higher than $140 per day.
This improved distribution of rates appears to be linked to the new reimbursement methodology. Adjusting the direct care portion of the rate calculation to reflect the acuity of the residents seems to have reduced the variability between high and low rate facilities and is creating a more equitable distribution of available dollars.
23
Chart 4: Frequency Distribution 1993 Nursing Home Rates
Chart 5: Frequency Distribution July 1, 2002 Nursing Home Rates
Frequency Distribution - 1993 Washington Nursing Home Reimbursement Rates
0
20
40
60
80
100
120
$60-$70 $70-$80 $80-$90 $90-$100 $100-$110
$110-$120
$120-$130
$130-$140
$140-$150
>$160
Reimbursement Rate Per Resident Day
Num
ber o
f Fac
ilitie
s
Frequency Distribution July 1, 2002 Nursing Home Reimbursement Rates
0
20
40
60
80
100
120
<$90 $90-$100 $100-$110 $110-$120 $120-$130 $130-$140 $140-$150 $150-$160 $160-$170 > $170
Reimbursement Rate Per Resident Day
Num
ber o
f Fac
ilitie
s

24
As discussed in the second interim report, a comment frequently voiced by the nursing facility industry is that, given survey requirements and health care ethics, changes in Medicaid payment do not cause a reduction in expenditures, but a shifting of costs to other payer sources. “Nursing homes have been able to maintain margin levels cross-subsidizing the cost of Medicaid patients’ care with more generous rates paid by Medicare and private pay patients” (Dobson et al., 2002; Bishop, 2001). In other words, rather than impacting the care of the Medicaid population, any negative changes in the Medicaid reimbursement system would be shifted to other payer sources.
In order to evaluate potential shifting of expenditures between payer sources, it is important to understand the make-up of revenue to the facility. Routine revenue is revenue from care services provided as routine and billed within the per diem rate. Routine revenues come from several payers: Medicaid, Medicare, VA, Champus, private insurance, and other private sources. In addition to the routine revenue, facilities can receive other revenue related to patient services such as therapy, pharmacy, supplies, respite care or mental health services; operating revenue such as laundry, meals, vending, or property rental; and non-operating revenue such as gains on the sale of assets, interest or dividends.
To compensate for any negative change in the Medicaid reimbursement methodology, one would expect an increase in percent of revenue derived from private pay sources. It is interesting to note, however, that rather than contributing less to total routine revenue, the Washington Medicaid percentage increased slightly. Also, a slight increase, a little over 1%, was seen in the amount of Medicare to total routine revenue. In total dollars between the 2001 and 2002 cost reports, reported Medicaid routine revenue increased from $552 million to approximately $565 million.
Actual routine revenue dollars from private pay sources reported on the cost reports for facilities in the analyses database, decreased by a little over $6 million. This decrease is reflected in a lower percentage contribution to total routine revenue. Although other routine revenue increased in actual dollars, it did so at a lower rate than the increases of Medicare or Medicaid. This slower increase had the net effect of contributing a smaller percentage when compared to total routine revenue.
To completely evaluate shifts, changes in resident day totals by payer source would also need to be considered. Resident data in the analyses database is for all residents, not divided by payer source. However, it does not appear that the introduction of the new payment methodology in 1998, in the aggregate, has had an adverse effect on other payer sources. It also does not appear that any cost shifting or changes in spending patterns have occurred in administration and operating costs or support services.
25
V. Analyses and Findings Study Outline Questions When developing questions to be evaluated during the study, we obtained input from the department, the provider community and the Joint Nursing Home Task Force. The list of questions from the study outline is included in Appendix 2 and forms the basis of the following discussions.
Access is defined as the ability of individuals seeking assistance and care to obtain appropriate services in the least restrictive environment available (or in a setting that reflects their personal preferences while meeting their needs for care). One reason states have adopted case mix is to overcome access problems inherent in conventional reimbursement systems. Typically in conventional reimbursement a single per diem payment is made to providers regardless of resident care needs. The financial incentive under this system is to admit residents with less intensive care needs and restrict access to those requiring heavier care. By targeting lighter care or less costly residents, a facility could reduce operating costs in relation to its rate of reimbursement.
Interviews and Questionnaire Most respondents believed that placement was either unchanged or harder, although not necessarily linked to case mix.
In the initial series of interviews, we talked with individuals directly involved in placing clients in nursing facilities as well as other interested parties. As would be expected from such a diverse group of
interviewees, we received a wide variety of opinions about access to care. Moreover, respondents were far from unanimous in their opinions about the impact of case mix reimbursement.
Only a few respondents felt that access had improved in nursing facilities since implementation of case mix reimbursement. Most respondents thought that conditions had either remained the same or deteriorated. Some respondents expressed the opinion that case mix reimbursement contributed to changes in access. However, the majority of respondents pointed to other factors, such as nursing staff shortages or high staff turnover rates, as having the greatest impact on access in nursing facilities. Some facility staff members were taking more time to assess residents prior to admission, requiring more documentation from hospital discharge planners, and in some cases they would even go to the hospital to interview patients before making an admission decision.
A C C E S S
Are individuals with more intensive care needs easier to place since the implementation of the case mix payment system?
26
Because the interviews were free flowing, it was difficult to quantify the responses. In a second round of queries, we restructured the questions in a way that could be aggregated and tabulated and obtained very similar results.
To the question, is placement of residents in nursing facilities easier, harder, or unchanged, only approximately 16% felt it was easier, 52.5% felt it was harder and 31.5% believed it was unchanged. Of those believing it was easier, two-thirds felt it was indirectly linked to case mix. The other third believed there were other causes. Of those believing it was harder, all felt there was a link to the case mix system. Fifty percent believed it was directly linked and 50% thought it was indirectly linked.
When asked if the length of time from referral to placement was shorter, longer, or unchanged, approximately 10.5% answered shorter, 42% as longer, and 47.5% said it was unchanged. All of the respondents answering shorter felt it was indirectly linked to case mix. Those answering longer had mixed opinions concerning the impact of case mix. Fifty percent believed there was a direct link, 37.5% an indirect link and 12.5% no link.
Respondents were also questioned on any change in the level of effort to go from referral to placement. Approximately 47% of the respondents felt it required more effort to place individuals. Once again there was a mixture of opinion as to the impact of case mix although the vast majority believed it was at least indirectly linked. Only 11% of those identifying increased effort did not link the change to case mix. Forty two percent said there was no change and 10.5% said it took less effort. Of the 10.5% who believed it now required less effort, 100% felt it was indirectly linked to case mix.
Several of the RUG-III categories, Extensive Services, Impaired Cognition, and Behavioral Problems, are linked to issues identified as access problems. However, only about a third of the respondents believed that some facilities used case mix screens to restrict admissions of certain types of residents.
We also asked if certain types of individuals are harder to place or if there are certain special care issues that make placement more difficult. In the interviews, respondents identified the following characteristics that they felt made residents hard to place in nursing facilities.
1. Heavy care requirements, such as ventilators.
2. Morbidly obese.
3. Certain types of IV antibiotics.
4. Mental health or behavioral problems.
5. Alzheimer’s disease or other dementia requiring a secure area.
It was noted that these were the same types of residents who had been difficult to place prior to case mix reimbursement.
What relationship is there between a resident’s care needs, as measured by RUG-III, and their ability to get timely access to nursing facility care?
27
The responses to the questionnaire were very similar, 90% of the respondents identified residents with behavior problems as difficult to place. Other issues identified were special care needs (such as IV Meds, decubitus ulcers, wound care, respiratory therapy, kidney dialysis or expensive medications), cognitive issues, obesity, special equipment needs and rehabilitation.
We also asked if respondents believed that facility behavior prior to accepting a resident had changed since the implementation of case mix payment. The majority believed that facilities were now asking for more information and evaluating case mix prior to an admission to determine if they had sufficient staffing to care for these residents. Only about a third believed that facilities used a case mix screen to admit only certain types of residents.
MDS Data and RUG-III Distribution Yes, admission assessments show a larger distribution of those coding as Extensive Services (heavier care) and a smaller distribution of Reduced Physical Functioning (lighter care).
To understand access to care by residents with varying levels of acuity, we evaluated the distribution of
residents within nursing facilities measured by the RUG-III classification system. We evaluated the distribution of resident assessments at admission using admission assessments; the distribution of all nursing facility residents using the most currently available assessment; and the distribution of Medicaid residents using Medicaid assessments, identified by responses on the MDS. The following chart shows the distribution between the major categories as calculated, on a quarterly basis and averaged by year, for admission assessments in the database for 2000, 2001 and 2002.
Has there been a change in admission patterns for individuals with lighter care needs?
28
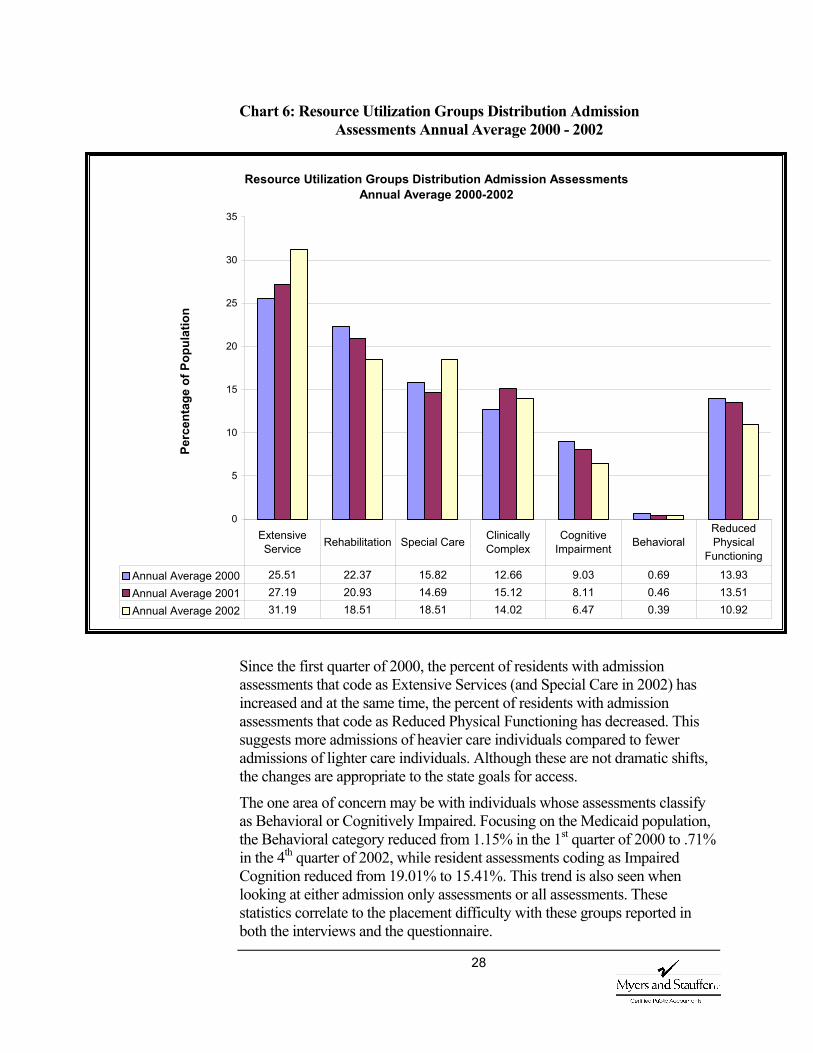
Chart 6: Resource Utilization Groups Distribution Admission Assessments Annual Average 2000 - 2002
Since the first quarter of 2000, the percent of residents with admission assessments that code as Extensive Services (and Special Care in 2002) has increased and at the same time, the percent of residents with admission assessments that code as Reduced Physical Functioning has decreased. This suggests more admissions of heavier care individuals compared to fewer admissions of lighter care individuals. Although these are not dramatic shifts, the changes are appropriate to the state goals for access.
The one area of concern may be with individuals whose assessments classify as Behavioral or Cognitively Impaired. Focusing on the Medicaid population, the Behavioral category reduced from 1.15% in the 1st quarter of 2000 to .71% in the 4th quarter of 2002, while resident assessments coding as Impaired Cognition reduced from 19.01% to 15.41%. This trend is also seen when looking at either admission only assessments or all assessments. These statistics correlate to the placement difficulty with these groups reported in both the interviews and the questionnaire.
Resource Utilization Groups Distribution Admission Assessments Annual Average 2000-2002
0
5
10
15
20
25
30
35
Perc
enta
ge o
f Pop
ulat
ion
Annual Average 2000 25.51 22.37 15.82 12.66 9.03 0.69 13.93Annual Average 2001 27.19 20.93 14.69 15.12 8.11 0.46 13.51Annual Average 2002 31.19 18.51 18.51 14.02 6.47 0.39 10.92
Extensive Service Rehabilitation Special Care Clinically
Complex Cognitive
Impairment Behavioral Reduced Physical
Functioning
29
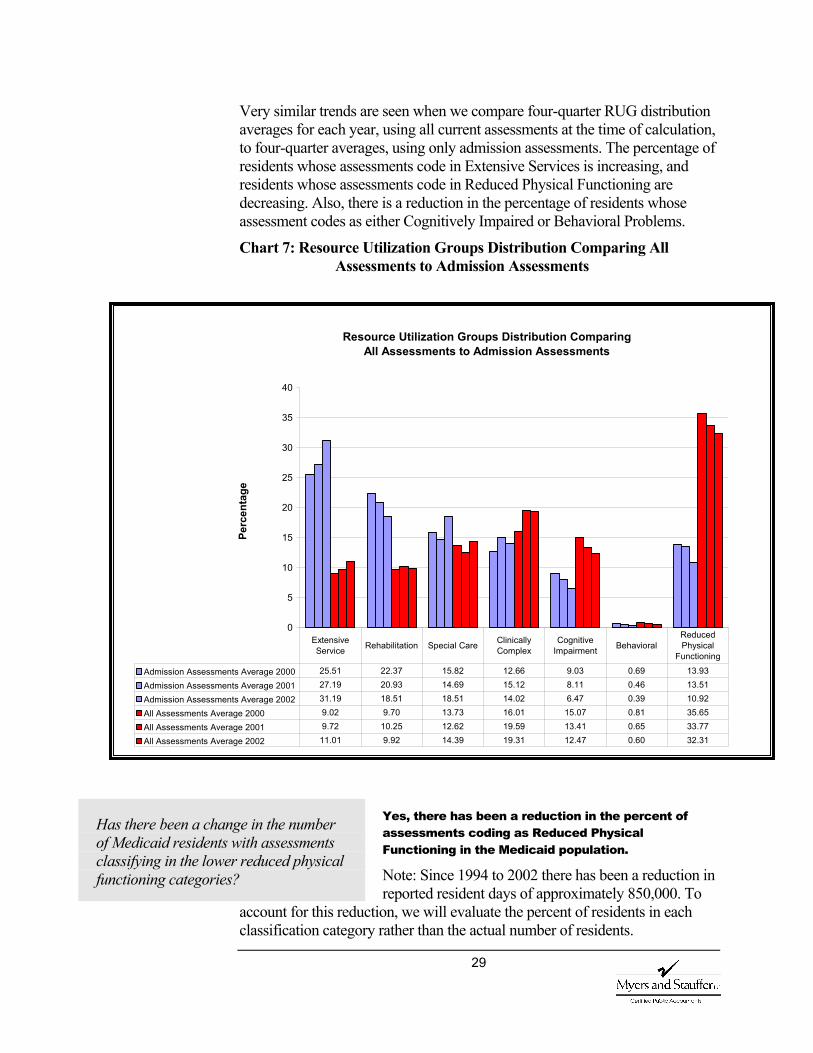
Very similar trends are seen when we compare four-quarter RUG distribution averages for each year, using all current assessments at the time of calculation, to four-quarter averages, using only admission assessments. The percentage of residents whose assessments code in Extensive Services is increasing, and residents whose assessments code in Reduced Physical Functioning are decreasing. Also, there is a reduction in the percentage of residents whose assessment codes as either Cognitively Impaired or Behavioral Problems.
Chart 7: Resource Utilization Groups Distribution Comparing All Assessments to Admission Assessments
Yes, there has been a reduction in the percent of assessments coding as Reduced Physical Functioning in the Medicaid population.
Note: Since 1994 to 2002 there has been a reduction in reported resident days of approximately 850,000. To
account for this reduction, we will evaluate the percent of residents in each classification category rather than the actual number of residents.
Has there been a change in the number of Medicaid residents with assessments classifying in the lower reduced physical functioning categories?
Resource Utilization Groups Distribution Comparing All Assessments to Admission Assessments
0
5
10
15
20
25
30
35
40
Perc
enta
ge
Admission Assessments Average 2000 25.51 22.37 15.82 12.66 9.03 0.69 13.93
Admission Assessments Average 2001 27.19 20.93 14.69 15.12 8.11 0.46 13.51
Admission Assessments Average 2002 31.19 18.51 18.51 14.02 6.47 0.39 10.92
All Assessments Average 2000 9.02 9.70 13.73 16.01 15.07 0.81 35.65
All Assessments Average 2001 9.72 10.25 12.62 19.59 13.41 0.65 33.77
All Assessments Average 2002 11.01 9.92 14.39 19.31 12.47 0.60 32.31
Extensive Service Rehabilitation Special Care Clinically
Complex Cognitive
Impairment Behavioral Reduced Physical
Functioning
30
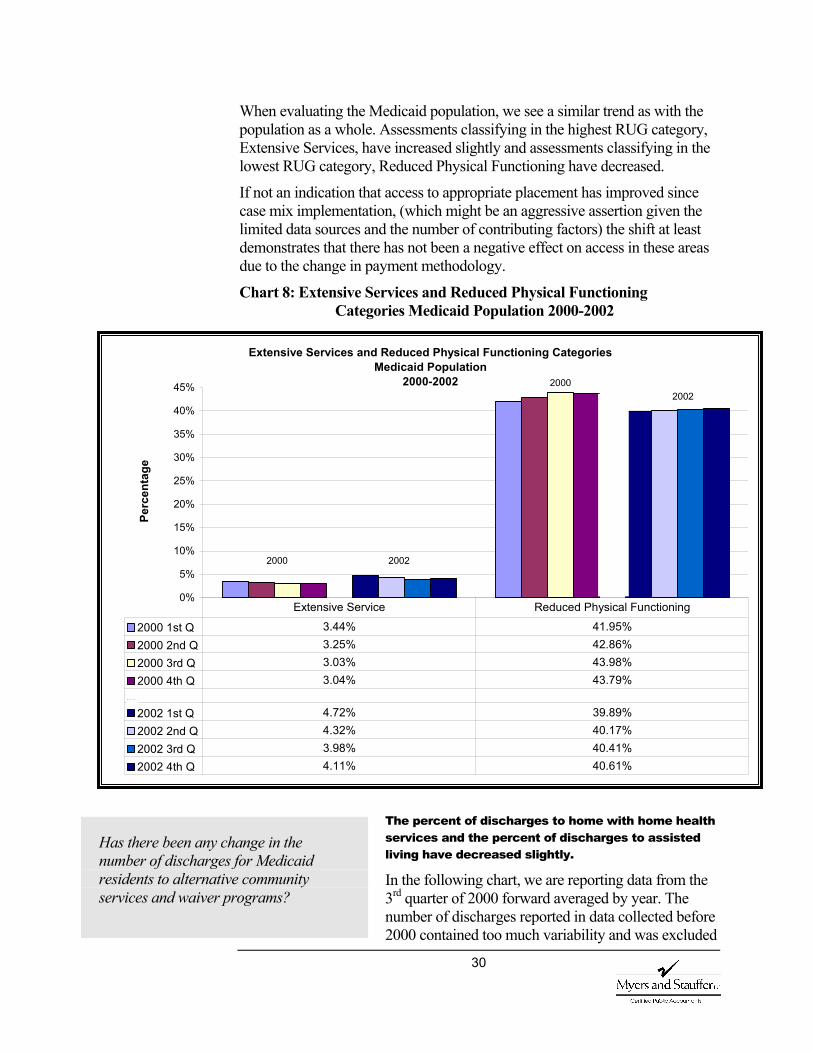
When evaluating the Medicaid population, we see a similar trend as with the population as a whole. Assessments classifying in the highest RUG category, Extensive Services, have increased slightly and assessments classifying in the lowest RUG category, Reduced Physical Functioning have decreased.
If not an indication that access to appropriate placement has improved since case mix implementation, (which might be an aggressive assertion given the limited data sources and the number of contributing factors) the shift at least demonstrates that there has not been a negative effect on access in these areas due to the change in payment methodology.
Chart 8: Extensive Services and Reduced Physical Functioning Categories Medicaid Population 2000-2002
The percent of discharges to home with home health services and the percent of discharges to assisted living have decreased slightly.
In the following chart, we are reporting data from the 3rd quarter of 2000 forward averaged by year. The number of discharges reported in data collected before 2000 contained too much variability and was excluded
Has there been any change in the number of discharges for Medicaid residents to alternative community services and waiver programs?
Extensive Services and Reduced Physical Functioning Categories Medicaid Population
2000-2002
0%
5%
10%
15%
20%
25%
30%
35%
40%
45%
Perc
enta
ge
2000 1st Q 3.44% 41.95%2000 2nd Q 3.25% 42.86%2000 3rd Q 3.03% 43.98%2000 4th Q 3.04% 43.79%
2002 1st Q 4.72% 39.89%2002 2nd Q 4.32% 40.17%2002 3rd Q 3.98% 40.41%2002 4th Q 4.11% 40.61%
Extensive Service Reduced Physical Functioning
2000 2002
20002002
31
from the evaluation. That data either predated the CMS system or the CMS correction policy and the variability is more probably a function of the collection methods rather than changes in the population. This seems particularly evident given the consistency within the remaining quarters.
Since the 3rd quarter of 2000 the number of discharge assessments in the MDS database has been around 15,500 decreasing slightly each quarter. Again, considering the trend of a decreasing number of reported days, we will use the percent of discharges in our analyses rather than the actual number of discharges.
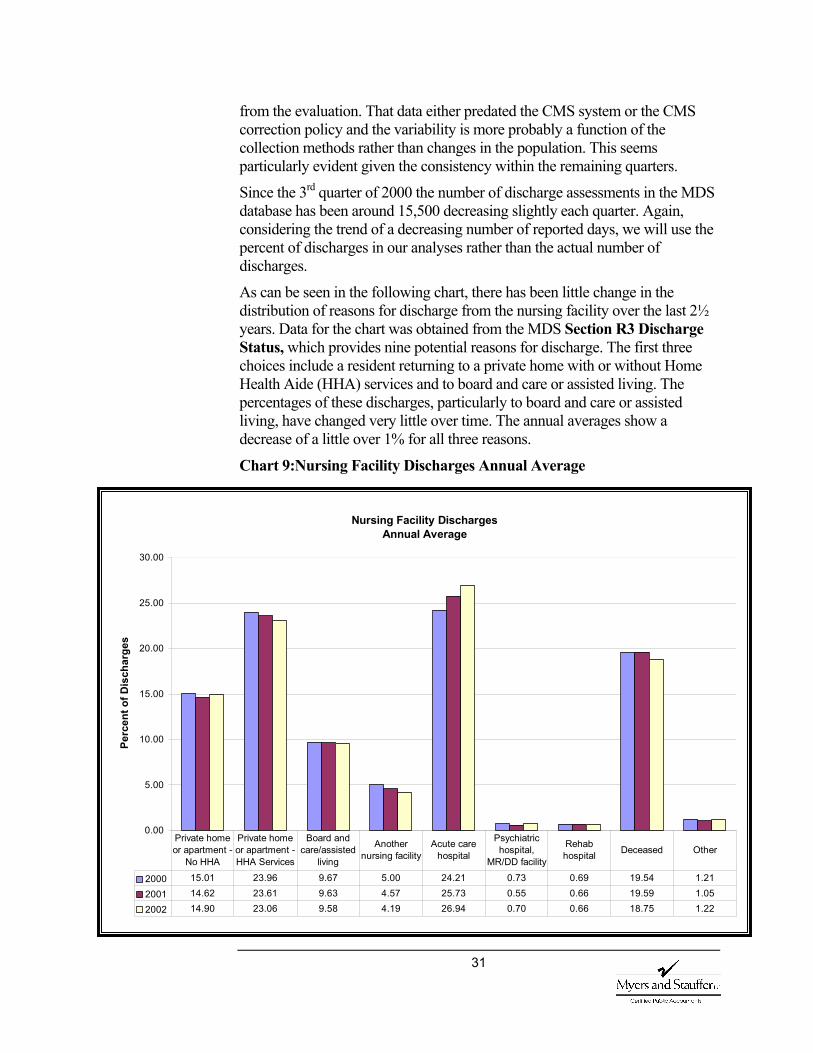
As can be seen in the following chart, there has been little change in the distribution of reasons for discharge from the nursing facility over the last 2½ years. Data for the chart was obtained from the MDS Section R3 Discharge Status, which provides nine potential reasons for discharge. The first three choices include a resident returning to a private home with or without Home Health Aide (HHA) services and to board and care or assisted living. The percentages of these discharges, particularly to board and care or assisted living, have changed very little over time. The annual averages show a decrease of a little over 1% for all three reasons.
Chart 9:Nursing Facility Discharges Annual Average
Nursing Facility Discharges Annual Average
0.00
5.00
10.00
15.00
20.00
25.00
30.00
Perc
ent o
f Dis
char
ges
2000 15.01 23.96 9.67 5.00 24.21 0.73 0.69 19.54 1.21
2001 14.62 23.61 9.63 4.57 25.73 0.55 0.66 19.59 1.05
2002 14.90 23.06 9.58 4.19 26.94 0.70 0.66 18.75 1.22
Private home or apartment -
No HHA
Private home or apartment - HHA Services
Board and care/assisted
living
Another nursing facility
Acute care hospital
Psychiatric hospital,
MR/DD facility
Rehab hospital Deceased Other
32
Nursing Facility Placement Data Although data is limited to those accessing care, there does not appear to be an access problem for nursing home residents with particular types of conditions, with only occasional exception. Nor does there appear to be an access problem linked to any particular part of the state. Reducing bed capacity can be linked to state policy.
We attempted to obtain statistical data maintained on specific placement issues for example, data on difficulties in placing individuals in nursing facilities,
hospital backup information, or special rates that are negotiated to accommodate placement of difficult to place individuals.
We found that this data is not compiled, as placement does not appear to be a problem. Occasionally an obesity or behavior issue creates a placement problem but it is rare. For example, Region 4 reports to have solved some of their few placement problems (approximately 1-2 cases per year on average) by negotiating an exceptional rate with an adult family home (still less expensive than a nursing home placement).
Region 1 (Spokane) has reported access problems, but that appears to have more to do with banked beds than case mix.
Occupancy Data Using occupancy rates as an indicator of access, we reviewed occupancy by city, county and survey region and estimated available beds based on current occupancy rates and census data. From the reported occupancy rate, we estimated the available empty beds in each state survey region. The 65 and over population is estimated at 81,500 for Region 1, 57,500 for Region 2, 105,500 for Region 3, 187,000 for Region 4, 102,000 for Region 5 and 108,000 for Region 6.
This would translate into the following number of beds per thousand residents 65 or over.
Are residents with particular types of conditions and/or in particular parts of the state unable to get nursing facility care when needed, and within reasonable proximity to their home? If so, why?
33
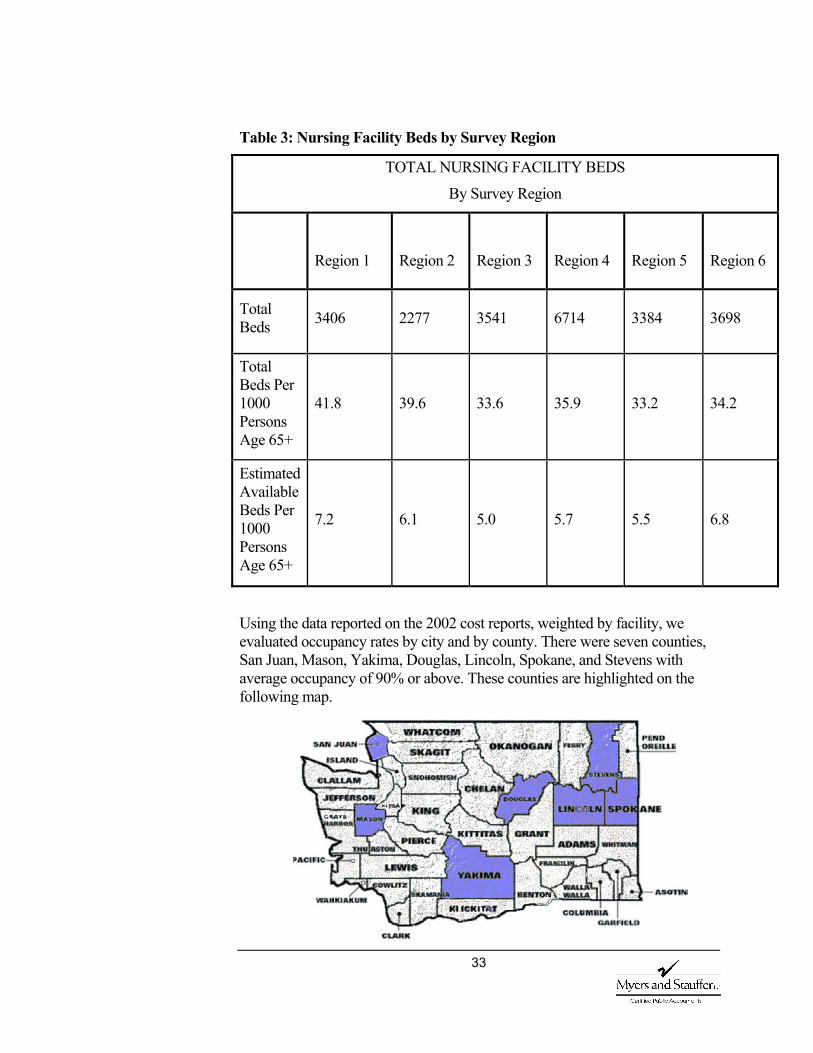
Table 3: Nursing Facility Beds by Survey Region
TOTAL NURSING FACILITY BEDS
By Survey Region
Region 1
Region 2
Region 3
Region 4
Region 5
Region 6
Total Beds 3406 2277 3541 6714 3384 3698
Total Beds Per 1000 Persons Age 65+
41.8 39.6 33.6 35.9 33.2 34.2
Estimated Available Beds Per 1000 Persons Age 65+
7.2 6.1 5.0 5.7 5.5 6.8
Using the data reported on the 2002 cost reports, weighted by facility, we evaluated occupancy rates by city and by county. There were seven counties, San Juan, Mason, Yakima, Douglas, Lincoln, Spokane, and Stevens with average occupancy of 90% or above. These counties are highlighted on the following map.
34
Although occupancy rates vary between counties and state survey regions, it does not appear that there are geographically driven access issues.
Combined Data Sources We did not identify an access problem in a particular area of the state. Nor was there a strong link between the average rate per region and the average occupancy per region.
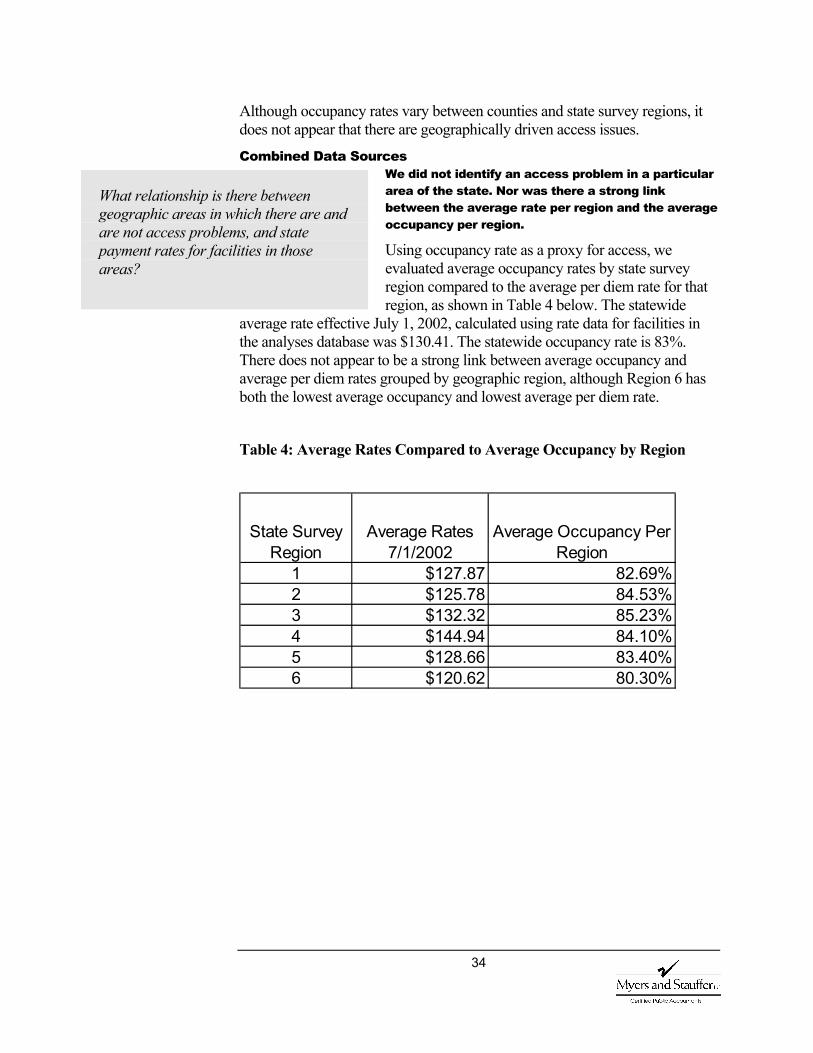
Using occupancy rate as a proxy for access, we evaluated average occupancy rates by state survey region compared to the average per diem rate for that region, as shown in Table 4 below. The statewide
average rate effective July 1, 2002, calculated using rate data for facilities in the analyses database was $130.41. The statewide occupancy rate is 83%. There does not appear to be a strong link between average occupancy and average per diem rates grouped by geographic region, although Region 6 has both the lowest average occupancy and lowest average per diem rate.
Table 4: Average Rates Compared to Average Occupancy by Region
What relationship is there between geographic areas in which there are and are not access problems, and state payment rates for facilities in those areas?
State Survey Region
Average Rates 7/1/2002
Average Occupancy Per Region
1 $127.87 82.69%2 $125.78 84.53%3 $132.32 85.23%4 $144.94 84.10%5 $128.66 83.40%6 $120.62 80.30%
35
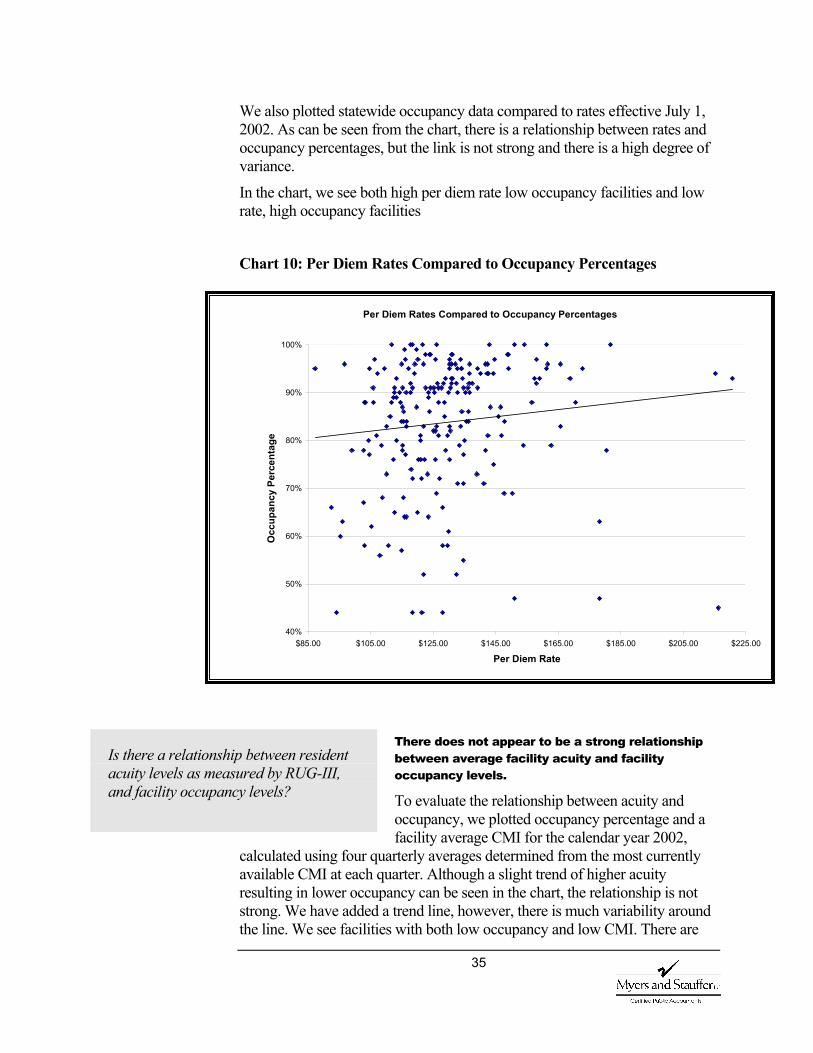
We also plotted statewide occupancy data compared to rates effective July 1, 2002. As can be seen from the chart, there is a relationship between rates and occupancy percentages, but the link is not strong and there is a high degree of variance.
In the chart, we see both high per diem rate low occupancy facilities and low rate, high occupancy facilities
Chart 10: Per Diem Rates Compared to Occupancy Percentages
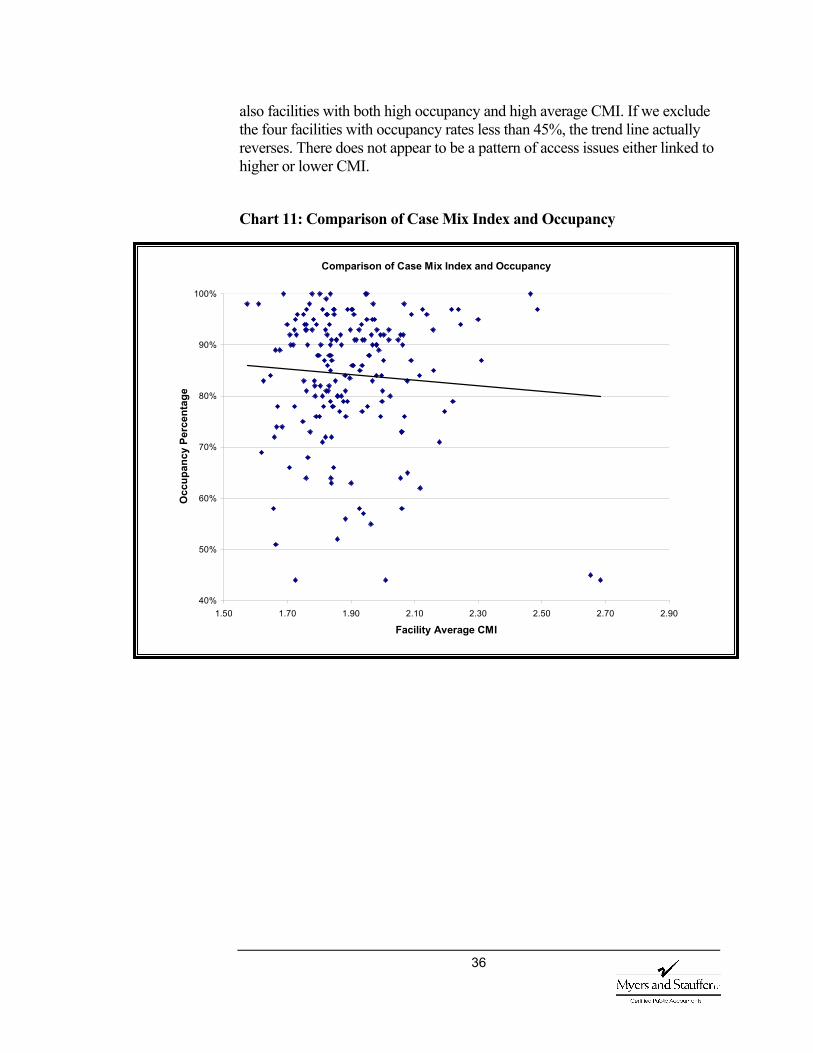
There does not appear to be a strong relationship between average facility acuity and facility occupancy levels.
To evaluate the relationship between acuity and occupancy, we plotted occupancy percentage and a facility average CMI for the calendar year 2002,
calculated using four quarterly averages determined from the most currently available CMI at each quarter. Although a slight trend of higher acuity resulting in lower occupancy can be seen in the chart, the relationship is not strong. We have added a trend line, however, there is much variability around the line. We see facilities with both low occupancy and low CMI. There are
Is there a relationship between resident acuity levels as measured by RUG-III, and facility occupancy levels?
Per Diem Rates Compared to Occupancy Percentages
40%
50%
60%
70%
80%
90%
100%
$85.00 $105.00 $125.00 $145.00 $165.00 $185.00 $205.00 $225.00
Per Diem Rate
Occ
upan
cy P
erce
ntag
e
36
also facilities with both high occupancy and high average CMI. If we exclude the four facilities with occupancy rates less than 45%, the trend line actually reverses. There does not appear to be a pattern of access issues either linked to higher or lower CMI.
Chart 11: Comparison of Case Mix Index and Occupancy
Comparison of Case Mix Index and Occupancy
40%
50%
60%
70%
80%
90%
100%
1.50 1.70 1.90 2.10 2.30 2.50 2.70 2.90
Facility Average CMI
Occ
upan
cy P
erce
ntag
e
37
For this evaluation, we deferred to the federal standards to define quality of care. In 42 CFR 483.25 the federal government requires that each resident must receive, and the facility must provide, the necessary care and services to attain and maintain the highest practicable physical, mental and psychosocial well-being, in accordance with the comprehensive assessment and plan of care.
A reimbursement methodology by itself will not ensure quality of care, however a system that distributes program dollars based on resident care needs should assist facilities in attaining and maintaining acceptable quality of care levels.
Interviews and Questionnaire Opinions are mixed concerning changes in quality of care and the contribution case mix payment may have had to those changes.
The interviewees expressed mixed opinions about changes in care quality. However, those who believed there had been a change, pointed to factors other than case mix reimbursement as the potential cause. Respondents who felt quality had improved
mentioned factors such as a more effective nursing facility survey process with stronger sanctions, threat of law suits for poor quality care, better staff training and introduction of continuous quality improvement programs in facilities.
On the questionnaires, approximately 10.5% felt that quality of care had improved. Of those, 50% felt that the change was linked to the payment methodology. The remaining 50% had no opinion as to the cause. Another 26.5% believed that the quality of care had declined. With 60% of those linking the decline to case mix. The remainder had no opinion as to the cause. The majority 53% believed that the quality of care had not changed.
Responses to both the interviews and the questionnaires identify an increase in turnover.
The primary factor identified in the interviews as contributing to a decline in quality was the inability of facilities to attract and retain qualified staff.
Respondents were nearly unanimous in their opinion that staff turnover was a severe problem. Respondents to both the interviews and questionnaire identified turn over as an issue impacting quality of care.
The question is not whether there is a turnover problem in this industry, which seems to be a given, but whether turnover has changed due to the payment methodology. We were unable to obtain the necessary turn over statistics for the periods being evaluated to fully evaluate the impact.
Q U A L I T Y O F
C A R E
What are the views of stakeholders on case mix payment? Do stakeholders perceive a change in quality of care? Is this in part due to the change in payment methodology?
Has there been a change in staff turn over?

38
However, turnover problems were identified prior to implementation of the case mix methodology. Interviewees felt that staffing problems were largely attributable to a tight labor market, which has affected hospitals and home care agencies as well as nursing facilities.
Of those responding to the questionnaire, 42% identified an increase in staff turnover. They were mixed on the impact of case mix. Fifty percent felt it was not linked, 25% believed it was linked (12.5% directly and 12.5% indirectly) and the remaining 25% did not know or express an opinion.
Survey Data The average number of deficiencies has decreased from 11 to 10 per survey. Washington is also seeing a reduction in the scope and severity level cited. According to data on the Nursing Home Compare website, Washington’s average for health deficiencies is ten per nursing facility survey, which is a reduction
from the average of 11 reported on our first interim report.
Although changes in the survey results cannot be linked to the payment methodology, quality of care, as measured by these deficiencies does not appear to have been negatively affected.
Chart 12: NHC Average Number of Health Deficiencies
Has quality of care measured by survey findings changed with the implementation of case mix payment?
Nursing Home CompareAverage Number of Health Deficiencies
0
2
4
6
8
10
12
14
Uni
ted
Stat
es
Alab
ama
Alas
kaAr
izon
aAr
kans
asC
alifo
rnia
Col
orad
oC
onne
ctic
utD
elaw
are
Flor
ida
Geo
rgia
Haw
aii
Idah
oIll
inoi
sIn
dian
aIo
wa
Kans
asKe
ntuc
kyLo
uisi
ana
Mai
neM
aryl
and
Mas
sach
uset
tsM
ichi
gan
Min
neso
taM
issi
ssip
piM
isso
uri
Mon
tana
Neb
rask
aN
evad
aN
ew H
amps
hire
New
Jer
sey
New
Mex
ico
New
Yor
kN
orth
Car
olin
aN
orth
Dak
ota
Ohi
oO
klah
oma
Ore
gon
Penn
sylv
ania
Rho
de Is
land
Sout
h C
arol
ina
Sout
h D
akot
aTe
nnes
see
Texa
sU
tah
Verm
ont
Virg
inia
Was
hing
ton
Was
hing
ton
D.C
.W
est V
irgin
iaW
isco
nsin
Wyo
min
g
An average of 10 health deficiencies per nursing home survey
National average is 7 health deficiencies

39
Scope and Severity In addition to comparing the number of deficiencies, it is also important to understand both the scope and severity. Deficiencies are measured by scope (number of residents impacted) and severity (the level of harm or jeopardy). The grid below demonstrates how these two components are measured. A “G” level deficiency would be an instance of actual harm that is not immediate jeopardy and is isolated in occurrence. An “F” level deficiency would be no actual harm with the potential for more than minimal harm that is widespread.
Table 5: Scope and Severity Grid
Since 1999, the percent of deficiencies cited at the “G” level or above has been decreasing. Washington is seeing a decline in the percentage of citations at the “G” and “H” levels and an increase in the percentage of “B” and “D” level citations, similar to the average changes seen nationally as seen in the following chart.
Immediate jeopardy to resident health or safety
J K L
Seve
rity
Actual harm that is not immediate jeopardy
G H INo actual harm with
potential for more than minimal harm that is not
immediate jeopardy D E FNo actual harm with potential for minimal
harm A B C
Isolated Pattern Widespread
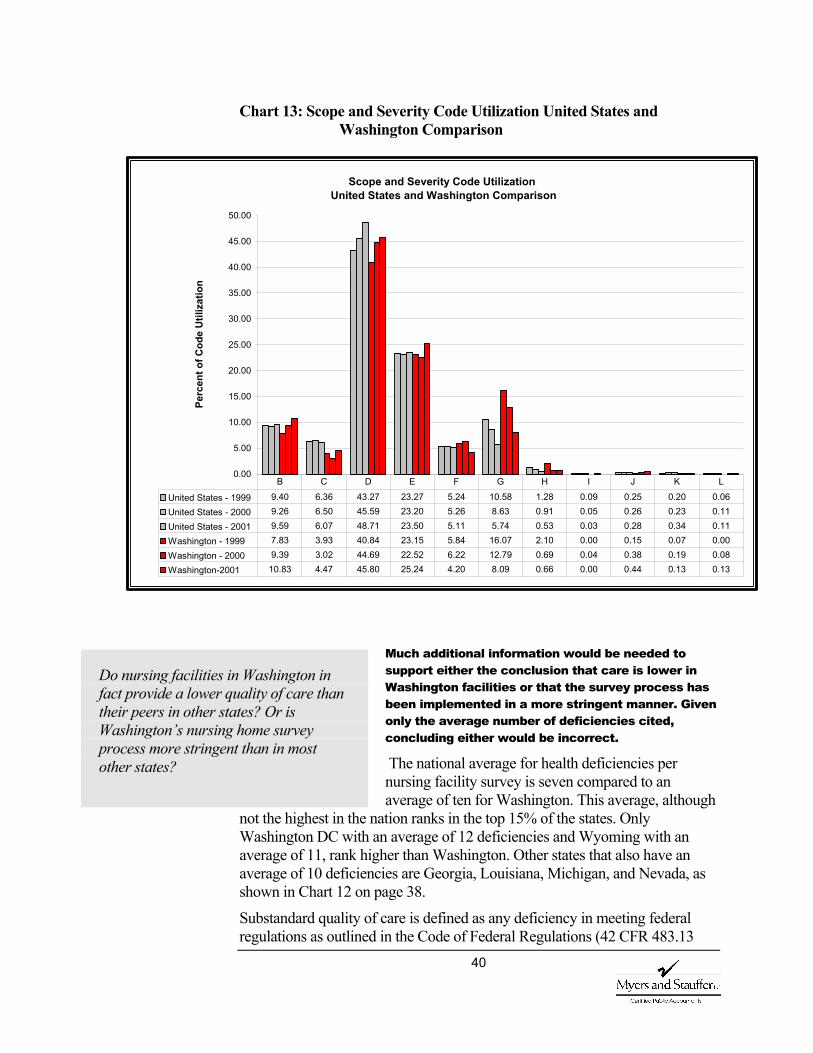
40
Chart 13: Scope and Severity Code Utilization United States and Washington Comparison
Much additional information would be needed to support either the conclusion that care is lower in Washington facilities or that the survey process has been implemented in a more stringent manner. Given only the average number of deficiencies cited, concluding either would be incorrect.
The national average for health deficiencies per nursing facility survey is seven compared to an average of ten for Washington. This average, although
not the highest in the nation ranks in the top 15% of the states. Only Washington DC with an average of 12 deficiencies and Wyoming with an average of 11, rank higher than Washington. Other states that also have an average of 10 deficiencies are Georgia, Louisiana, Michigan, and Nevada, as shown in Chart 12 on page 38.
Substandard quality of care is defined as any deficiency in meeting federal regulations as outlined in the Code of Federal Regulations (42 CFR 483.13
Do nursing facilities in Washington in fact provide a lower quality of care than their peers in other states? Or is Washington’s nursing home survey process more stringent than in most other states?
Scope and Severity Code UtilizationUnited States and Washington Comparison
0.00
5.00
10.00
15.00
20.00
25.00
30.00
35.00
40.00
45.00
50.00
Perc
ent o
f Cod
e U
tiliz
atio
n
United States - 1999 9.40 6.36 43.27 23.27 5.24 10.58 1.28 0.09 0.25 0.20 0.06United States - 2000 9.26 6.50 45.59 23.20 5.26 8.63 0.91 0.05 0.26 0.23 0.11United States - 2001 9.59 6.07 48.71 23.50 5.11 5.74 0.53 0.03 0.28 0.34 0.11Washington - 1999 7.83 3.93 40.84 23.15 5.84 16.07 2.10 0.00 0.15 0.07 0.00Washington - 2000 9.39 3.02 44.69 22.52 6.22 12.79 0.69 0.04 0.38 0.19 0.08Washington-2001 10.83 4.47 45.80 25.24 4.20 8.09 0.66 0.00 0.44 0.13 0.13
B C D E F G H I J K L
41
Resident Behavior and Facility Practices, 42 CFR 483.15 Quality of Life or 42 CFR 483.25 Quality of Care), at a scope and severity level of “F”, “H”, “I”, “J”, “K”, or “L”. Surveys resulting in a citation for actual harm are defined as a deficiency citation that is rated at scope and severity of “G” or more severe. A citation for immediate jeopardy to resident health and safety would be recorded at a scope and severity level of “J” or higher.
Washington ranks lower than the national average in the number of deficiency free facilities. There are, however, seven states with a lower percentage of deficiency free surveys, 11 states with a higher percentage of facilities with deficiencies ranked as substandard quality of care and five states with a higher percentage of facilities cited for immediate jeopardy.
CMS also determines the number of facilities that at the end of each year are in substantial compliance. Washington has 92.16% of facilities compared to the national average of 92.05%, which is a favorable comparison. Also, although the total number of deficiencies cited in Washington facilities is higher than the national average, the distribution over the scope and severity grid is similar to other states.
We have included a chart in Appendix 9 that lists the percent of deficiency free facilities in each state compared to the average for the United States, the percent of facilities in substantial compliance on December 2001 and at the date of the facility’s survey, the percent of facilities with substandard quality of care and the percent of facilities cited with a deficiency of immediate jeopardy.
However, when comparing Washington’s number of citations to other states, it is important to remember that federal comparative surveys have found weaknesses and inconsistencies throughout the nation in the application of state survey, complaint investigation and enforcement activities.
A comparative survey involves a federal survey team conducting a complete, independent survey of a home within two months of the completion of a state’s survey in order to compare and contrast findings. These federal comparative surveys found actual harm or a higher level in 34% of the facilities where state surveyors had found no such deficiencies. Available data on the comparative surveys is aggregated by Federal Survey region. Region X averaged 9.3 citations per facility on the comparative surveys compared to 5.8 citations on those conducted by state surveyors with an average of 27.2 days between the two reviews (GAO/HEHS-00-197).
A recent General Accounting Office report on nursing home quality, “Prevalence of Serious Problem, While Declining, Reinforces Importance of Enhanced Oversight,” attempts to assess the extent of progress made in improving the quality of care provided by nursing homes to vulnerable elderly and disabled individuals. The study included 14 states in which the percentage of homes cited for actual harm had declined below the national average or was consistently below that average. The review included Alabama, Arizona,
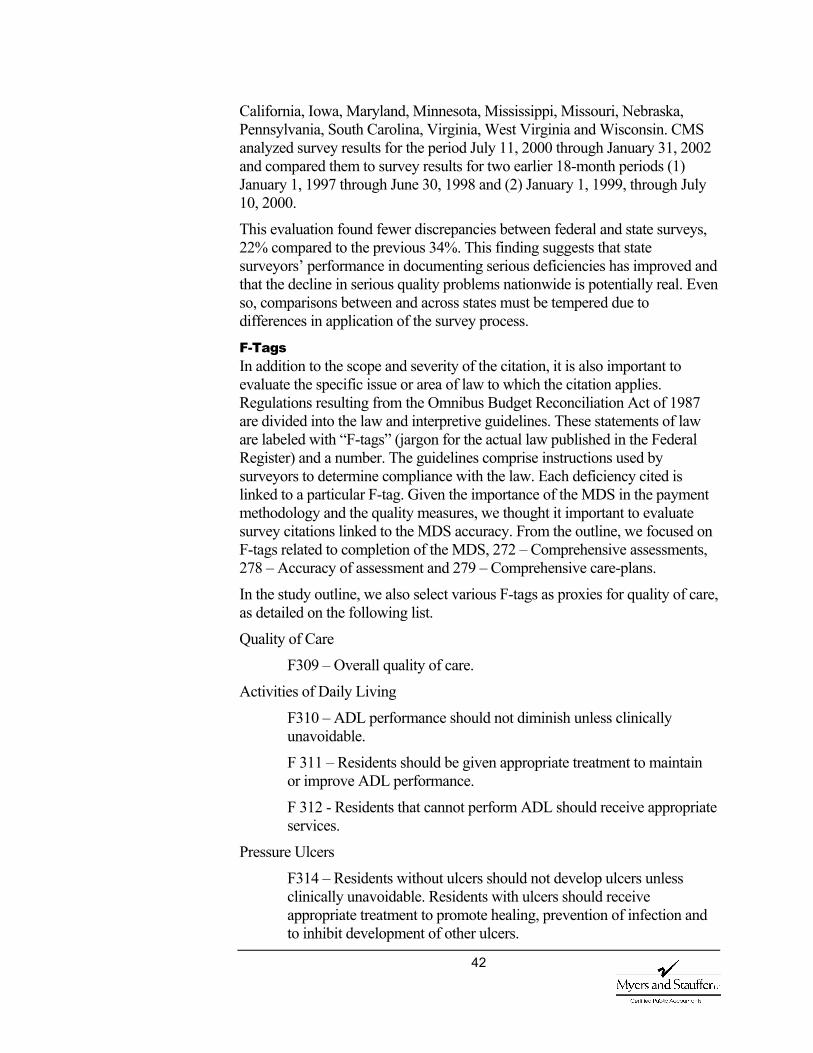
42
California, Iowa, Maryland, Minnesota, Mississippi, Missouri, Nebraska, Pennsylvania, South Carolina, Virginia, West Virginia and Wisconsin. CMS analyzed survey results for the period July 11, 2000 through January 31, 2002 and compared them to survey results for two earlier 18-month periods (1) January 1, 1997 through June 30, 1998 and (2) January 1, 1999, through July 10, 2000.
This evaluation found fewer discrepancies between federal and state surveys, 22% compared to the previous 34%. This finding suggests that state surveyors’ performance in documenting serious deficiencies has improved and that the decline in serious quality problems nationwide is potentially real. Even so, comparisons between and across states must be tempered due to differences in application of the survey process.
F-Tags In addition to the scope and severity of the citation, it is also important to evaluate the specific issue or area of law to which the citation applies. Regulations resulting from the Omnibus Budget Reconciliation Act of 1987 are divided into the law and interpretive guidelines. These statements of law are labeled with “F-tags” (jargon for the actual law published in the Federal Register) and a number. The guidelines comprise instructions used by surveyors to determine compliance with the law. Each deficiency cited is linked to a particular F-tag. Given the importance of the MDS in the payment methodology and the quality measures, we thought it important to evaluate survey citations linked to the MDS accuracy. From the outline, we focused on F-tags related to completion of the MDS, 272 – Comprehensive assessments, 278 – Accuracy of assessment and 279 – Comprehensive care-plans.
In the study outline, we also select various F-tags as proxies for quality of care, as detailed on the following list.
Quality of Care
F309 – Overall quality of care.
Activities of Daily Living
F310 – ADL performance should not diminish unless clinically unavoidable.
F 311 – Residents should be given appropriate treatment to maintain or improve ADL performance.
F 312 - Residents that cannot perform ADL should receive appropriate services.
Pressure Ulcers
F314 – Residents without ulcers should not develop ulcers unless clinically unavoidable. Residents with ulcers should receive appropriate treatment to promote healing, prevention of infection and to inhibit development of other ulcers.
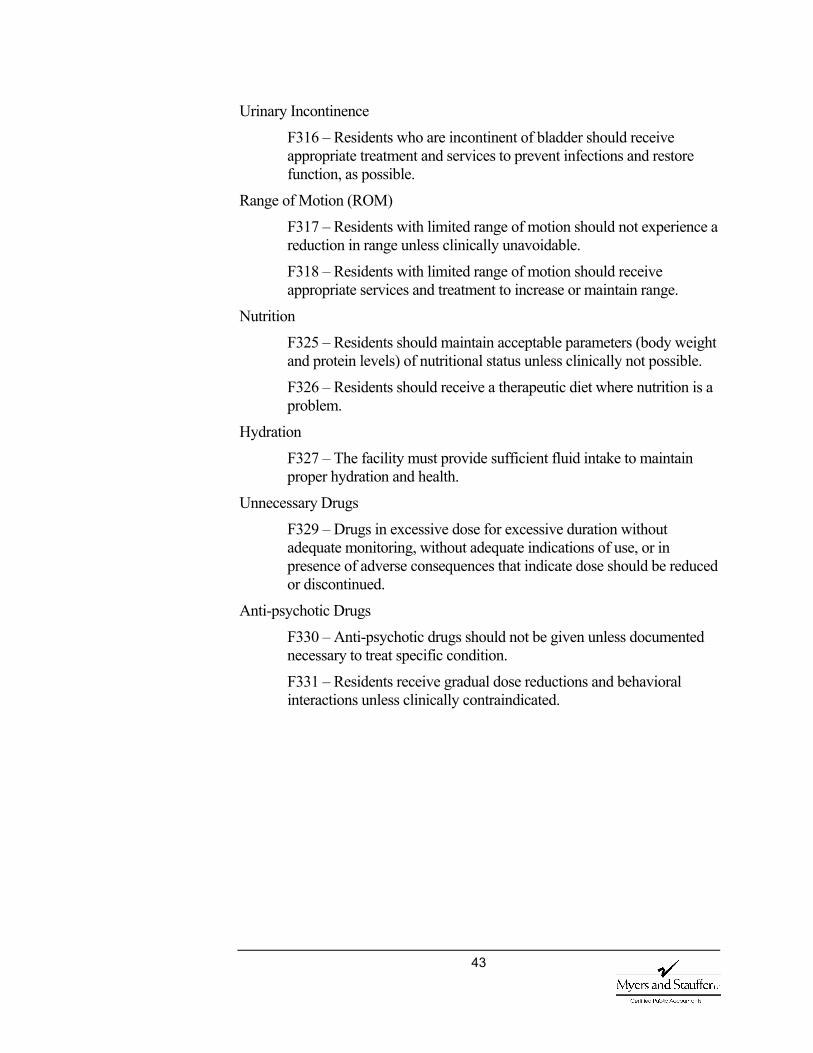
43
Urinary Incontinence
F316 – Residents who are incontinent of bladder should receive appropriate treatment and services to prevent infections and restore function, as possible.
Range of Motion (ROM)
F317 – Residents with limited range of motion should not experience a reduction in range unless clinically unavoidable.
F318 – Residents with limited range of motion should receive appropriate services and treatment to increase or maintain range.
Nutrition
F325 – Residents should maintain acceptable parameters (body weight and protein levels) of nutritional status unless clinically not possible.
F326 – Residents should receive a therapeutic diet where nutrition is a problem.
Hydration
F327 – The facility must provide sufficient fluid intake to maintain proper hydration and health.
Unnecessary Drugs
F329 – Drugs in excessive dose for excessive duration without adequate monitoring, without adequate indications of use, or in presence of adverse consequences that indicate dose should be reduced or discontinued.
Anti-psychotic Drugs
F330 – Anti-psychotic drugs should not be given unless documented necessary to treat specific condition.
F331 – Residents receive gradual dose reductions and behavioral interactions unless clinically contraindicated.
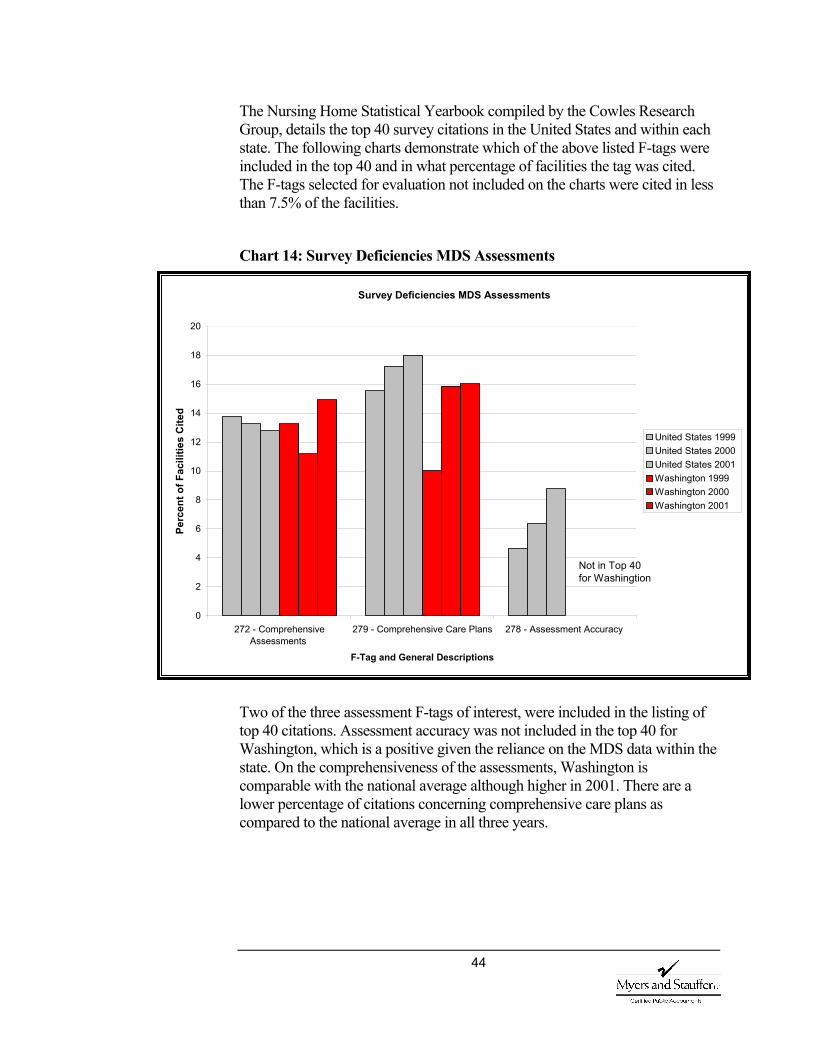
44
The Nursing Home Statistical Yearbook compiled by the Cowles Research Group, details the top 40 survey citations in the United States and within each state. The following charts demonstrate which of the above listed F-tags were included in the top 40 and in what percentage of facilities the tag was cited. The F-tags selected for evaluation not included on the charts were cited in less than 7.5% of the facilities.
Chart 14: Survey Deficiencies MDS Assessments
Two of the three assessment F-tags of interest, were included in the listing of top 40 citations. Assessment accuracy was not included in the top 40 for Washington, which is a positive given the reliance on the MDS data within the state. On the comprehensiveness of the assessments, Washington is comparable with the national average although higher in 2001. There are a lower percentage of citations concerning comprehensive care plans as compared to the national average in all three years.
Survey Deficiencies MDS Assessments
0
2
4
6
8
10
12
14
16
18
20
272 - ComprehensiveAssessments
279 - Comprehensive Care Plans 278 - Assessment Accuracy
F-Tag and General Descriptions
Perc
ent o
f Fac
ilitie
s C
ited
United States 1999 United States 2000 United States 2001Washington 1999Washington 2000 Washington 2001
Not in Top 40 for Washingtion
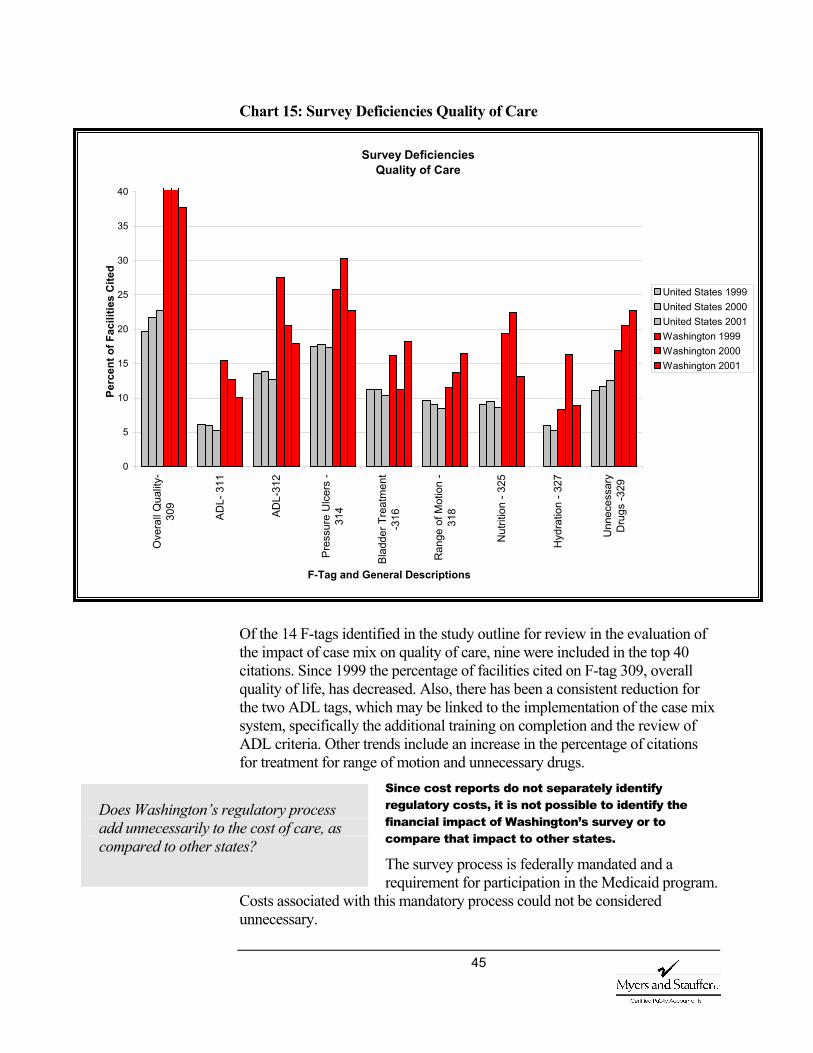
45
Chart 15: Survey Deficiencies Quality of Care
Of the 14 F-tags identified in the study outline for review in the evaluation of the impact of case mix on quality of care, nine were included in the top 40 citations. Since 1999 the percentage of facilities cited on F-tag 309, overall quality of life, has decreased. Also, there has been a consistent reduction for the two ADL tags, which may be linked to the implementation of the case mix system, specifically the additional training on completion and the review of ADL criteria. Other trends include an increase in the percentage of citations for treatment for range of motion and unnecessary drugs.
Since cost reports do not separately identify regulatory costs, it is not possible to identify the financial impact of Washington’s survey or to compare that impact to other states.
The survey process is federally mandated and a requirement for participation in the Medicaid program.
Costs associated with this mandatory process could not be considered unnecessary.
Does Washington’s regulatory process add unnecessarily to the cost of care, as compared to other states?
Survey Deficiencies Quality of Care
0
5
10
15
20
25
30
35
40
Ove
rall
Qua
lity-
309
ADL-
311
ADL-
312
Pres
sure
Ulc
ers
-31
4
Blad
der T
reat
men
t-3
16
Ran
ge o
f Mot
ion
-31
8
Nut
ritio
n - 3
25
Hyd
ratio
n - 3
27
Unn
eces
sary
Dru
gs -3
29
F-Tag and General Descriptions
Perc
ent o
f Fac
ilitie
s C
ited
United States 1999 United States 2000 United States 2001Washington 1999Washington 2000 Washington 2001
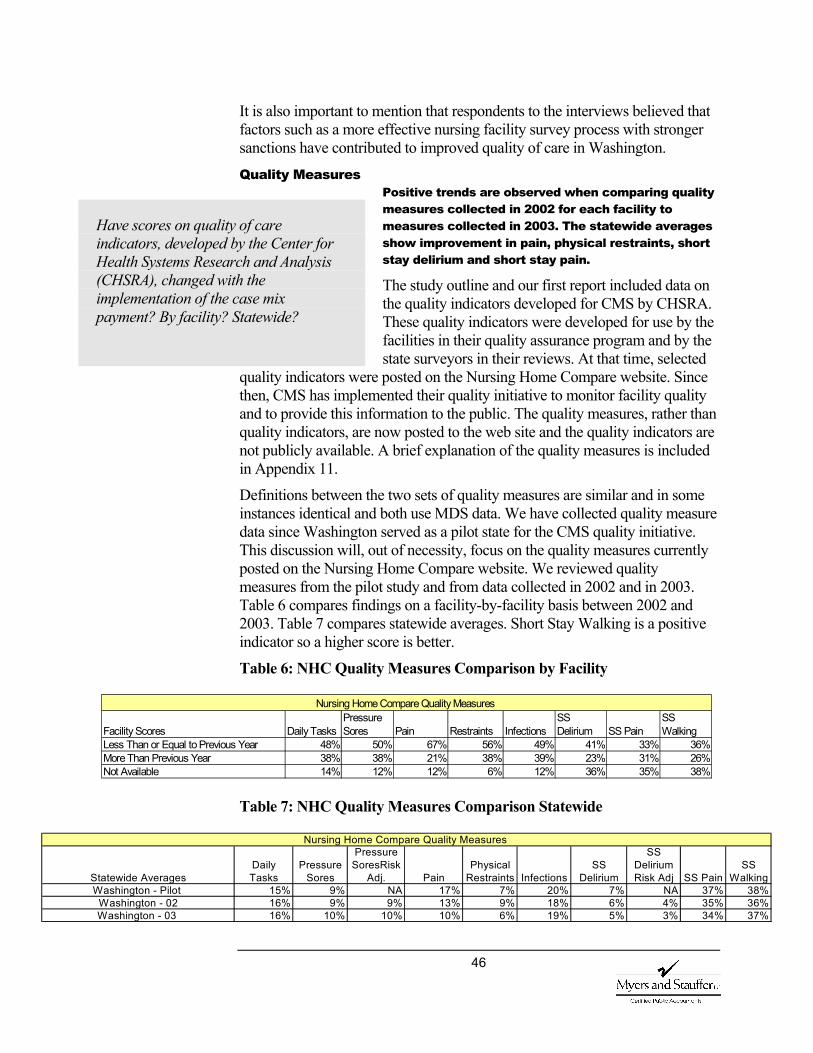
46
It is also important to mention that respondents to the interviews believed that factors such as a more effective nursing facility survey process with stronger sanctions have contributed to improved quality of care in Washington.
Quality Measures Positive trends are observed when comparing quality measures collected in 2002 for each facility to measures collected in 2003. The statewide averages show improvement in pain, physical restraints, short stay delirium and short stay pain.
The study outline and our first report included data on the quality indicators developed for CMS by CHSRA. These quality indicators were developed for use by the facilities in their quality assurance program and by the state surveyors in their reviews. At that time, selected
quality indicators were posted on the Nursing Home Compare website. Since then, CMS has implemented their quality initiative to monitor facility quality and to provide this information to the public. The quality measures, rather than quality indicators, are now posted to the web site and the quality indicators are not publicly available. A brief explanation of the quality measures is included in Appendix 11.
Definitions between the two sets of quality measures are similar and in some instances identical and both use MDS data. We have collected quality measure data since Washington served as a pilot state for the CMS quality initiative. This discussion will, out of necessity, focus on the quality measures currently posted on the Nursing Home Compare website. We reviewed quality measures from the pilot study and from data collected in 2002 and in 2003. Table 6 compares findings on a facility-by-facility basis between 2002 and 2003. Table 7 compares statewide averages. Short Stay Walking is a positive indicator so a higher score is better.
Table 6: NHC Quality Measures Comparison by Facility
Table 7: NHC Quality Measures Comparison Statewide
Have scores on quality of care indicators, developed by the Center for Health Systems Research and Analysis (CHSRA), changed with the implementation of the case mix payment? By facility? Statewide?
Facility Scores Daily Tasks Pressure Sores Pain Restraints Infections
SS Delirium SS Pain
SS Walking
Less Than or Equal to Previous Year 48% 50% 67% 56% 49% 41% 33% 36%More Than Previous Year 38% 38% 21% 38% 39% 23% 31% 26%Not Available 14% 12% 12% 6% 12% 36% 35% 38%
Nursing Home Compare Quality Measures
Statewide AveragesDaily Tasks
Pressure Sores
Pressure SoresRisk
Adj. PainPhysical
Restraints Infections SS
Delirium
SS Delirium Risk Adj SS Pain
SS Walking
Washington - Pilot 15% 9% NA 17% 7% 20% 7% NA 37% 38%Washington - 02 16% 9% 9% 13% 9% 18% 6% 4% 35% 36%Washington - 03 16% 10% 10% 10% 6% 19% 5% 3% 34% 37%
Nursing Home Compare Quality Measures
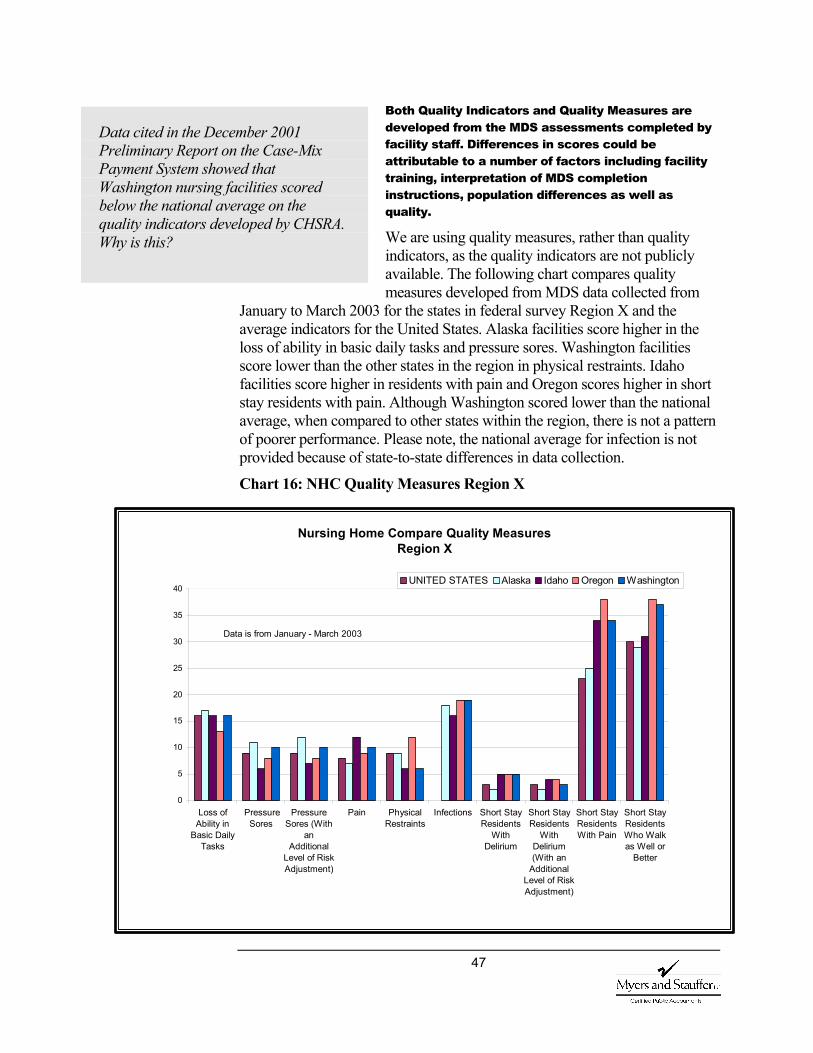
47
Both Quality Indicators and Quality Measures are developed from the MDS assessments completed by facility staff. Differences in scores could be attributable to a number of factors including facility training, interpretation of MDS completion instructions, population differences as well as quality.
We are using quality measures, rather than quality indicators, as the quality indicators are not publicly available. The following chart compares quality measures developed from MDS data collected from
January to March 2003 for the states in federal survey Region X and the average indicators for the United States. Alaska facilities score higher in the loss of ability in basic daily tasks and pressure sores. Washington facilities score lower than the other states in the region in physical restraints. Idaho facilities score higher in residents with pain and Oregon scores higher in short stay residents with pain. Although Washington scored lower than the national average, when compared to other states within the region, there is not a pattern of poorer performance. Please note, the national average for infection is not provided because of state-to-state differences in data collection.
Chart 16: NHC Quality Measures Region X
Data cited in the December 2001 Preliminary Report on the Case-Mix Payment System showed that Washington nursing facilities scored below the national average on the quality indicators developed by CHSRA. Why is this?
Nursing Home Compare Quality Measures Region X
0
5
10
15
20
25
30
35
40
Loss ofAbility in
Basic DailyTasks
PressureSores
PressureSores (With
anAdditional
Level of RiskAdjustment)
Pain PhysicalRestraints
Infections Short StayResidents
WithDelirium
Short StayResidents
WithDelirium(With an
AdditionalLevel of RiskAdjustment)
Short StayResidentsWith Pain
Short StayResidentsWho Walkas Well or
Better
UNITED STATES Alaska Idaho Oregon Washington
Data is from January - March 2003
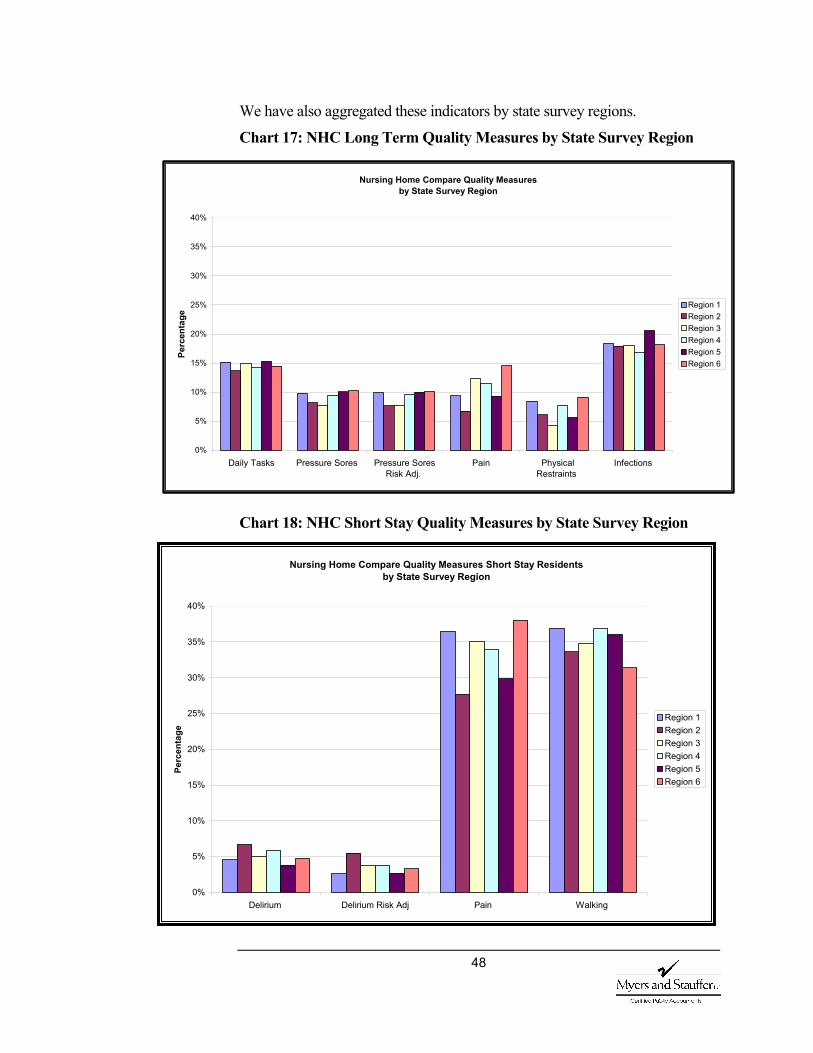
48
We have also aggregated these indicators by state survey regions.
Chart 17: NHC Long Term Quality Measures by State Survey Region
Chart 18: NHC Short Stay Quality Measures by State Survey Region
Nursing Home Compare Quality Measures Short Stay Residents by State Survey Region
0%
5%
10%
15%
20%
25%
30%
35%
40%
Delirium Delirium Risk Adj Pain Walking
Perc
enta
ge
Region 1 Region 2Region 3Region 4Region 5Region 6
Nursing Home Compare Quality Measures by State Survey Region
0%
5%
10%
15%
20%
25%
30%
35%
40%
Daily Tasks Pressure Sores Pressure SoresRisk Adj.
Pain PhysicalRestraints
Infections
Perc
enta
ge Region 1
Region 2Region 3Region 4Region 5Region 6
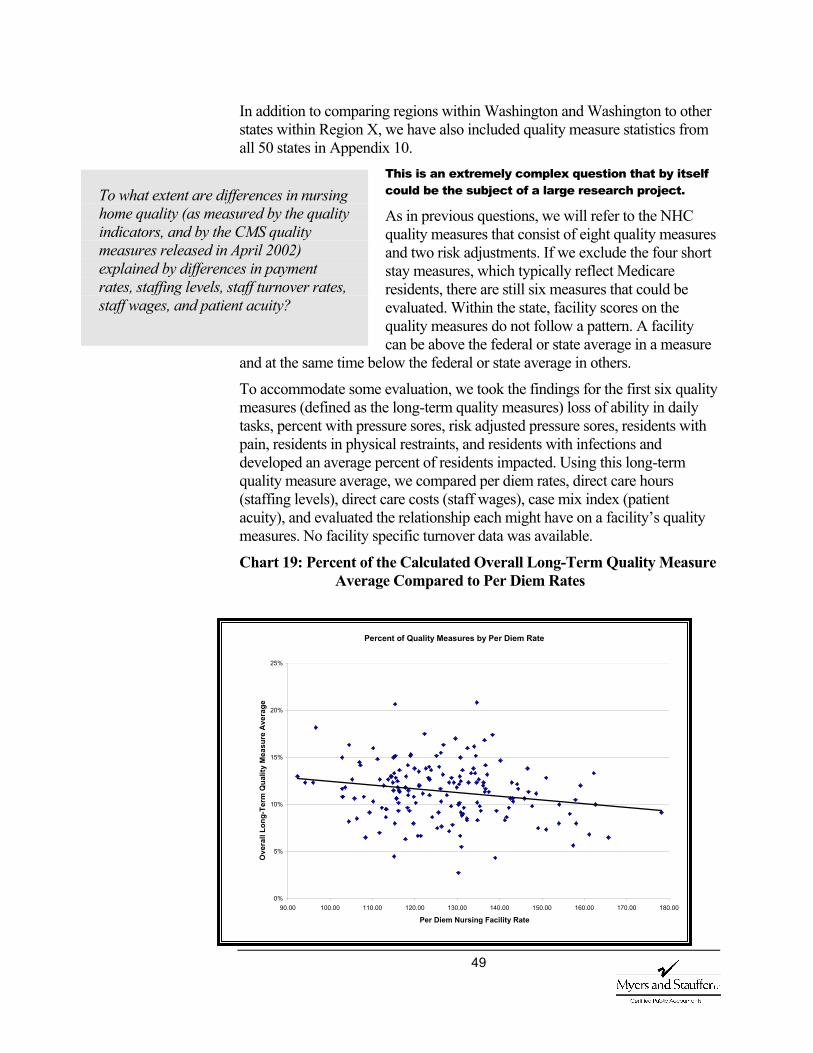
49
In addition to comparing regions within Washington and Washington to other states within Region X, we have also included quality measure statistics from all 50 states in Appendix 10.
This is an extremely complex question that by itself could be the subject of a large research project.
As in previous questions, we will refer to the NHC quality measures that consist of eight quality measures and two risk adjustments. If we exclude the four short stay measures, which typically reflect Medicare residents, there are still six measures that could be evaluated. Within the state, facility scores on the quality measures do not follow a pattern. A facility can be above the federal or state average in a measure
and at the same time below the federal or state average in others.
To accommodate some evaluation, we took the findings for the first six quality measures (defined as the long-term quality measures) loss of ability in daily tasks, percent with pressure sores, risk adjusted pressure sores, residents with pain, residents in physical restraints, and residents with infections and developed an average percent of residents impacted. Using this long-term quality measure average, we compared per diem rates, direct care hours (staffing levels), direct care costs (staff wages), case mix index (patient acuity), and evaluated the relationship each might have on a facility’s quality measures. No facility specific turnover data was available.
Chart 19: Percent of the Calculated Overall Long-Term Quality Measure Average Compared to Per Diem Rates
To what extent are differences in nursing home quality (as measured by the quality indicators, and by the CMS quality measures released in April 2002) explained by differences in payment rates, staffing levels, staff turnover rates, staff wages, and patient acuity?
Percent of Quality Measures by Per Diem Rate
0%
5%
10%
15%
20%
25%
90.00 100.00 110.00 120.00 130.00 140.00 150.00 160.00 170.00 180.00
Per Diem Nursing Facility Rate
Ove
rall
Long
-Ter
m Q
ualit
y M
easu
re A
vera
ge
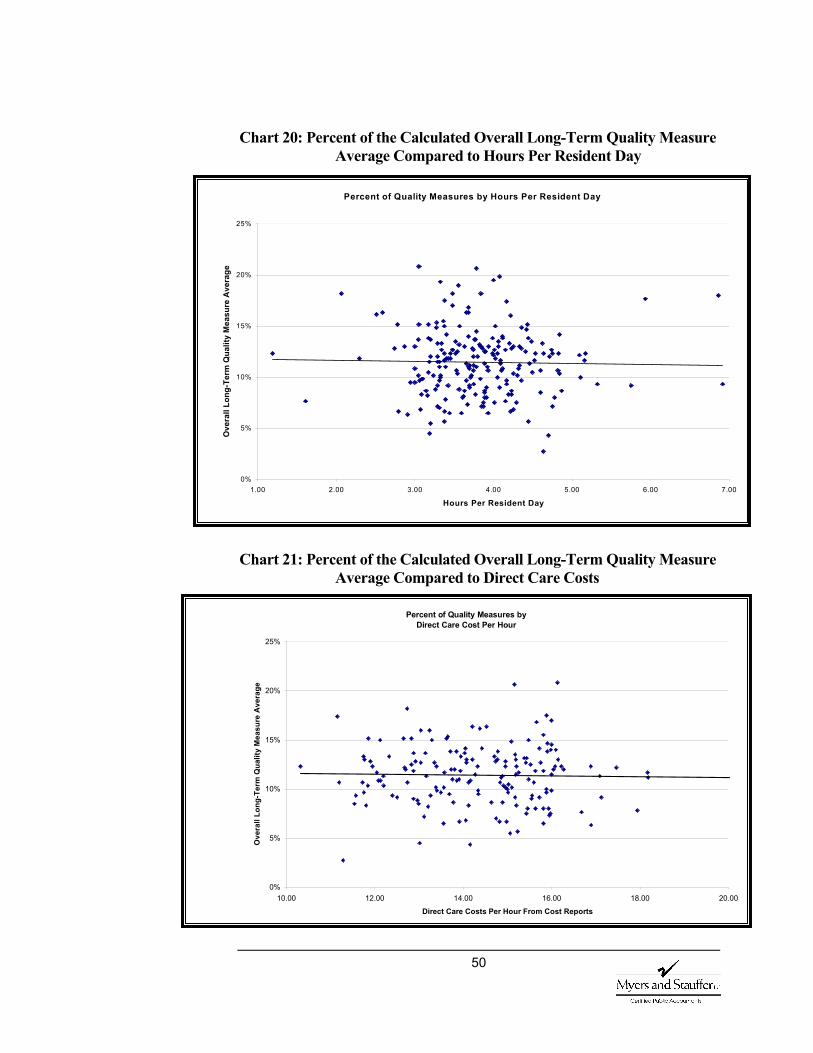
50
Chart 20: Percent of the Calculated Overall Long-Term Quality Measure Average Compared to Hours Per Resident Day
Chart 21: Percent of the Calculated Overall Long-Term Quality Measure Average Compared to Direct Care Costs
Percent of Quality Measures by Direct Care Cost Per Hour
0%
5%
10%
15%
20%
25%
10.00 12.00 14.00 16.00 18.00 20.00
Direct Care Costs Per Hour From Cost Reports
Ove
rall
Long
-Ter
m Q
ualit
y M
easu
re A
vera
ge
Percent of Quality Measures by Hours Per Resident Day
0%
5%
10%
15%
20%
25%
1.00 2.00 3.00 4.00 5.00 6.00 7.00
Hours Per Resident Day
Ove
rall
Long
-Ter
m Q
ualit
y M
easu
re A
vera
ge

51
Chart 22: Percent of the Calculated Overall Long-Term Quality Measure Average Compared to Case Mix Indices
Assuming an overall average of the scores is meaningful, the information still does not support a strong relationship between this calculated overall average and hours or direct care costs. There appears to be more direct relationship between the case mix index and the measures, which is to be expected, as the MDS data is the source of both. Also, there is an interesting relationship between rates and the overall long-term quality measure, since the same relationship is not demonstrated in hours or direct care costs. Although interesting, much additional research would
need to be done before reaching any conclusions. Direct care spending per resident day has increased by approximately 5% between 2001 and 2002.
The average spending per resident day in direct care spending increased from $62.06 in 2001 to $65.20 in 2002 or approximately 5%. When comparing the non-case mix adjusted direct care spending (Chart 23 and Chart 25), the spending shifts between 2001 and 2002 appear erratic and the 2002 distribution of direct care spending is unusual. However, when the direct care costs are case mix adjusted the 2002 data assumes a more normal distribution (Chart 24 and Chart 26).
Has there been a change in per resident day direct care spending?
Percent of Quality Measures by Case Mix Index
0%
5%
10%
15%
20%
25%
1.50 1.60 1.70 1.80 1.90 2.00 2.10 2.20 2.30 2.40Case Mix Indices
Ove
rall
Long
-Ter
m Q
ualit
y M
easu
re A
vera
ge
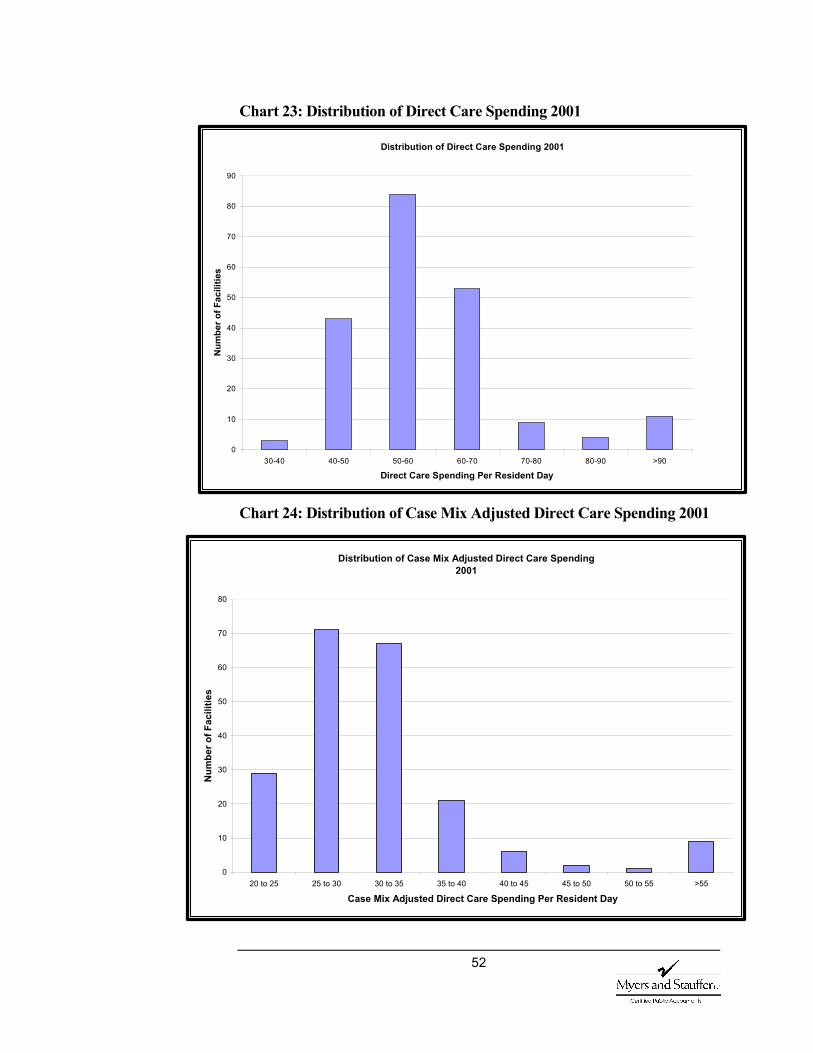
52
Chart 23: Distribution of Direct Care Spending 2001
Chart 24: Distribution of Case Mix Adjusted Direct Care Spending 2001
Distribution of Direct Care Spending 2001
0
10
20
30
40
50
60
70
80
90
30-40 40-50 50-60 60-70 70-80 80-90 >90
Direct Care Spending Per Resident Day
Num
ber o
f Fac
ilitie
s
Distribution of Case Mix Adjusted Direct Care Spending 2001
0
10
20
30
40
50
60
70
80
20 to 25 25 to 30 30 to 35 35 to 40 40 to 45 45 to 50 50 to 55 >55
Case Mix Adjusted Direct Care Spending Per Resident Day
Num
ber o
f Fac
ilitie
s

53
Chart 25: Distribution of Direct Care Spending 2002
Chart 26: Distribution of Case Mix Adjusted Direct Care Spending 2002
Distribution of Direct Care Spending 2002
0
10
20
30
40
50
60
70
80
90
100
30-40 40-50 50-60 60-70 70-80 80-90 90-100 >100
Direct Care Spending Per Resident Day
Num
ber o
f Fac
ilitie
s
Distribution of Case Mix Adjusted Direct Care Spending 2002
0
10
20
30
40
50
60
70
80
20 to 25 25 to 30 30 to 35 35 to 40 40 to 45 45 to 50 50 to 55 >55
Case Mix Adjusted Direct Care Spending Per Resident Day
Num
ber o
f Fac
ilitie
s
54
The percent of residents receiving restorative nursing as measured by the RUG calculation has decreased from 16% in the first quarter of 2000 to slightly less than 13% in the last quarter of 2002.
Individuals interviewed had mixed opinions about use of restorative services in nursing facilities. Responses ranged from decreasing due to inadequate reimbursement to increasing due to new emphasis on discharge and community placement.
Of the respondents to the questionnaire, 5% believed that restorative nursing had decreased while 26% believed that it had increased. Those responding increase linked it to case mix, while those responding decrease did not. The majority of both interviewees and questionnaire respondents believed that the amount of restorative nursing was unchanged.
When reviewing the MDS data, however, we see that although current case mix weights are higher for RUG categories with restorative nursing than comparable categories without, the percent of residents receiving restorative nursing decreased from 16% in the first quarter of 2000 to slightly less than 13% in the last quarter of 2002.
In the earlier discussion on survey deficiencies, it was noted that Washington had an increase in the percentage of citations for treatment for range of motion (restorative nursing). This could mean that more residents should be receiving restorative nursing.
Has there been an increase in residents receiving restorative nursing?
55
A facility must care for its residents in a manner and in an environment that promotes, maintains, or enhances each resident’s quality of life. The appraisal of one’s quality of life could be as varied as the individuals residing in the nursing facilities. A survey performed by the Jim Lehrer News Hour in partnership with the Kaiser Family Foundation, found that of people who had direct experience with nursing facilities, 72% believed that nursing facilities provided a safe and protected environment for the frail elderly and disabled, and 62% believed that nursing facilities had caring concerned staff.
Given the difficulty of defining quality of life, we again deferred to federal standard 42 CFR 483.15, which requires facilities to provide (a) dignity, (b) self-determination, (c) participation in resident and family groups, (d) participation in other activities, (e) accommodation of needs, (f) availability of facility provided activities, (g) social services and (h) a safe, clean, comfortable, and homelike environment. Quality of life is further defined in CFR 483.13(a) as freedom from chemical or physical restraints.
Interviews and Questionnaire The opinion of stakeholders is mixed on case mix and what, if any changes in quality of life are linked to the change in payment methodology.
Respondents offered a wide range of criteria that they would use to assess quality of life in nursing facilities. Many of these criteria overlapped with those that might be applied in assessing quality of care, and it appeared that the two concepts, quality of care and
quality of life, were closely related in the minds of most respondents.
Factors mentioned that contribute to improvement in quality of life include greater emphasis on resident rights, more oversight by the survey agency, better staff training, and residents and families becoming more knowledgeable and assertive consumers.
Again, staff shortages and turnover were mentioned by many respondents as primary factors contributing to problems with quality of life in nursing facilities.
Findings from the interviews shed light on changes that occurred in nursing facilities in the periods before and after implementation of case mix reimbursement. However, most respondents had difficulty identifying the relationship between case mix reimbursement and access, quality of care, or quality of life in nursing facilities. This may be due to the predominance of other factors, such as shortage of nurses or a tight bed supply in some areas of the state, or the impact of the hold harmless provisions.
Approximately 32% of the respondents to the questionnaire felt that the quality of life in nursing facilities had improved. Of those, 50% believed the
Q U A L I T Y O F
L I F E
What are the views of stakeholders on case mix payment? Do stakeholders perceive a change in quality of life? Is this in part due to the change in payment methodology?
56
change was due to the change in payment methodology. The other 50% had no opinion as to the cause. The 26% that felt the quality of life had declined were evenly divided as to the cause. A third thought the change was due to the payment methodology, a third did not and the remaining third expressed no opinion on the cause. The remaining 42% believed the quality of life was unchanged.
Survey Findings There has been a reduction in the percent of facilities cited in several of the quality of life areas covered by survey.
As in the quality of care discussion, we relied on the Code of Federal Regulation to define quality of life. We accumulated information on percentages of F-tag citations related to this quality of life definition. F-tags
included in the study outline to review included:
Quality of Life – F-Tags F240 – Overall quality of life.
Dignity
F241 – Maintain or enhance each resident’s dignity and respect in full recognition of his or her individuality.
Self-determination and participation
F242 – The resident has the right to choose activities, schedules, and health care, interact with members of the community (in and out of facility), make choices about aspects of his or her life and participate in resident and family groups.
F243 – Dealings with resident or family groups are explained in this section.
F244 – Facility must listen to views and act upon grievances and recommendations of residents and families concerning proposed policy and operational decisions.
Participation in other activities
F245 – A resident has the right to participate in social, religious, and community activities that do not interfere with the rights of other residents.
Accommodation of needs
F246 – A resident should receive services with reasonable accommodations of individual needs and preferences except when health or safety or the individual or other residents would be endangered.
Has quality of life in nursing facilities, as measured by survey findings changed with the implementation of case mix payment?

57
F247 – A resident should receive notice before a room or roommate is changed.
Activities
F248 – (1) The facility must provide for an ongoing program of activities designed to meet the interests and the physical, mental, and psychosocial well being of each resident (2) A qualified professional must direct the activities program.
F249 – Alternative qualifications.
F250 – The facility must provide medically related social services to attain or maintain the highest practicable physical, mental, and psychosocial well being of each resident.
F 251 – A facility with more than 120 beds must employ a qualified social worker on a full-time basis.
Environment
F252 – A facility must provide a safe, clean, comfortable and homelike environment, allowing the resident to use his or her personal belongings to the extent possible.
F 253 – A facility must provide housekeeping and maintenance services necessary to maintain a sanitary, orderly, and comfortable interior.
F 254 – A facility must provide clean bed and bath linens that are in good condition.
F 255 – A facility must provide private closet space in each resident room.
F 256 – A facility must provide adequate and comfortable lighting levels in all areas.
F257 – A facility must provide comfortable and safe temperature levels.
F258 – A facility must provide the maintenance of comfortable sound levels.
Restraints
F221 – Physical restraints.
F222 – Chemical restraints.
The Nursing Home Statistical Yearbook compiled by the Cowles Research Group, details the top 40 survey citations in the United States and within each state. The following charts demonstrate which of the above listed F-tags were included in the top 40 and in what percentage of facilities the tag was cited.
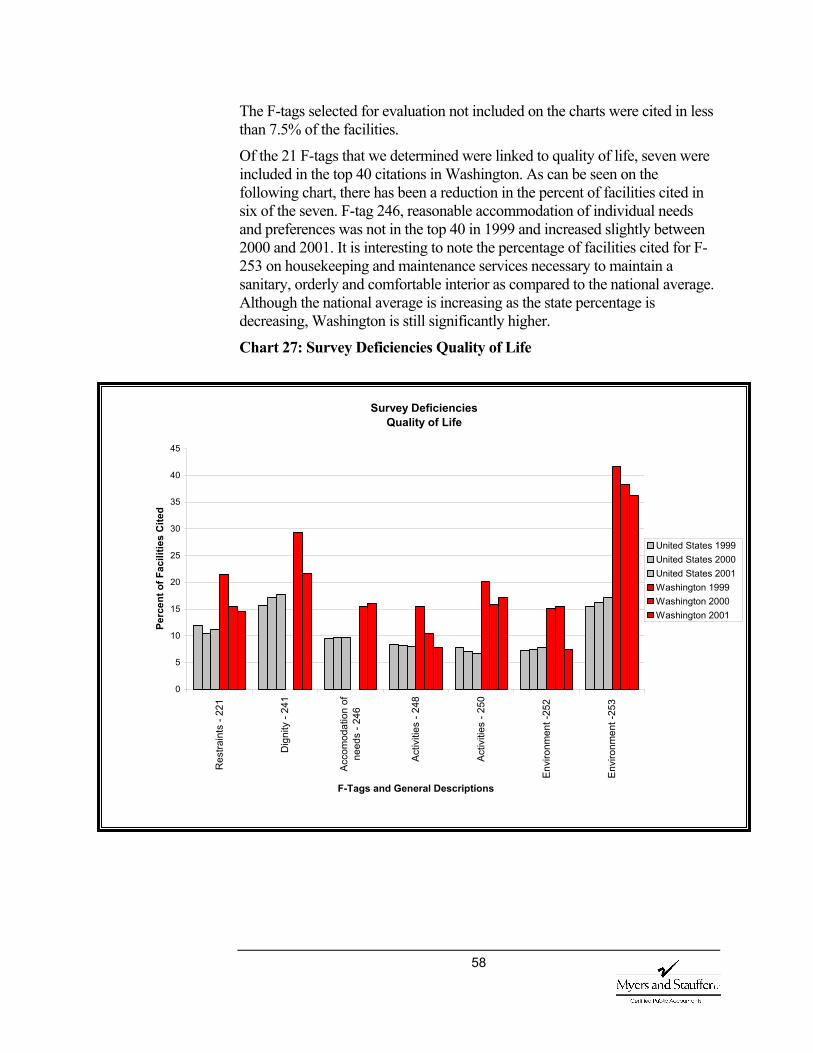
58
The F-tags selected for evaluation not included on the charts were cited in less than 7.5% of the facilities.
Of the 21 F-tags that we determined were linked to quality of life, seven were included in the top 40 citations in Washington. As can be seen on the following chart, there has been a reduction in the percent of facilities cited in six of the seven. F-tag 246, reasonable accommodation of individual needs and preferences was not in the top 40 in 1999 and increased slightly between 2000 and 2001. It is interesting to note the percentage of facilities cited for F-253 on housekeeping and maintenance services necessary to maintain a sanitary, orderly and comfortable interior as compared to the national average. Although the national average is increasing as the state percentage is decreasing, Washington is still significantly higher.
Chart 27: Survey Deficiencies Quality of Life
Survey DeficienciesQuality of Life
0
5
10
15
20
25
30
35
40
45
Res
train
ts -
221
Dig
nity
- 24
1
Acco
mod
atio
n of
need
s - 2
46
Activ
ities
- 24
8
Activ
ities
- 25
0
Envi
ronm
ent -
252
Envi
ronm
ent -
253
F-Tags and General Descriptions
Perc
ent o
f Fac
ilitie
s C
ited
United States 1999 United States 2000 United States 2001Washington 1999Washington 2000 Washington 2001
59
Much additional information would be needed to support either the conclusion that quality of life is lower in Washington facilities or that the survey process has been implemented in a more stringent manner. Given only the average number of deficiencies cited concluding either would be incorrect.
Quality of care and quality of life are directly linked. If inadequate care were provided, it would be difficult to maintain a good quality of life. As quality of care and quality of life are directly linked, our evaluations and
recommendations are the same or similar. Questions asked in the quality of care discussion were also asked about quality of life.
Please refer to the discussion of these items in the prior discussion of quality of care on page 40.
Positive trends are observed when comparing quality measures collected in 2002 for each facility to measures collected in 2003. The statewide averages show improvement in pain, physical restraints, short stay delirium and short stay pain.
Please refer to the discussion on page 46.
Both Quality Indicators and Quality Measures are developed from the MDS assessments completed by facility staff. Differences in scores could be attributable to a number of factors including facility training, interpretation of MDS completion instructions, population differences as well as quality.
Please refer to the discussion on page 47.
Do nursing facilities in Washington in fact provide a lower quality of life than their peers in other states? Or is Washington’s nursing home survey process more stringent than in most other states? If the latter, is it unreasonably stringent?
Have scores on quality of care indicators, developed by CHSRA, changed with the implementation of the case mix payment? By facility? Statewide?
Data cited in the December 2001 Preliminary Report on the Case-Mix Payment System showed that Washington nursing facilities scored below the national average on the quality indicators developed by the Center for Health Services Research and Quality. Why is this?
60
The RUG-III indices were developed using salary weighted professional nursing and aide time expended while caring for nursing facility residents. The analyses address the question of whether or not incorporating a calculation that recognizes these differences into the rate has impacted staffing hours or dollars. In addition to evaluating nursing hours per resident day and direct care costs as reported on the cost reports, we developed and distributed a salary and benefit survey to all nursing facilities within the state. We also included questions about wages and benefits in the questionnaire.
Interviews and Questionnaire The majority of those interviewed felt that the wage and benefit levels had either increased slightly or were unchanged. Respondents were mixed on the linkage to case mix. Many respondents did not work with this information and did not have a response.
We also included questions about wages and benefits on the questionnaire. Of those responding, 21% felt wage and benefit levels had increased and 50% of those believe it was indirectly linked to case mix. Only 10% believed that wage and benefit levels had decreased. Half of those believe the change was linked to case mix. Thirty seven percent believed that wage and benefit levels were unchanged and 32% had no opinion.
Nursing Home Compare Data Washington facilities provide on the average .3 hours more of direct care nursing per resident day than the national average. There has been a slight reduction in the percentage of professional nursing time as compared to total direct care.
Staffing hours as reported on NHC range from a low of 3.1 hours in South Dakota to a high of 6.3 in
Alaska with a national average of 3.9 hours per resident day. Washington averages 4.2 hours per day, which is an increase from the 4.0 hours reported in 2002.
There has been very little change in the distribution of direct care staff. The percent of professional staff compared to total direct care reduced by less than 1%. There is some variability in the distribution between RN and LPN in various regions, although the overall staffing mix is fairly consistent among state survey regions as can be seen in Chart 28. Also there was a slightly higher percentage of professional to aide staff with, on average, 38% of direct care attributable to RN and LPN nursing time, which equals the national average. Comparisons of the distribution across all states are illustrated in Chart 29.
W A G E A N D
B E N E F I T
L E V E L S
How do staffing levels compare to other states? Has the distribution of direct care staffing changed?
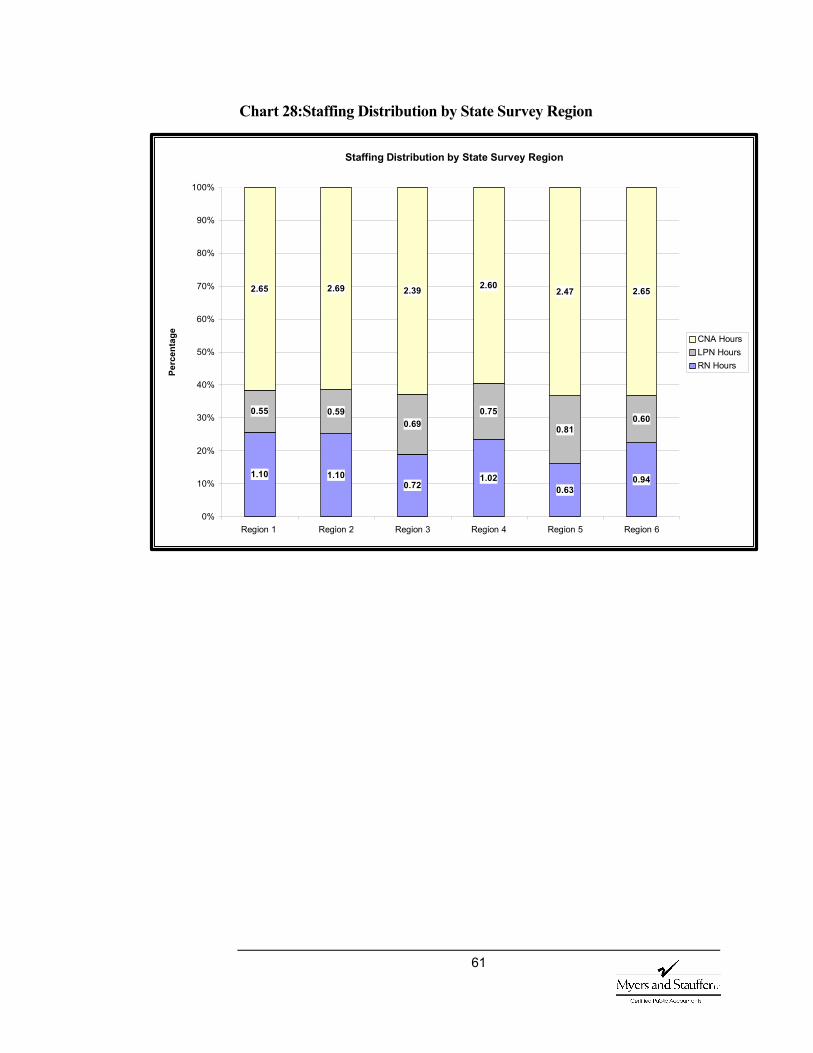
61
Chart 28:Staffing Distribution by State Survey Region
Staffing Distribution by State Survey Region
1.10 1.100.72
1.020.63
0.94
0.55 0.590.69
0.75
0.810.60
2.65 2.69 2.39 2.602.47 2.65
0%
10%
20%
30%
40%
50%
60%
70%
80%
90%
100%
Region 1 Region 2 Region 3 Region 4 Region 5 Region 6
Perc
enta
ge CNA Hours LPN Hours RN Hours
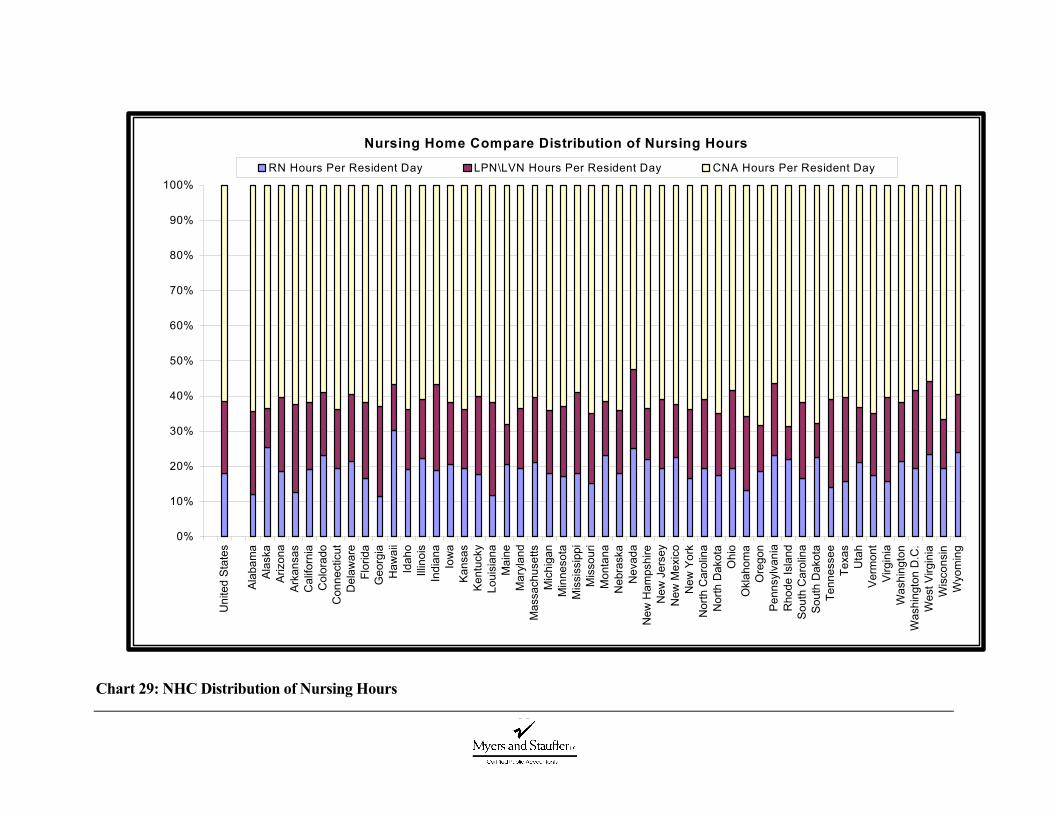
62
Chart 29: NHC Distribution of Nursing Hours
Nursing Home Compare Distribution of Nursing Hours
0%
10%
20%
30%
40%
50%
60%
70%
80%
90%
100%
Uni
ted
Stat
es
Alab
ama
Alas
kaAr
izon
aAr
kans
asC
alifo
rnia
Col
orad
oC
onne
ctic
utD
elaw
are
Flor
ida
Geo
rgia
Haw
aii
Idah
oIll
inoi
sIn
dian
aIo
wa
Kans
asKe
ntuc
kyLo
uisi
ana
Mai
neM
aryl
and
Mas
sach
uset
tsM
ichi
gan
Min
neso
taM
issi
ssip
piM
isso
uri
Mon
tana
Neb
rask
aN
evad
aN
ew H
amps
hire
New
Jer
sey
New
Mex
ico
New
Yor
kN
orth
Car
olin
aN
orth
Dak
ota
Ohi
oO
klah
oma
Ore
gon
Penn
sylv
ania
Rho
de Is
land
Sout
h C
arol
ina
Sout
h D
akot
aTe
nnes
see
Texa
sU
tah
Verm
ont
Virg
inia
Was
hing
ton
Was
hing
ton
D.C
.W
est V
irgin
iaW
isco
nsin
Wyo
min
g
RN Hours Per Resident Day LPN\LVN Hours Per Resident Day CNA Hours Per Resident Day
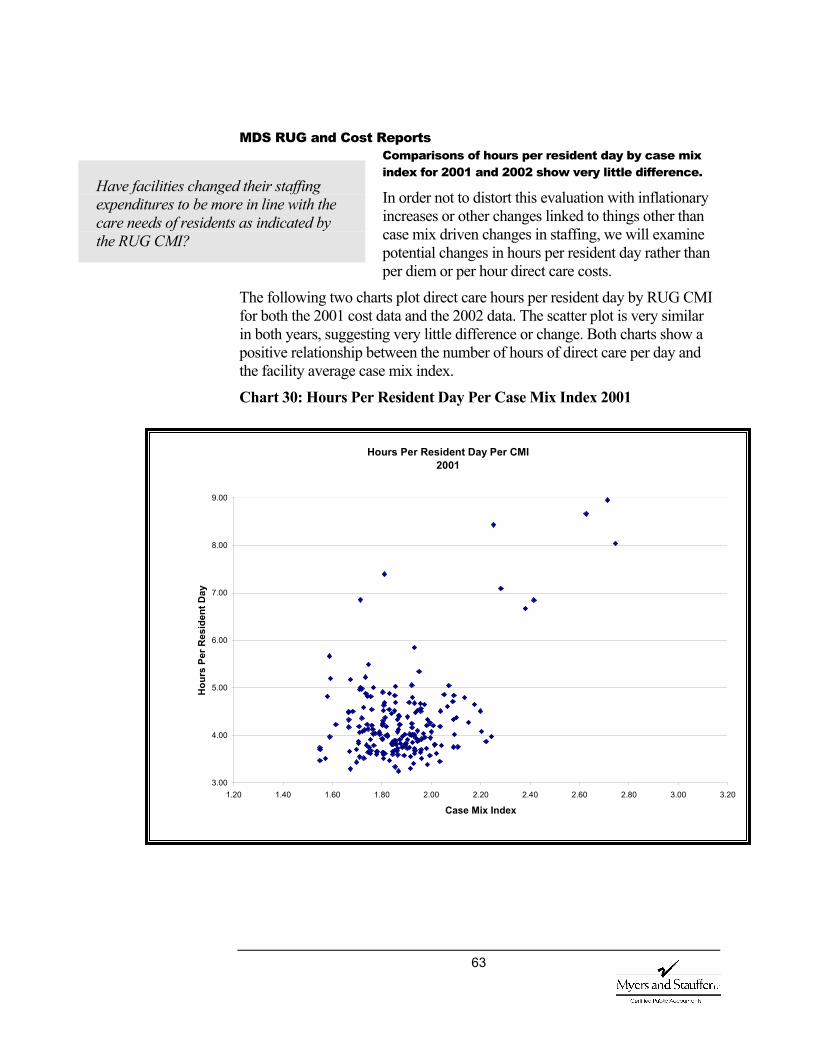
63
MDS RUG and Cost Reports Comparisons of hours per resident day by case mix index for 2001 and 2002 show very little difference.
In order not to distort this evaluation with inflationary increases or other changes linked to things other than case mix driven changes in staffing, we will examine potential changes in hours per resident day rather than per diem or per hour direct care costs.
The following two charts plot direct care hours per resident day by RUG CMI for both the 2001 cost data and the 2002 data. The scatter plot is very similar in both years, suggesting very little difference or change. Both charts show a positive relationship between the number of hours of direct care per day and the facility average case mix index.
Chart 30: Hours Per Resident Day Per Case Mix Index 2001
Have facilities changed their staffing expenditures to be more in line with the care needs of residents as indicated by the RUG CMI?
Hours Per Resident Day Per CMI 2001
3.00
4.00
5.00
6.00
7.00
8.00
9.00
1.20 1.40 1.60 1.80 2.00 2.20 2.40 2.60 2.80 3.00 3.20
Case Mix Index
Hou
rs P
er R
esid
ent D
ay
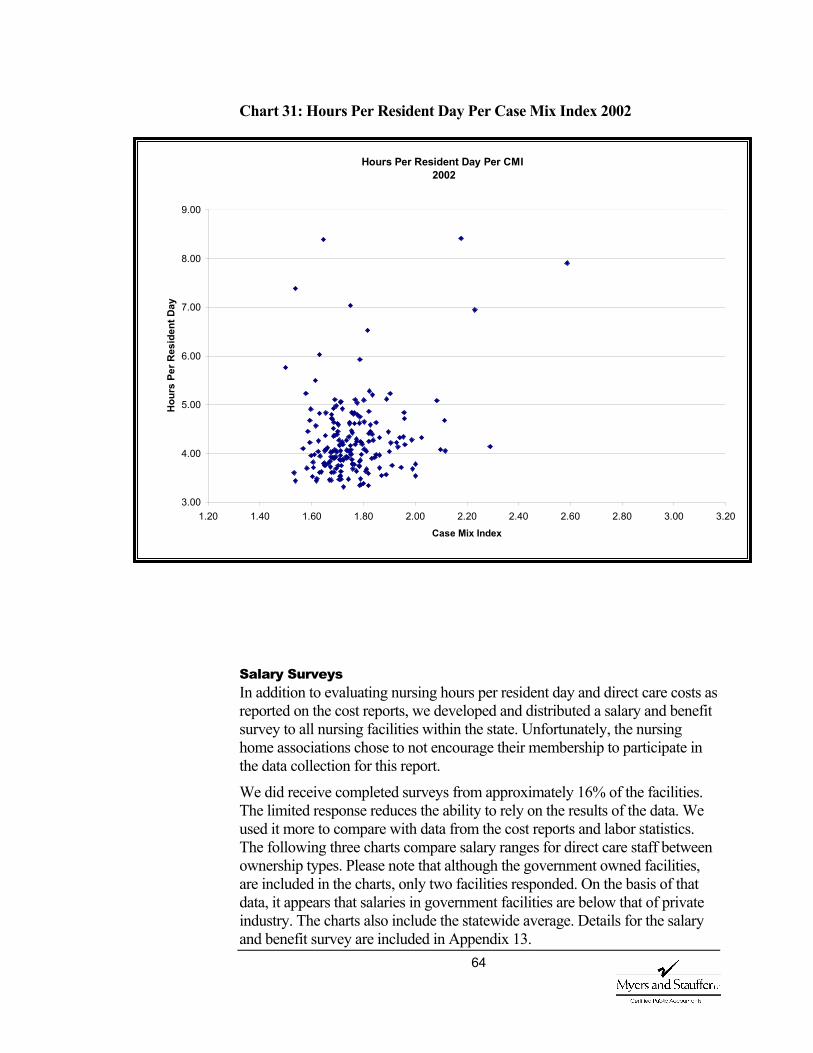
64
Chart 31: Hours Per Resident Day Per Case Mix Index 2002
Salary Surveys In addition to evaluating nursing hours per resident day and direct care costs as reported on the cost reports, we developed and distributed a salary and benefit survey to all nursing facilities within the state. Unfortunately, the nursing home associations chose to not encourage their membership to participate in the data collection for this report.
We did receive completed surveys from approximately 16% of the facilities. The limited response reduces the ability to rely on the results of the data. We used it more to compare with data from the cost reports and labor statistics. The following three charts compare salary ranges for direct care staff between ownership types. Please note that although the government owned facilities, are included in the charts, only two facilities responded. On the basis of that data, it appears that salaries in government facilities are below that of private industry. The charts also include the statewide average. Details for the salary and benefit survey are included in Appendix 13.
Hours Per Resident Day Per CMI 2002
3.00
4.00
5.00
6.00
7.00
8.00
9.00
1.20 1.40 1.60 1.80 2.00 2.20 2.40 2.60 2.80 3.00 3.20Case Mix Index
Hou
rs P
er R
esid
ent D
ay

65
Chart 32: Wage Rate Per Hour for Registered Nurses
Chart 33: Wage Rate Per Hour for Licensed Practical Nurses
Nurse - Registered
15.00
17.00
19.00
21.00
23.00
25.00
27.00
29.00
Dol
lars
Per
Hou
r
Nurse Registered Average Entry 18.37 19.24 17.24 18.57Nurse Registered Average Top 24.01 27.13 26.33 25.11Nurse Registered Average orCurrent
21.81 23.57 22.87 22.42
For Profit Not For Profit Government Statewide
Nurse - Licensed Practical
10.00
12.00
14.00
16.00
18.00
20.00
22.00
24.00
Dol
lars
Per
Hou
r
Nurse Licensed Practical Average Entry 15.40 15.61 11.83 15.29Nurse Licensed Practical Average Top 19.78 21.00 18.59 20.12Nurse Licensed Practical Average orCurrent
17.70 18.61 16.15 17.91
For Profit Not For Profit Government Statewide
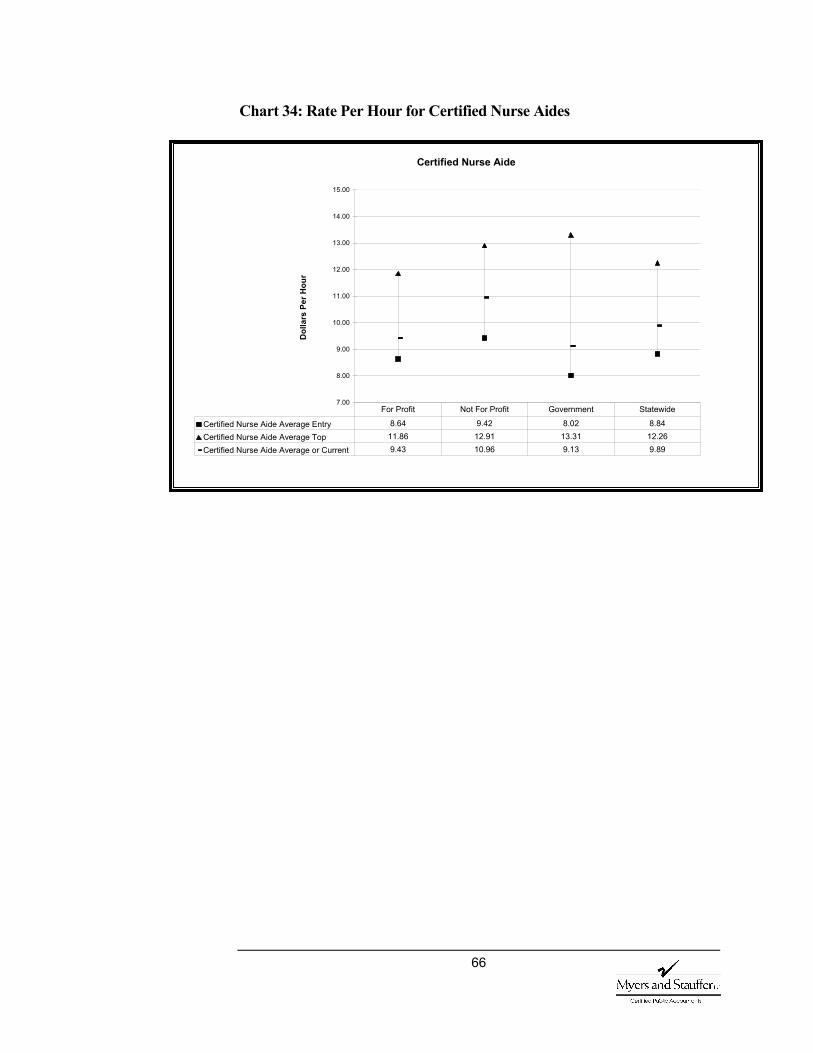
66
Chart 34: Rate Per Hour for Certified Nurse Aides
Certified Nurse Aide
7.00
8.00
9.00
10.00
11.00
12.00
13.00
14.00
15.00
Dol
lars
Per
Hou
r
Certified Nurse Aide Average Entry 8.64 9.42 8.02 8.84Certified Nurse Aide Average Top 11.86 12.91 13.31 12.26Certified Nurse Aide Average or Current 9.43 10.96 9.13 9.89
For Profit Not For Profit Government Statewide
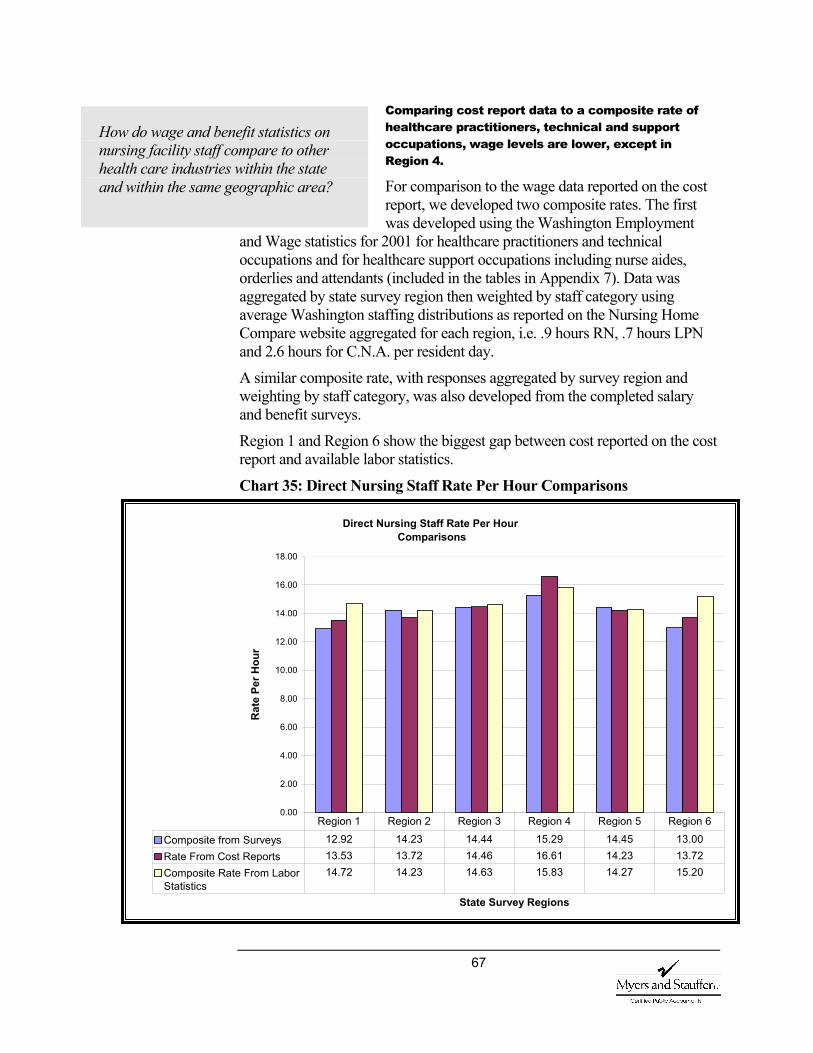
67
Comparing cost report data to a composite rate of healthcare practitioners, technical and support occupations, wage levels are lower, except in Region 4.
For comparison to the wage data reported on the cost report, we developed two composite rates. The first was developed using the Washington Employment
and Wage statistics for 2001 for healthcare practitioners and technical occupations and for healthcare support occupations including nurse aides, orderlies and attendants (included in the tables in Appendix 7). Data was aggregated by state survey region then weighted by staff category using average Washington staffing distributions as reported on the Nursing Home Compare website aggregated for each region, i.e. .9 hours RN, .7 hours LPN and 2.6 hours for C.N.A. per resident day.
A similar composite rate, with responses aggregated by survey region and weighting by staff category, was also developed from the completed salary and benefit surveys.
Region 1 and Region 6 show the biggest gap between cost reported on the cost report and available labor statistics.
Chart 35: Direct Nursing Staff Rate Per Hour Comparisons
How do wage and benefit statistics on nursing facility staff compare to other health care industries within the state and within the same geographic area?
Direct Nursing Staff Rate Per Hour Comparisons
0.00
2.00
4.00
6.00
8.00
10.00
12.00
14.00
16.00
18.00
State Survey Regions
Rat
e Pe
r Hou
r
Composite from Surveys 12.92 14.23 14.44 15.29 14.45 13.00Rate From Cost Reports 13.53 13.72 14.46 16.61 14.23 13.72Composite Rate From LaborStatistics
14.72 14.23 14.63 15.83 14.27 15.20
Region 1 Region 2 Region 3 Region 4 Region 5 Region 6
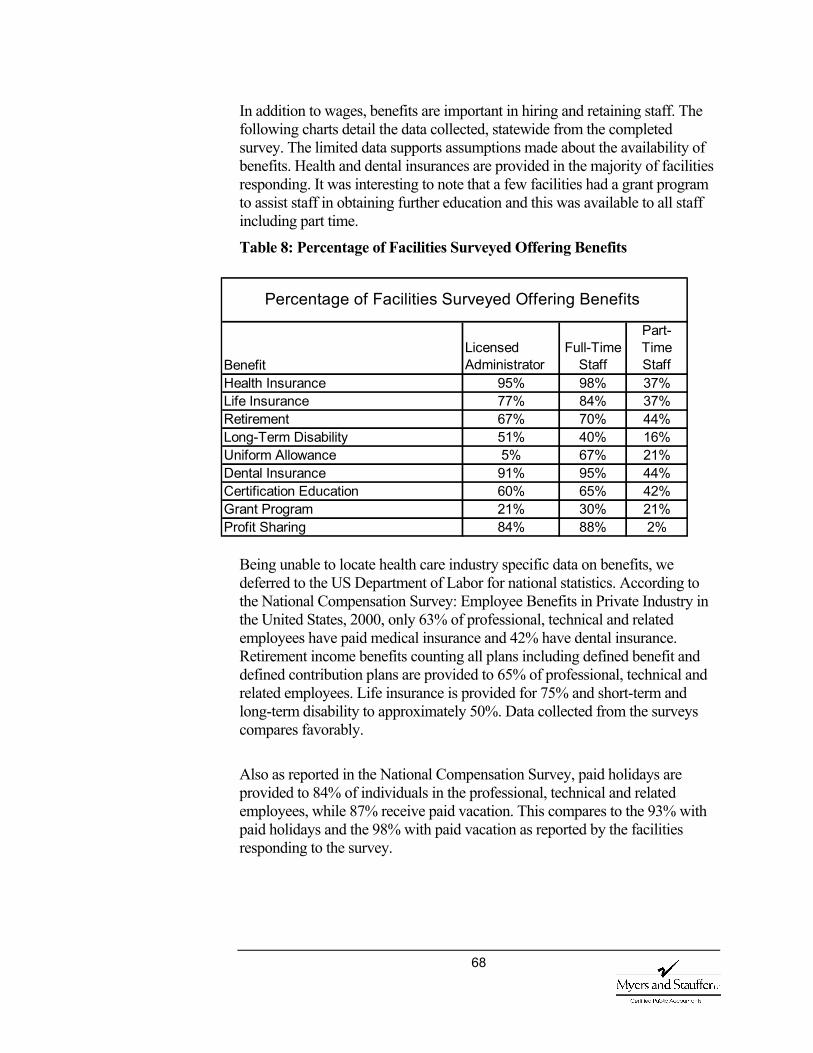
68
In addition to wages, benefits are important in hiring and retaining staff. The following charts detail the data collected, statewide from the completed survey. The limited data supports assumptions made about the availability of benefits. Health and dental insurances are provided in the majority of facilities responding. It was interesting to note that a few facilities had a grant program to assist staff in obtaining further education and this was available to all staff including part time.
Table 8: Percentage of Facilities Surveyed Offering Benefits
Being unable to locate health care industry specific data on benefits, we deferred to the US Department of Labor for national statistics. According to the National Compensation Survey: Employee Benefits in Private Industry in the United States, 2000, only 63% of professional, technical and related employees have paid medical insurance and 42% have dental insurance. Retirement income benefits counting all plans including defined benefit and defined contribution plans are provided to 65% of professional, technical and related employees. Life insurance is provided for 75% and short-term and long-term disability to approximately 50%. Data collected from the surveys compares favorably.
Also as reported in the National Compensation Survey, paid holidays are provided to 84% of individuals in the professional, technical and related employees, while 87% receive paid vacation. This compares to the 93% with paid holidays and the 98% with paid vacation as reported by the facilities responding to the survey.
BenefitLicensed Administrator
Full-Time Staff
Part-Time Staff
Health Insurance 95% 98% 37%Life Insurance 77% 84% 37%Retirement 67% 70% 44%Long-Term Disability 51% 40% 16%Uniform Allowance 5% 67% 21%Dental Insurance 91% 95% 44%Certification Education 60% 65% 42%Grant Program 21% 30% 21%Profit Sharing 84% 88% 2%
Percentage of Facilities Surveyed Offering Benefits
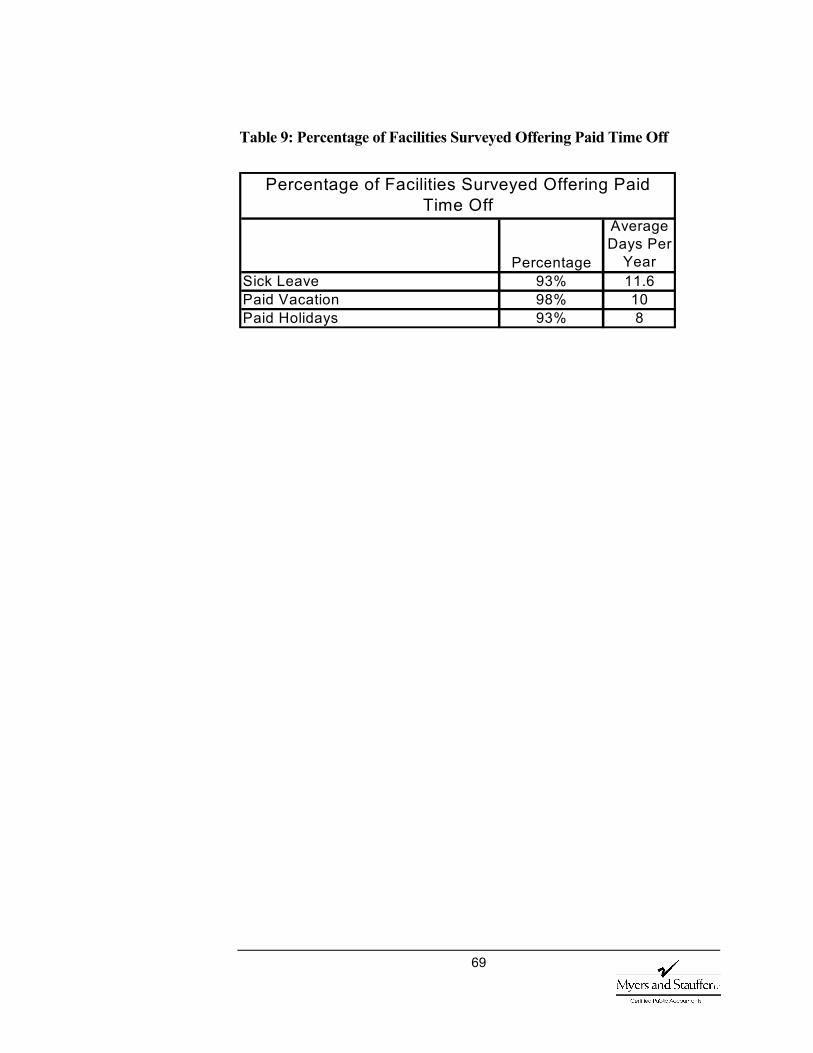
69
Table 9: Percentage of Facilities Surveyed Offering Paid Time Off
Percentage
Average Days Per
YearSick Leave 93% 11.6Paid Vacation 98% 10Paid Holidays 93% 8
Percentage of Facilities Surveyed Offering Paid Time Off
70
VI. Recommendations General Recommendation During the study, we compared data collected for the periods prior to full implementation of the case mix payment with data collected since July 1, 2002. Data sources for the report included literature reviews, interviews and questionnaires, surveys of other case mix states, facility salary and benefit surveys, MDS assessments, cost reports and rate calculations, survey findings, and quality measures.
Since the implementation of the case mix payment system did not occur in a vacuum, we evaluated and where necessary accounted for various demographic and program considerations.
As a result of our review, we recommend continuing the current methodology with the possible addition of incentives structured to assist in meeting the goals of access and quality.
The impetus for the current case mix system began as early as 1994. The system was designed and developed over several years with input from various stakeholders and interested parties. Full implementation of the system is currently only in the second year of payment. The interviews and questionnaires provided mixed opinions concerning the impact of case mix. Our comparisons of the available data for the time periods under consideration suggest no negative impact on access, quality of care, quality of life, or wage and benefit levels, and in some cases a possible positive impact.
Case mix payment systems are complex and stakeholder goals may sometimes be conflicting. Although a given payment methodology cannot address all issues or solve all problems, systems should be developed to attain as many goals and objectives as possible. One way to encourage specific behaviors is through incentive programs added to the basic rate calculation. Several incentives are discussed and could be implemented individually or as part of an overall access and quality program structured to address legislative goals.
Many states are currently experiencing fiscal crisis, making enhancement to systems difficult. Implementation of the discussed changes to the methodology without changing funding levels could be achieved by reallocating available dollars. Although additional funding would make implementation of incentives easier, a budget neutral requirement should not preclude the adjustments to the methodology. Any reallocation would have to
71
be evaluated and monitored to assure that the desired incentives within the system were attained and maintained.
Consider developing exceptional rate criteria
Consider incentives for cognitive impairment and behavior problems
Continue to develop and encourage alternative services
The data supports a finding that access is not a major problem, with the exception of occasional issues with obesity or behavioral problems that require special arrangements or a negotiated rate in an alternate setting. Because of these occasional issues, the state may want to consider developing exceptional rate criteria and add-ons that are linked to the RUG-III classification to address these issues. All appropriate alternatives should be exhausted before the exceptional rate is authorized.
Also, comments concerning placement issues with the cognitively impaired or those with behavioral problems and the reduction of assessments coded in those RUG-III categories, may suggest an issue with the current case mix
weights for those categories. Washington should monitor access for the impaired cognition and behavioral categories and in the future, should it become an increased concern, the state may want to consider either adding weight to those classification categories or developing a rate add-on
linked to the CPS scale as incentive for placement of these populations.
Several states, asserting that there was not sufficient weight given to these areas in the RUG methodology, increased the weights in the payment portion of the calculation. The simplest method for this incentive, after the appropriate RUG-III classification is assigned, is to add an additional amount to the index used in the rate calculation.
Mississippi and Georgia add 2% to selected classifications. They added to the indices in areas where they want to encourage access, such as extensive and special care. In addition, they wanted to encourage restorative nursing through the rate calculation. They added weight to the categories that include restorative nursing in an effort to increase the amount of services provided.
Both states were also concerned with access for residents with cognitive impairments. Given the location of cognitive impairment in the classification hierarchy, residents with cognition issues are coded in other categories due to other health care issues they are experiencing. Because CMI are established at the mean of each RUG-III subcategory, a facility with a larger percentage of residents with cognition problems may be negatively impacted in their rate
A C C E S S
What changes are needed in state policy to address these access issues?
72
calculation. To remedy this, Georgia is also using the Cognitive Performance Scale (CPS) to add a percentage to the rate calculation.
The Georgia CPS add-on is based on the percent of Medicaid patients with “moderately severe impairment” to “very severe impairment” per the quarterly MDS based scores from each nursing facility. The percent add-on is applied to the quarterly direct care case mix adjustment.
Although not directly linked to nursing facility case mix payment, the state should continue its efforts to develop and encourage alternative services in order to serve Washington’s frail elderly population in the least restrictive setting possible.
Consider restorative nursing incentive
Consider quality of care incentive program
Monitor changes and improvements to the PPS RUG calculation
Several states have felt that there was not sufficient weight given to the areas of the RUG methodology linked to restorative nursing. Restorative or rehabilitation services can assist in restoring or maintaining functional status or delaying declines in health due to degenerative conditions. In the payment portion of the calculation, these states have added increased weight to the appropriate categories to serve as a quality incentive and encourage restorative nursing. The state may want to consider implementation of a similar increase in weights to serve as an incentive to increase restorative nursing.
At this time, the rate methodology in the aggregate does not appear to be having an impact on quality either positively or negatively. In addition to maintaining the case mix methodology, the state may want to consider implementing a quality incentive, such as the accountability measures program implemented in Iowa.
Iowa implemented an accountability measure or quality program as a complement to their case mix reimbursement system. Iowa wanted the program to address nursing facility characteristics that indicated quality of care, efficiency and a commitment to care for certain resident populations. The criterion to be used in the program had to be objective and measurable. Each item, evaluated individually, might not measure quality, but the criteria when combined should correlate to the resident’s quality of life and care.
Their system consists of 10 separate measures. Each measure has a standard, a measurement period and an assigned value for meeting the criteria. The source of the data is also identified.
Q U A L I T Y O F
C A R E

73
For example, facilities receive two points for having no deficiencies or none with scope and severity above level A. The data is collected from the latest annual survey completed on or before December 31st of each year and subsequent surveys, complaint investigations or revisits. The data is obtained from their survey department by May 1 of the next year.
Other criteria include:
Substantial compliance - surveys, complaint investigations, or revisit investigations that do not result in “F” level or greater deficiencies and a combined total of no more than 3 “E” level or higher.
Per resident day nursing hours at or above the fiftieth percentile after being case mix normalized (RN, LPN, CNA, rehabilitation nurses and other contracted nursing services).
At or above the fiftieth percentile of resident satisfaction as measured by the Resident Opinion Survey – must have a minimum of 35% response rate.
Resolution rate of issues and grievances at or above 60%. Employee retention rate at or above the fiftieth percentile. An occupancy rate at or above 95% (Total bed days based
on census logs/bed days available). Per resident day administrative costs and per resident day
contracted nursing hours at or below the fiftieth percentile. Licensed for the care of residents with chronic confusion
or a dementia (CCDI units). Medicaid utilization at or above the fiftieth percentile
calculated by dividing total nursing facility Medicaid days by total patient days.
We have included the description of the program for information purposes. If Washington were to consider this type of incentive, it should be designed to address the state’s specific needs.
One benefit of the national RUG-III system is the ongoing research and maintenance of the system at the federal level. CMS is to evaluate the RUG system used in the Prospective Payment System (PPS) and recommend improvements. The state will want to monitor these efforts and potentially incorporate changes into the state payment methodology if determined to be appropriate.
74
Consider quality of life incentive program
Continue to develop and encourage alternative services
Although there is belief that quality of life has been improved in nursing facilities, there is a question as to the relationship of the change and the case mix payment methodology. When evaluating the quality measures and survey deficiencies, the rate methodology does not appear at this time to have an impact either positively or negatively. In addition to maintaining the case mix methodology, the state may want to consider implementing a quality incentive, such as the accountability measures program implemented in Iowa.
As most individuals value their autonomy, living in the least restrictive setting possible should add to a person’s quality of life. For this reason, the state should continue efforts to develop and encourage alternative services.
Consider a staff retention incentive
Although direct care staffing in Washington nursing homes has not declined, according to a recent United States General Accounting Office report on the Emerging Nurse Shortages Due to Multiple Factors there has been a decrease of 4.9% in RNs per 100,000 population employed in Washington between 1996-2000.
Another GAO report Nursing Homes: Quality of Care More Related to Staffing than Spending, states that Medicaid payment policies influence spending while encouraging spending on resources that most directly affect resident care and well-being, like nursing services. States encourage spending on nursing care by applying higher limits or ceilings to the direct care cost component. Washington further encourages a minimum level of spending for direct care by recouping funds if not spent.
The current rate add-on of .06% of the direct care rate was implemented to increase wages for the low-wage worker. Given that there is a national nursing shortage, that facility staffing levels are directly linked to quality of care, and that payment policies can be used to influence spending, the state may want to consider implementing some additional form of staffing incentive payment.
The relationship between quality and staffing is complex. Factors such as management, tenure, training, retention and turnover affect both quality of care and cost. According to the Appropriateness of Minimum Nurse Staffing Ratios in Nursing Homes, A Report to Congress, “Due to high turnover among both nurse aides and supervisory nurses, staff training is constantly
Q U A L I T Y O F
L I F E
W A G E A N D
B E N E F I T
L E V E L S
75
needed. During their training, nurse aides cannot be expected to work very efficiently or skillfully with residents.”
The SASHA Corporation compiled data from various sources (Society of Human Resource Management, The Hay Group, and the American Management Association) estimating the turnover cost for one $8/hour employee. The responses ranged from $3,500 to a high of $25,000. Even excluding the five highest estimates, the average estimated cost of turnover for an $8/hour employee is $5,506.
According to the 2002 AHCA Survey of Nursing Staff Vacancy and Turnover in Nursing Homes, staff turnover is estimated to cost approximately 4 months of an employee’s salary to train and recruit replacements which reduce funds available to hire additional staff.
A staffing incentive structured to reward retention of staff, may help reduce turnover positively impacting quality and funds available for wages and benefits.
76
VII. Definitions Activities of Daily Living (ADL) Activities of daily living are those needed for self-care: bathing, dressing, mobility, toileting, eating, and transferring. The late-loss ADL (eating, toileting, bed mobility, and transferring) are used in classifying a patient into a RUG-III group.
Aging and Disability Services Administration (ADSA) ADSA within DSHS is responsible for developing policies and managing a comprehensive system of long-term care services for disabled adults and older persons in the State of Washington.
Case Mix: A measure of the intensity of care and services used by a group of residents in a facility. The case refers to the overall data collected and used regarding an individual resident. The mix refers to an additive measure of the various profiles seen in a specific facility.
Case Mix Index (CMI): A numeric score with a specific range that identifies the relative resources used by a particular group of cases and represents the average resource consumption across a population or sample.
Case Mix Payment: The payment to a nursing facility, per resident or per facility, based on the facility’s case mix.
CMS: The Centers for Medicare and Medicaid Services, formerly the Health Care Financing Administration, responsible for coordinating federal programs.
Cognitive Performance Scale (CPS) The measure of cognitive status used in the MDS and in the RUG-III Classification system.
Direct Care Costs: Expenses incurred by nursing facilities for the hands-on care of the resident. These costs may include salaries and fringe benefits of RNs, LPN and nursing assistants.
EAG The NF Payment System Executive Advisory Group
Hierarchy The ordering of groups within the RUG-III Classification system.
Minimum Data Set (MDS): A screening assessment and care-planning tool that indicates strengths, needs and preferences of a nursing facility resident. It consists of core elements, common definitions and guidelines specified by CMS. It is one component of the Resident Assessment Instrument (RAI) as defined in the Nursing Home Reform Act of 1987, also referred to as OBRA’87.
Nursing Facility (NF): Nursing facility as defined in section 1919 (a) of the federal Social Security Act and regulations.
77
Omnibus Budget Reconciliation Act of 1987 (OBRA ’87) Law that enacted reforms in nursing facility care and provides the statutory authority for the MDS.
Online Survey and Certification and Reporting System (OSCAR) The system maintained by CMS that contains key survey information.
Quality Indicator (QI) Developed as part of the CMS funded Multi-State Nursing Facility Case Mix and Quality Demonstration (NHCMQ) by the University of Wisconsin. The Quality Indicators represent common conditions and important aspects of care. QI reports reflect a measure of the prevalence or incidence of conditions based on MDS assessment data.
Quality Measures (QM) Information derived from MDS data that is available to the public as part of the Nursing Facility Quality Initiative. The Quality Measures are designed to provide consumers with additional information for them to make informed decisions about the quality of care in nursing facilities.
Resident Assessment Instrument (RAI) The designation for the complete resident assessment process mandated by CMS, including the comprehensive MDS, Resident Assessment Protocols (RAP), and care planning decisions. The RAI helps facility staff gather definitive information on a resident’s strengths and needs that must be addressed in an individualized care plan.
Resource Utilization Groups (RUG-III): A resident classification system that identifies the relative costs (resource use) of providing care for different types of residents in nursing facilities based on their resource use.
RUG grouper: Software that classifies residents into the resource utilization groups according to specific criteria as represented on the Minimum Data Set.
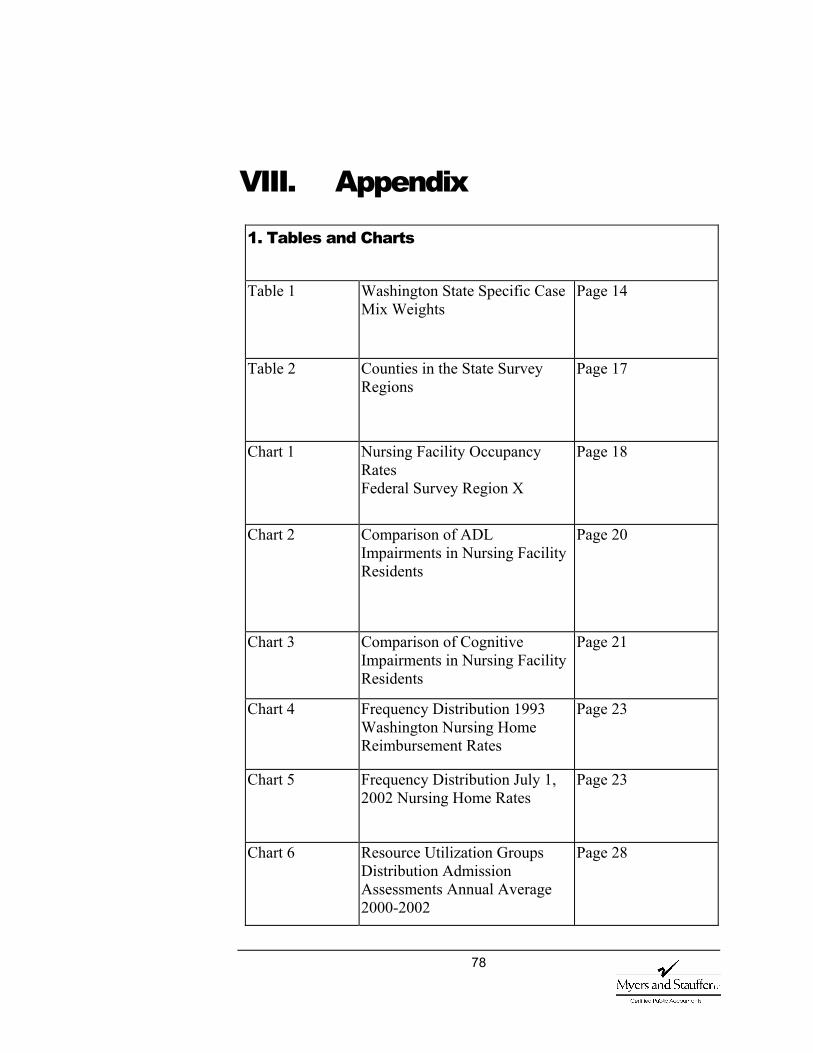
78
VIII. Appendix
1. Tables and Charts
Table 1 Washington State Specific Case Mix Weights
Page 14
Table 2 Counties in the State Survey Regions
Page 17
Chart 1 Nursing Facility Occupancy Rates Federal Survey Region X
Page 18
Chart 2 Comparison of ADL Impairments in Nursing Facility Residents
Page 20
Chart 3 Comparison of Cognitive Impairments in Nursing Facility Residents
Page 21
Chart 4 Frequency Distribution 1993 Washington Nursing Home Reimbursement Rates
Page 23
Chart 5 Frequency Distribution July 1, 2002 Nursing Home Rates
Page 23
Chart 6 Resource Utilization Groups Distribution Admission Assessments Annual Average 2000-2002
Page 28

79
1. Tables and Charts
Chart 7 Resource Utilization Groups Distribution Comparing All Assessments to Admission Assessments
Page 29
Chart 8 Extensive Services and Reduced Physical Functioning Categories Medicaid Population 2000-2002
Page 30
Chart 9 Nursing Facility Discharges Annual Average
Page 31
Table 3 Total Nursing Facility Beds by Survey Region
Page 33
Map Washington Counties with Occupancy Rates =>90%
Page 33
Table 4 Average Rages Compared to Average Occupancy by Region
Page 34
Chart 10 Per Diem Rates Compared to Occupancy Percentages
Page 35
Chart 11 Comparison of Case Mix Index and Occupancy
Page 36
Chart 12 Nursing Home Compare Average Number of Health Deficiencies
Page 38
Table 5 Scope and Severity Grid Page 39
Chart 13 Scope and Severity Code Utilization United States and Washington Comparison
Page 40
Chart 14 Survey Deficiencies MDS Assessments
Page 44
Chart 15 Survey Deficiencies Quality of Care
Page 45
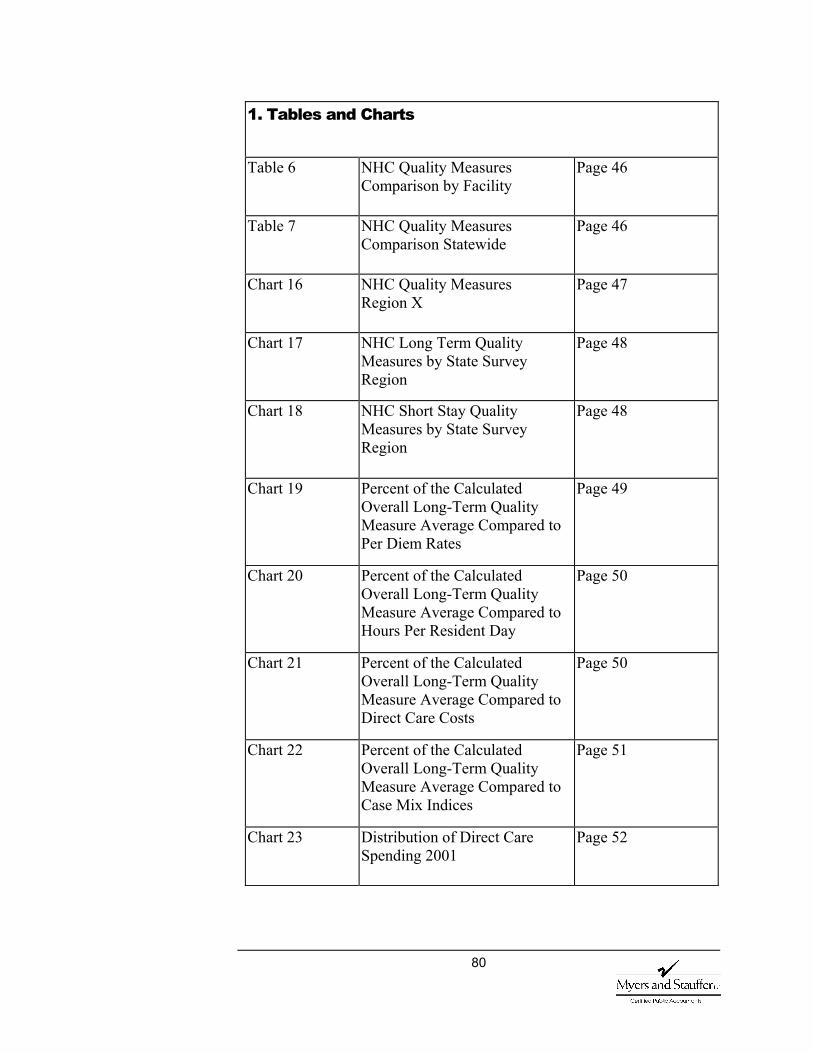
80
1. Tables and Charts
Table 6 NHC Quality Measures Comparison by Facility
Page 46
Table 7 NHC Quality Measures Comparison Statewide
Page 46
Chart 16 NHC Quality Measures Region X
Page 47
Chart 17 NHC Long Term Quality Measures by State Survey Region
Page 48
Chart 18 NHC Short Stay Quality Measures by State Survey Region
Page 48
Chart 19 Percent of the Calculated Overall Long-Term Quality Measure Average Compared to Per Diem Rates
Page 49
Chart 20 Percent of the Calculated Overall Long-Term Quality Measure Average Compared to Hours Per Resident Day
Page 50
Chart 21 Percent of the Calculated Overall Long-Term Quality Measure Average Compared to Direct Care Costs
Page 50
Chart 22 Percent of the Calculated Overall Long-Term Quality Measure Average Compared to Case Mix Indices
Page 51
Chart 23 Distribution of Direct Care Spending 2001
Page 52
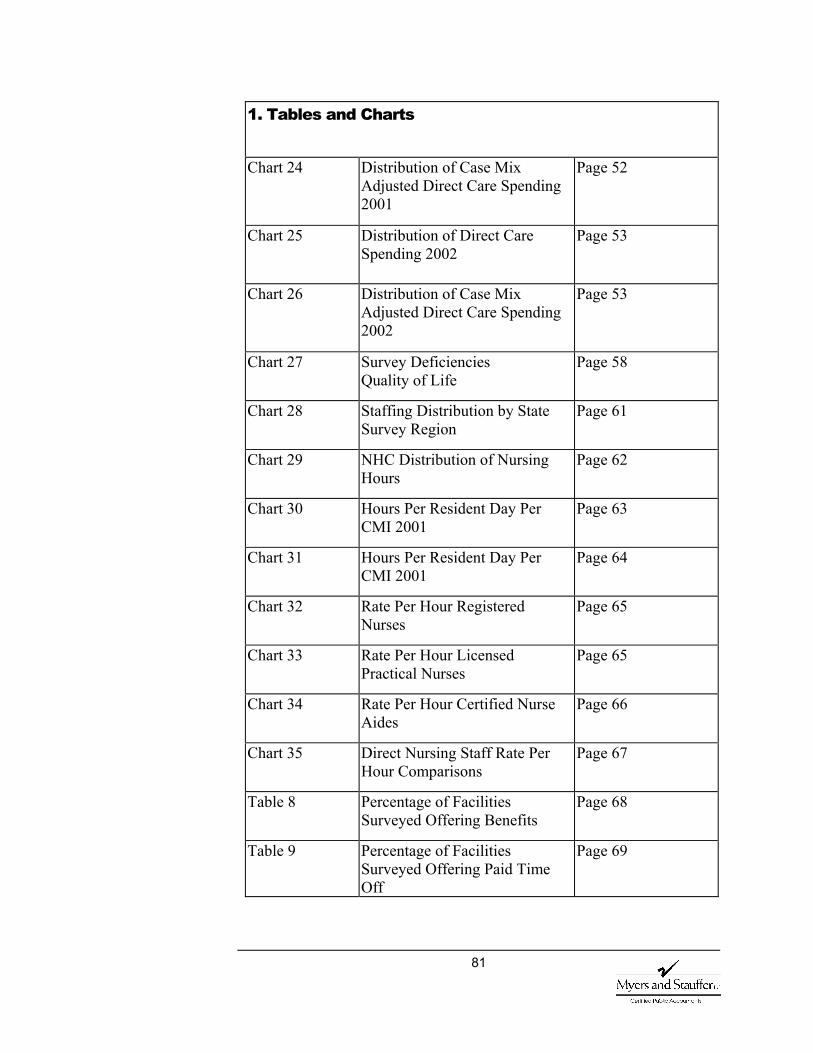
81
1. Tables and Charts
Chart 24 Distribution of Case Mix Adjusted Direct Care Spending 2001
Page 52
Chart 25 Distribution of Direct Care Spending 2002
Page 53
Chart 26 Distribution of Case Mix Adjusted Direct Care Spending 2002
Page 53
Chart 27 Survey Deficiencies Quality of Life
Page 58
Chart 28 Staffing Distribution by State Survey Region
Page 61
Chart 29 NHC Distribution of Nursing Hours
Page 62
Chart 30 Hours Per Resident Day Per CMI 2001
Page 63
Chart 31 Hours Per Resident Day Per CMI 2001
Page 64
Chart 32 Rate Per Hour Registered Nurses
Page 65
Chart 33 Rate Per Hour Licensed Practical Nurses
Page 65
Chart 34 Rate Per Hour Certified Nurse Aides
Page 66
Chart 35 Direct Nursing Staff Rate Per Hour Comparisons
Page 67
Table 8 Percentage of Facilities Surveyed Offering Benefits
Page 68
Table 9 Percentage of Facilities Surveyed Offering Paid Time Off
Page 69

82
2. Study Outline Questions
When developing questions to be evaluated during the study, we obtained input from the department, the provider community and the Joint Nursing Home Task Force. The following questions are from the study outline:
Access Are individuals with more intensive care needs easier to
place since the implementation of the case mix payment system?
What relationship is there between a resident’s care needs, as measured by RUG-III, and their ability to get timely access to nursing facility care?
Has there been a change in admission patterns for individuals with lighter care needs?
Has there been a change in the number of residents with assessments classifying in the lower reduced physical functioning categories?
Has there been any change in the number of discharges for Medicaid residents to alternative community services and waiver programs?
Are residents with particular types of conditions and/or in particular parts of the state unable to get nursing facility care when needed, and within reasonable proximity to their home? If so, why?
What relationship is there between geographic areas in which there are and are not access problems, and state payment rates for facilities in those areas?
Is there a relationship between resident acuity levels as measured by RUG-III, and facility occupancy levels?
Quality of Care What are the views of stakeholders on case mix payment?
Do stakeholders perceive a change in quality of care? Is this in part due to the change in payment methodology?
Has there been a change in staff turn over?
Has quality of care measured by survey findings changed with the implementation of case mix payment?
Do nursing facilities in Washington in fact provide a lower quality of care than their peers in other states? Or is Washington’s nursing home survey process more stringent
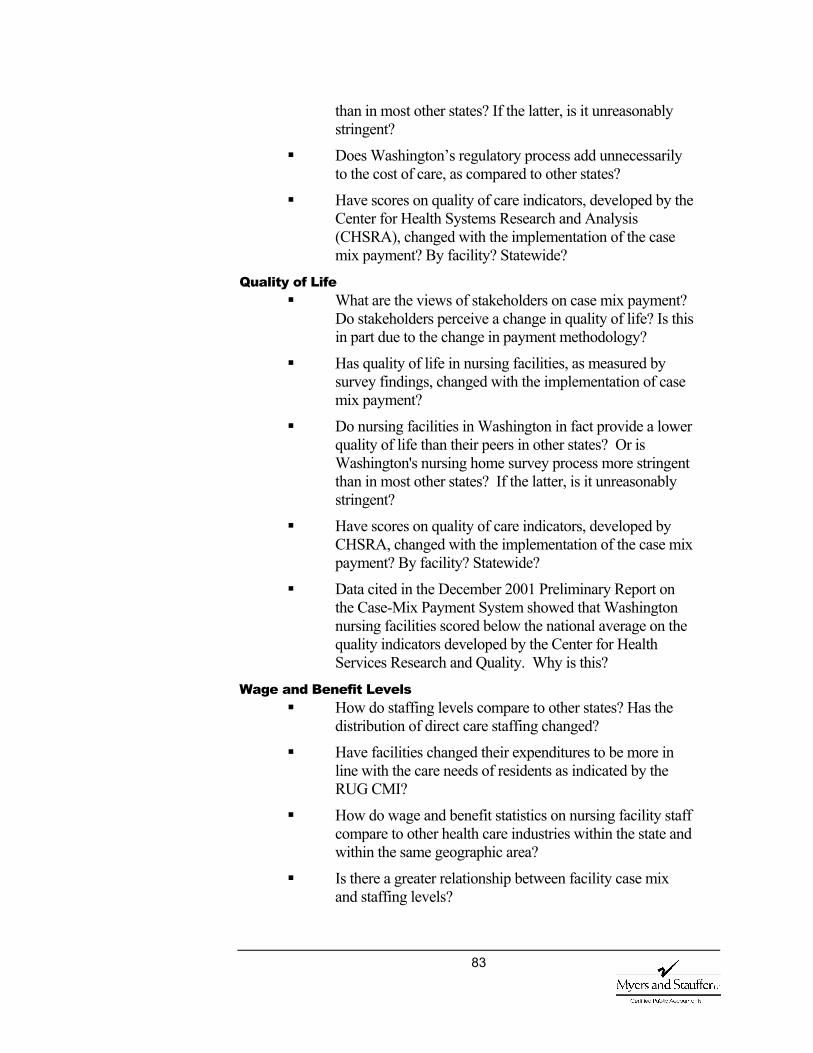
83
than in most other states? If the latter, is it unreasonably stringent?
Does Washington’s regulatory process add unnecessarily to the cost of care, as compared to other states?
Have scores on quality of care indicators, developed by the Center for Health Systems Research and Analysis (CHSRA), changed with the implementation of the case mix payment? By facility? Statewide?
Quality of Life What are the views of stakeholders on case mix payment?
Do stakeholders perceive a change in quality of life? Is this in part due to the change in payment methodology?
Has quality of life in nursing facilities, as measured by survey findings, changed with the implementation of case mix payment?
Do nursing facilities in Washington in fact provide a lower quality of life than their peers in other states? Or is Washington's nursing home survey process more stringent than in most other states? If the latter, is it unreasonably stringent?
Have scores on quality of care indicators, developed by CHSRA, changed with the implementation of the case mix payment? By facility? Statewide?
Data cited in the December 2001 Preliminary Report on the Case-Mix Payment System showed that Washington nursing facilities scored below the national average on the quality indicators developed by the Center for Health Services Research and Quality. Why is this?
Wage and Benefit Levels How do staffing levels compare to other states? Has the
distribution of direct care staffing changed?
Have facilities changed their expenditures to be more in line with the care needs of residents as indicated by the RUG CMI?
How do wage and benefit statistics on nursing facility staff compare to other health care industries within the state and within the same geographic area?
Is there a greater relationship between facility case mix and staffing levels?
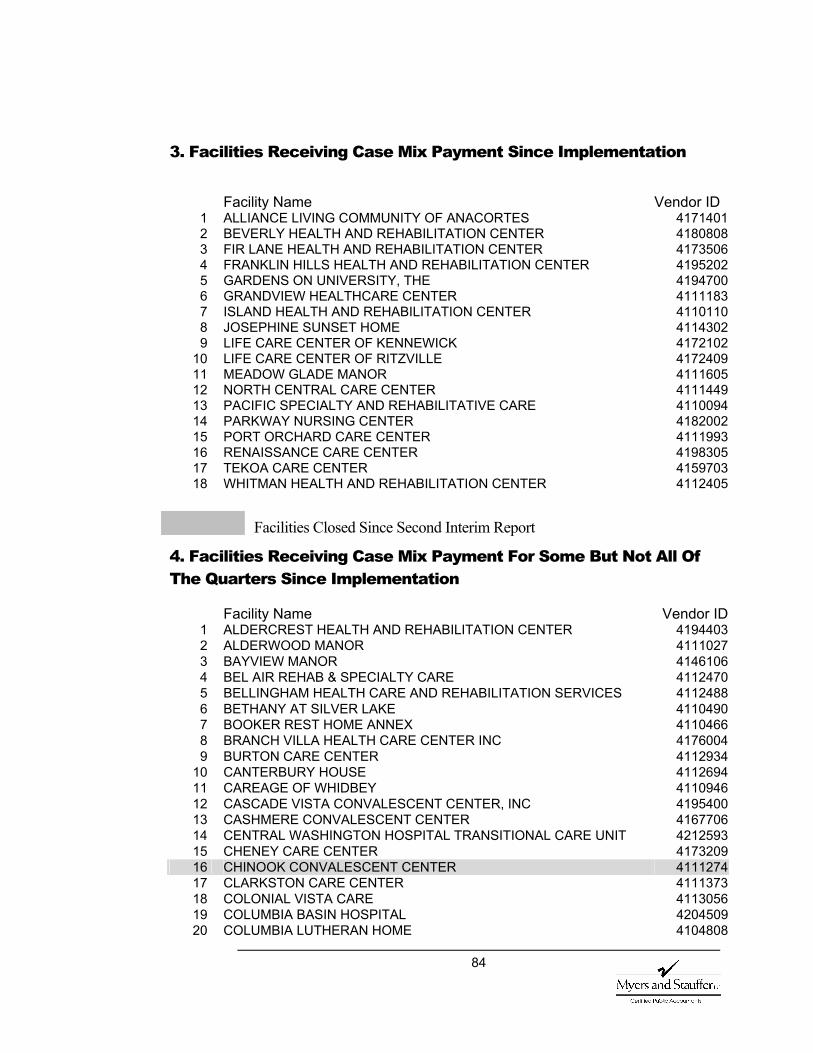
84
3. Facilities Receiving Case Mix Payment Since Implementation
Facility Name Vendor ID
1 ALLIANCE LIVING COMMUNITY OF ANACORTES 41714012 BEVERLY HEALTH AND REHABILITATION CENTER 41808083 FIR LANE HEALTH AND REHABILITATION CENTER 41735064 FRANKLIN HILLS HEALTH AND REHABILITATION CENTER 41952025 GARDENS ON UNIVERSITY, THE 41947006 GRANDVIEW HEALTHCARE CENTER 41111837 ISLAND HEALTH AND REHABILITATION CENTER 41101108 JOSEPHINE SUNSET HOME 41143029 LIFE CARE CENTER OF KENNEWICK 4172102
10 LIFE CARE CENTER OF RITZVILLE 417240911 MEADOW GLADE MANOR 411160512 NORTH CENTRAL CARE CENTER 411144913 PACIFIC SPECIALTY AND REHABILITATIVE CARE 411009414 PARKWAY NURSING CENTER 418200215 PORT ORCHARD CARE CENTER 411199316 RENAISSANCE CARE CENTER 419830517 TEKOA CARE CENTER 415970318 WHITMAN HEALTH AND REHABILITATION CENTER 4112405
Facilities Closed Since Second Interim Report
4. Facilities Receiving Case Mix Payment For Some But Not All Of The Quarters Since Implementation
Facility Name Vendor ID1 ALDERCREST HEALTH AND REHABILITATION CENTER 41944032 ALDERWOOD MANOR 41110273 BAYVIEW MANOR 41461064 BEL AIR REHAB & SPECIALTY CARE 41124705 BELLINGHAM HEALTH CARE AND REHABILITATION SERVICES 41124886 BETHANY AT SILVER LAKE 41104907 BOOKER REST HOME ANNEX 41104668 BRANCH VILLA HEALTH CARE CENTER INC 41760049 BURTON CARE CENTER 4112934
10 CANTERBURY HOUSE 411269411 CAREAGE OF WHIDBEY 411094612 CASCADE VISTA CONVALESCENT CENTER, INC 419540013 CASHMERE CONVALESCENT CENTER 416770614 CENTRAL WASHINGTON HOSPITAL TRANSITIONAL CARE UNIT 421259315 CHENEY CARE CENTER 417320916 CHINOOK CONVALESCENT CENTER 411127417 CLARKSTON CARE CENTER 411137318 COLONIAL VISTA CARE 411305619 COLUMBIA BASIN HOSPITAL 420450920 COLUMBIA LUTHERAN HOME 4104808
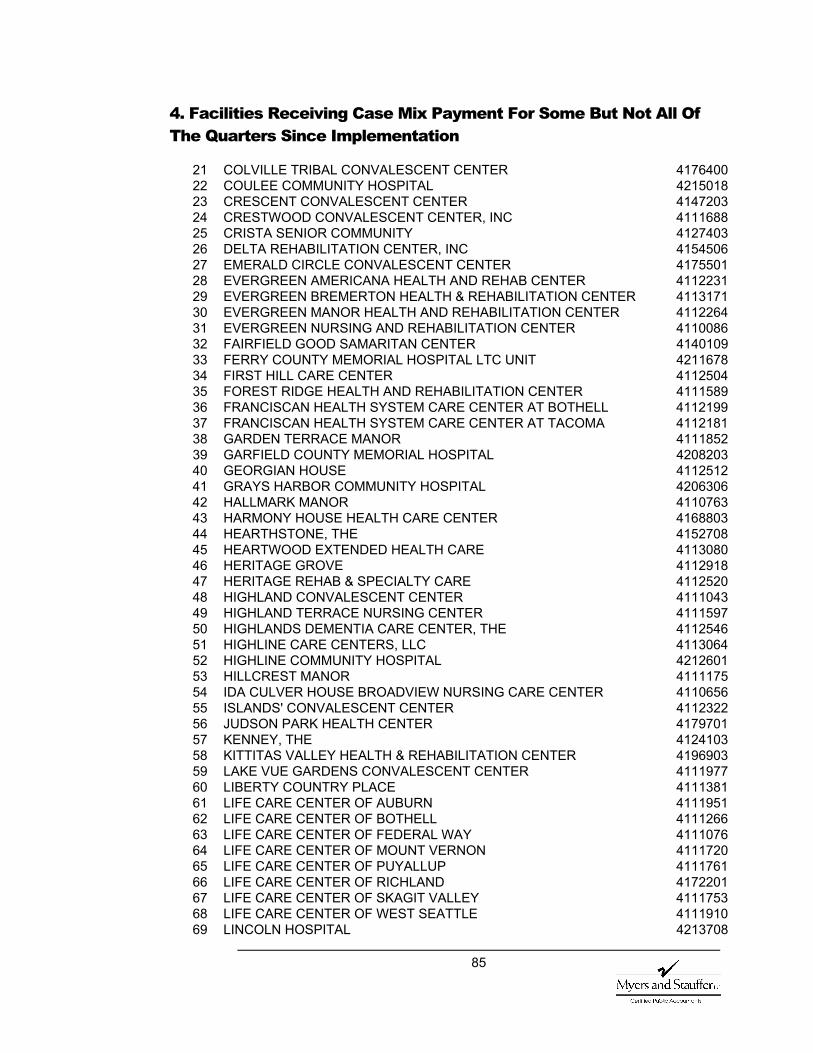
85
4. Facilities Receiving Case Mix Payment For Some But Not All Of The Quarters Since Implementation
21 COLVILLE TRIBAL CONVALESCENT CENTER 417640022 COULEE COMMUNITY HOSPITAL 421501823 CRESCENT CONVALESCENT CENTER 414720324 CRESTWOOD CONVALESCENT CENTER, INC 411168825 CRISTA SENIOR COMMUNITY 412740326 DELTA REHABILITATION CENTER, INC 415450627 EMERALD CIRCLE CONVALESCENT CENTER 417550128 EVERGREEN AMERICANA HEALTH AND REHAB CENTER 411223129 EVERGREEN BREMERTON HEALTH & REHABILITATION CENTER 411317130 EVERGREEN MANOR HEALTH AND REHABILITATION CENTER 411226431 EVERGREEN NURSING AND REHABILITATION CENTER 411008632 FAIRFIELD GOOD SAMARITAN CENTER 414010933 FERRY COUNTY MEMORIAL HOSPITAL LTC UNIT 421167834 FIRST HILL CARE CENTER 411250435 FOREST RIDGE HEALTH AND REHABILITATION CENTER 411158936 FRANCISCAN HEALTH SYSTEM CARE CENTER AT BOTHELL 411219937 FRANCISCAN HEALTH SYSTEM CARE CENTER AT TACOMA 411218138 GARDEN TERRACE MANOR 411185239 GARFIELD COUNTY MEMORIAL HOSPITAL 420820340 GEORGIAN HOUSE 411251241 GRAYS HARBOR COMMUNITY HOSPITAL 420630642 HALLMARK MANOR 411076343 HARMONY HOUSE HEALTH CARE CENTER 416880344 HEARTHSTONE, THE 415270845 HEARTWOOD EXTENDED HEALTH CARE 411308046 HERITAGE GROVE 411291847 HERITAGE REHAB & SPECIALTY CARE 411252048 HIGHLAND CONVALESCENT CENTER 411104349 HIGHLAND TERRACE NURSING CENTER 411159750 HIGHLANDS DEMENTIA CARE CENTER, THE 411254651 HIGHLINE CARE CENTERS, LLC 411306452 HIGHLINE COMMUNITY HOSPITAL 421260153 HILLCREST MANOR 411117554 IDA CULVER HOUSE BROADVIEW NURSING CARE CENTER 411065655 ISLANDS' CONVALESCENT CENTER 411232256 JUDSON PARK HEALTH CENTER 417970157 KENNEY, THE 412410358 KITTITAS VALLEY HEALTH & REHABILITATION CENTER 419690359 LAKE VUE GARDENS CONVALESCENT CENTER 411197760 LIBERTY COUNTRY PLACE 411138161 LIFE CARE CENTER OF AUBURN 411195162 LIFE CARE CENTER OF BOTHELL 411126663 LIFE CARE CENTER OF FEDERAL WAY 411107664 LIFE CARE CENTER OF MOUNT VERNON 411172065 LIFE CARE CENTER OF PUYALLUP 411176166 LIFE CARE CENTER OF RICHLAND 417220167 LIFE CARE CENTER OF SKAGIT VALLEY 411175368 LIFE CARE CENTER OF WEST SEATTLE 411191069 LINCOLN HOSPITAL 4213708

86
4. Facilities Receiving Case Mix Payment For Some But Not All Of The Quarters Since Implementation
70 LINDEN GROVE HEALTH CARE CENTER 411257971 LYNNWOOD MANOR HEALTH CARE CENTER 418700172 MANOR CARE HEALTH SERVICES 418330773 MANOR CARE HEALTH SERVICES (SPOKANE) 418711874 MANOR CARE OF GIG HARBOR 411169675 MARTHA & MARY HEALTH SERVICES 411216576 MARYSVILLE CARE CENTER 411198577 MCKAY HEALTHCARE & REHAB CENTER 418670678 MERRY HAVEN HEALTH CARE CENTER, INC 419510379 MESSENGER HOUSE CARE CENTER 418620180 MIRA VISTA CARE CENTER 419570781 MORTON HOSPITAL LTCU 421731182 MOUNT SI TRANSITIONAL HEALTH CENTER 411187883 NEWPORT COMMUNITY HOSPITAL - LTC UNIT 420211584 NISQUALLY VALLEY CARE CENTER 418580785 NORTH AUBURN REHAB & HEALTH CENTER 411004586 NORTH VALLEY HOSPITAL 421070487 NORTHGATE REHABILITATION CENTER 411116788 OCEAN VIEW CONVALESCENT CENTER 411208289 ODESSA MEMORIAL HOSPITAL LTC UNIT 420800590 OLYMPIA MANOR 411179591 OLYMPIC CARE AND REHABILITATION CENTER 411237192 ORCHARD PARK 411259593 PALOUSE HILLS NURSING CENTER 411295994 PANORAMA CITY CONVALESCENT & REHAB CENTER 415070295 PARK RIDGE CARE CENTER 411271096 PARK WEST CARE CENTER INC 411272897 PARKSIDE HEALTHCARE, LLC 411307298 PARKSIDE NURSING CARE CENTER 411310699 PINEHURST PARK TERRACE 4111159
100 PROSSER MEMORIAL HOSPITAL 4204608101 PROVIDENCE YAKIMA TRANSITIONAL CARE UNIT 4210233102 PUGET SOUND HEALTHCARE CENTER 4110102103 QUEEN ANNE HEALTHCARE 4112611104 RAINIER VISTA CARE CENTER 4112629105 REGENCY AT RENTON REHABILITATION CENTER 4111282106 REGENCY MANOR 4111902107 RENTON HIGHLANDS HEALTH & REHABILITATION CENTER 4112272108 RIDGEMONT TERRACE INC 4158804109 RIVERVIEW LUTHERAN CARE CENTER 4154407110 ROO-LAN HEALTHCARE CENTER 4172904111 ROSE VISTA NURSING CENTER 4113189112 ROYAL PARK CARE CENTER 4111050113 ROYAL VISTA CARE CENTER 4191003114 SEATTLE KEIRO 4167904115 SEATTLE MEDICAL AND REHABILITATION CENTER 4112280116 SEHOME PARK CARE CENTER, INC 4112736117 SELAH CONVALESCENT 4111084118 SHARON CARE CENTER INC 4113049
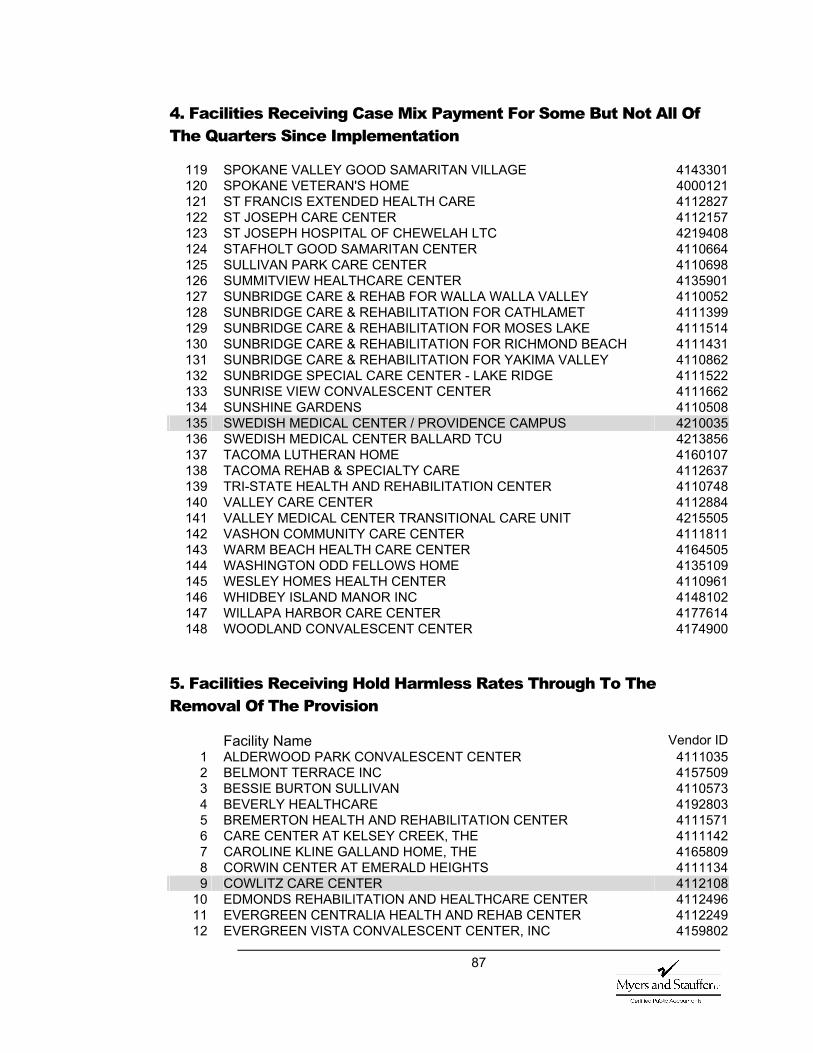
87
4. Facilities Receiving Case Mix Payment For Some But Not All Of The Quarters Since Implementation
119 SPOKANE VALLEY GOOD SAMARITAN VILLAGE 4143301120 SPOKANE VETERAN'S HOME 4000121121 ST FRANCIS EXTENDED HEALTH CARE 4112827122 ST JOSEPH CARE CENTER 4112157123 ST JOSEPH HOSPITAL OF CHEWELAH LTC 4219408124 STAFHOLT GOOD SAMARITAN CENTER 4110664125 SULLIVAN PARK CARE CENTER 4110698126 SUMMITVIEW HEALTHCARE CENTER 4135901127 SUNBRIDGE CARE & REHAB FOR WALLA WALLA VALLEY 4110052128 SUNBRIDGE CARE & REHABILITATION FOR CATHLAMET 4111399129 SUNBRIDGE CARE & REHABILITATION FOR MOSES LAKE 4111514130 SUNBRIDGE CARE & REHABILITATION FOR RICHMOND BEACH 4111431131 SUNBRIDGE CARE & REHABILITATION FOR YAKIMA VALLEY 4110862132 SUNBRIDGE SPECIAL CARE CENTER - LAKE RIDGE 4111522133 SUNRISE VIEW CONVALESCENT CENTER 4111662134 SUNSHINE GARDENS 4110508135 SWEDISH MEDICAL CENTER / PROVIDENCE CAMPUS 4210035136 SWEDISH MEDICAL CENTER BALLARD TCU 4213856137 TACOMA LUTHERAN HOME 4160107138 TACOMA REHAB & SPECIALTY CARE 4112637139 TRI-STATE HEALTH AND REHABILITATION CENTER 4110748140 VALLEY CARE CENTER 4112884141 VALLEY MEDICAL CENTER TRANSITIONAL CARE UNIT 4215505142 VASHON COMMUNITY CARE CENTER 4111811143 WARM BEACH HEALTH CARE CENTER 4164505144 WASHINGTON ODD FELLOWS HOME 4135109145 WESLEY HOMES HEALTH CENTER 4110961146 WHIDBEY ISLAND MANOR INC 4148102147 WILLAPA HARBOR CARE CENTER 4177614148 WOODLAND CONVALESCENT CENTER 4174900
5. Facilities Receiving Hold Harmless Rates Through To The Removal Of The Provision
Facility Name Vendor ID 1 ALDERWOOD PARK CONVALESCENT CENTER 41110352 BELMONT TERRACE INC 41575093 BESSIE BURTON SULLIVAN 41105734 BEVERLY HEALTHCARE 41928035 BREMERTON HEALTH AND REHABILITATION CENTER 41115716 CARE CENTER AT KELSEY CREEK, THE 41111427 CAROLINE KLINE GALLAND HOME, THE 41658098 CORWIN CENTER AT EMERALD HEIGHTS 41111349 COWLITZ CARE CENTER 4112108
10 EDMONDS REHABILITATION AND HEALTHCARE CENTER 411249611 EVERGREEN CENTRALIA HEALTH AND REHAB CENTER 411224912 EVERGREEN VISTA CONVALESCENT CENTER, INC 4159802
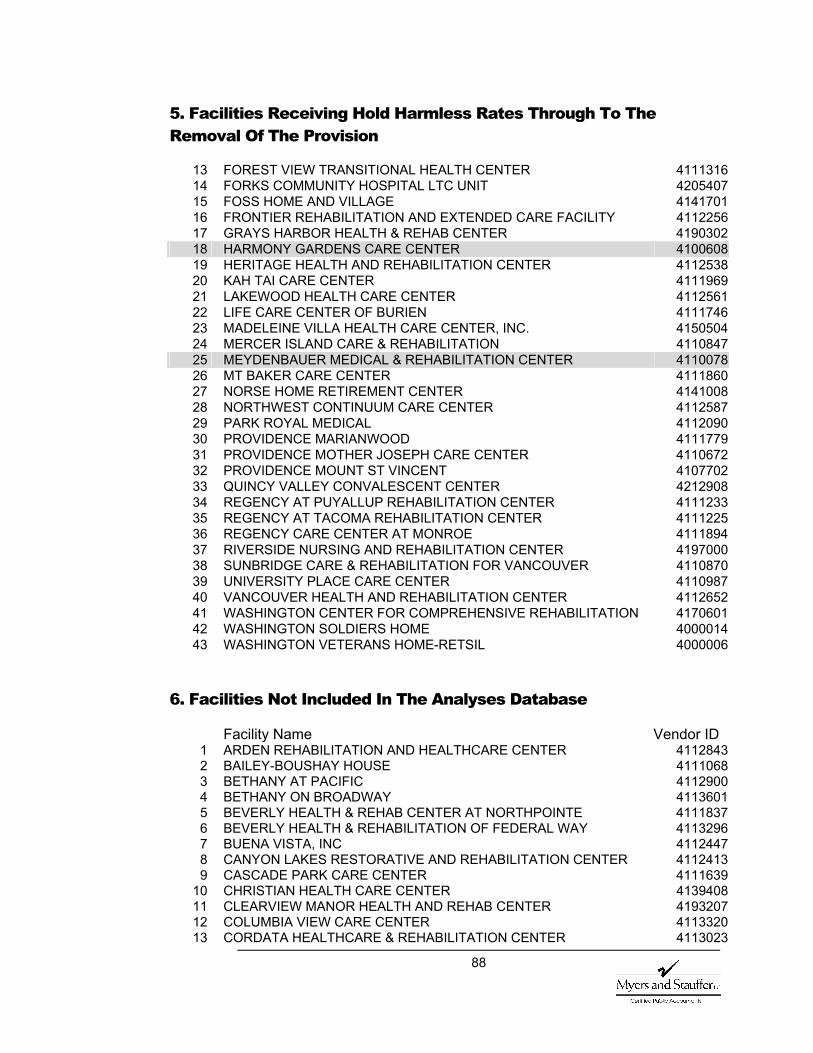
88
5. Facilities Receiving Hold Harmless Rates Through To The Removal Of The Provision
13 FOREST VIEW TRANSITIONAL HEALTH CENTER 411131614 FORKS COMMUNITY HOSPITAL LTC UNIT 420540715 FOSS HOME AND VILLAGE 414170116 FRONTIER REHABILITATION AND EXTENDED CARE FACILITY 411225617 GRAYS HARBOR HEALTH & REHAB CENTER 419030218 HARMONY GARDENS CARE CENTER 410060819 HERITAGE HEALTH AND REHABILITATION CENTER 411253820 KAH TAI CARE CENTER 411196921 LAKEWOOD HEALTH CARE CENTER 411256122 LIFE CARE CENTER OF BURIEN 411174623 MADELEINE VILLA HEALTH CARE CENTER, INC. 415050424 MERCER ISLAND CARE & REHABILITATION 411084725 MEYDENBAUER MEDICAL & REHABILITATION CENTER 411007826 MT BAKER CARE CENTER 411186027 NORSE HOME RETIREMENT CENTER 414100828 NORTHWEST CONTINUUM CARE CENTER 411258729 PARK ROYAL MEDICAL 411209030 PROVIDENCE MARIANWOOD 411177931 PROVIDENCE MOTHER JOSEPH CARE CENTER 411067232 PROVIDENCE MOUNT ST VINCENT 410770233 QUINCY VALLEY CONVALESCENT CENTER 421290834 REGENCY AT PUYALLUP REHABILITATION CENTER 411123335 REGENCY AT TACOMA REHABILITATION CENTER 411122536 REGENCY CARE CENTER AT MONROE 411189437 RIVERSIDE NURSING AND REHABILITATION CENTER 419700038 SUNBRIDGE CARE & REHABILITATION FOR VANCOUVER 411087039 UNIVERSITY PLACE CARE CENTER 411098740 VANCOUVER HEALTH AND REHABILITATION CENTER 411265241 WASHINGTON CENTER FOR COMPREHENSIVE REHABILITATION 417060142 WASHINGTON SOLDIERS HOME 400001443 WASHINGTON VETERANS HOME-RETSIL 4000006
6. Facilities Not Included In The Analyses Database
Facility Name Vendor ID 1 ARDEN REHABILITATION AND HEALTHCARE CENTER 41128432 BAILEY-BOUSHAY HOUSE 41110683 BETHANY AT PACIFIC 41129004 BETHANY ON BROADWAY 41136015 BEVERLY HEALTH & REHAB CENTER AT NORTHPOINTE 41118376 BEVERLY HEALTH & REHABILITATION OF FEDERAL WAY 41132967 BUENA VISTA, INC 41124478 CANYON LAKES RESTORATIVE AND REHABILITATION CENTER 41124139 CASCADE PARK CARE CENTER 4111639
10 CHRISTIAN HEALTH CARE CENTER 413940811 CLEARVIEW MANOR HEALTH AND REHAB CENTER 419320712 COLUMBIA VIEW CARE CENTER 411332013 CORDATA HEALTHCARE & REHABILITATION CENTER 4113023
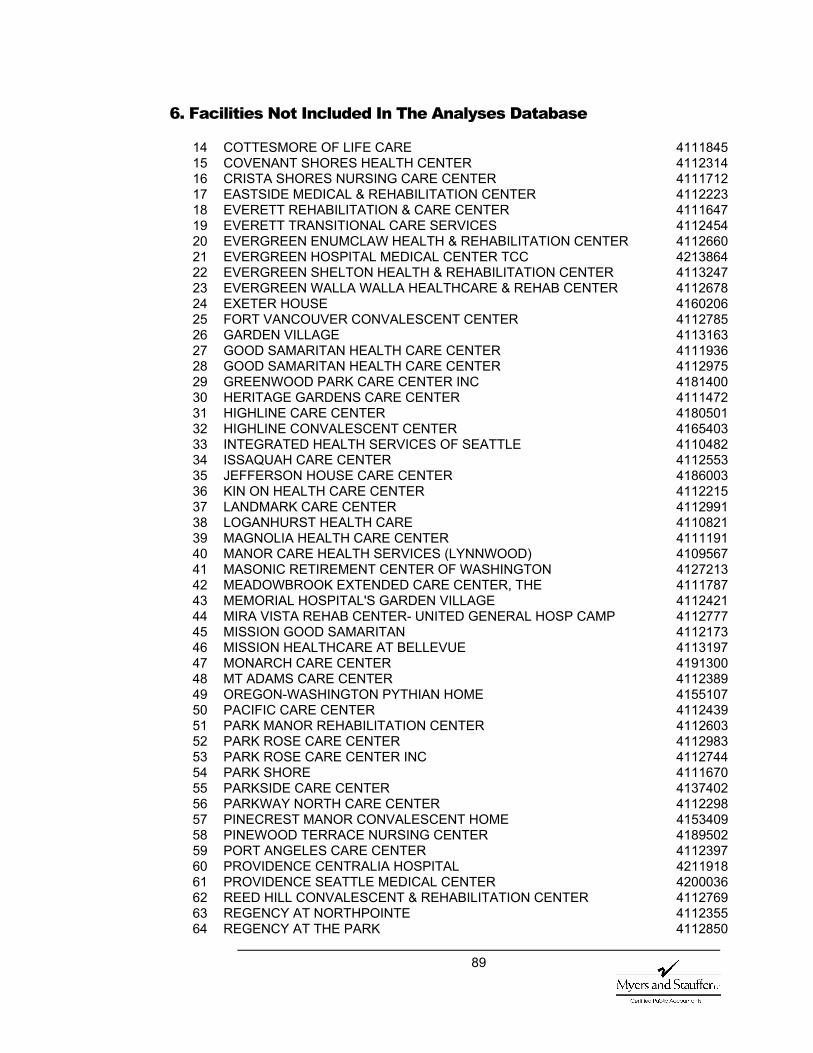
89
6. Facilities Not Included In The Analyses Database
14 COTTESMORE OF LIFE CARE 411184515 COVENANT SHORES HEALTH CENTER 411231416 CRISTA SHORES NURSING CARE CENTER 411171217 EASTSIDE MEDICAL & REHABILITATION CENTER 411222318 EVERETT REHABILITATION & CARE CENTER 411164719 EVERETT TRANSITIONAL CARE SERVICES 411245420 EVERGREEN ENUMCLAW HEALTH & REHABILITATION CENTER 411266021 EVERGREEN HOSPITAL MEDICAL CENTER TCC 421386422 EVERGREEN SHELTON HEALTH & REHABILITATION CENTER 411324723 EVERGREEN WALLA WALLA HEALTHCARE & REHAB CENTER 411267824 EXETER HOUSE 416020625 FORT VANCOUVER CONVALESCENT CENTER 411278526 GARDEN VILLAGE 411316327 GOOD SAMARITAN HEALTH CARE CENTER 411193628 GOOD SAMARITAN HEALTH CARE CENTER 411297529 GREENWOOD PARK CARE CENTER INC 418140030 HERITAGE GARDENS CARE CENTER 411147231 HIGHLINE CARE CENTER 418050132 HIGHLINE CONVALESCENT CENTER 416540333 INTEGRATED HEALTH SERVICES OF SEATTLE 411048234 ISSAQUAH CARE CENTER 411255335 JEFFERSON HOUSE CARE CENTER 418600336 KIN ON HEALTH CARE CENTER 411221537 LANDMARK CARE CENTER 411299138 LOGANHURST HEALTH CARE 411082139 MAGNOLIA HEALTH CARE CENTER 411119140 MANOR CARE HEALTH SERVICES (LYNNWOOD) 410956741 MASONIC RETIREMENT CENTER OF WASHINGTON 412721342 MEADOWBROOK EXTENDED CARE CENTER, THE 411178743 MEMORIAL HOSPITAL'S GARDEN VILLAGE 411242144 MIRA VISTA REHAB CENTER- UNITED GENERAL HOSP CAMP 411277745 MISSION GOOD SAMARITAN 411217346 MISSION HEALTHCARE AT BELLEVUE 411319747 MONARCH CARE CENTER 419130048 MT ADAMS CARE CENTER 411238949 OREGON-WASHINGTON PYTHIAN HOME 415510750 PACIFIC CARE CENTER 411243951 PARK MANOR REHABILITATION CENTER 411260352 PARK ROSE CARE CENTER 411298353 PARK ROSE CARE CENTER INC 411274454 PARK SHORE 411167055 PARKSIDE CARE CENTER 413740256 PARKWAY NORTH CARE CENTER 411229857 PINECREST MANOR CONVALESCENT HOME 415340958 PINEWOOD TERRACE NURSING CENTER 418950259 PORT ANGELES CARE CENTER 411239760 PROVIDENCE CENTRALIA HOSPITAL 421191861 PROVIDENCE SEATTLE MEDICAL CENTER 420003662 REED HILL CONVALESCENT & REHABILITATION CENTER 411276963 REGENCY AT NORTHPOINTE 411235564 REGENCY AT THE PARK 4112850
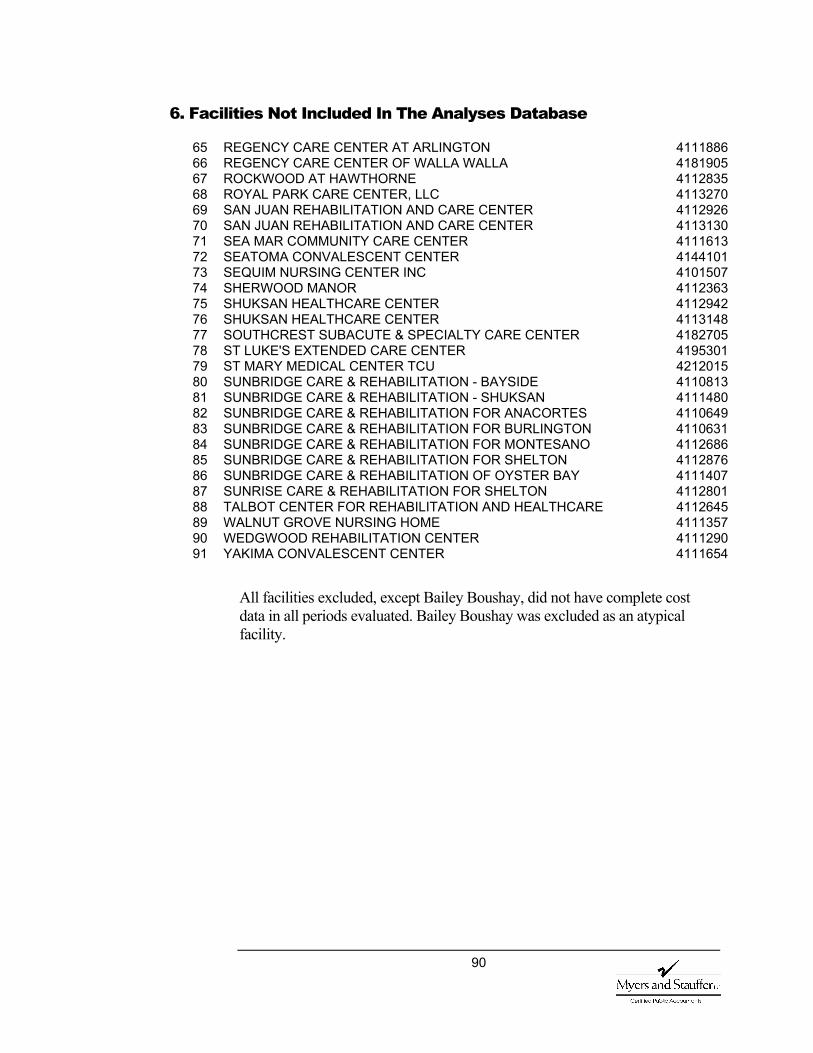
90
6. Facilities Not Included In The Analyses Database
65 REGENCY CARE CENTER AT ARLINGTON 411188666 REGENCY CARE CENTER OF WALLA WALLA 418190567 ROCKWOOD AT HAWTHORNE 411283568 ROYAL PARK CARE CENTER, LLC 411327069 SAN JUAN REHABILITATION AND CARE CENTER 411292670 SAN JUAN REHABILITATION AND CARE CENTER 411313071 SEA MAR COMMUNITY CARE CENTER 411161372 SEATOMA CONVALESCENT CENTER 414410173 SEQUIM NURSING CENTER INC 410150774 SHERWOOD MANOR 411236375 SHUKSAN HEALTHCARE CENTER 411294276 SHUKSAN HEALTHCARE CENTER 411314877 SOUTHCREST SUBACUTE & SPECIALTY CARE CENTER 418270578 ST LUKE'S EXTENDED CARE CENTER 419530179 ST MARY MEDICAL CENTER TCU 421201580 SUNBRIDGE CARE & REHABILITATION - BAYSIDE 411081381 SUNBRIDGE CARE & REHABILITATION - SHUKSAN 411148082 SUNBRIDGE CARE & REHABILITATION FOR ANACORTES 411064983 SUNBRIDGE CARE & REHABILITATION FOR BURLINGTON 411063184 SUNBRIDGE CARE & REHABILITATION FOR MONTESANO 411268685 SUNBRIDGE CARE & REHABILITATION FOR SHELTON 411287686 SUNBRIDGE CARE & REHABILITATION OF OYSTER BAY 411140787 SUNRISE CARE & REHABILITATION FOR SHELTON 411280188 TALBOT CENTER FOR REHABILITATION AND HEALTHCARE 411264589 WALNUT GROVE NURSING HOME 411135790 WEDGWOOD REHABILITATION CENTER 411129091 YAKIMA CONVALESCENT CENTER 4111654
All facilities excluded, except Bailey Boushay, did not have complete cost data in all periods evaluated. Bailey Boushay was excluded as an atypical facility.
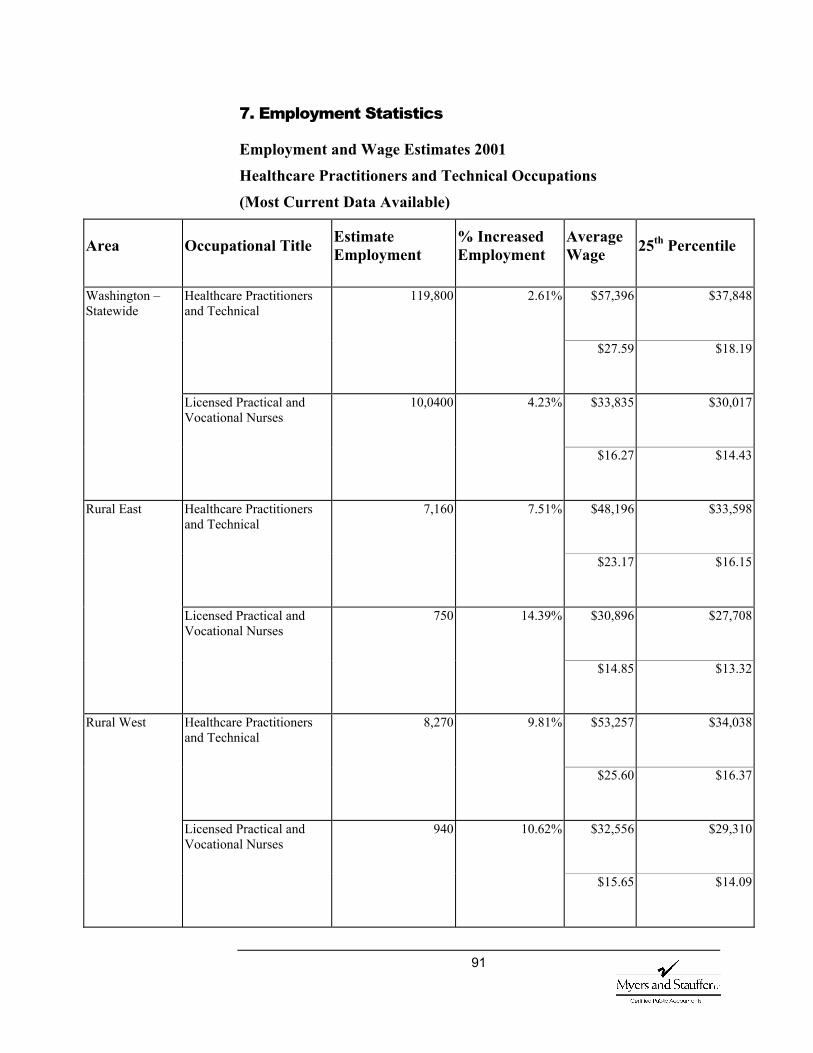
91
7. Employment Statistics
Employment and Wage Estimates 2001
Healthcare Practitioners and Technical Occupations
(Most Current Data Available)
Area Occupational Title Estimate Employment
% Increased Employment
Average Wage 25th Percentile
119,800 2.61% $57,396 $37,848 Healthcare Practitioners and Technical
$27.59 $18.19
10,0400 4.23% $33,835 $30,017
Washington – Statewide
Licensed Practical and Vocational Nurses
$16.27 $14.43
7,160 7.51% $48,196 $33,598 Healthcare Practitioners and Technical
$23.17 $16.15
750 14.39% $30,896 $27,708
Rural East
Licensed Practical and Vocational Nurses
$14.85 $13.32
8,270 9.81% $53,257 $34,038 Healthcare Practitioners and Technical
$25.60 $16.37
940 10.62% $32,556 $29,310
Rural West
Licensed Practical and Vocational Nurses
$15.65 $14.09
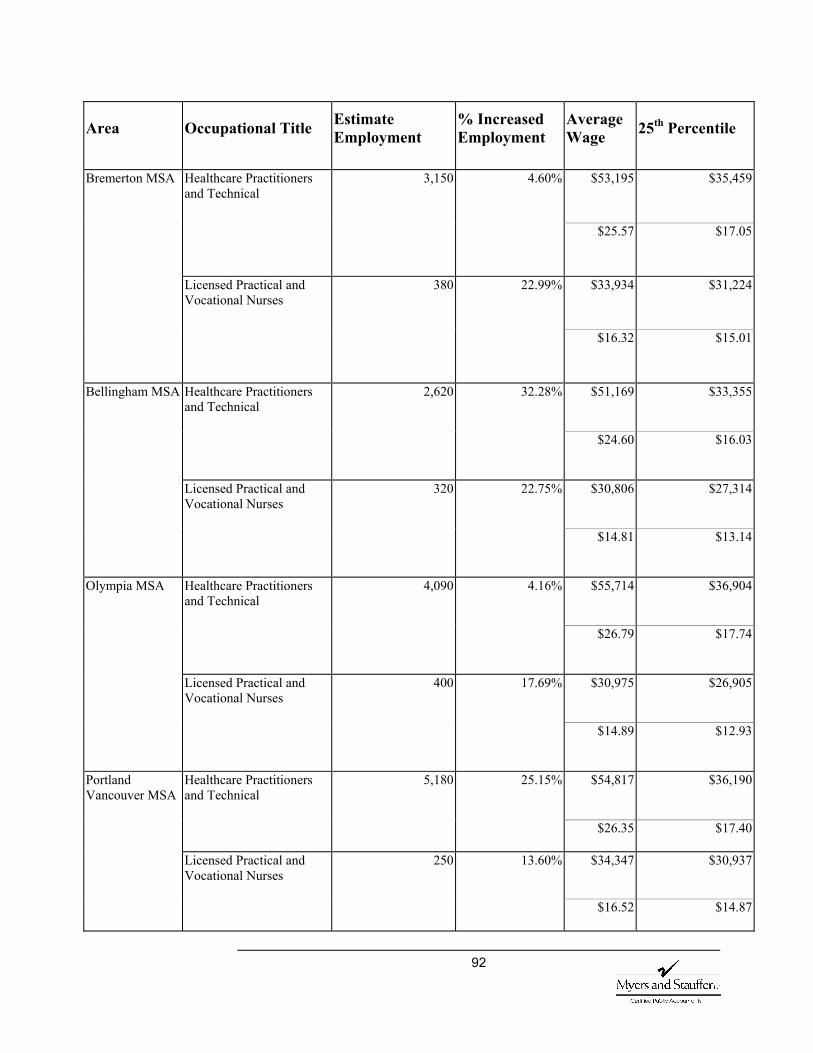
92
Area Occupational Title Estimate Employment
% Increased Employment
Average Wage 25th Percentile
3,150 4.60% $53,195 $35,459 Healthcare Practitioners and Technical
$25.57 $17.05
380 22.99% $33,934 $31,224
Bremerton MSA
Licensed Practical and Vocational Nurses
$16.32 $15.01
2,620 32.28% $51,169 $33,355 Healthcare Practitioners and Technical
$24.60 $16.03
320 22.75% $30,806 $27,314
Bellingham MSA
Licensed Practical and Vocational Nurses
$14.81 $13.14
Healthcare Practitioners and Technical
4,090 4.16% $55,714 $36,904
$26.79 $17.74
Licensed Practical and Vocational Nurses
400 17.69% $30,975 $26,905
Olympia MSA
$14.89 $12.93
Healthcare Practitioners and Technical
5,180 25.15% $54,817 $36,190
$26.35 $17.40
Licensed Practical and Vocational Nurses
250 13.60% $34,347 $30,937
Portland Vancouver MSA
$16.52 $14.87
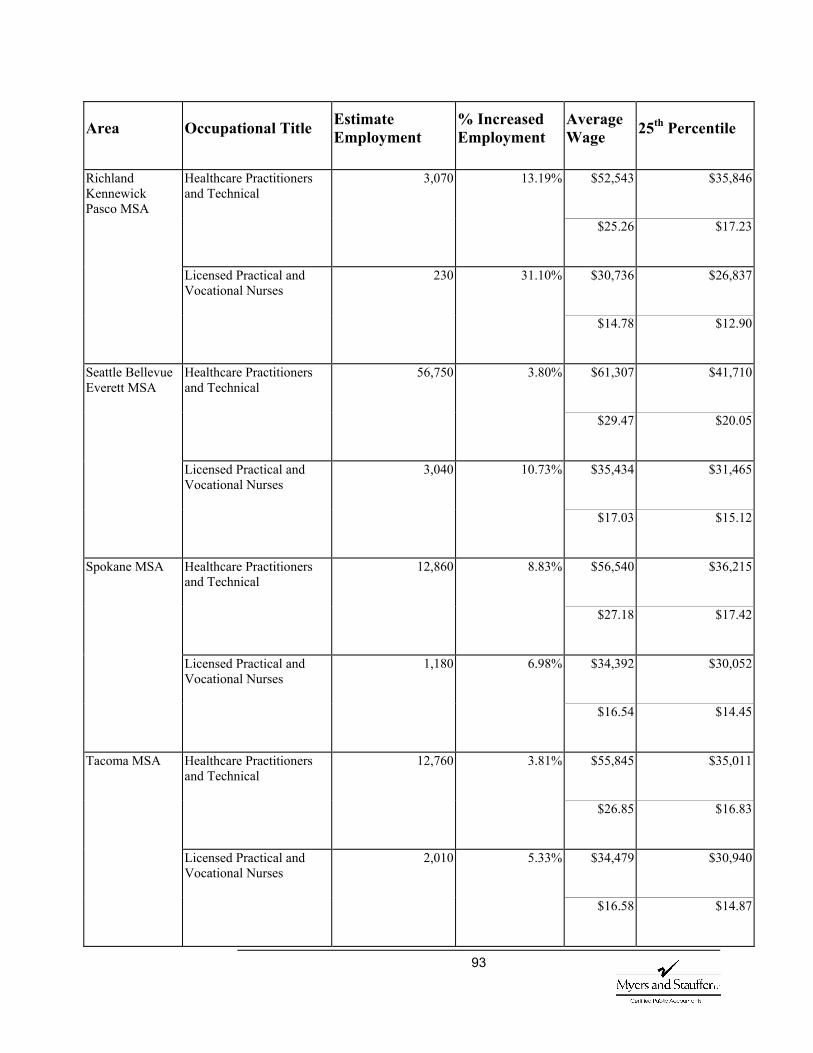
93
Area Occupational Title Estimate Employment
% Increased Employment
Average Wage 25th Percentile
Healthcare Practitioners and Technical
3,070 13.19% $52,543 $35,846
$25.26 $17.23
Licensed Practical and Vocational Nurses
230 31.10% $30,736 $26,837
Richland Kennewick Pasco MSA
$14.78 $12.90
Healthcare Practitioners and Technical
56,750 3.80% $61,307 $41,710
$29.47 $20.05
3,040 10.73% $35,434 $31,465
Seattle Bellevue Everett MSA
Licensed Practical and Vocational Nurses
$17.03 $15.12
Healthcare Practitioners and Technical
12,860 8.83% $56,540 $36,215
$27.18 $17.42
Licensed Practical and Vocational Nurses
1,180 6.98% $34,392 $30,052
Spokane MSA
$16.54 $14.45
Healthcare Practitioners and Technical
12,760 3.81% $55,845 $35,011
$26.85 $16.83
Licensed Practical and Vocational Nurses
2,010 5.33% $34,479 $30,940
Tacoma MSA
$16.58 $14.87
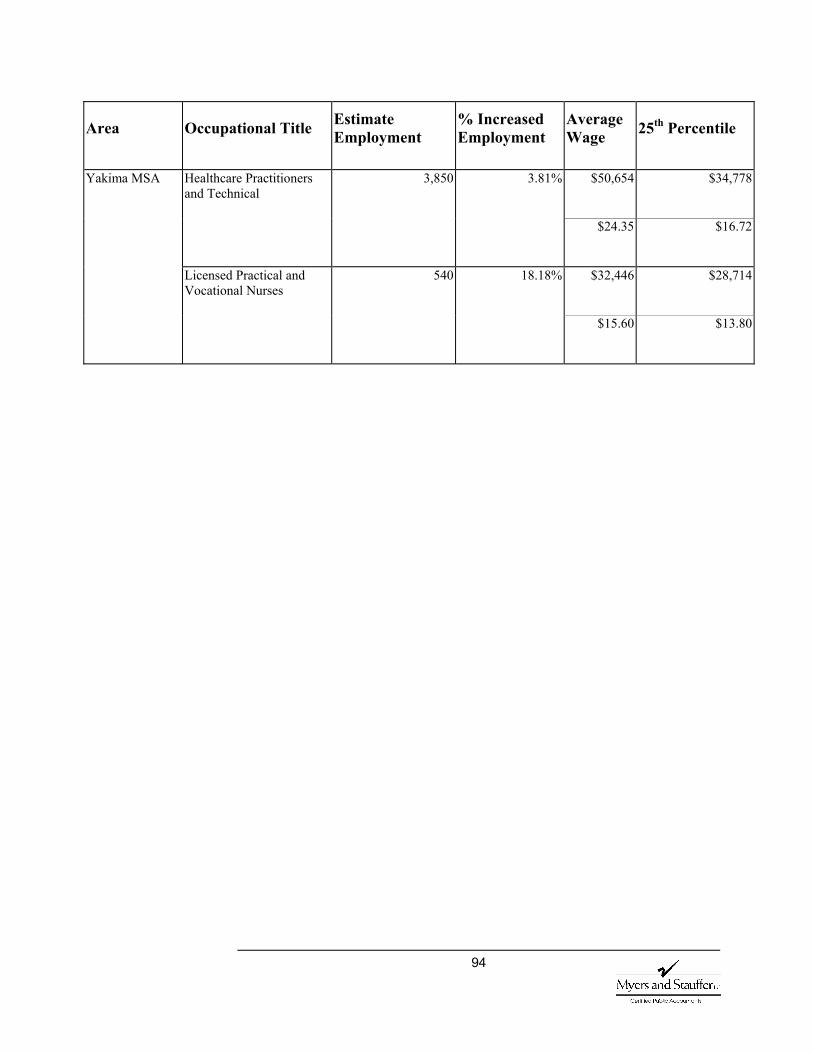
94
Area Occupational Title Estimate Employment
% Increased Employment
Average Wage 25th Percentile
Healthcare Practitioners and Technical
3,850 3.81% $50,654 $34,778
$24.35 $16.72
Licensed Practical and Vocational Nurses
540 18.18% $32,446 $28,714
Yakima MSA
$15.60 $13.80
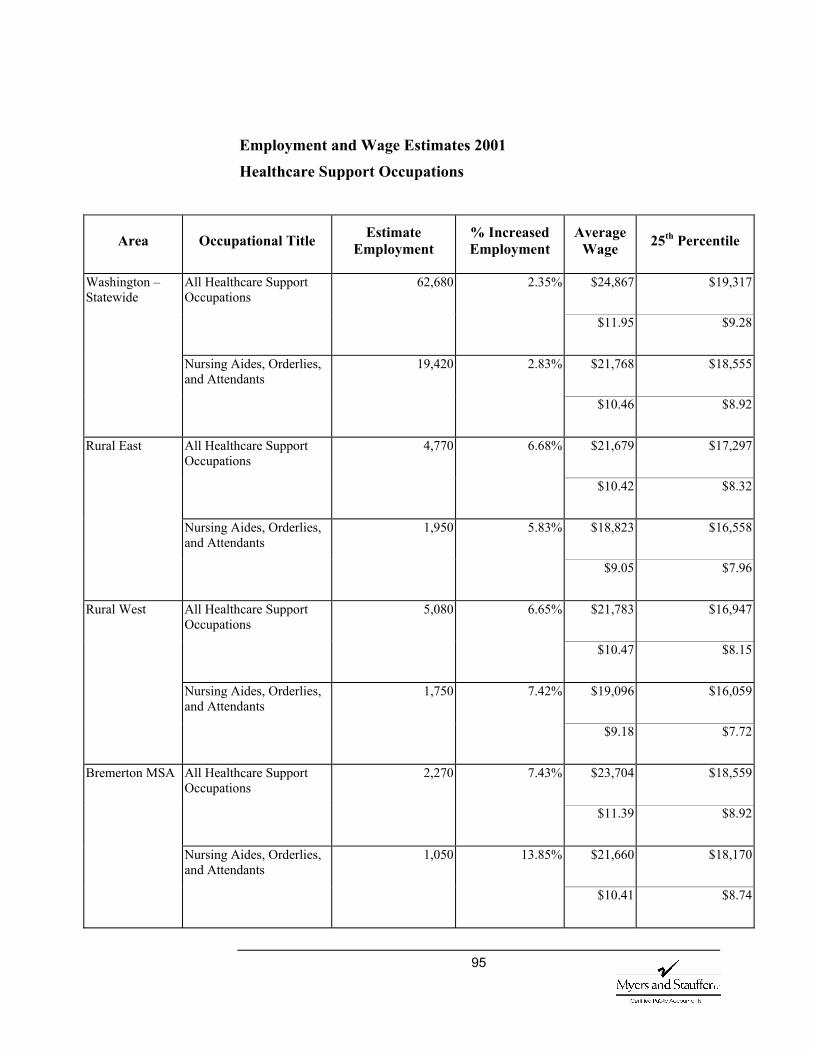
95
Employment and Wage Estimates 2001
Healthcare Support Occupations
Area Occupational Title Estimate Employment
% Increased Employment
Average Wage 25th Percentile
62,680 2.35% $24,867 $19,317 All Healthcare Support Occupations
$11.95 $9.28
19,420 2.83% $21,768 $18,555
Washington – Statewide
Nursing Aides, Orderlies, and Attendants
$10.46 $8.92
4,770 6.68% $21,679 $17,297 All Healthcare Support Occupations
$10.42 $8.32
1,950 5.83% $18,823 $16,558
Rural East
Nursing Aides, Orderlies, and Attendants
$9.05 $7.96
5,080 6.65% $21,783 $16,947 All Healthcare Support Occupations
$10.47 $8.15
1,750 7.42% $19,096 $16,059
Rural West
Nursing Aides, Orderlies, and Attendants
$9.18 $7.72
2,270 7.43% $23,704 $18,559 All Healthcare Support Occupations
$11.39 $8.92
1,050 13.85% $21,660 $18,170
Bremerton MSA
Nursing Aides, Orderlies, and Attendants
$10.41 $8.74
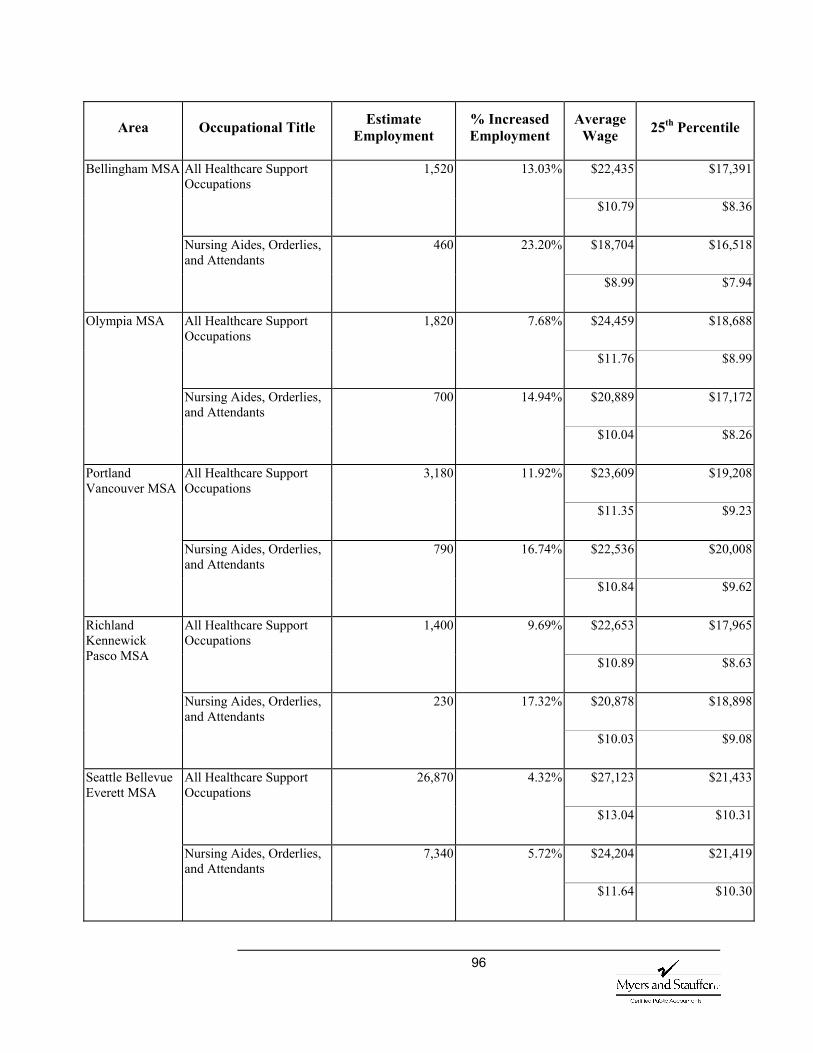
96
Area Occupational Title Estimate Employment
% Increased Employment
Average Wage 25th Percentile
1,520 13.03% $22,435 $17,391 All Healthcare Support Occupations
$10.79 $8.36
460 23.20% $18,704 $16,518
Bellingham MSA
Nursing Aides, Orderlies, and Attendants
$8.99 $7.94
1,820 7.68% $24,459 $18,688 All Healthcare Support Occupations
$11.76 $8.99
700 14.94% $20,889 $17,172
Olympia MSA
Nursing Aides, Orderlies, and Attendants
$10.04 $8.26
3,180 11.92% $23,609 $19,208 All Healthcare Support Occupations
$11.35 $9.23
790 16.74% $22,536 $20,008
Portland Vancouver MSA
Nursing Aides, Orderlies, and Attendants
$10.84 $9.62
1,400 9.69% $22,653 $17,965 All Healthcare Support Occupations
$10.89 $8.63
230 17.32% $20,878 $18,898
Richland Kennewick Pasco MSA
Nursing Aides, Orderlies, and Attendants
$10.03 $9.08
26,870 4.32% $27,123 $21,433 All Healthcare Support Occupations
$13.04 $10.31
7,340 5.72% $24,204 $21,419
Seattle Bellevue Everett MSA
Nursing Aides, Orderlies, and Attendants
$11.64 $10.30
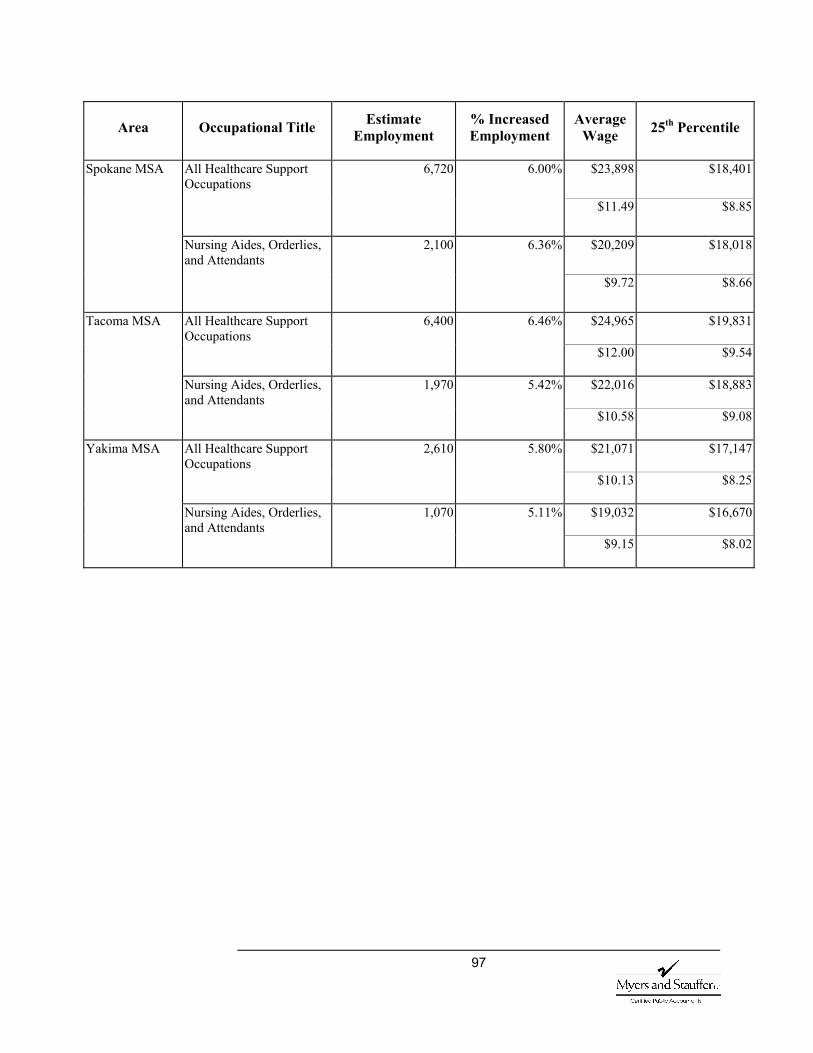
97
Area Occupational Title Estimate Employment
% Increased Employment
Average Wage 25th Percentile
6,720 6.00% $23,898 $18,401 All Healthcare Support Occupations
$11.49 $8.85
2,100 6.36% $20,209 $18,018
Spokane MSA
Nursing Aides, Orderlies, and Attendants
$9.72 $8.66
6,400 6.46% $24,965 $19,831 All Healthcare Support Occupations
$12.00 $9.54
1,970 5.42% $22,016 $18,883
Tacoma MSA
Nursing Aides, Orderlies, and Attendants
$10.58 $9.08
2,610 5.80% $21,071 $17,147 All Healthcare Support Occupations
$10.13 $8.25
1,070 5.11% $19,032 $16,670
Yakima MSA
Nursing Aides, Orderlies, and Attendants
$9.15 $8.02
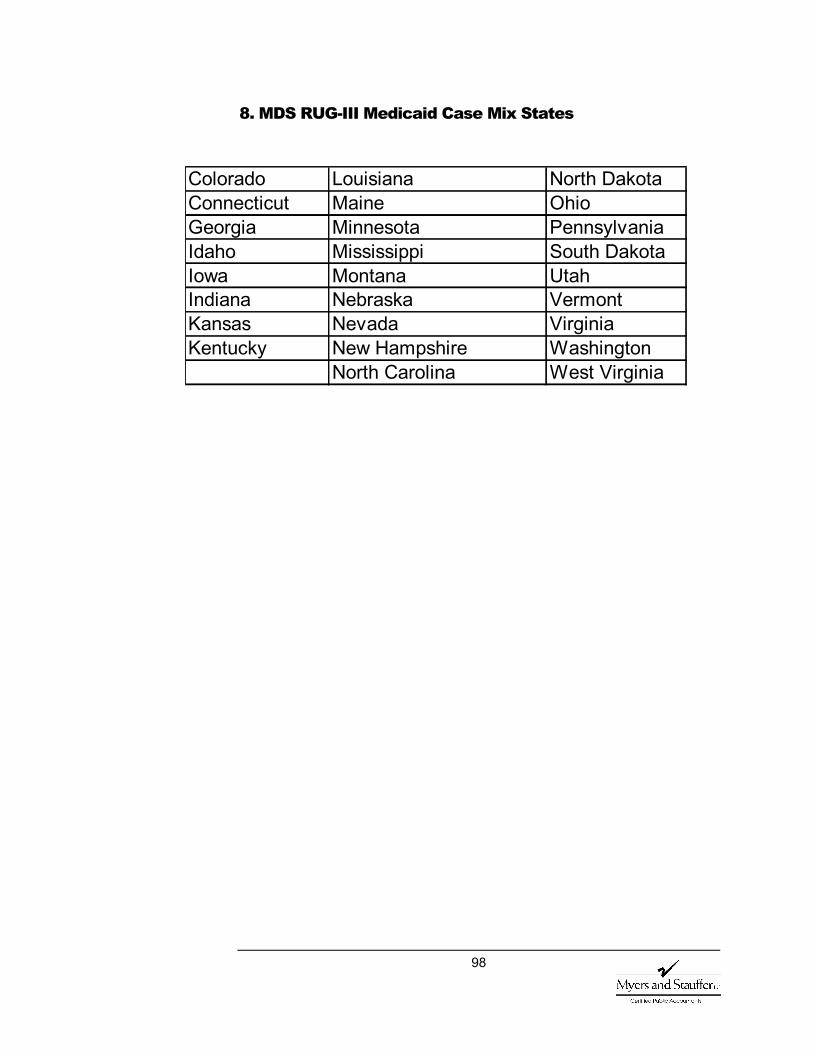
98
8. MDS RUG-III Medicaid Case Mix States
Colorado Louisiana North Dakota Connecticut Maine Ohio Georgia Minnesota Pennsylvania Idaho Mississippi South Dakota Iowa Montana Utah Indiana Nebraska Vermont Kansas Nevada Virginia Kentucky New Hampshire Washington
North Carolina West Virginia
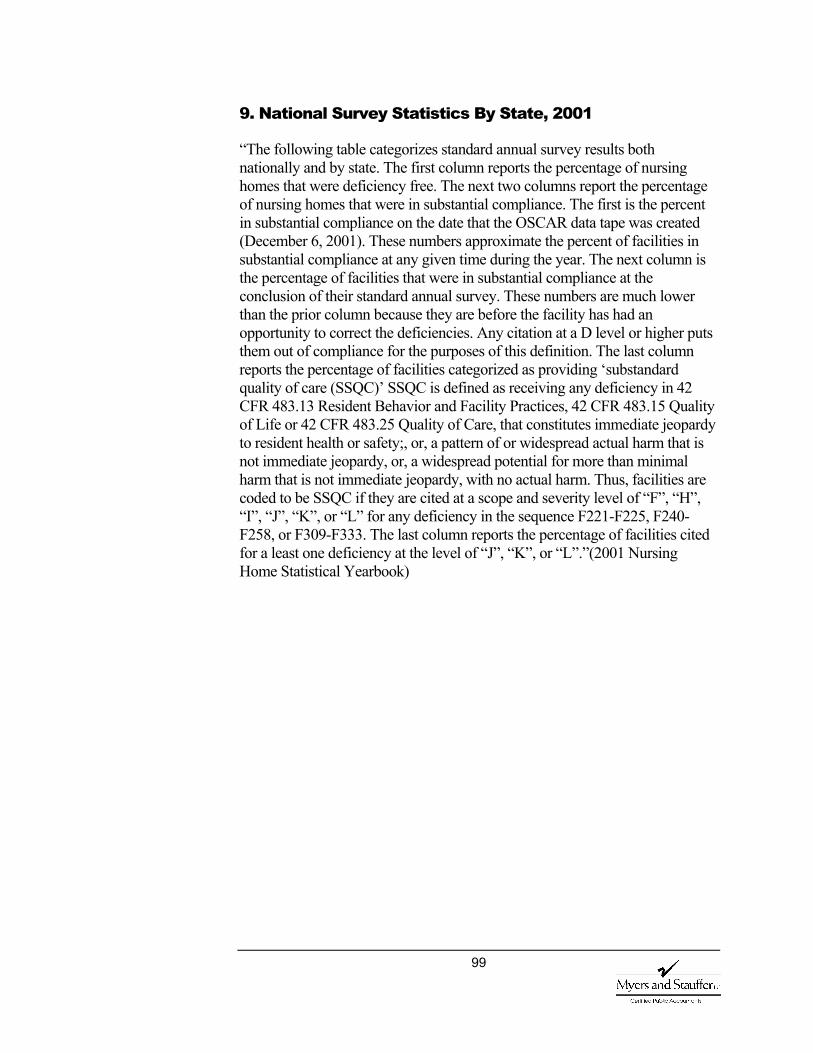
99
9. National Survey Statistics By State, 2001
“The following table categorizes standard annual survey results both nationally and by state. The first column reports the percentage of nursing homes that were deficiency free. The next two columns report the percentage of nursing homes that were in substantial compliance. The first is the percent in substantial compliance on the date that the OSCAR data tape was created (December 6, 2001). These numbers approximate the percent of facilities in substantial compliance at any given time during the year. The next column is the percentage of facilities that were in substantial compliance at the conclusion of their standard annual survey. These numbers are much lower than the prior column because they are before the facility has had an opportunity to correct the deficiencies. Any citation at a D level or higher puts them out of compliance for the purposes of this definition. The last column reports the percentage of facilities categorized as providing ‘substandard quality of care (SSQC)’ SSQC is defined as receiving any deficiency in 42 CFR 483.13 Resident Behavior and Facility Practices, 42 CFR 483.15 Quality of Life or 42 CFR 483.25 Quality of Care, that constitutes immediate jeopardy to resident health or safety;, or, a pattern of or widespread actual harm that is not immediate jeopardy, or, a widespread potential for more than minimal harm that is not immediate jeopardy, with no actual harm. Thus, facilities are coded to be SSQC if they are cited at a scope and severity level of “F”, “H”, “I”, “J”, “K”, or “L” for any deficiency in the sequence F221-F225, F240-F258, or F309-F333. The last column reports the percentage of facilities cited for a least one deficiency at the level of “J”, “K”, or “L”.”(2001 Nursing Home Statistical Yearbook)
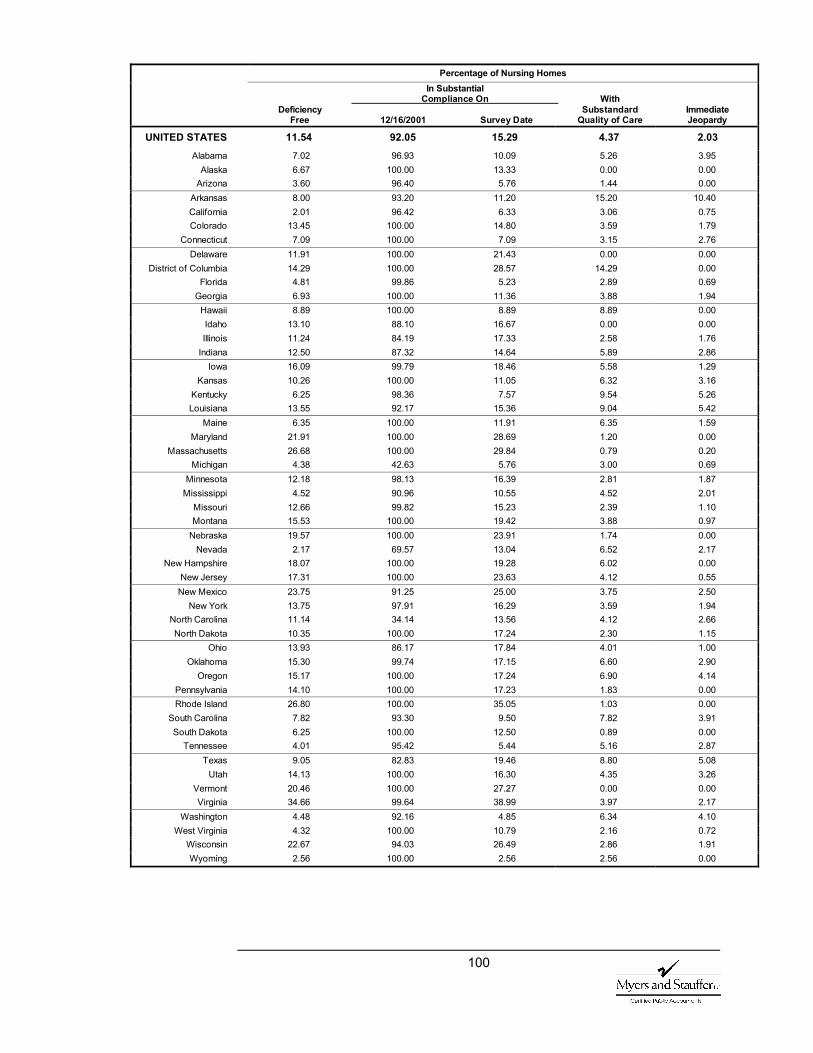
100
Percentage of Nursing Homes In Substantial Compliance On With Deficiency Substandard Immediate Free 12/16/2001 Survey Date Quality of Care Jeopardy
UNITED STATES 11.54 92.05 15.29 4.37 2.03 Alabama 7.02 96.93 10.09 5.26 3.95
Alaska 6.67 100.00 13.33 0.00 0.00 Arizona 3.60 96.40 5.76 1.44 0.00
Arkansas 8.00 93.20 11.20 15.20 10.40 California 2.01 96.42 6.33 3.06 0.75 Colorado 13.45 100.00 14.80 3.59 1.79
Connecticut 7.09 100.00 7.09 3.15 2.76 Delaware 11.91 100.00 21.43 0.00 0.00
District of Columbia 14.29 100.00 28.57 14.29 0.00 Florida 4.81 99.86 5.23 2.89 0.69
Georgia 6.93 100.00 11.36 3.88 1.94 Hawaii 8.89 100.00 8.89 8.89 0.00 Idaho 13.10 88.10 16.67 0.00 0.00 Illinois 11.24 84.19 17.33 2.58 1.76
Indiana 12.50 87.32 14.64 5.89 2.86 Iowa 16.09 99.79 18.46 5.58 1.29
Kansas 10.26 100.00 11.05 6.32 3.16 Kentucky 6.25 98.36 7.57 9.54 5.26 Louisiana 13.55 92.17 15.36 9.04 5.42
Maine 6.35 100.00 11.91 6.35 1.59 Maryland 21.91 100.00 28.69 1.20 0.00
Massachusetts 26.68 100.00 29.84 0.79 0.20 Michigan 4.38 42.63 5.76 3.00 0.69
Minnesota 12.18 98.13 16.39 2.81 1.87 Mississippi 4.52 90.96 10.55 4.52 2.01
Missouri 12.66 99.82 15.23 2.39 1.10 Montana 15.53 100.00 19.42 3.88 0.97
Nebraska 19.57 100.00 23.91 1.74 0.00 Nevada 2.17 69.57 13.04 6.52 2.17
New Hampshire 18.07 100.00 19.28 6.02 0.00 New Jersey 17.31 100.00 23.63 4.12 0.55 New Mexico 23.75 91.25 25.00 3.75 2.50
New York 13.75 97.91 16.29 3.59 1.94 North Carolina 11.14 34.14 13.56 4.12 2.66 North Dakota 10.35 100.00 17.24 2.30 1.15
Ohio 13.93 86.17 17.84 4.01 1.00 Oklahoma 15.30 99.74 17.15 6.60 2.90
Oregon 15.17 100.00 17.24 6.90 4.14 Pennsylvania 14.10 100.00 17.23 1.83 0.00 Rhode Island 26.80 100.00 35.05 1.03 0.00
South Carolina 7.82 93.30 9.50 7.82 3.91 South Dakota 6.25 100.00 12.50 0.89 0.00
Tennessee 4.01 95.42 5.44 5.16 2.87 Texas 9.05 82.83 19.46 8.80 5.08
Utah 14.13 100.00 16.30 4.35 3.26 Vermont 20.46 100.00 27.27 0.00 0.00 Virginia 34.66 99.64 38.99 3.97 2.17
Washington 4.48 92.16 4.85 6.34 4.10 West Virginia 4.32 100.00 10.79 2.16 0.72
Wisconsin 22.67 94.03 26.49 2.86 1.91 Wyoming 2.56 100.00 2.56 2.56 0.00
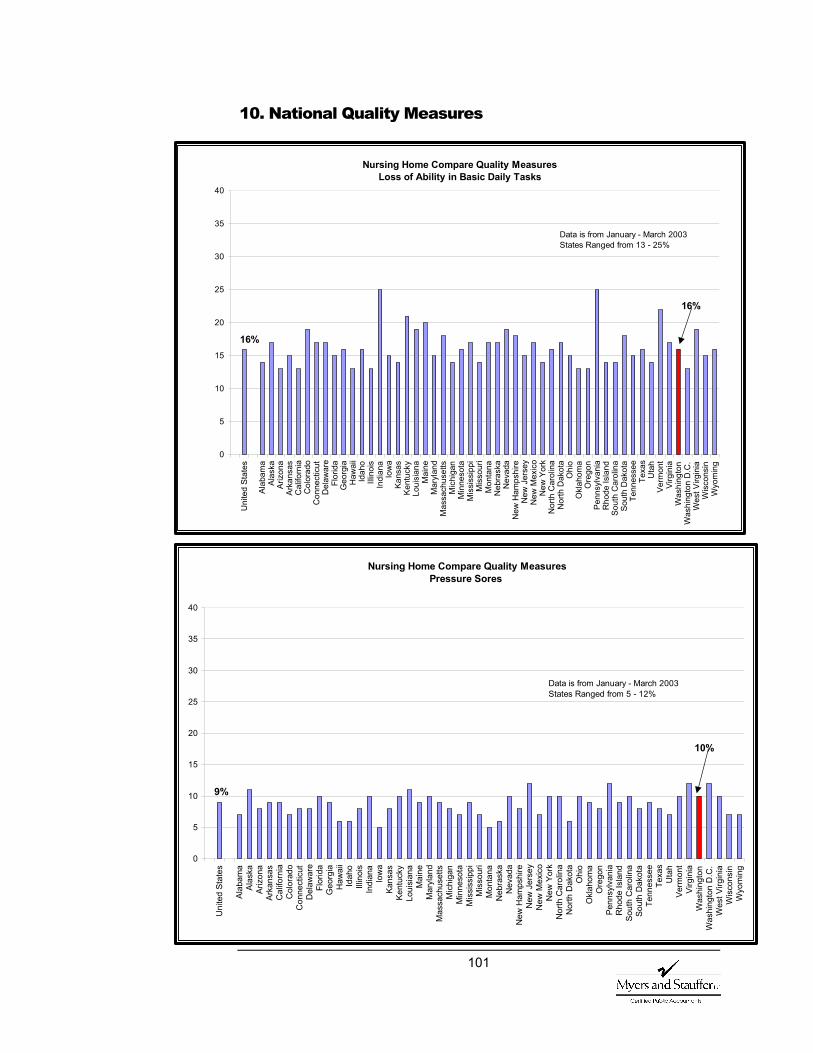
101
10. National Quality Measures
Nursing Home Compare Quality Measures
Loss of Ability in Basic Daily Tasks
0
5
10
15
20
25
30
35
40
Uni
ted
Stat
es
Alab
ama
Alas
kaAr
izon
aAr
kans
asC
alifo
rnia
Col
orad
oC
onne
ctic
utD
elaw
are
Flor
ida
Geo
rgia
Haw
aii
Idah
oIll
inoi
sIn
dian
aIo
wa
Kans
asKe
ntuc
kyLo
uisi
ana
Mai
neM
aryl
and
Mas
sach
uset
tsM
ichi
gan
Min
neso
taM
issi
ssip
piM
isso
uri
Mon
tana
Neb
rask
aN
evad
aN
ew H
amps
hire
New
Jer
sey
New
Mex
ico
New
Yor
kN
orth
Car
olin
aN
orth
Dak
ota
Ohi
oO
klah
oma
Ore
gon
Penn
sylv
ania
Rho
de Is
land
Sout
h C
arol
ina
Sout
h D
akot
aTe
nnes
see
Texa
sU
tah
Verm
ont
Virg
inia
Was
hing
ton
Was
hing
ton
D.C
.W
est V
irgin
iaW
isco
nsin
Wyo
min
g
16%
16%
Data is from January - March 2003States Ranged from 13 - 25%
Nursing Home Compare Quality Measures Pressure Sores
0
5
10
15
20
25
30
35
40
Uni
ted
Stat
es
Alab
ama
Alas
kaAr
izon
aAr
kans
asC
alifo
rnia
Col
orad
oC
onne
ctic
utD
elaw
are
Flor
ida
Geo
rgia
Haw
aii
Idah
oIll
inoi
sIn
dian
aIo
wa
Kans
asKe
ntuc
kyLo
uisi
ana
Mai
neM
aryl
and
Mas
sach
uset
tsM
ichi
gan
Min
neso
taM
issi
ssip
piM
isso
uri
Mon
tana
Neb
rask
aN
evad
aN
ew H
amps
hire
New
Jer
sey
New
Mex
ico
New
Yor
kN
orth
Car
olin
aN
orth
Dak
ota
Ohi
oO
klah
oma
Ore
gon
Penn
sylv
ania
Rho
de Is
land
Sout
h C
arol
ina
Sout
h D
akot
aTe
nnes
see
Texa
sU
tah
Verm
ont
Virg
inia
Was
hing
ton
Was
hing
ton
D.C
.W
est V
irgin
iaW
isco
nsin
Wyo
min
g10%
9%
Data is from January - March 2003States Ranged from 5 - 12%

102
Nursing Home Compare Quality MeasuresPressure Sores (With an Additional Level of Risk Adjustment)
0
5
10
15
20
25
30
35
40
Uni
ted
Stat
es
Alab
ama
Alas
kaAr
izon
aAr
kans
asC
alifo
rnia
Col
orad
oC
onne
ctic
utD
elaw
are
Flor
ida
Geo
rgia
Haw
aii
Idah
oIll
inoi
sIn
dian
aIo
wa
Kans
asKe
ntuc
kyLo
uisi
ana
Mai
neM
aryl
and
Mas
sach
uset
tsM
ichi
gan
Min
neso
taM
issi
ssip
piM
isso
uri
Mon
tana
Neb
rask
aN
evad
aN
ew H
amps
hire
New
Jer
sey
New
Mex
ico
New
Yor
kN
orth
Car
olin
aN
orth
Dak
ota
Ohi
oO
klah
oma
Ore
gon
Penn
sylv
ania
Rho
de Is
land
Sout
h C
arol
ina
Sout
h D
akot
aTe
nnes
see
Texa
sU
tah
Verm
ont
Virg
inia
Was
hing
ton
Was
hing
ton
D.C
.W
est V
irgin
iaW
isco
nsin
Wyo
min
g
10%
9%
Data is from January - March 2003States Ranged from 6 - 12%
Nursing Home Compare Quality Measures Pain
0
5
10
15
20
25
30
35
40
Uni
ted
Stat
es
Alab
ama
Alas
kaAr
izon
aAr
kans
asC
alifo
rnia
Col
orad
oC
onne
ctic
utD
elaw
are
Flor
ida
Geo
rgia
Haw
aii
Idah
oIll
inoi
sIn
dian
aIo
wa
Kans
asKe
ntuc
kyLo
uisi
ana
Mai
neM
aryl
and
Mas
sach
uset
tsM
ichi
gan
Min
neso
taM
issi
ssip
piM
isso
uri
Mon
tana
Neb
rask
aN
evad
aN
ew H
amps
hire
New
Jer
sey
New
Mex
ico
New
Yor
kN
orth
Car
olin
aN
orth
Dak
ota
Ohi
oO
klah
oma
Ore
gon
Penn
sylv
ania
Rho
de Is
land
Sout
h C
arol
ina
Sout
h D
akot
aTe
nnes
see
Texa
sU
tah
Verm
ont
Virg
inia
Was
hing
ton
Was
hing
ton
D.C
.W
est V
irgin
iaW
isco
nsin
Wyo
min
g10%
8%
Data is from January - March 2003States Ranged from 4 - 15%
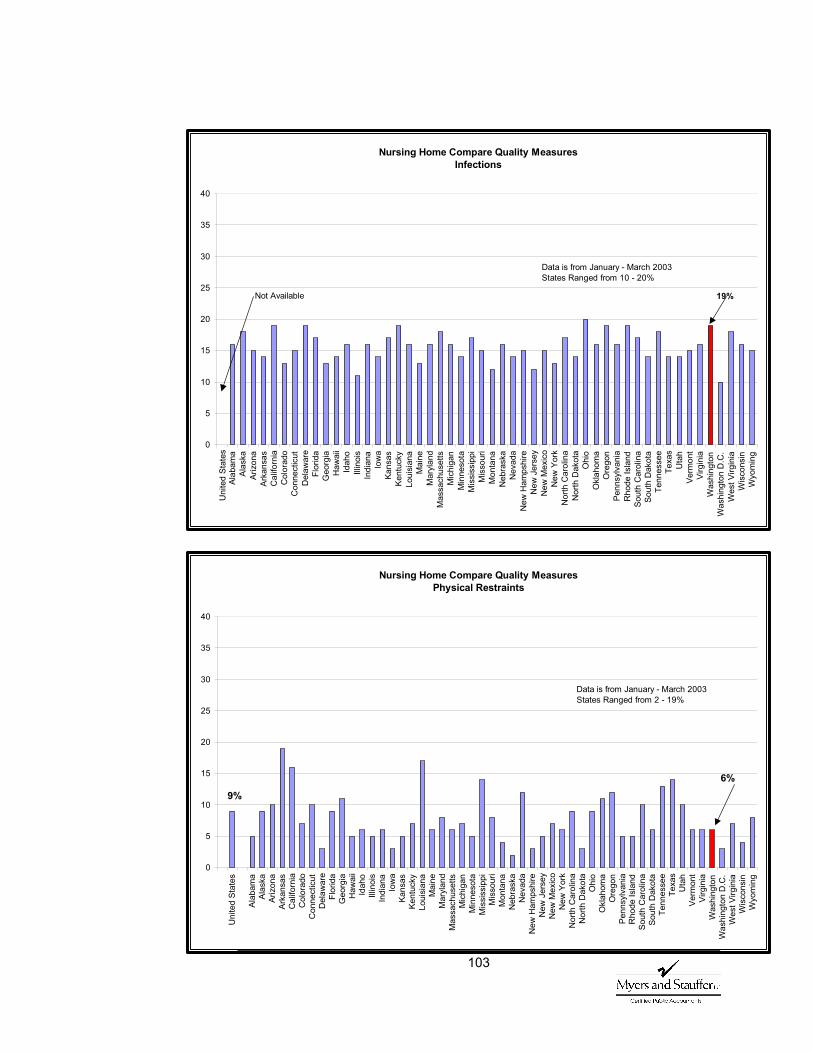
103
Nursing Home Compare Quality Measures
Infections
0
5
10
15
20
25
30
35
40
Alab
ama
Alas
kaAr
izon
aAr
kans
asC
alifo
rnia
Col
orad
oC
onne
ctic
utD
elaw
are
Flor
ida
Geo
rgia
Haw
aii
Idah
oIll
inoi
sIn
dian
aIo
wa
Kans
asKe
ntuc
kyLo
uisi
ana
Mai
neM
aryl
and
Mas
sach
uset
tsM
ichi
gan
Min
neso
taM
issi
ssip
piM
isso
uri
Mon
tana
Neb
rask
aN
evad
aN
ew H
amps
hire
New
Jer
sey
New
Mex
ico
New
Yor
kN
orth
Car
olin
aN
orth
Dak
ota
Ohi
oO
klah
oma
Ore
gon
Penn
sylv
ania
Rho
de Is
land
Sout
h C
arol
ina
Sout
h D
akot
aTe
nnes
see
Texa
sU
tah
Verm
ont
Virg
inia
Was
hing
ton
Was
hing
ton
D.C
.W
est V
irgin
iaW
isco
nsin
Wyo
min
g
19%
Uni
ted
Stat
es
Not Available
Data is from January - March 2003States Ranged from 10 - 20%
Nursing Home Compare Quality Measures Physical Restraints
0
5
10
15
20
25
30
35
40
Uni
ted
Stat
es
Alab
ama
Alas
kaAr
izon
aAr
kans
asC
alifo
rnia
Col
orad
oC
onne
ctic
utD
elaw
are
Flor
ida
Geo
rgia
Haw
aii
Idah
oIll
inoi
sIn
dian
aIo
wa
Kans
asKe
ntuc
kyLo
uisi
ana
Mai
neM
aryl
and
Mas
sach
uset
tsM
ichi
gan
Min
neso
taM
issi
ssip
piM
isso
uri
Mon
tana
Neb
rask
aN
evad
aN
ew H
amps
hire
New
Jer
sey
New
Mex
ico
New
Yor
kN
orth
Car
olin
aN
orth
Dak
ota
Ohi
oO
klah
oma
Ore
gon
Penn
sylv
ania
Rho
de Is
land
Sout
h C
arol
ina
Sout
h D
akot
aTe
nnes
see
Texa
sU
tah
Verm
ont
Virg
inia
Was
hing
ton
Was
hing
ton
D.C
.W
est V
irgin
iaW
isco
nsin
Wyo
min
g
6%9%
Data is from January - March 2003States Ranged from 2 - 19%
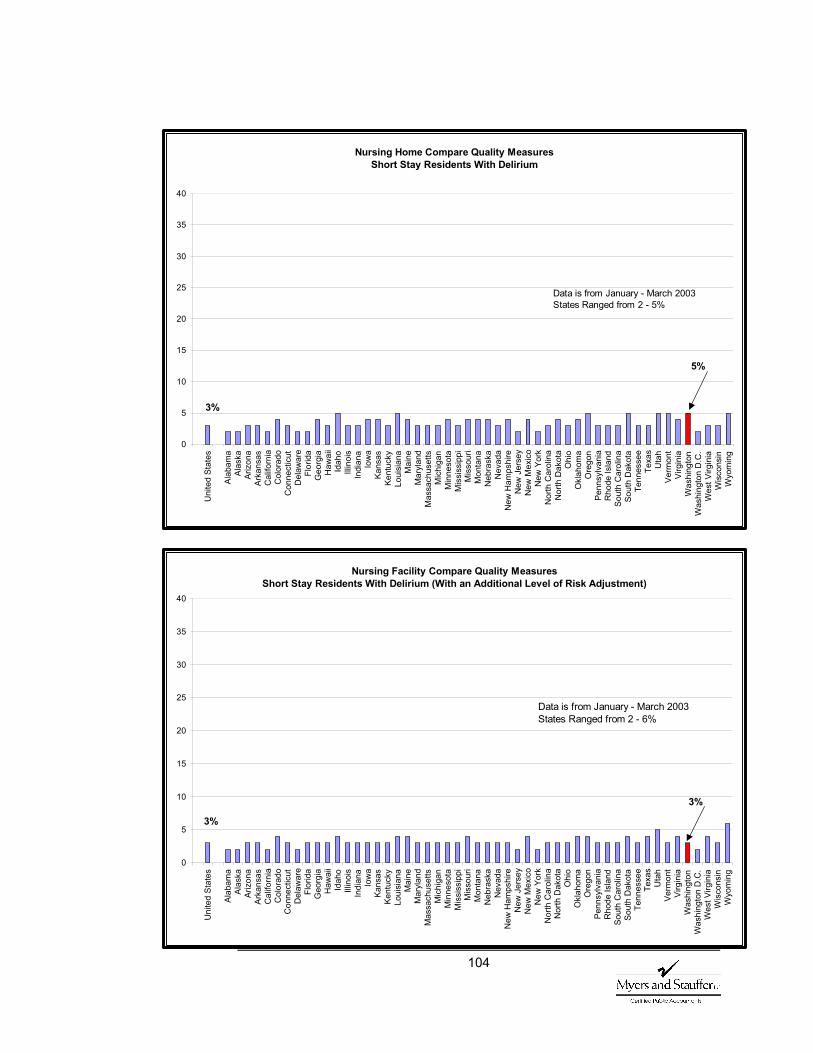
104
Nursing Home Compare Quality Measures
Short Stay Residents With Delirium
0
5
10
15
20
25
30
35
40U
nite
d St
ates
Alab
ama
Alas
kaAr
izon
aAr
kans
asC
alifo
rnia
Col
orad
oC
onne
ctic
utD
elaw
are
Flor
ida
Geo
rgia
Haw
aii
Idah
oIll
inoi
sIn
dian
aIo
wa
Kans
asKe
ntuc
kyLo
uisi
ana
Mai
neM
aryl
and
Mas
sach
uset
tsM
ichi
gan
Min
neso
taM
issi
ssip
piM
isso
uri
Mon
tana
Neb
rask
aN
evad
aN
ew H
amps
hire
New
Jer
sey
New
Mex
ico
New
Yor
kN
orth
Car
olin
aN
orth
Dak
ota
Ohi
oO
klah
oma
Ore
gon
Penn
sylv
ania
Rho
de Is
land
Sout
h C
arol
ina
Sout
h D
akot
aTe
nnes
see
Texa
sU
tah
Verm
ont
Virg
inia
Was
hing
ton
Was
hing
ton
D.C
.W
est V
irgin
iaW
isco
nsin
Wyo
min
g
5%
3%
Data is from January - March 2003States Ranged from 2 - 5%
Nursing Facility Compare Quality MeasuresShort Stay Residents With Delirium (With an Additional Level of Risk Adjustment)
0
5
10
15
20
25
30
35
40
Uni
ted
Stat
es
Alab
ama
Alas
kaAr
izon
aAr
kans
asC
alifo
rnia
Col
orad
oC
onne
ctic
utD
elaw
are
Flor
ida
Geo
rgia
Haw
aii
Idah
oIll
inoi
sIn
dian
aIo
wa
Kans
asKe
ntuc
kyLo
uisi
ana
Mai
neM
aryl
and
Mas
sach
uset
tsM
ichi
gan
Min
neso
taM
issi
ssip
piM
isso
uri
Mon
tana
Neb
rask
aN
evad
aN
ew H
amps
hire
New
Jer
sey
New
Mex
ico
New
Yor
kN
orth
Car
olin
aN
orth
Dak
ota
Ohi
oO
klah
oma
Ore
gon
Penn
sylv
ania
Rho
de Is
land
Sout
h C
arol
ina
Sout
h D
akot
aTe
nnes
see
Texa
sU
tah
Verm
ont
Virg
inia
Was
hing
ton
Was
hing
ton
D.C
.W
est V
irgin
iaW
isco
nsin
Wyo
min
g
3%
3%
Data is from January - March 2003States Ranged from 2 - 6%
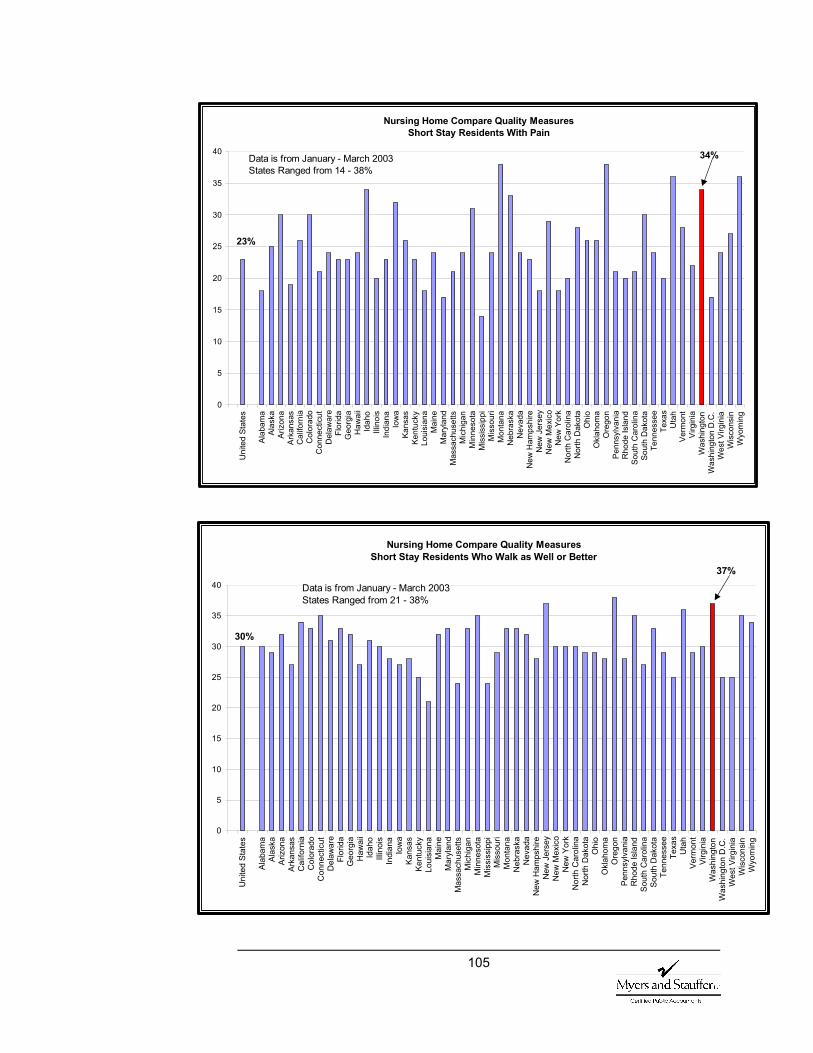
105
Nursing Home Compare Quality Measures Short Stay Residents With Pain
0
5
10
15
20
25
30
35
40
Uni
ted
Stat
es
Alab
ama
Alas
kaAr
izon
aAr
kans
asC
alifo
rnia
Col
orad
oC
onne
ctic
utD
elaw
are
Flor
ida
Geo
rgia
Haw
aii
Idah
oIll
inoi
sIn
dian
aIo
wa
Kans
asKe
ntuc
kyLo
uisi
ana
Mai
neM
aryl
and
Mas
sach
uset
tsM
ichi
gan
Min
neso
taM
issi
ssip
piM
isso
uri
Mon
tana
Neb
rask
aN
evad
aN
ew H
amps
hire
New
Jer
sey
New
Mex
ico
New
Yor
kN
orth
Car
olin
aN
orth
Dak
ota
Ohi
oO
klah
oma
Ore
gon
Penn
sylv
ania
Rho
de Is
land
Sout
h C
arol
ina
Sout
h D
akot
aTe
nnes
see
Texa
sU
tah
Verm
ont
Virg
inia
Was
hing
ton
Was
hing
ton
D.C
.W
est V
irgin
iaW
isco
nsin
Wyo
min
g
34%
23%
Data is from January - March 2003States Ranged from 14 - 38%
Nursing Home Compare Quality Measures Short Stay Residents Who Walk as Well or Better
0
5
10
15
20
25
30
35
40
Uni
ted
Stat
es
Alab
ama
Alas
kaAr
izon
aAr
kans
asC
alifo
rnia
Col
orad
oC
onne
ctic
utD
elaw
are
Flor
ida
Geo
rgia
Haw
aii
Idah
oIll
inoi
sIn
dian
aIo
wa
Kans
asKe
ntuc
kyLo
uisi
ana
Mai
neM
aryl
and
Mas
sach
uset
tsM
ichi
gan
Min
neso
taM
issi
ssip
piM
isso
uri
Mon
tana
Neb
rask
aN
evad
aN
ew H
amps
hire
New
Jer
sey
New
Mex
ico
New
Yor
kN
orth
Car
olin
aN
orth
Dak
ota
Ohi
oO
klah
oma
Ore
gon
Penn
sylv
ania
Rho
de Is
land
Sout
h C
arol
ina
Sout
h D
akot
aTe
nnes
see
Texa
sU
tah
Verm
ont
Virg
inia
Was
hing
ton
Was
hing
ton
D.C
.W
est V
irgin
iaW
isco
nsin
Wyo
min
g
37%
30%
Data is from January - March 2003States Ranged from 21 - 38%
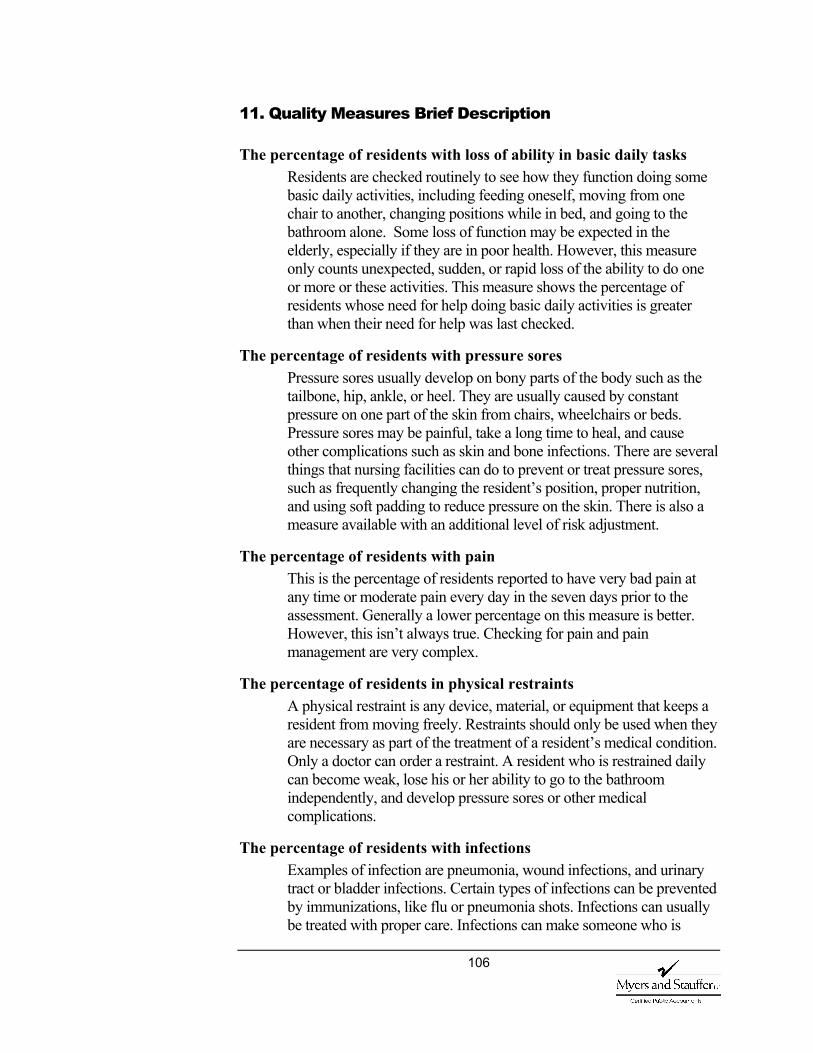
106
11. Quality Measures Brief Description
The percentage of residents with loss of ability in basic daily tasks Residents are checked routinely to see how they function doing some basic daily activities, including feeding oneself, moving from one chair to another, changing positions while in bed, and going to the bathroom alone. Some loss of function may be expected in the elderly, especially if they are in poor health. However, this measure only counts unexpected, sudden, or rapid loss of the ability to do one or more or these activities. This measure shows the percentage of residents whose need for help doing basic daily activities is greater than when their need for help was last checked.
The percentage of residents with pressure sores Pressure sores usually develop on bony parts of the body such as the tailbone, hip, ankle, or heel. They are usually caused by constant pressure on one part of the skin from chairs, wheelchairs or beds. Pressure sores may be painful, take a long time to heal, and cause other complications such as skin and bone infections. There are several things that nursing facilities can do to prevent or treat pressure sores, such as frequently changing the resident’s position, proper nutrition, and using soft padding to reduce pressure on the skin. There is also a measure available with an additional level of risk adjustment.
The percentage of residents with pain This is the percentage of residents reported to have very bad pain at any time or moderate pain every day in the seven days prior to the assessment. Generally a lower percentage on this measure is better. However, this isn’t always true. Checking for pain and pain management are very complex.
The percentage of residents in physical restraints A physical restraint is any device, material, or equipment that keeps a resident from moving freely. Restraints should only be used when they are necessary as part of the treatment of a resident’s medical condition. Only a doctor can order a restraint. A resident who is restrained daily can become weak, lose his or her ability to go to the bathroom independently, and develop pressure sores or other medical complications.
The percentage of residents with infections Examples of infection are pneumonia, wound infections, and urinary tract or bladder infections. Certain types of infections can be prevented by immunizations, like flu or pneumonia shots. Infections can usually be treated with proper care. Infections can make someone who is
107
already weak, weaker. This can lead to complications, hospitalization, or even death.
The percentage of short stay residents with delirium Delirium is a mix of short-term problems with focusing or shifting attention, being confused, and not being aware of one’s surroundings or environment. These systems may appear suddenly from a variety of causes and can be reversible. Delirium is a sign that the resident needs immediate medical attention. For example, residents with delirium may need their medications or diet changed. There is also a measure available with an additional level of risk adjustment.
The percentage of short stay residents with pain This is the percentage of residents expected to stay in the nursing facility for a short period of time, reported to have very bad pain at any time or moderate pain every day in the seven days prior to the assessment. Generally a lower percentage on this measure is better. However, this isn’t always true. Checking for pain and pain management are very complex.
The percentage of short stay residents who walk as well or better This reports short stay residents who walked better on day 14 than on day 5 of their stay or who walked independently on day five and maintained that level on day 14. Being able to walk on one’s own helps improve the quality of life and how residents feel about themselves.
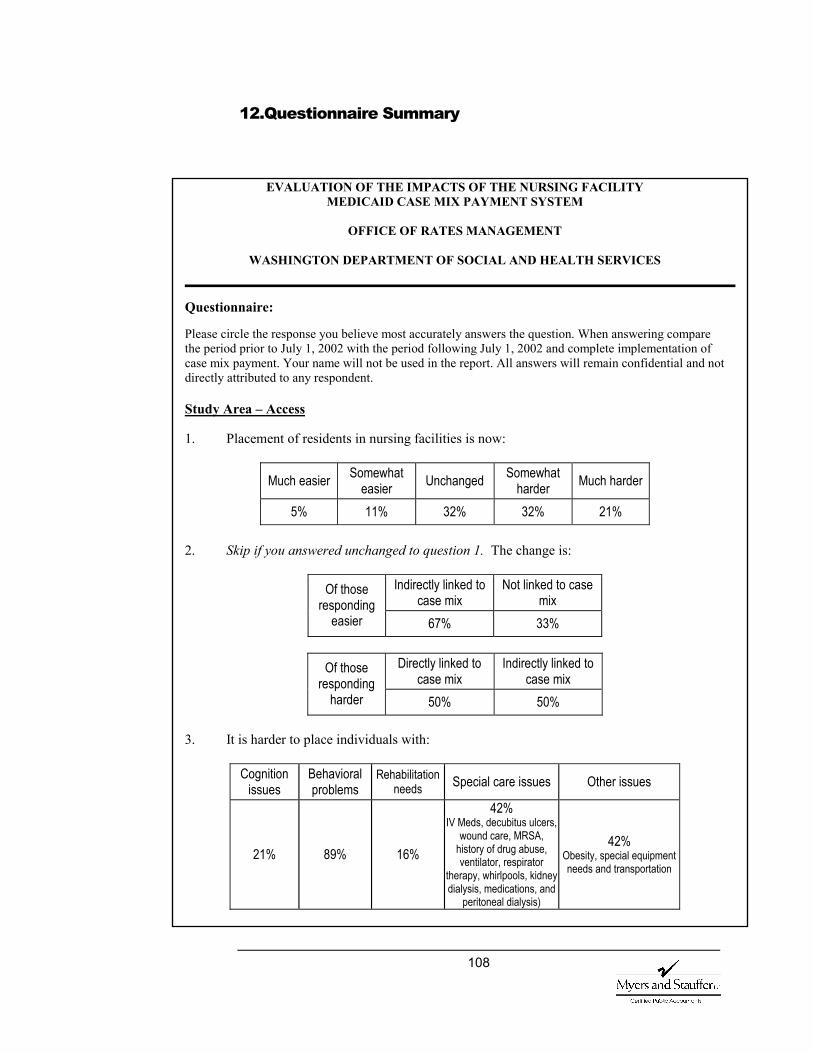
108
12.Questionnaire Summary
EVALUATION OF THE IMPACTS OF THE NURSING FACILITY MEDICAID CASE MIX PAYMENT SYSTEM
OFFICE OF RATES MANAGEMENT
WASHINGTON DEPARTMENT OF SOCIAL AND HEALTH SERVICES
Questionnaire: Please circle the response you believe most accurately answers the question. When answering compare the period prior to July 1, 2002 with the period following July 1, 2002 and complete implementation of case mix payment. Your name will not be used in the report. All answers will remain confidential and not directly attributed to any respondent. Study Area – Access 1. Placement of residents in nursing facilities is now:
Much easier Somewhat easier Unchanged Somewhat
harder Much harder
5% 11% 32% 32% 21% 2. Skip if you answered unchanged to question 1. The change is:
Indirectly linked to case mix
Not linked to case mix
Of those responding
easier 67% 33%
Directly linked to case mix
Indirectly linked to case mix
Of those responding
harder 50% 50% 3. It is harder to place individuals with:
Cognition issues
Behavioral problems
Rehabilitation needs Special care issues Other issues
21% 89% 16%
42% IV Meds, decubitus ulcers,
wound care, MRSA, history of drug abuse, ventilator, respirator
therapy, whirlpools, kidney dialysis, medications, and
peritoneal dialysis)
42% Obesity, special equipment needs and transportation
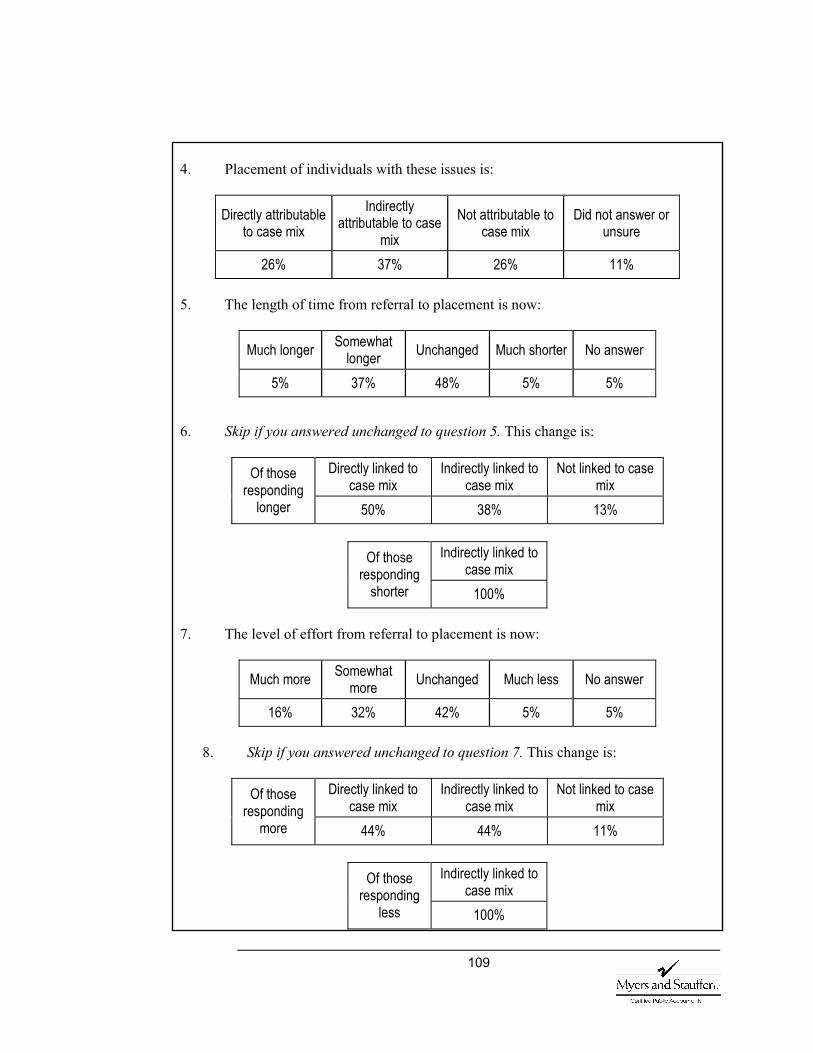
109
4. Placement of individuals with these issues is:
Directly attributable to case mix
Indirectly attributable to case
mix Not attributable to
case mix Did not answer or
unsure
26% 37% 26% 11% 5. The length of time from referral to placement is now:
Much longer Somewhat longer Unchanged Much shorter No answer
5% 37% 48% 5% 5% 6. Skip if you answered unchanged to question 5. This change is:
Directly linked to case mix
Indirectly linked to case mix
Not linked to case mix
Of those responding
longer 50% 38% 13%
Indirectly linked to case mix
Of those responding
shorter 100% 7. The level of effort from referral to placement is now:
Much more Somewhat more Unchanged Much less No answer
16% 32% 42% 5% 5%
8. Skip if you answered unchanged to question 7. This change is:
Directly linked to case mix
Indirectly linked to case mix
Not linked to case mix
Of those responding
more 44% 44% 11%
Indirectly linked to case mix
Of those responding
less 100%
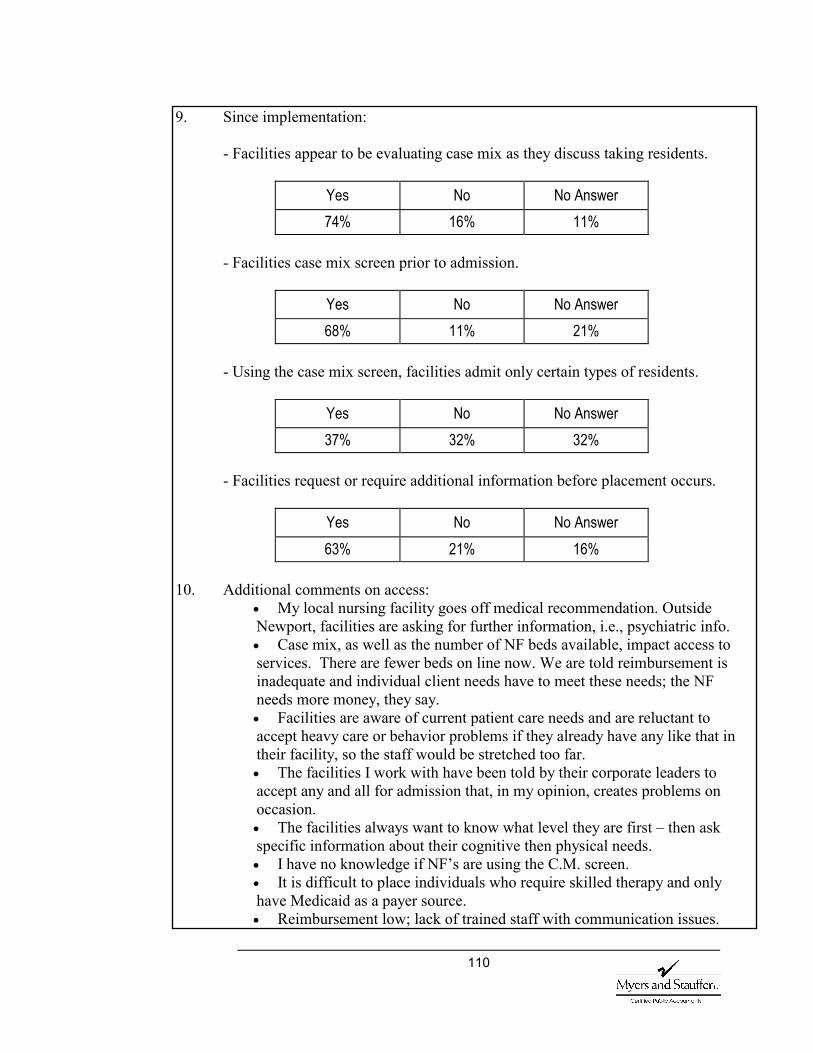
110
9. Since implementation:
- Facilities appear to be evaluating case mix as they discuss taking residents.
Yes No No Answer 74% 16% 11%
- Facilities case mix screen prior to admission.
Yes No No Answer 68% 11% 21%
- Using the case mix screen, facilities admit only certain types of residents.
Yes No No Answer 37% 32% 32%
- Facilities request or require additional information before placement occurs.
Yes No No Answer 63% 21% 16%
10. Additional comments on access:
• My local nursing facility goes off medical recommendation. Outside Newport, facilities are asking for further information, i.e., psychiatric info. • Case mix, as well as the number of NF beds available, impact access to services. There are fewer beds on line now. We are told reimbursement is inadequate and individual client needs have to meet these needs; the NF needs more money, they say. • Facilities are aware of current patient care needs and are reluctant to accept heavy care or behavior problems if they already have any like that in their facility, so the staff would be stretched too far. • The facilities I work with have been told by their corporate leaders to accept any and all for admission that, in my opinion, creates problems on occasion. • The facilities always want to know what level they are first – then ask specific information about their cognitive then physical needs. • I have no knowledge if NF’s are using the C.M. screen. • It is difficult to place individuals who require skilled therapy and only have Medicaid as a payer source. • Reimbursement low; lack of trained staff with communication issues.
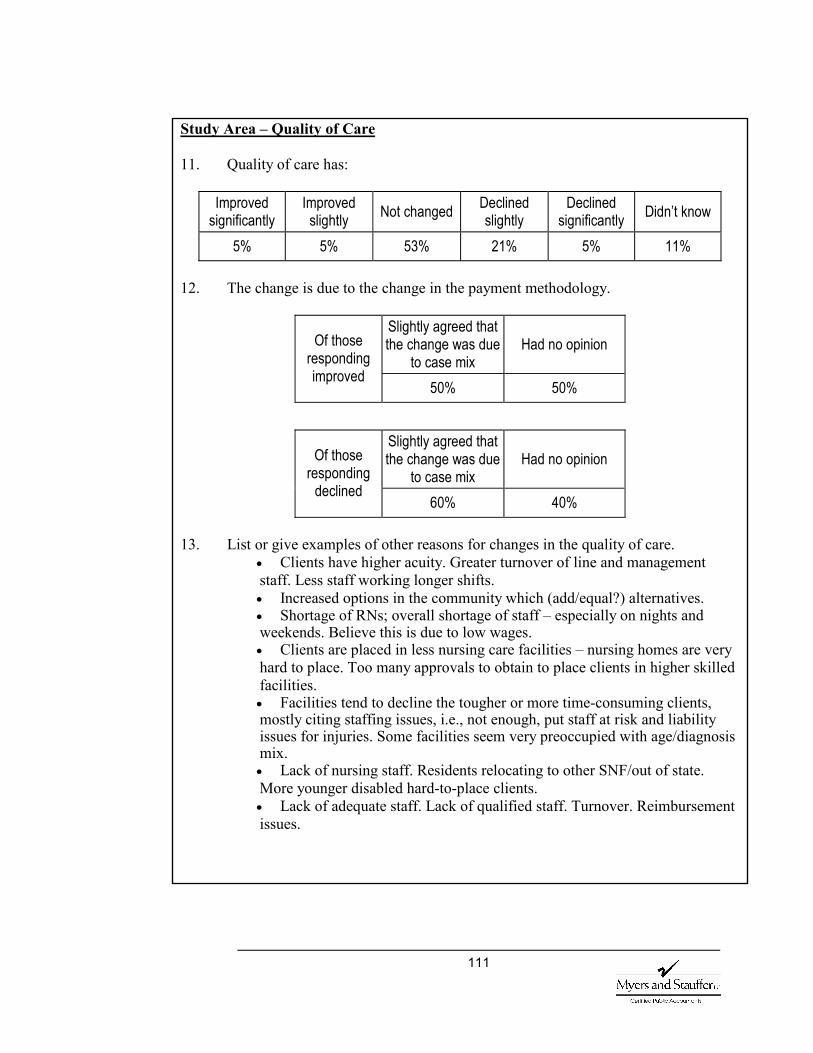
111
Study Area – Quality of Care 11. Quality of care has:
Improved significantly
Improved slightly Not changed Declined
slightly Declined
significantly Didn’t know
5% 5% 53% 21% 5% 11% 12. The change is due to the change in the payment methodology.
Slightly agreed that the change was due
to case mix Had no opinion Of those
responding improved
50% 50%
Slightly agreed that the change was due
to case mix Had no opinion Of those
responding declined
60% 40% 13. List or give examples of other reasons for changes in the quality of care.
• Clients have higher acuity. Greater turnover of line and management staff. Less staff working longer shifts. • Increased options in the community which (add/equal?) alternatives. • Shortage of RNs; overall shortage of staff – especially on nights and weekends. Believe this is due to low wages. • Clients are placed in less nursing care facilities – nursing homes are very hard to place. Too many approvals to obtain to place clients in higher skilled facilities. • Facilities tend to decline the tougher or more time-consuming clients, mostly citing staffing issues, i.e., not enough, put staff at risk and liability issues for injuries. Some facilities seem very preoccupied with age/diagnosis mix. • Lack of nursing staff. Residents relocating to other SNF/out of state. More younger disabled hard-to-place clients. • Lack of adequate staff. Lack of qualified staff. Turnover. Reimbursement issues.
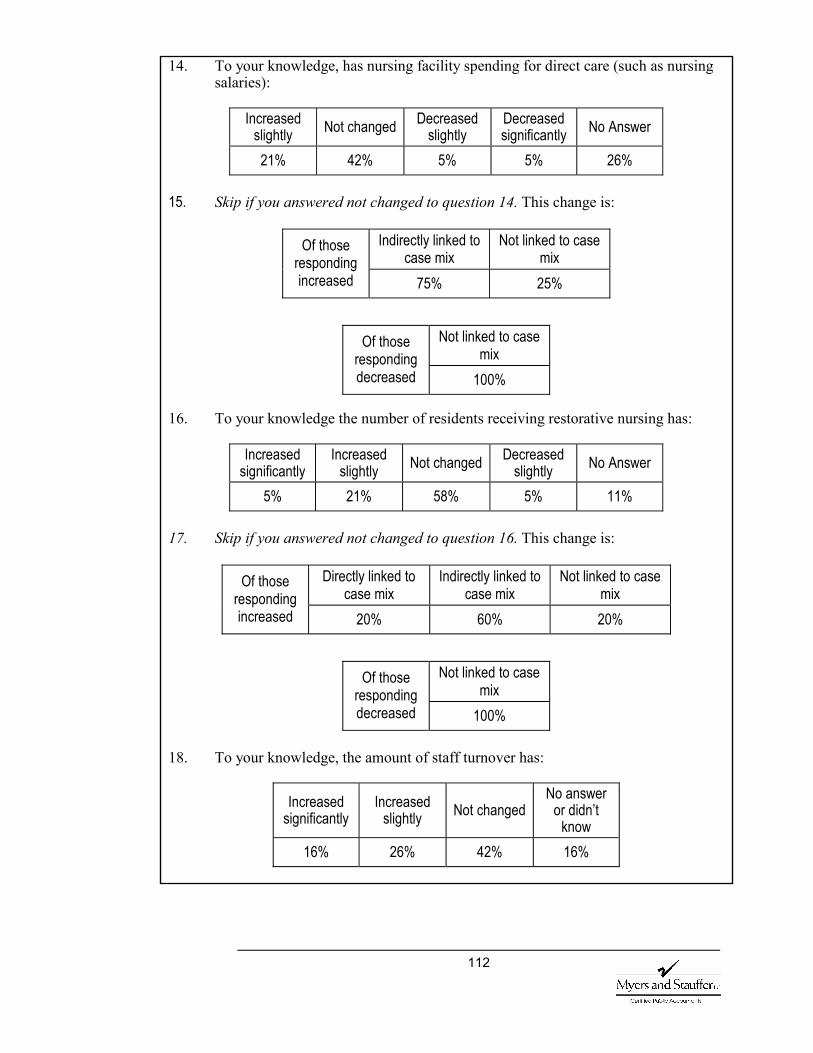
112
14. To your knowledge, has nursing facility spending for direct care (such as nursing salaries):
Increased
slightly Not changed Decreased slightly
Decreased significantly No Answer
21% 42% 5% 5% 26% 15. Skip if you answered not changed to question 14. This change is:
Indirectly linked to
case mix Not linked to case
mix Of those
responding increased 75% 25%
Not linked to case mix
Of those responding decreased 100%
16. To your knowledge the number of residents receiving restorative nursing has:
Increased significantly
Increased slightly Not changed Decreased
slightly No Answer
5% 21% 58% 5% 11% 17. Skip if you answered not changed to question 16. This change is:
Directly linked to case mix
Indirectly linked to case mix
Not linked to case mix
Of those responding increased 20% 60% 20%
Not linked to case mix
Of those responding decreased 100%
18. To your knowledge, the amount of staff turnover has:
Increased significantly
Increased slightly Not changed
No answer or didn’t
know 16% 26% 42% 16%
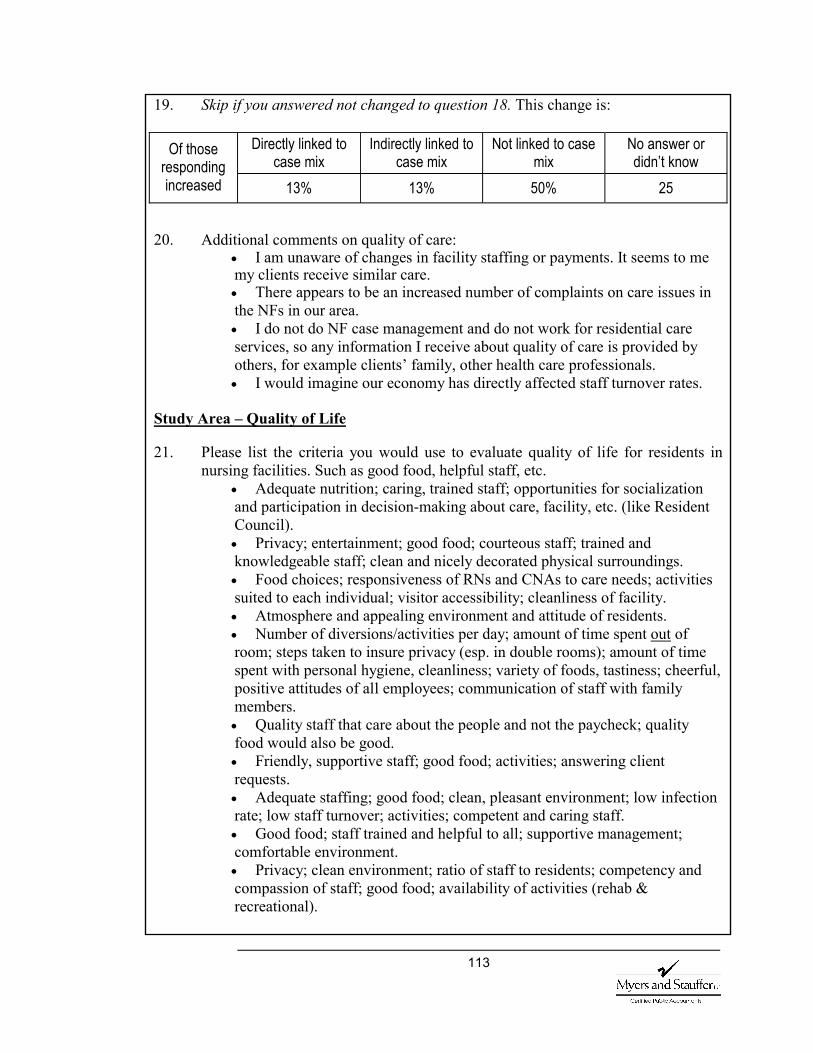
113
19. Skip if you answered not changed to question 18. This change is:
Directly linked to case mix
Indirectly linked to case mix
Not linked to case mix
No answer or didn’t know
Of those responding increased 13% 13% 50% 25
20. Additional comments on quality of care:
• I am unaware of changes in facility staffing or payments. It seems to me my clients receive similar care. • There appears to be an increased number of complaints on care issues in the NFs in our area. • I do not do NF case management and do not work for residential care services, so any information I receive about quality of care is provided by others, for example clients’ family, other health care professionals. • I would imagine our economy has directly affected staff turnover rates.
Study Area – Quality of Life 21. Please list the criteria you would use to evaluate quality of life for residents in
nursing facilities. Such as good food, helpful staff, etc. • Adequate nutrition; caring, trained staff; opportunities for socialization and participation in decision-making about care, facility, etc. (like Resident Council). • Privacy; entertainment; good food; courteous staff; trained and knowledgeable staff; clean and nicely decorated physical surroundings. • Food choices; responsiveness of RNs and CNAs to care needs; activities suited to each individual; visitor accessibility; cleanliness of facility. • Atmosphere and appealing environment and attitude of residents. • Number of diversions/activities per day; amount of time spent out of room; steps taken to insure privacy (esp. in double rooms); amount of time spent with personal hygiene, cleanliness; variety of foods, tastiness; cheerful, positive attitudes of all employees; communication of staff with family members. • Quality staff that care about the people and not the paycheck; quality food would also be good. • Friendly, supportive staff; good food; activities; answering client requests. • Adequate staffing; good food; clean, pleasant environment; low infection rate; low staff turnover; activities; competent and caring staff. • Good food; staff trained and helpful to all; supportive management; comfortable environment. • Privacy; clean environment; ratio of staff to residents; competency and compassion of staff; good food; availability of activities (rehab & recreational).
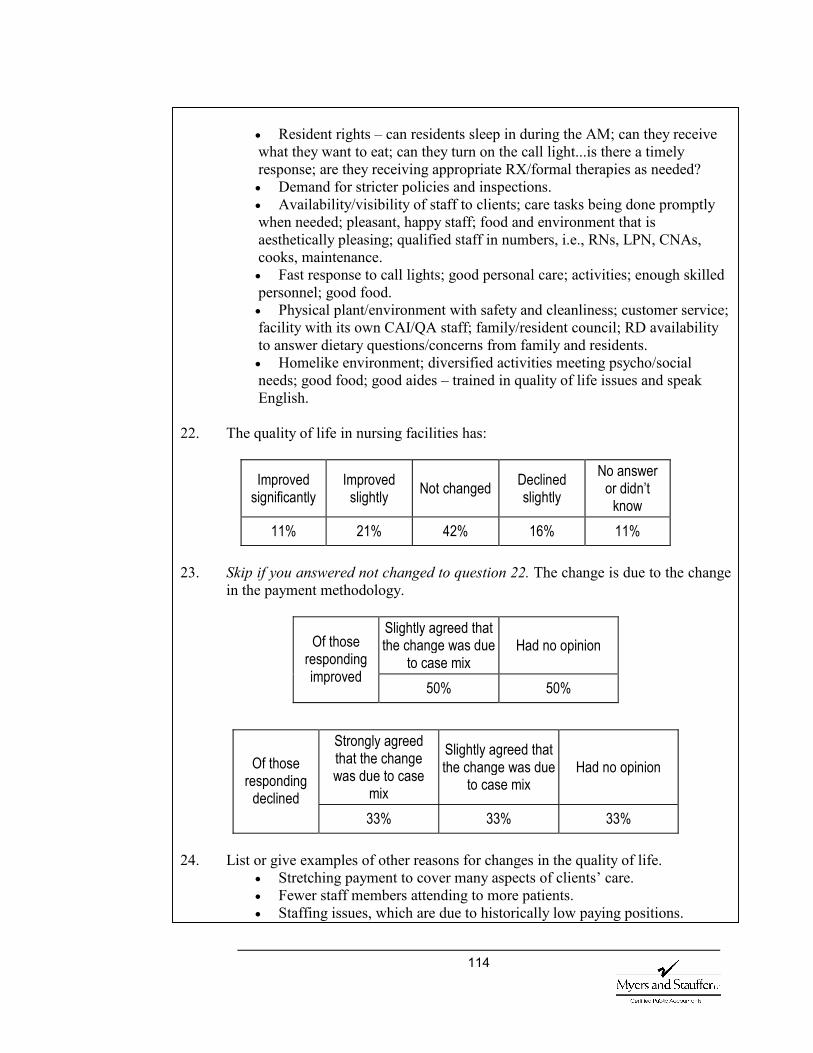
114
• Resident rights – can residents sleep in during the AM; can they receive what they want to eat; can they turn on the call light...is there a timely response; are they receiving appropriate RX/formal therapies as needed? • Demand for stricter policies and inspections. • Availability/visibility of staff to clients; care tasks being done promptly when needed; pleasant, happy staff; food and environment that is aesthetically pleasing; qualified staff in numbers, i.e., RNs, LPN, CNAs, cooks, maintenance. • Fast response to call lights; good personal care; activities; enough skilled personnel; good food. • Physical plant/environment with safety and cleanliness; customer service; facility with its own CAI/QA staff; family/resident council; RD availability to answer dietary questions/concerns from family and residents. • Homelike environment; diversified activities meeting psycho/social needs; good food; good aides – trained in quality of life issues and speak English.
22. The quality of life in nursing facilities has:
Improved significantly
Improved slightly Not changed Declined
slightly No answer
or didn’t know
11% 21% 42% 16% 11% 23. Skip if you answered not changed to question 22. The change is due to the change
in the payment methodology.
Slightly agreed that the change was due
to case mix Had no opinion Of those
responding improved
50% 50%
Strongly agreed that the change was due to case
mix
Slightly agreed that the change was due
to case mix Had no opinion Of those
responding declined
33% 33% 33% 24. List or give examples of other reasons for changes in the quality of life.
• Stretching payment to cover many aspects of clients’ care. • Fewer staff members attending to more patients. • Staffing issues, which are due to historically low paying positions.
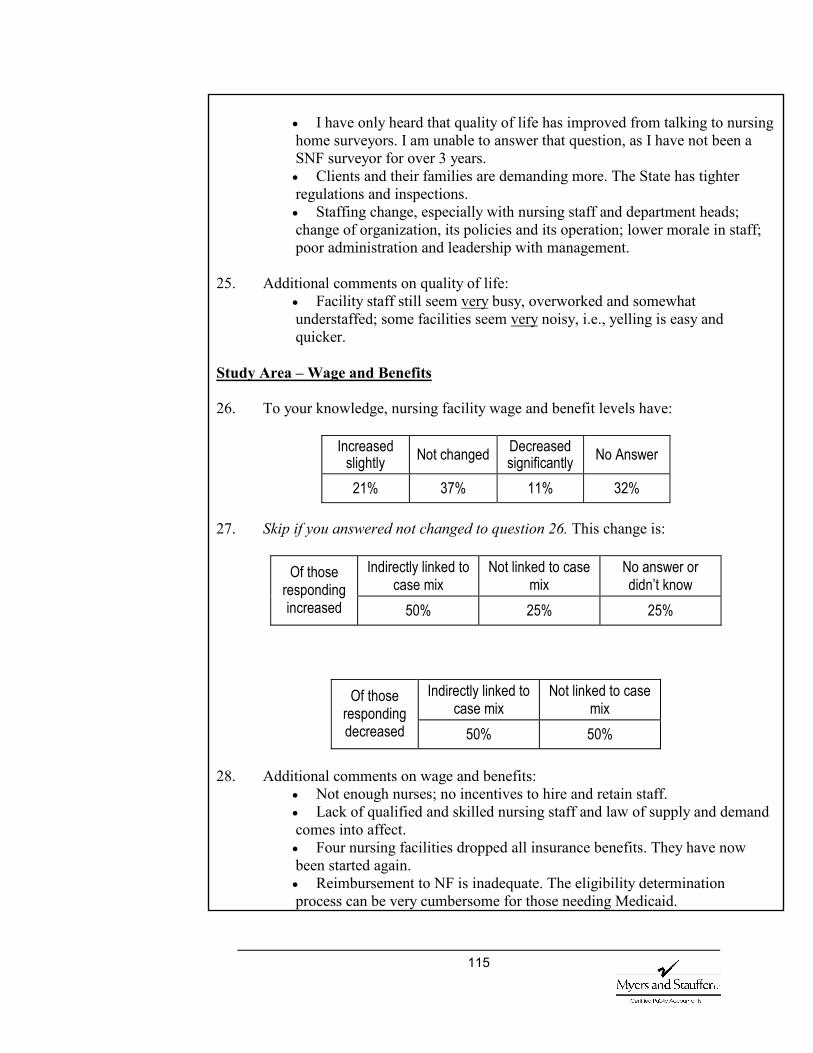
115
• I have only heard that quality of life has improved from talking to nursing home surveyors. I am unable to answer that question, as I have not been a SNF surveyor for over 3 years. • Clients and their families are demanding more. The State has tighter regulations and inspections. • Staffing change, especially with nursing staff and department heads; change of organization, its policies and its operation; lower morale in staff; poor administration and leadership with management.
25. Additional comments on quality of life:
• Facility staff still seem very busy, overworked and somewhat understaffed; some facilities seem very noisy, i.e., yelling is easy and quicker.
Study Area – Wage and Benefits 26. To your knowledge, nursing facility wage and benefit levels have:
Increased slightly Not changed Decreased
significantly No Answer
21% 37% 11% 32% 27. Skip if you answered not changed to question 26. This change is:
Indirectly linked to case mix
Not linked to case mix
No answer or didn’t know
Of those responding increased 50% 25% 25%
Indirectly linked to case mix
Not linked to case mix
Of those responding decreased 50% 50%
28. Additional comments on wage and benefits:
• Not enough nurses; no incentives to hire and retain staff. • Lack of qualified and skilled nursing staff and law of supply and demand comes into affect. • Four nursing facilities dropped all insurance benefits. They have now been started again. • Reimbursement to NF is inadequate. The eligibility determination process can be very cumbersome for those needing Medicaid.
116
• Continues to be a nursing shortage. Most NFs do not offer sign-on or retention bonuses. • Budget crunch – big corporations policy to fill in the beds – quantity vs. quality of care, which results in downsizing of staff.
Thank you very much for your time. Please fax your completed questionnaire to: Kathy Wade Myers and Stauffer LC 785 228-6701
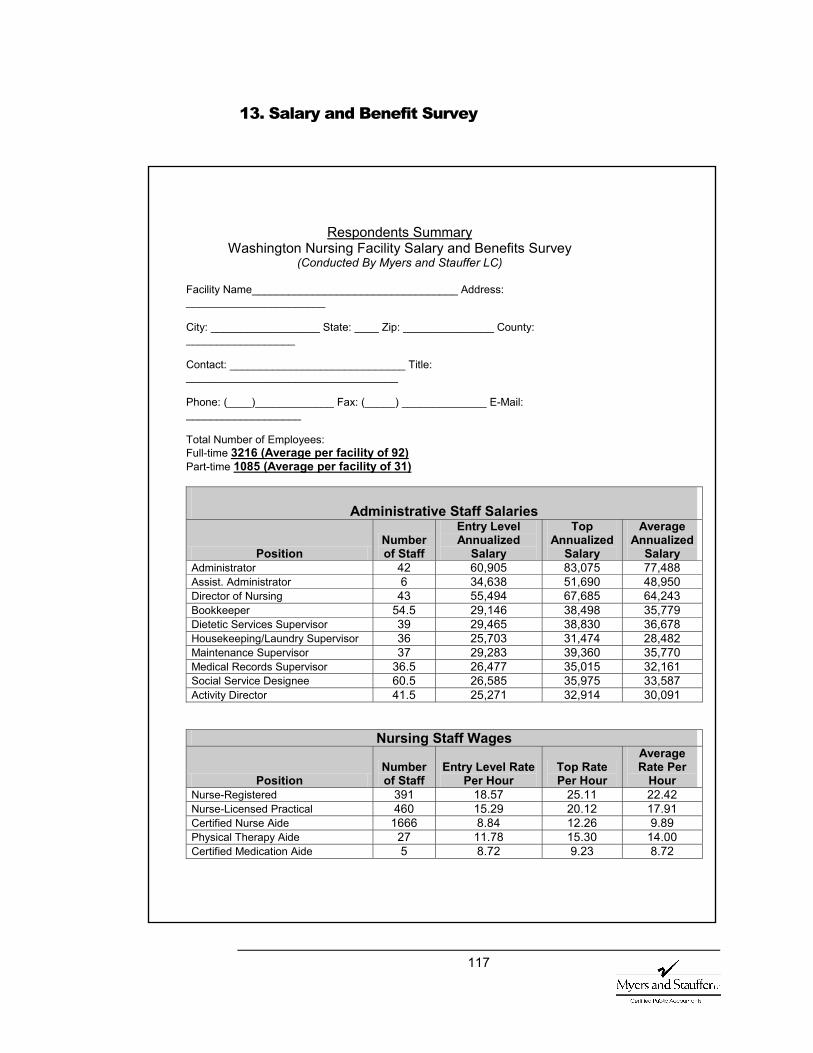
117
13. Salary and Benefit Survey
Respondents Summary Washington Nursing Facility Salary and Benefits Survey
(Conducted By Myers and Stauffer LC)
Facility Name__________________________________ Address: _______________________ City: __________________ State: ____ Zip: _______________ County: __________________ Contact: _____________________________ Title: ___________________________________ Phone: (____)_____________ Fax: (_____) ______________ E-Mail: ___________________ Total Number of Employees: Full-time 3216 (Average per facility of 92) Part-time 1085 (Average per facility of 31)
Administrative Staff Salaries
Position Number of Staff
Entry Level Annualized
Salary
Top Annualized
Salary
Average Annualized
Salary Administrator 42 60,905 83,075 77,488 Assist. Administrator 6 34,638 51,690 48,950 Director of Nursing 43 55,494 67,685 64,243 Bookkeeper 54.5 29,146 38,498 35,779 Dietetic Services Supervisor 39 29,465 38,830 36,678 Housekeeping/Laundry Supervisor 36 25,703 31,474 28,482 Maintenance Supervisor 37 29,283 39,360 35,770 Medical Records Supervisor 36.5 26,477 35,015 32,161 Social Service Designee 60.5 26,585 35,975 33,587 Activity Director 41.5 25,271 32,914 30,091
Nursing Staff Wages
Position Number of Staff
Entry Level Rate Per Hour
Top Rate Per Hour
Average Rate Per
Hour Nurse-Registered 391 18.57 25.11 22.42 Nurse-Licensed Practical 460 15.29 20.12 17.91 Certified Nurse Aide 1666 8.84 12.26 9.89 Physical Therapy Aide 27 11.78 15.30 14.00 Certified Medication Aide 5 8.72 9.23 8.72
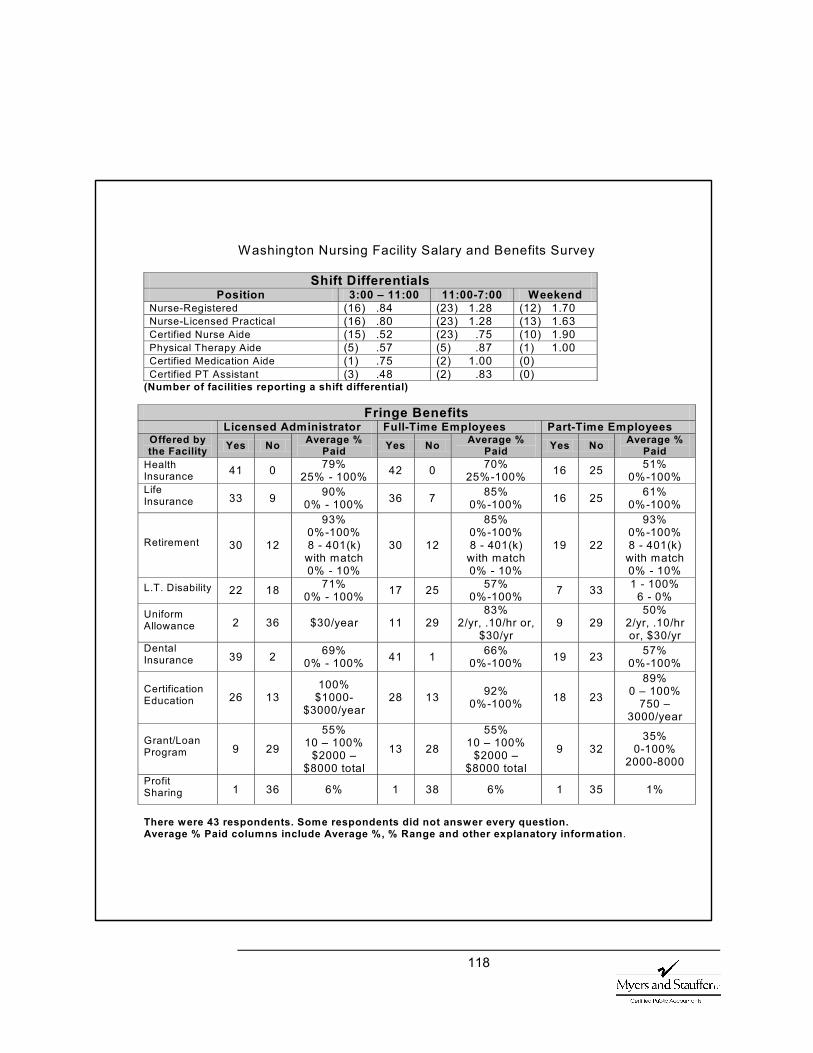
118
Washington Nursing Facility Salary and Benefits Survey
Shift Differentials Position 3:00 – 11:00 11:00-7:00 Weekend
Nurse-Registered (16) .84 (23) 1.28 (12) 1.70 Nurse-Licensed Practical (16) .80 (23) 1.28 (13) 1.63 Certified Nurse Aide (15) .52 (23) .75 (10) 1.90 Physical Therapy Aide (5) .57 (5) .87 (1) 1.00 Certified Medication Aide (1) .75 (2) 1.00 (0) Certified PT Assistant (3) .48 (2) .83 (0)
(Number of facilities reporting a shift differential)
Fringe Benefits Licensed Administrator Full-Time Employees Part-Time Employees Offered by the Facility Yes No Average %
Paid Yes No Average % Paid Yes No Average %
Paid Health Insurance 41 0 79%
25% - 100% 42 0 70% 25%-100% 16 25 51%
0%-100% Life Insurance 33 9 90%
0% - 100% 36 7 85% 0%-100% 16 25 61%
0%-100%
Retirement 30 12
93% 0%-100% 8 - 401(k)
with match 0% - 10%
30 12
85% 0%-100% 8 - 401(k)
with match 0% - 10%
19 22
93% 0%-100% 8 - 401(k) with match 0% - 10%
L.T. Disability 22 18 71% 0% - 100% 17 25 57%
0%-100% 7 33 1 - 100% 6 - 0%
Uniform Allowance 2 36 $30/year 11 29
83% 2/yr, .10/hr or,
$30/yr 9 29
50% 2/yr, .10/hr or, $30/yr
Dental Insurance 39 2 69%
0% - 100% 41 1 66% 0%-100% 19 23 57%
0%-100%
Certification Education 26 13
100% $1000-
$3000/year 28 13 92%
0%-100% 18 23
89% 0 – 100%
750 – 3000/year
Grant/Loan Program 9 29
55% 10 – 100%
$2000 – $8000 total
13 28
55% 10 – 100%
$2000 – $8000 total
9 32 35%
0-100% 2000-8000
Profit Sharing 1 36 6% 1 38 6% 1 35 1%
There were 43 respondents. Some respondents did not answer every question. Average % Paid columns include Average %, % Range and other explanatory information.
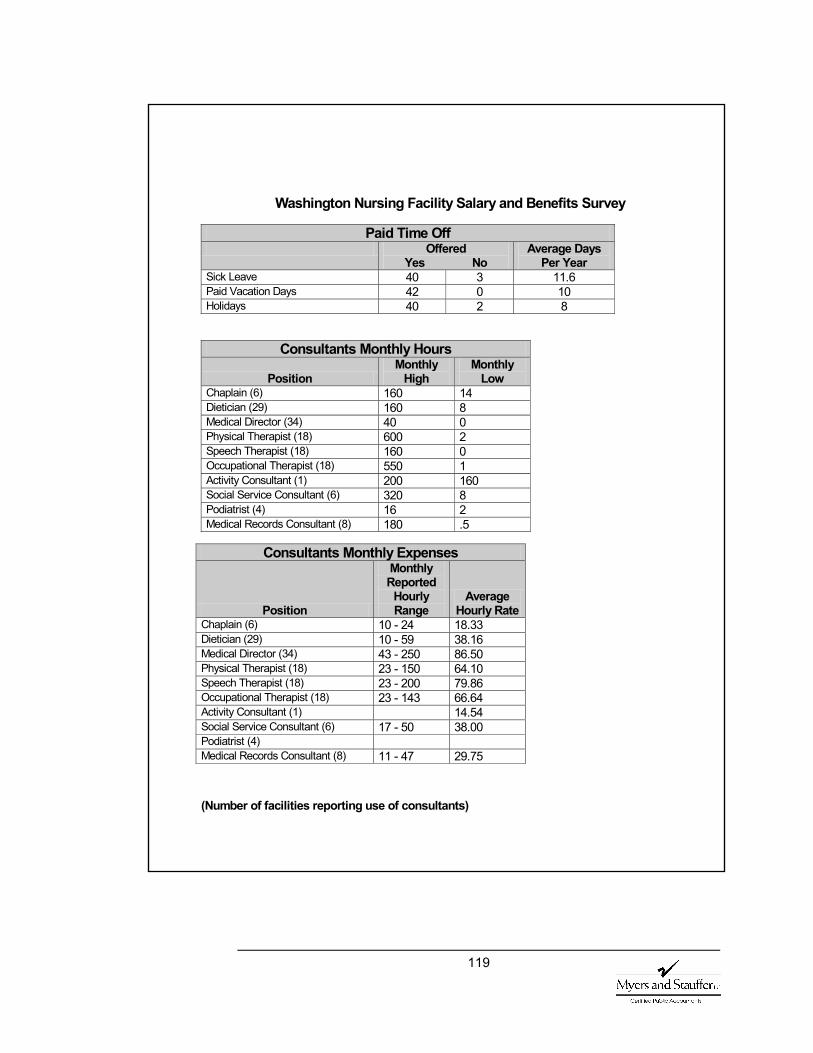
119
Washington Nursing Facility Salary and Benefits Survey
Paid Time Off Offered
Yes No Average Days
Per Year Sick Leave 40 3 11.6 Paid Vacation Days 42 0 10 Holidays 40 2 8
Consultants Monthly Hours
Position Monthly
High Monthly
Low Chaplain (6) 160 14 Dietician (29) 160 8 Medical Director (34) 40 0 Physical Therapist (18) 600 2 Speech Therapist (18) 160 0 Occupational Therapist (18) 550 1 Activity Consultant (1) 200 160 Social Service Consultant (6) 320 8 Podiatrist (4) 16 2 Medical Records Consultant (8) 180 .5
(Number of facilities reporting use of consultants)
Consultants Monthly Expenses
Position
Monthly Reported
Hourly Range
Average Hourly Rate
Chaplain (6) 10 - 24 18.33 Dietician (29) 10 - 59 38.16 Medical Director (34) 43 - 250 86.50 Physical Therapist (18) 23 - 150 64.10 Speech Therapist (18) 23 - 200 79.86 Occupational Therapist (18) 23 - 143 66.64 Activity Consultant (1) 14.54 Social Service Consultant (6) 17 - 50 38.00 Podiatrist (4) Medical Records Consultant (8) 11 - 47 29.75
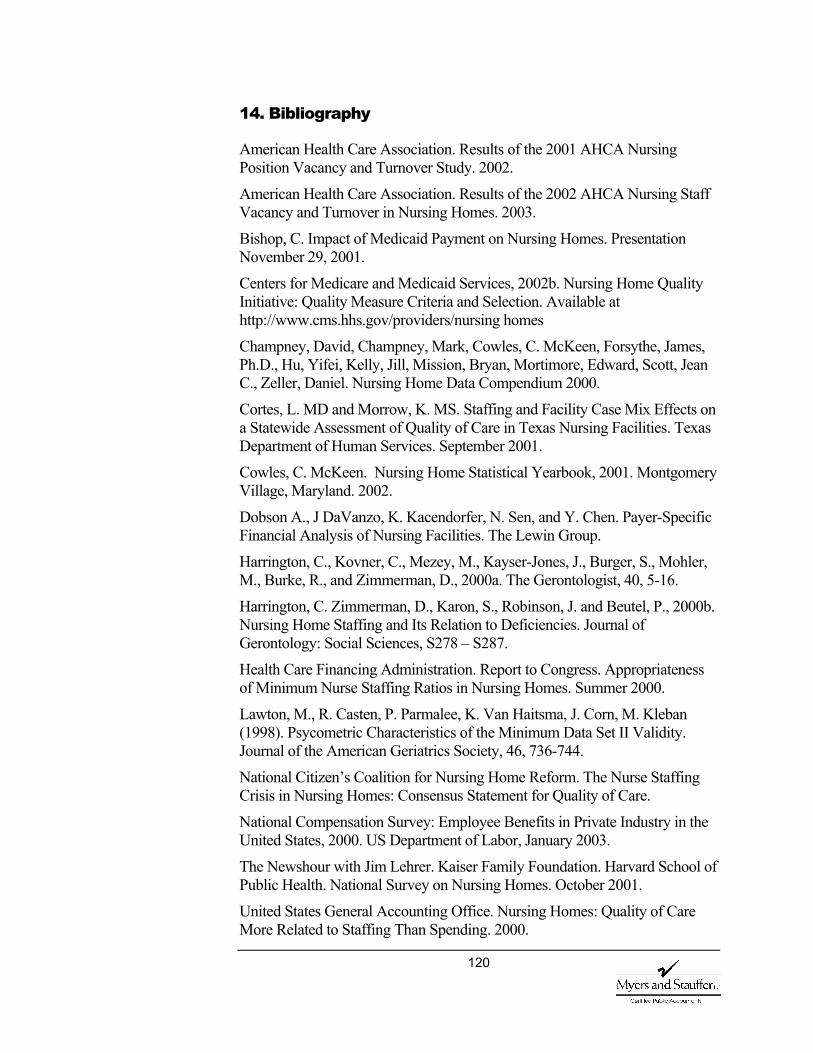
120
14. Bibliography
American Health Care Association. Results of the 2001 AHCA Nursing Position Vacancy and Turnover Study. 2002.
American Health Care Association. Results of the 2002 AHCA Nursing Staff Vacancy and Turnover in Nursing Homes. 2003.
Bishop, C. Impact of Medicaid Payment on Nursing Homes. Presentation November 29, 2001.
Centers for Medicare and Medicaid Services, 2002b. Nursing Home Quality Initiative: Quality Measure Criteria and Selection. Available at http://www.cms.hhs.gov/providers/nursing homes
Champney, David, Champney, Mark, Cowles, C. McKeen, Forsythe, James, Ph.D., Hu, Yifei, Kelly, Jill, Mission, Bryan, Mortimore, Edward, Scott, Jean C., Zeller, Daniel. Nursing Home Data Compendium 2000.
Cortes, L. MD and Morrow, K. MS. Staffing and Facility Case Mix Effects on a Statewide Assessment of Quality of Care in Texas Nursing Facilities. Texas Department of Human Services. September 2001.
Cowles, C. McKeen. Nursing Home Statistical Yearbook, 2001. Montgomery Village, Maryland. 2002.
Dobson A., J DaVanzo, K. Kacendorfer, N. Sen, and Y. Chen. Payer-Specific Financial Analysis of Nursing Facilities. The Lewin Group.
Harrington, C., Kovner, C., Mezey, M., Kayser-Jones, J., Burger, S., Mohler, M., Burke, R., and Zimmerman, D., 2000a. The Gerontologist, 40, 5-16.
Harrington, C. Zimmerman, D., Karon, S., Robinson, J. and Beutel, P., 2000b. Nursing Home Staffing and Its Relation to Deficiencies. Journal of Gerontology: Social Sciences, S278 – S287.
Health Care Financing Administration. Report to Congress. Appropriateness of Minimum Nurse Staffing Ratios in Nursing Homes. Summer 2000.
Lawton, M., R. Casten, P. Parmalee, K. Van Haitsma, J. Corn, M. Kleban (1998). Psycometric Characteristics of the Minimum Data Set II Validity. Journal of the American Geriatrics Society, 46, 736-744.
National Citizen’s Coalition for Nursing Home Reform. The Nurse Staffing Crisis in Nursing Homes: Consensus Statement for Quality of Care.
National Compensation Survey: Employee Benefits in Private Industry in the United States, 2000. US Department of Labor, January 2003.
The Newshour with Jim Lehrer. Kaiser Family Foundation. Harvard School of Public Health. National Survey on Nursing Homes. October 2001.
United States General Accounting Office. Nursing Homes: Quality of Care More Related to Staffing Than Spending. 2000.
121
United States General Accounting Office. Report to Congressional Requesters. Nursing Home Quality Prevalence of Serious Problems, While Declining, Reinforces Importance of Enhanced Oversight, July 2003.
United States General Accounting Office. Report to Congressional Requesters. Nursing Homes Sustained Efforts Are Essential to Realize Potential of the Quality Initiatives. September 2000.
Wiener, Joshua M., David G. Stevenson, Susan M. Goldenson, December 1, 1998. Controlling the Supply of Long-Term Care Providers at the State Level.