Embed Size (px)
Citation preview
AIS2017© Copyright 2017 NCCI Holdings, Inc. All Rights Reserved.
MEDICAL COST TRENDSTHEN AND NOW
BARRY LIPTON, FCAS, MAAAPRACTICE LEADER AND SENIOR ACTUARYNCCI
© Copyright 2017 NCCI Holdings, Inc. All Rights Reserved.
AIS2017
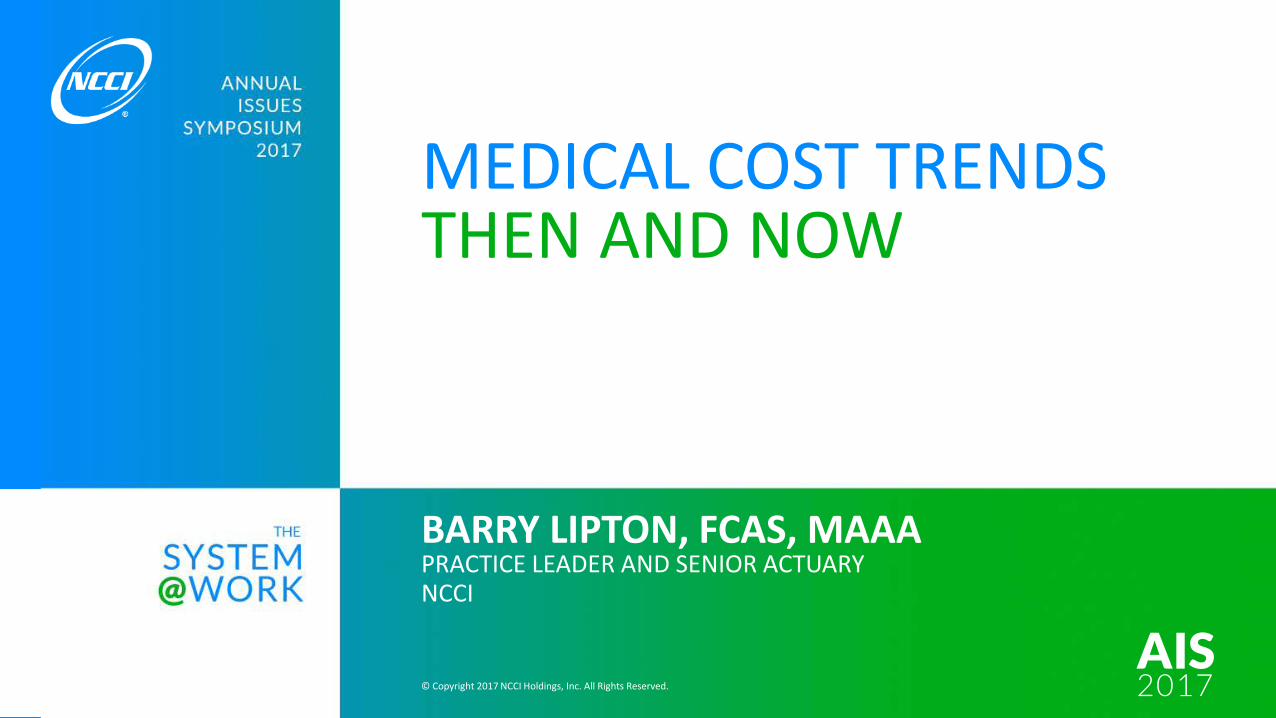
WC Average Medical Cost per Lost-Time ClaimPrivate Carriers and State Funds—NCCI States
p Preliminary based on data valued as of 12/31/2016Source: Severity: NCCI Financial Call data, developed to ultimate, excludes high‐deductible policies; 1995–2015: Based on data through 12/31/2015Includes all states where NCCI provides ratemaking services; WV is excluded through 2007
$8.9
$27.7
$29.1
+5.1% +7.4%+10.1% +8.3%
+10.6% +7.3%+13.5%
+8.8%+7.7%
+5.4%+7.8%
+5.8%+5.9%
+7.0%+4.4% +0.2% +2.4% +1.1% +1.8%
+4.0% -1.4%+5.0%
95 96 97 98 99 00 01 02 03 04 05 06 07 08 09 10 11 12 13 14 15 16p
Accident Year
$ Thousands
© Copyright 2017 NCCI Holdings, Inc. All Rights Reserved.
AIS2017
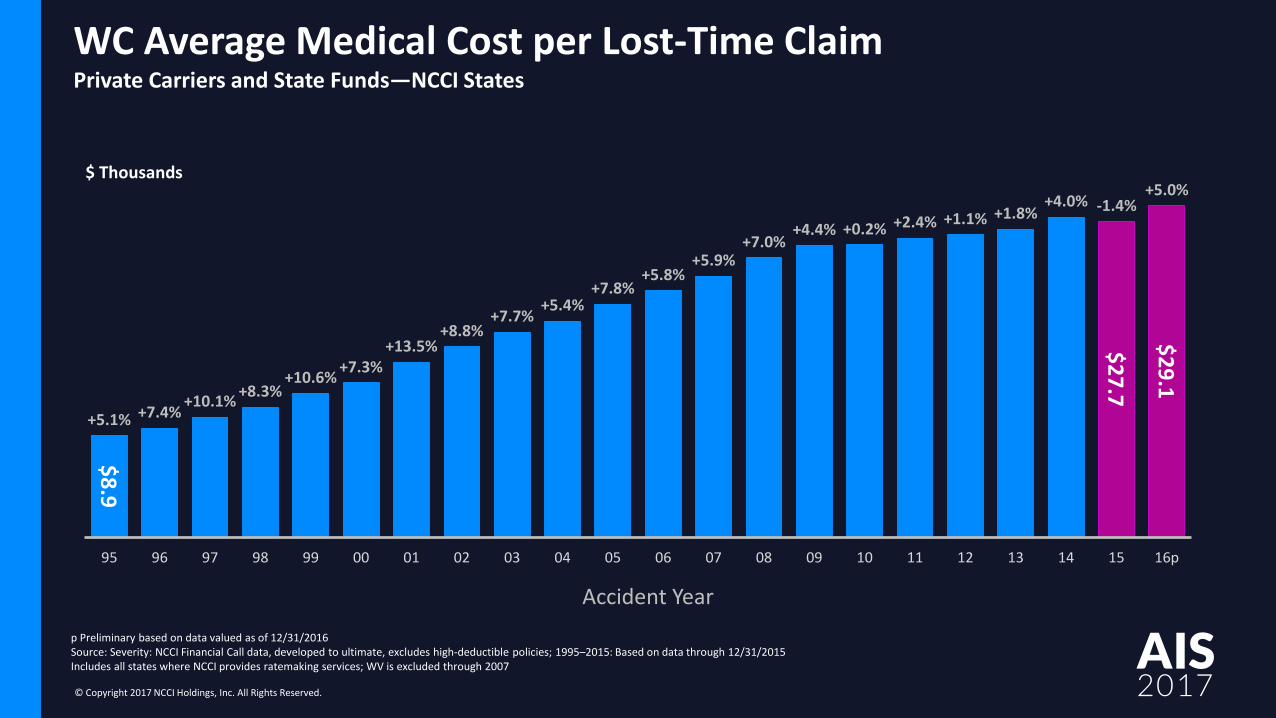
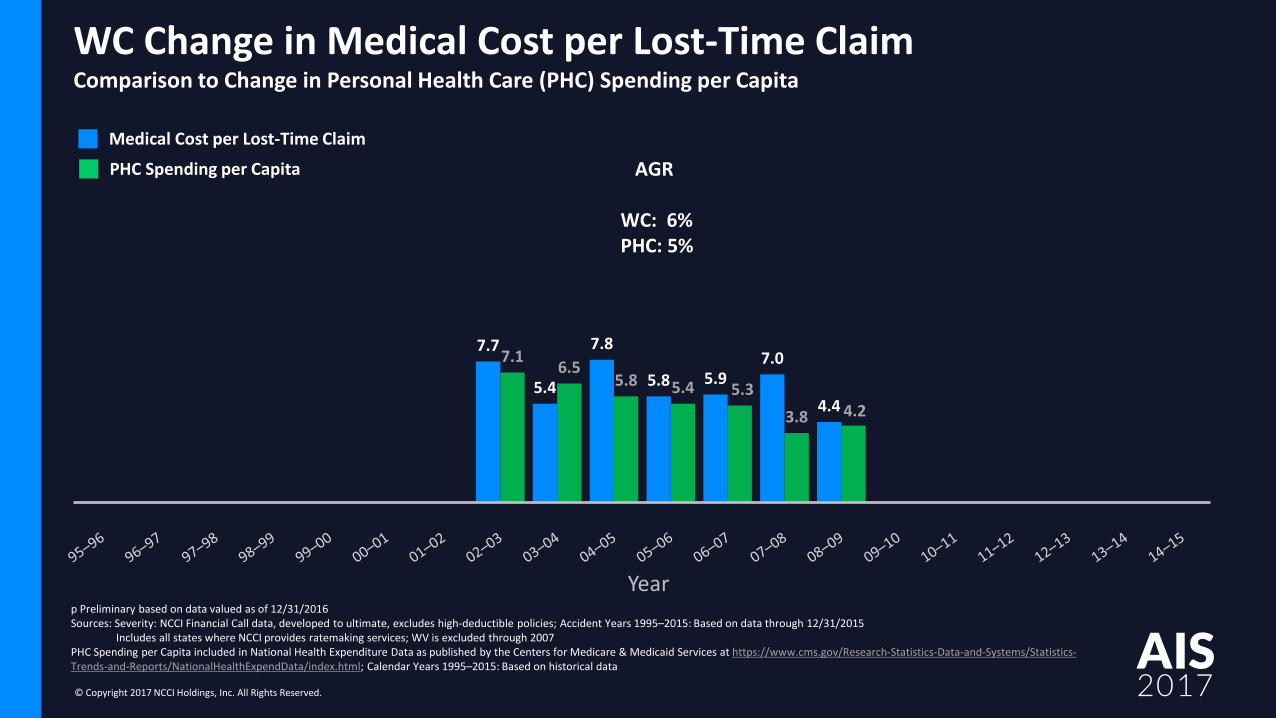
WC Change in Medical Cost per Lost-Time ClaimComparison to Change in Personal Health Care (PHC) Spending per Capita
p Preliminary based on data valued as of 12/31/2016Sources: Severity: NCCI Financial Call data, developed to ultimate, excludes high‐deductible policies; Accident Years 1995–2015: Based on data through 12/31/2015
Includes all states where NCCI provides ratemaking services; WV is excluded through 2007PHC Spending per Capita included in National Health Expenditure Data as published by the Centers for Medicare & Medicaid Services at https://www.cms.gov/Research‐Statistics‐Data‐and‐Systems/Statistics‐Trends‐and‐Reports/NationalHealthExpendData/index.html; Calendar Years 1995–2015: Based on historical data
7.4
10.1
8.3
10.6
7.3
13.5
8.8
4.5 4.6 4.8 4.96.0
7.5 7.4
Year
Annual Growth Rate (AGR)
WC: 9%PHC: 6%
Medical Cost per Lost-Time Claim
PHC Spending per Capita
© Copyright 2017 NCCI Holdings, Inc. All Rights Reserved.
AIS2017
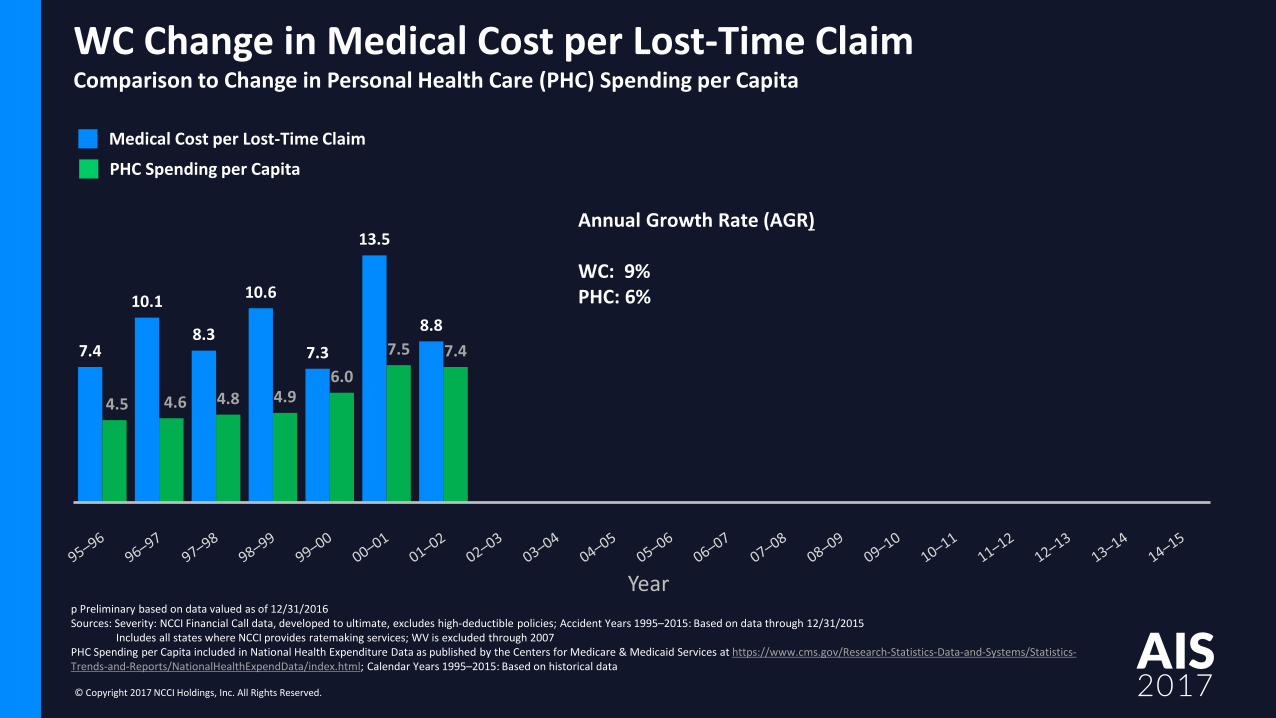
WC Change in Medical Cost per Lost-Time ClaimComparison to Change in Personal Health Care (PHC) Spending per Capita
p Preliminary based on data valued as of 12/31/2016Sources: Severity: NCCI Financial Call data, developed to ultimate, excludes high‐deductible policies; Accident Years 1995–2015: Based on data through 12/31/2015
Includes all states where NCCI provides ratemaking services; WV is excluded through 2007PHC Spending per Capita included in National Health Expenditure Data as published by the Centers for Medicare & Medicaid Services at https://www.cms.gov/Research‐Statistics‐Data‐and‐Systems/Statistics‐Trends‐and‐Reports/NationalHealthExpendData/index.html; Calendar Years 1995–2015: Based on historical data
7.7
5.4
7.8
5.8 5.97.0
4.4
7.1 6.55.8 5.4 5.3
3.8 4.2
Year
AGR
WC: 6%PHC: 5%
Medical Cost per Lost-Time Claim
PHC Spending per Capita
© Copyright 2017 NCCI Holdings, Inc. All Rights Reserved.
AIS2017
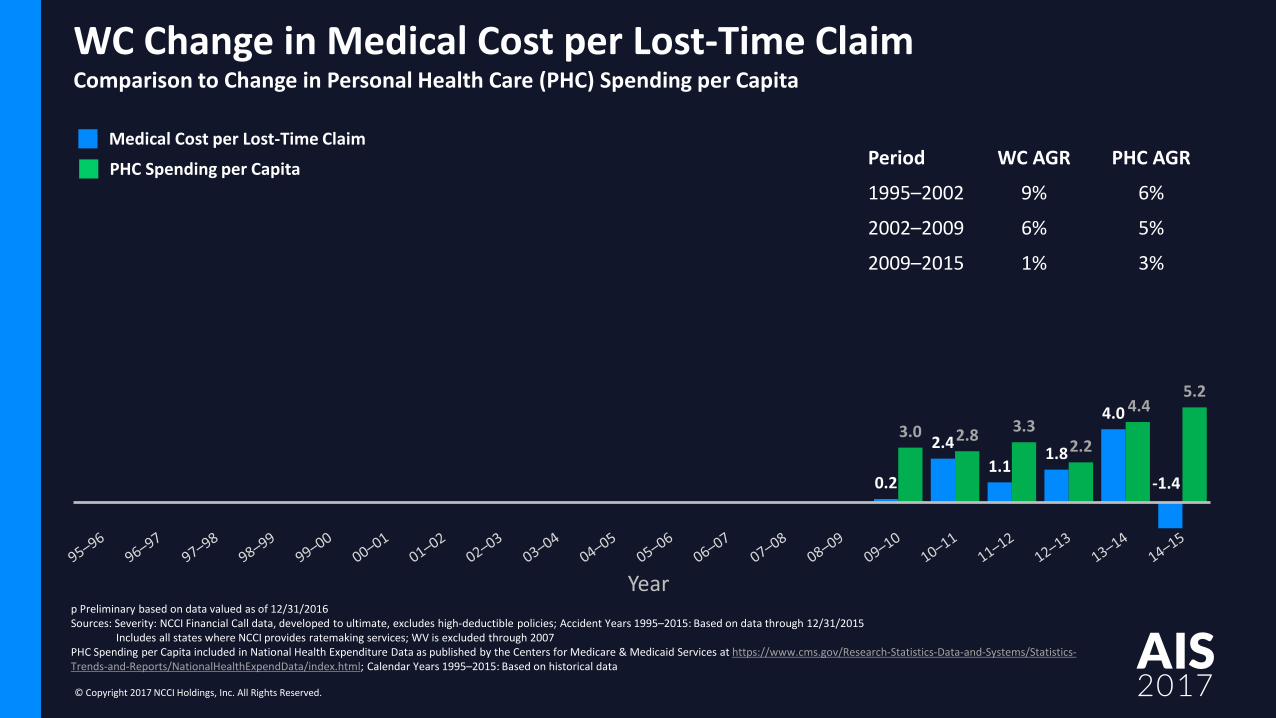
WC Change in Medical Cost per Lost-Time ClaimComparison to Change in Personal Health Care (PHC) Spending per Capita
p Preliminary based on data valued as of 12/31/2016Sources: Severity: NCCI Financial Call data, developed to ultimate, excludes high‐deductible policies; Accident Years 1995–2015: Based on data through 12/31/2015
Includes all states where NCCI provides ratemaking services; WV is excluded through 2007PHC Spending per Capita included in National Health Expenditure Data as published by the Centers for Medicare & Medicaid Services at https://www.cms.gov/Research‐Statistics‐Data‐and‐Systems/Statistics‐Trends‐and‐Reports/NationalHealthExpendData/index.html; Calendar Years 1995–2015: Based on historical data
0.2
2.41.1
1.8
4.0
-1.4
3.0 2.8 3.32.2
4.45.2
Year
Medical Cost per Lost-Time Claim
PHC Spending per Capita Period WC AGR PHC AGR
1995–2002 9% 6%
2002–2009 6% 5%
2009–2015 1% 3%
© Copyright 2017 NCCI Holdings, Inc. All Rights Reserved.
AIS2017
What were the drivers of the AY 2015 decline?
© Copyright 2017 NCCI Holdings, Inc. All Rights Reserved.
AIS2017
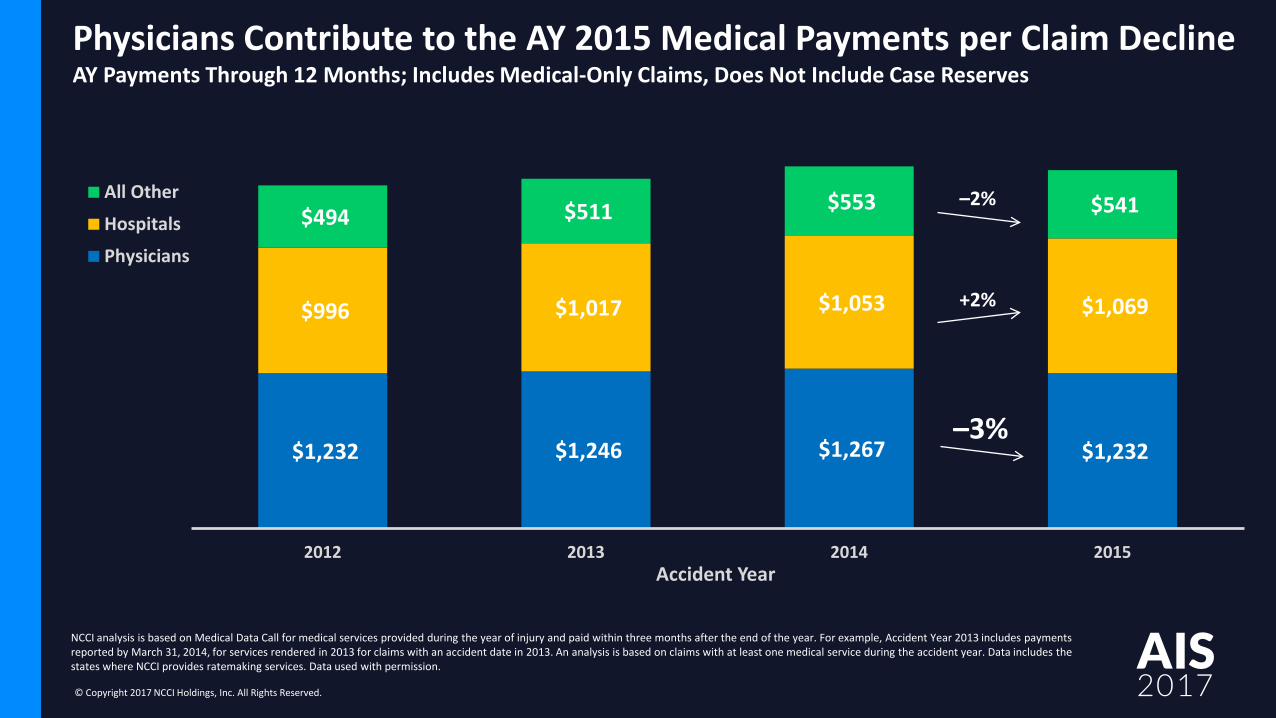
Physicians Contribute to the AY 2015 Medical Payments per Claim DeclineAY Payments Through 12 Months; Includes Medical-Only Claims, Does Not Include Case Reserves
NCCI analysis is based on Medical Data Call for medical services provided during the year of injury and paid within three months after the end of the year. For example, Accident Year 2013 includes payments reported by March 31, 2014, for services rendered in 2013 for claims with an accident date in 2013. An analysis is based on claims with at least one medical service during the accident year. Data includes the states where NCCI provides ratemaking services. Data used with permission.
$1,232 $1,246 $1,267 $1,232
$996 $1,017 $1,053 $1,069
$494 $511 $553 $541
2012 2013 2014 2015Accident Year
All Other
Hospitals
Physicians
–2%
+2%
–3%
© Copyright 2017 NCCI Holdings, Inc. All Rights Reserved.
AIS2017
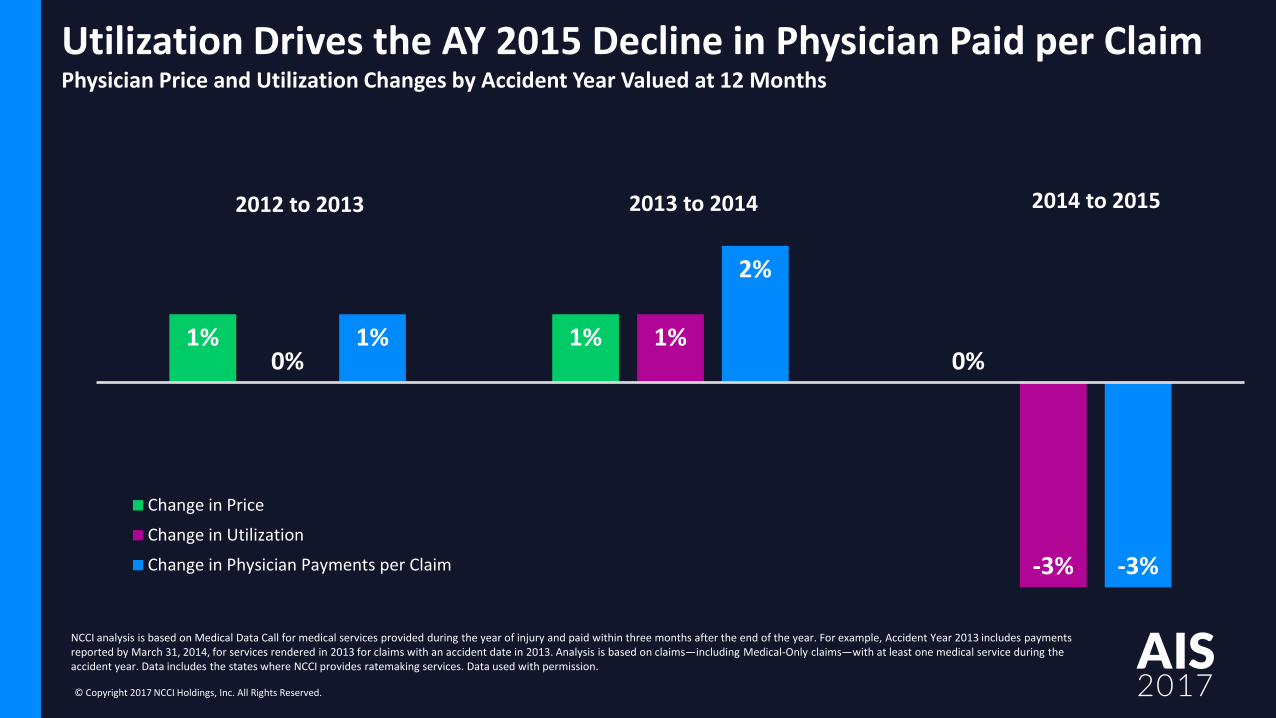
Utilization Drives the AY 2015 Decline in Physician Paid per ClaimPhysician Price and Utilization Changes by Accident Year Valued at 12 Months
NCCI analysis is based on Medical Data Call for medical services provided during the year of injury and paid within three months after the end of the year. For example, Accident Year 2013 includes payments reported by March 31, 2014, for services rendered in 2013 for claims with an accident date in 2013. Analysis is based on claims—including Medical‐Only claims—with at least one medical service during the accident year. Data includes the states where NCCI provides ratemaking services. Data used with permission.
1% 1%0%0%
1%
-3%
1%
2%
-3%
Change in Price
Change in Utilization
Change in Physician Payments per Claim
2012 to 2013 2013 to 2014 2014 to 2015
© Copyright 2017 NCCI Holdings, Inc. All Rights Reserved.
AIS2017
Why the mild growth of WC medical costs since AY 2009?
© Copyright 2017 NCCI Holdings, Inc. All Rights Reserved.
AIS2017
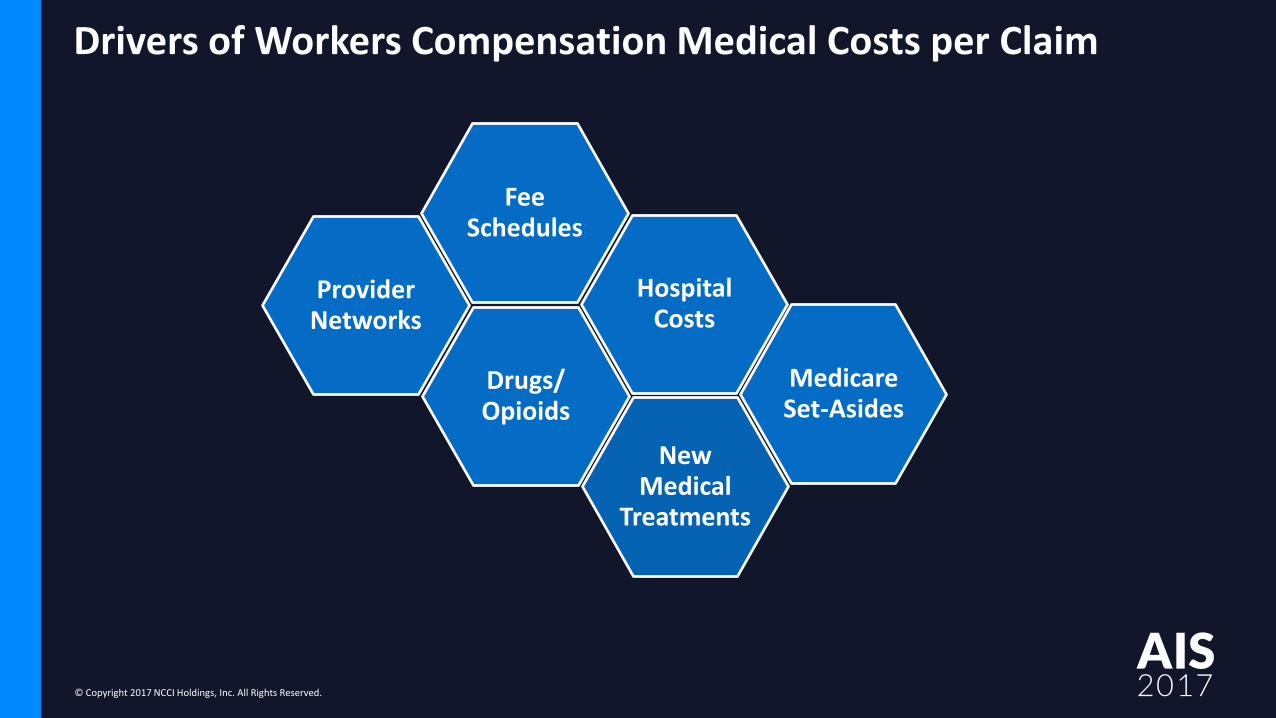
Drivers of Workers Compensation Medical Costs per Claim
Fee Schedules
HospitalCosts
Medicare Set-Asides
NewMedical
Treatments
Drugs/ Opioids
ProviderNetworks
© Copyright 2017 NCCI Holdings, Inc. All Rights Reserved.
AIS2017
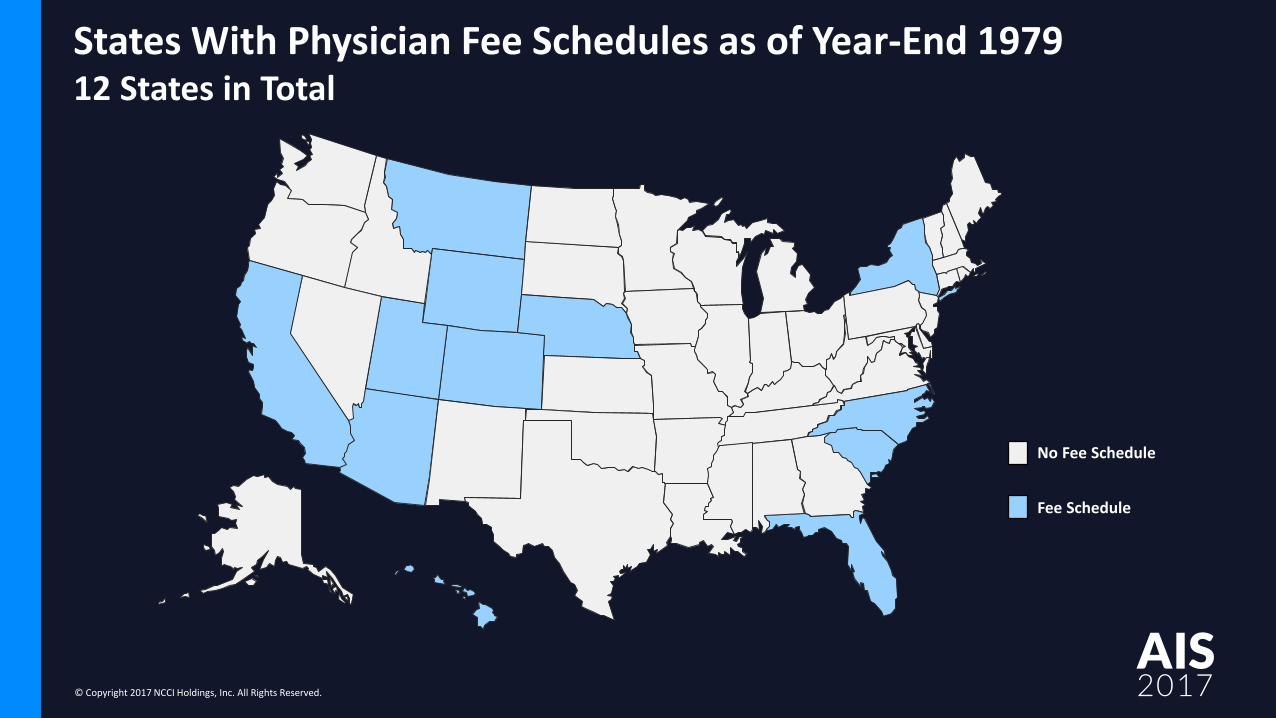
States With Physician Fee Schedules as of Year-End 197912 States in Total
No Fee Schedule
Fee Schedule
© Copyright 2017 NCCI Holdings, Inc. All Rights Reserved.
AIS2017
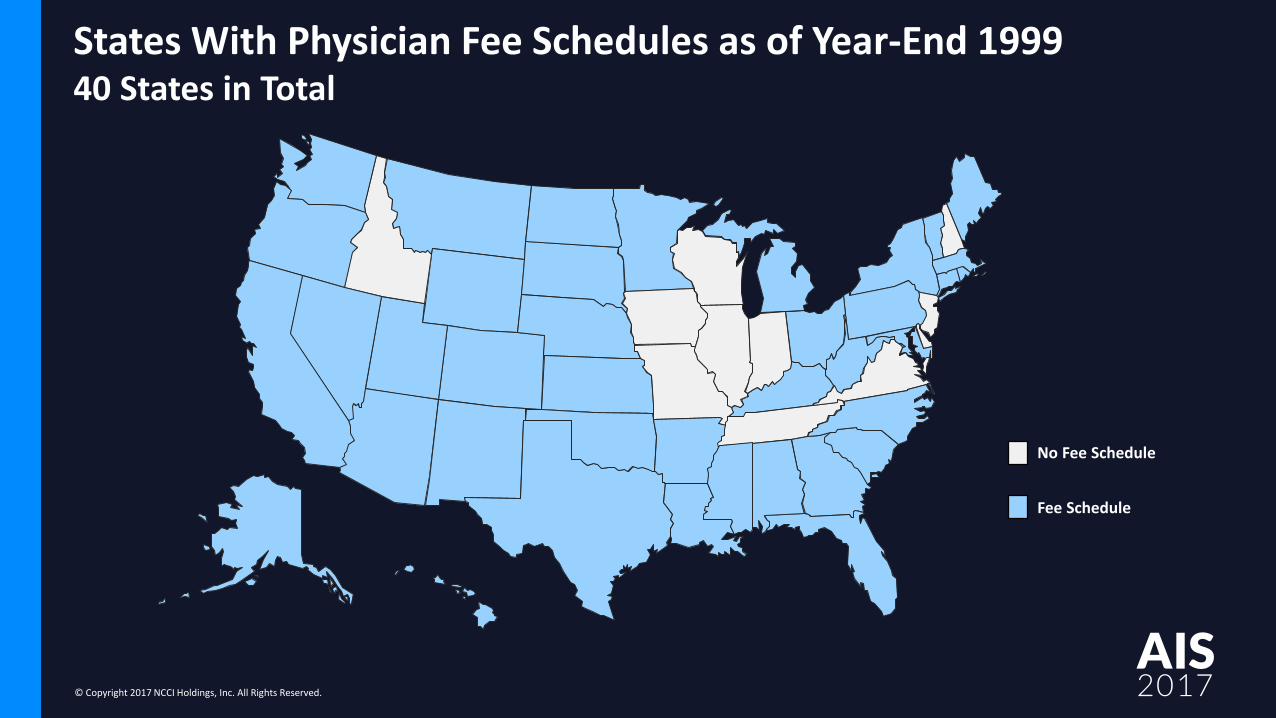
States With Physician Fee Schedules as of Year-End 199940 States in Total
No Fee Schedule
Fee Schedule

© Copyright 2017 NCCI Holdings, Inc. All Rights Reserved.
AIS2017
States With Physician Fee Schedules as of Year-End 201644 States in Total—33 of Which Have a Medicare-Based Schedule
No Fee Schedule
Non-Medicare
Medicare-Based
© Copyright 2017 NCCI Holdings, Inc. All Rights Reserved.
AIS2017
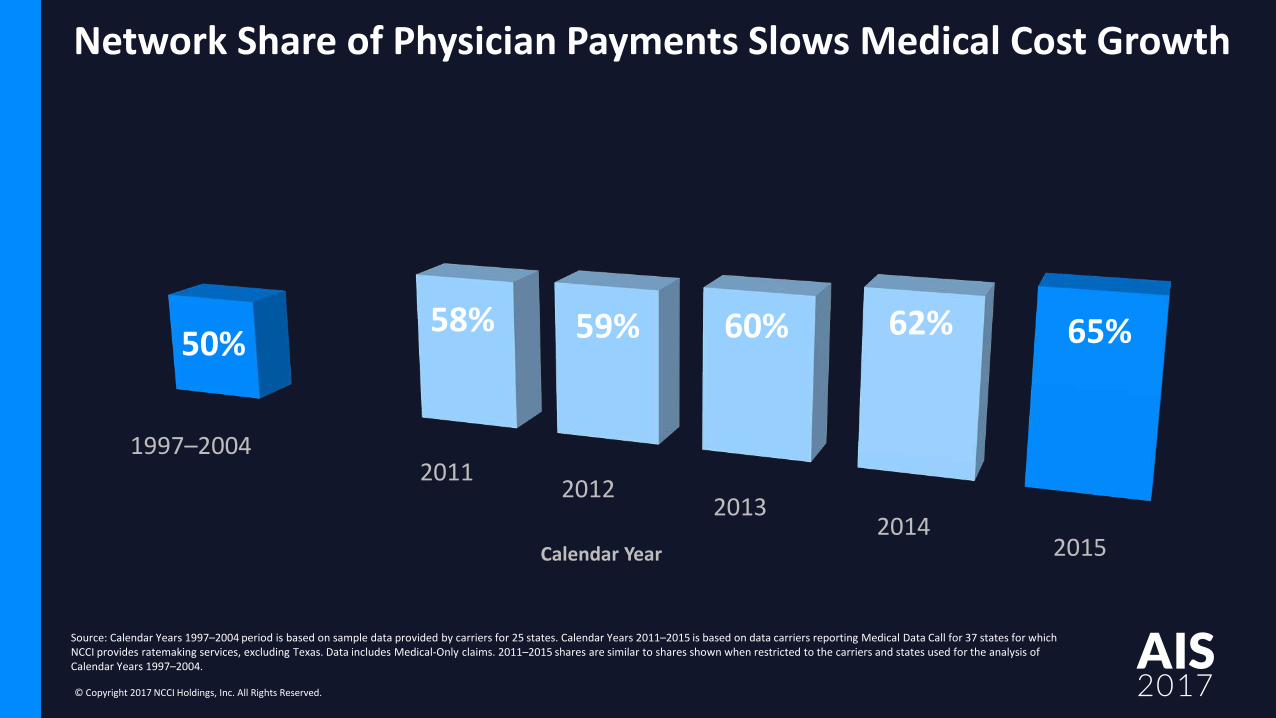
Network Share of Physician Payments Slows Medical Cost Growth
Source: Calendar Years 1997–2004 period is based on sample data provided by carriers for 25 states. Calendar Years 2011–2015 is based on data carriers reporting Medical Data Call for 37 states for which NCCI provides ratemaking services, excluding Texas. Data includes Medical‐Only claims. 2011–2015 shares are similar to shares shown when restricted to the carriers and states used for the analysis of Calendar Years 1997–2004.
1997–20042011 2012
20132014
2015
50%58% 59% 60% 62% 65%
Calendar Year
© Copyright 2017 NCCI Holdings, Inc. All Rights Reserved.
AIS2017
What contributed to the increase in hospital payments per claim?
© Copyright 2017 NCCI Holdings, Inc. All Rights Reserved.
AIS2017
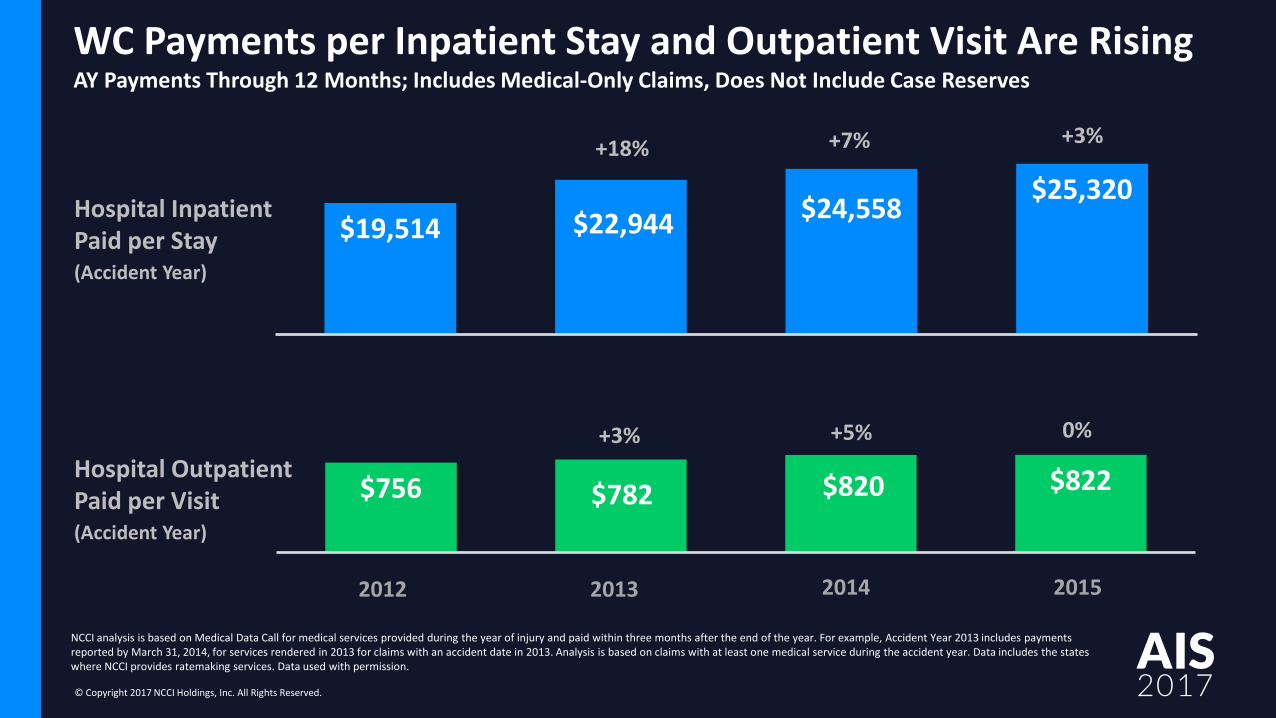
WC Payments per Inpatient Stay and Outpatient Visit Are RisingAY Payments Through 12 Months; Includes Medical-Only Claims, Does Not Include Case Reserves
NCCI analysis is based on Medical Data Call for medical services provided during the year of injury and paid within three months after the end of the year. For example, Accident Year 2013 includes payments reported by March 31, 2014, for services rendered in 2013 for claims with an accident date in 2013. Analysis is based on claims with at least one medical service during the accident year. Data includes the states where NCCI provides ratemaking services. Data used with permission.
$19,514 $22,944 $24,558 $25,320+18% +7% +3%
$756 $782 $820 $822+3% +5% 0%
Hospital Inpatient Paid per Stay(Accident Year)
Hospital Outpatient Paid per Visit(Accident Year)
2012 2013 2014 2015

© Copyright 2017 NCCI Holdings, Inc. All Rights Reserved.
AIS2017
Medicare Reimbursement Rate Changes Put Pressure on WC Prices
This slide shows how WC costs in states where NCCI provides ratemaking services would have changed if all WC payments were made according to the federal Medicare reimbursement schedules as published by the Centers for Medicare & Medicaid Services and the number and mix of medical services were held constant.Source: NCCI analysis is based on Medical Data Call—including Medical‐Only claims—and conversion factors and relative value units as published by the Centers for Medicare & Medicaid Services
-0.4%
2.0%
-0.6%
0.1%
3.6%
2.2%
-0.8%
2.9%
8.9%
-0.4%
1.0%
8.5%
0.2%1.0% 0.8%
Physician Hospital Inpatient Hospital Outpatient
2012 2013 2014 2015 2016 2012 2013 2014 2015 2016 2012 2013 2014 2015 2016
© Copyright 2017 NCCI Holdings, Inc. All Rights Reserved.
AIS2017
What about Medicare Set‐Asides (MSAs)?
© Copyright 2017 NCCI Holdings, Inc. All Rights Reserved.
AIS2017
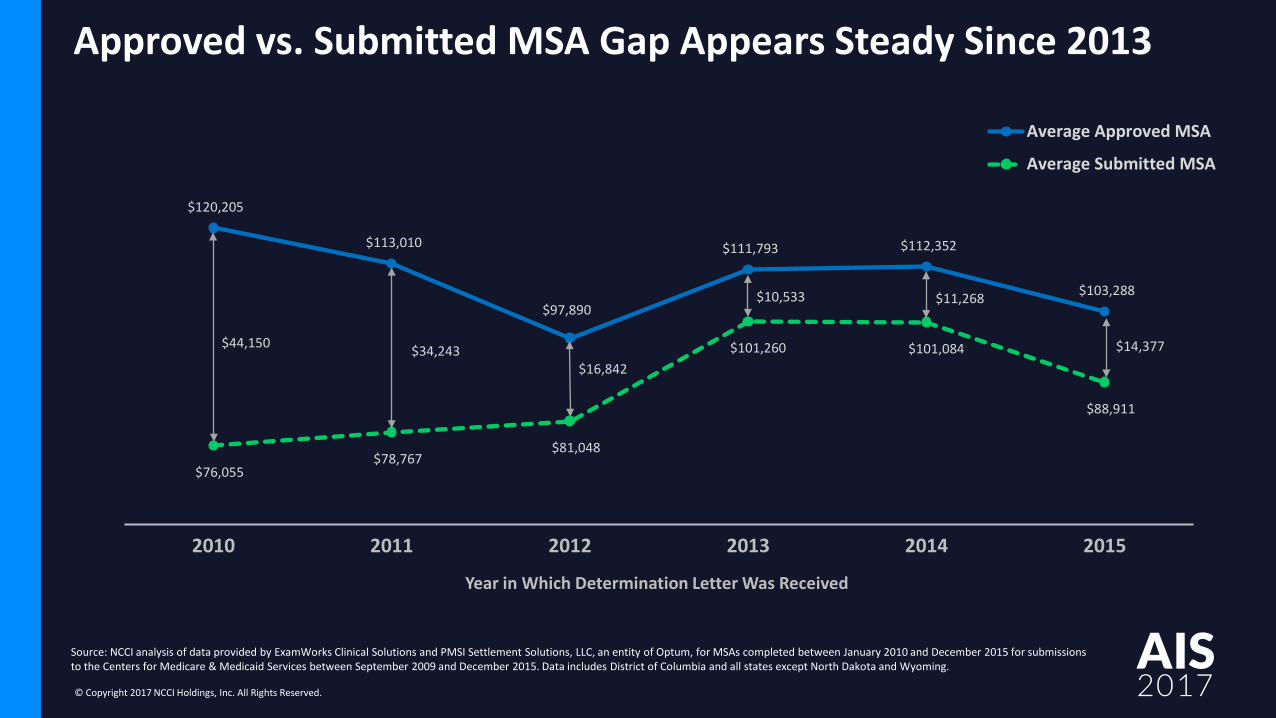
Approved vs. Submitted MSA Gap Appears Steady Since 2013
Source: NCCI analysis of data provided by ExamWorks Clinical Solutions and PMSI Settlement Solutions, LLC, an entity of Optum, for MSAs completed between January 2010 and December 2015 for submissions to the Centers for Medicare & Medicaid Services between September 2009 and December 2015. Data includes District of Columbia and all states except North Dakota and Wyoming.
$120,205
$113,010
$97,890
$111,793 $112,352
$103,288
$76,055 $78,767
$81,048
$101,260 $101,084
$88,911
2010 2011 2012 2013 2014 2015
Year in Which Determination Letter Was Received
Average Approved MSA
Average Submitted MSA
$44,150 $34,243
$10,533
$16,842
$11,268
$14,377
© Copyright 2017 NCCI Holdings, Inc. All Rights Reserved.
AIS2017
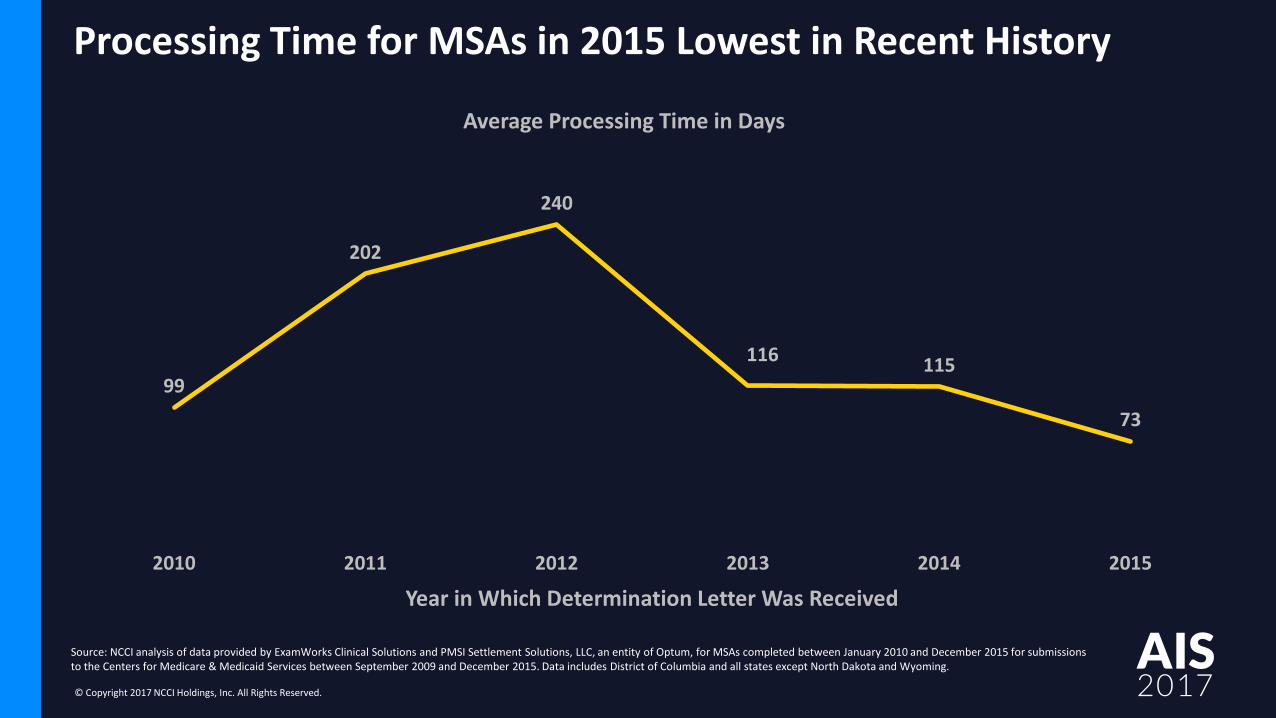
Processing Time for MSAs in 2015 Lowest in Recent History
99
202
240
116 115
73
2010 2011 2012 2013 2014 2015
Year in Which Determination Letter Was Received
Average Processing Time in Days
Source: NCCI analysis of data provided by ExamWorks Clinical Solutions and PMSI Settlement Solutions, LLC, an entity of Optum, for MSAs completed between January 2010 and December 2015 for submissions to the Centers for Medicare & Medicaid Services between September 2009 and December 2015. Data includes District of Columbia and all states except North Dakota and Wyoming.
© Copyright 2017 NCCI Holdings, Inc. All Rights Reserved.
AIS2017
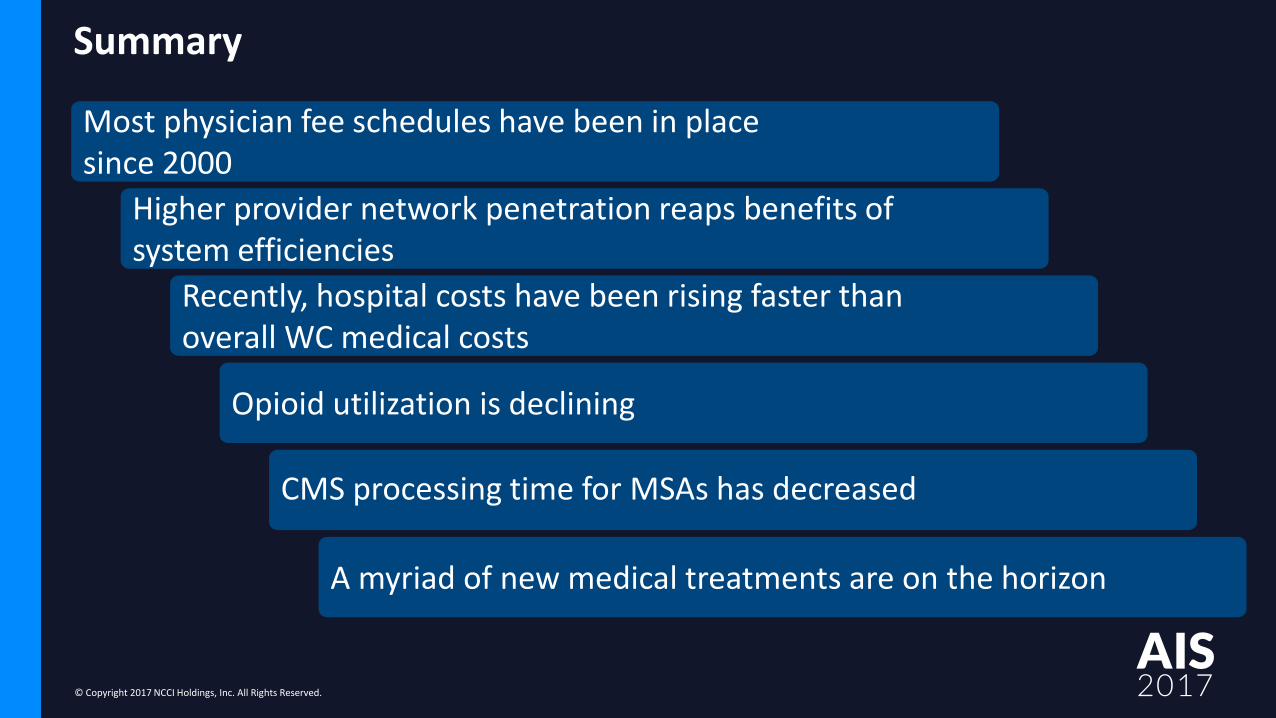
Summary
Most physician fee schedules have been in place since 2000
Higher provider network penetration reaps benefits of system efficiencies
Opioid utilization is declining
CMS processing time for MSAs has decreased
A myriad of new medical treatments are on the horizon
Recently, hospital costs have been rising faster than overall WC medical costs

© Copyright 2017 NCCI Holdings, Inc. All Rights Reserved.
AIS2017
A look into the future
© Copyright 2017 NCCI Holdings, Inc. All Rights Reserved.
AIS2017
Into the Future
Medical treatment and practice will continue to change
Some new treatments will increase costs
But some new treatments will restore full functionality, enabling a full return to work
What does this mean for the concept of permanent disability?
NCCI will continue to track trends affecting workers compensation costs