Embed Size (px)
Citation preview
Highlights
The implementation of mega-deals (trade agreements between EU-USA, EU-Japan, China-Japan-South Korea…) would negatively impact SSA countries.
An ambitious and global African trade integration can counterbalance those effects.
Openness of African countries towards Asia could be a potential solution to avoid trade diversion.
Potential externalities due to non-tariff measure packages can also be welfare improving for SSA countries.
Mega-deals:
What Consequences
for sub-Saharan Africa?
No 2014-28 – December Working Paper
Houssein Guimbard & Maëlan Le Goff
CEPII Working Paper Mega-deals: What Consequences for sub-Saharan Africa?
Abstract
The sub-Saharan African (SSA) countries are excluded from the mega-deals (EU-USA, EU-Japan, China-Japan-Korea…) under negotiations: they might however undergo important economic impacts, as their exports remain dependant from those large markets. Using a dynamic Computable General Equilibrium Model (CGEM), this paper fi nd that mega-deals would have a negative impact on the welfare of SSA countries. Regional integration (the “Tripartite” FTA, a potential trade agreement gathering 26 African countries) in Africa might limit these losses but cannot overcome them. A continental RTA involving all SSA countries would slightly counterbalance the negative impact of the Mega deals. We also show that openness of African countries towards Asia could be a potential solution to avoid trade diversion.
Keywords
International trade, Mega Deals, Africa.
JEL
F13, F15, O55.
CEPII (Centre d’Etudes Prospectives et d’Informations Internationales) is a French institute dedicated to producing independent, policy-oriented economic research helpful to understand the international economic environment and challenges in the areas of trade policy, competitiveness, macroeconomics, international fi nance and growth.
CEPII Working PaperContributing to research in international economics
© CEPII, PARIS, 2014
All rights reserved. Opinions expressed in this publication are those of the author(s) alone.
Editorial Director:Sébastien Jean
Production: Laure Boivin
No ISSN: 1293-2574
CEPII113, rue de Grenelle75007 Paris+33 1 53 68 55 00
www.cepii.frPress contact: [email protected]
Working Paper
CEPII Working Paper Mega-deals: What Consequences for sub-Saharan Africa?
3
Mega-deals: What Consequences for sub-Saharan Africa?
Houssein Guimbard1 and Maëlan Le Goff
2
1. Introduction
In 2013, a new wave of negotiations on free trade agreements (mega-deals), involving the largest countries in the world, has been launched. Discussions about an agreement that would liberalize trade in goods, services and investments between the European Union and Japan have started since March 2013. The fifth round of negotiations took place in Tokyo last spring. One of the most debated points deals with the removing of non-tariff barriers in Japan. Another free trade agreement involving the European Union and the United States is being discussed since the beginning of 2013 (the Transatlantic Trade and Investment Partnership, TTIP). Moreover, the United States and eleven countries throughout the Asia-Pacific region
3 are negotiating a Trans-Pacific Partnership (TPP). In addition, ASEAN
countries and their six FTA partners (Australia, China, India, Japan, Korea and New Zealand) have initiated discussions at the beginning of 2013 for the implementation of the Regional Comprehensive Economic Partnership (RCEP). This agreement is expected to be completed by the end of 2015. Finally, the possibility of a free trade agreement between China, South Korea and Japan (CJK FTA) was first mentioned in December 2011 and four rounds of negotiations have been held to date.
While SSA4 is totally excluded from those negotiations, the region could be significantly
affected by the implementation of the mega-deals through export diversion effects. As Rosales and Herrerros (2014) explain, the impact of any agreement on non-participating countries, sub-Saharan African countries in our case, will increase with i) their dependency on demand from mega-deals’ countries, ii) existing preferences with participating countries and iii) the substitutability between their exports and products exchanged within involving countries. Sub-Saharan African exports to mega-deals’ countries represent 70% of the total and African products still benefit from preferences to enter large mega-deals’ markets (the United-States, the European Union, etc.). Moreover, some products exported by African and
1 CEPII, [email protected]
2 Banque de France and CEPII, [email protected]
3 Australia, Brunei Darussalam, Canada, Chile, Japan, Malaysia, Mexico, New Zealand, Peru, Singapore and Vietnam.
4 Following the United-Nations, sub-Saharan Africa refers in this paper to all African countries excluding northern African
countries but including the Sudan (see http://unstats.un.org/unsd/methods/m49/m49regin.htm).
CEPII Working Paper Mega-deals: What Consequences for sub-Saharan Africa?
4
Asian countries to the EU or the US may be substitutes, leading to impacts of mega-deals on African trade potentially important. In addition to diversion effects, Fontagné et al. (2013) mentioned another channel through which third countries may be impacted by the consequences of mega-deals: “harmonization spillovers”. As they argued, measures to harmonize non tariff measures (like standards and norms) between participating countries might facilitate third countries’ access to signing parties’ markets.
At the same time, the trade integration process in Africa is expanding and strengthening. In 1991, the Abuja Treaty (1991) launched the gradual implementation of the African Economic Community (AEC), a continental free trade area. The AEC’s establishment should pass by six steps and be reached 34 years later. Today, the process is in its third step. This phase involves the implementation of a free trade area and of a custom union in each of the eight Regional Economic Communities (RECs) by 2017. By now two of them, the West African Economic and Monetary Union (WAEMU) and the Economic and Monetary Community of Central Africa (EMCCA), are monetary unions. Five RECs are free trade areas: the Common Market for Eastern and Southern Africa (COMESA), the East African Community (EAC), the Economic Community of Central African States (ECCAS), the Economic Community of West African States (ECOWAS) and the Southern African Development Community (SADC). In addition, three of them have a custom union (COMESA, EAC and SADC) and ECOWAS is expected to adopt a common external tariff in January 2015. EAC has gone further by establishing a common market in 2010. A project of monetary union in EAC is currently under discussion. Moreover, a Tripartite Free Trade Area including countries of COMESA, EAC and SADC (26 countries), is planned to be effective in 2015.
Hence, the aim of this paper is to evaluate, using a Computable General Equilibrium Model (CGEM), the consequences for SSA countries of mega-deals successful negotiations. While RTAs contain numerous items on which countries negotiate (services, FDI, intellectual property, etc.), we only focus on market access for goods through tariffs and non-tariff measures (NTMs).
Our paper contributes to the empirical literature on mega-deals in three ways. First, to our knowledge, it is the only quantitative assessment of the impact of those large negotiations on SSA countries, explicitly modeled. Second, we use recent and detailed data on tariffs to design our scenarios, taking into account all trade preferences. Finally, we provide some trade policy options for SSA countries, especially trade liberalization within Africa that could dampen the effects of mega-deals on their economies.
Our results show the negative impact of the mega-deals on the welfare of sub-Saharan countries. Moreover, they reveal that regional integration (the “Tripartite” RTA) in Africa tends to limit but cannot overcome losses due to the mega-deals. A continental RTA involving all SSA countries will slightly counterbalance the negative impact of the mega-deals. In this framework, openness of African countries towards Asia could be an additional solution to avoid trade diversion.
CEPII Working Paper Mega-deals: What Consequences for sub-Saharan Africa?
5
The remainder of the paper is organized as follows. Section 2 reviews the literature examining the impact of RTAs for African countries. Section 3 describes the patterns of African trade and protection. Sections 4 and 5 present respectively our model and the results of our estimates. Finally, we carry out a sensitivity analysis in Section 6 and conclude.
2. Sub-Saharan African countries and trade policies
The integration of sub-Saharan Africa countries in international trade has been widely discussed and documented in the empirical literature. During the 2000s, following the launch of the Doha Round (Doha Development Agenda - DDA), numerous studies have shown the special place of the African continent in international trade.
African countries already have a privileged access to major developed markets: to the European Union via Everything But Arms (EBA) or the Generalised System of Preferences (GSP) and to the USA via the African Growth and Opportunity Act (AGOA). Consequently, preference erosion (reduction of the preferential margin, following the opening of the EU and U.S. vis-à-vis others developing countries such as Asia or South America), resulting from the implementation of successive DDA proposals, would have a negative impact on all SSA countries. Bouët et al. (2004) found for example, that the preference erosion following multilateral trade liberalization in agriculture would be particularly detrimental for African economies. In addition to the loss of market access, two other effects are at stake: strong growth in other developing countries (e.g., China, India, etc.) and weak commitments of African countries into the multilateral framework (eligible to the Special and differentiated treatment, SDT, that allows them to undertake reduced tariff liberalization).
Meanwhile, in compliance vis-à-vis the WTO, the Economic Partnership Agreements (EPA), designed to replace the Cotonou agreement, have raised other issues for African countries. Indeed, the requirement of reciprocity and the most favored nation (MFN) clause do not authorize the use of unilateral preferences for a specific subset of partner countries, excluding de facto other WTO members. Using a dynamic partial equilibrium model, Fontagné et al. (2011) found that the implementation of EPAs would negatively affect ACP countries, especially West African countries.
Moreover, numerous studies examined consequences of regional integration in Africa. Findings of the empirical literature (using gravity models or general equilibrium simulation studies) do not converge. Yang and Gupta (2005) highlighted the inability of African RTAs to significantly promote intra-African and external trade. As for them, this inefficiency comes from a couple of factors including the lack of complementarity between countries’ endowments, inadequate infrastructures and the small size of local markets. Carrère (2004) found evidence of differentiated effects of African RTAs on intraregional and extraregional trade over the period 1962-1996. For example, her results showed that the SADC agreement increased intraregional trade by 2.5 times (0.2 for ECOWAS), but reduced extraregional
CEPII Working Paper Mega-deals: What Consequences for sub-Saharan Africa?
6
trade by 35 percent.5 Similarly, estimating a gravity model over 1960-2006, Turkson (2012)
found that ECOWAs and SADC agreements positively influenced intra-regional trade, more than EU-ACP agreements. According to the results of Elbadawi (1997), the impact of African RTAs on intra-African trade varies over time: over the period 1980-84, RTAs significantly promoted intra-African imports, while this effect became negative during the second half of 1980s (trade diversion effects).
Using the MIRAGE6 model, Douillet (2011) compared the impact of multilateral vs. regional
integration on agriculture in Africa. While global liberalization would increase the concentration of African trade in unprocessed agricultural products, she found that the regional process would both increase the volume of agricultural exports and their value-added. Recently, Mevel et al. (2013) examined the effects of a possible continental free trade area in Africa and focused also on the impacts on the agricultural sector. Their results suggest that such an agreement would benefit Africa: agricultural exports would be stimulated and the share of intra-African trade in total African trade would increase.
Regarding the mega-deals, the literature has been mainly focused on the economic consequences for countries participating in these trade agreements or for the whole world. One example is the study carried out by the CEPR (Centre for Economic Policy Research) for the European Commission on the effect of the EU-US TTIP for parties involved. Using a computable general equilibrium (CGE), they showed that the TTIP implementation between European countries and the USA will significantly improve the GDP of both regions, especially when tariff removal is associated with reduction of non-tariff barriers (NTBs
7).
Fontagné et al. (2013) evaluated the macroeconomic impact of TTIP on United-States and the European Union. They found that the TTIP implementation would promote bilateral trade between the two partners (mainly through the reduction of NTBs) and significantly increase the annual national income of both areas.
Looking at the impact of the TPP and other possible free trade agreements involving ASEAN (Association of South East Asian Nations) countries, Petri and Plummer (2012) evidenced significant global gains, especially in the scenario assuming a free trade agreement between the 21 APEC (Asia Pacific Economic Cooperation) countries (annual benefits would reach 1,922 billion of US dollars).
In the literature on mega-deals, Africa is generally either considered as a continent in which the status quo prevails in trade policy, either belongs to a vast “rest of the world”. We identify however very few analyses that focused on the potential consequences of the mega-deals for developing countries, especially for African countries.
5 Yang and Gupta (2005), however, tempered this result. Because intraregional trade represents only a marginal share
of SADC’s trade, the total effect corresponds to a decline of the SADC’s international trade by 7 percent. 6 See section 4.
7 We use NTBs and NTMs as synonymous in this paper, even if all measures are not necessarily protectionist.
CEPII Working Paper Mega-deals: What Consequences for sub-Saharan Africa?
7
For example, aside from measuring the potential gains of tariff removal and NTBs reduction for the US and EU through a CGE model, Francois et al. (2013) examined how the EU-US TTIP would impact the rest of the world. Globally, they found evidence of a positive effect of this trade agreement for third countries. Since regions are not enough disaggregated in their model, it is not possible to draw clear conclusions for African countries but GDP of low income economies is expected to increase from 1 billion to 2.4 billion Euros (according to the scenario considered). Another report written by CARIS and the University of Sussex examined the possible effects of the US-EU economic integration on trade for 43 Least Income Countries (LICs), including 31 African countries. Using a partial equilibrium approach, the authors examined for each country how their exports to the US and EU would be shaped by the TTIP implementation. Overall, their results indicate that LICs would not be significantly affected by this agreement.
8 They gave three explanations: i) the high
differences in the composition of exports from LICs to TTIP members and those between the US and EU, ii) most products exported by LICs enter the US or the EU market at zero tariff duty, and iii) LICs represent small market shares in TTIP countries. Felbeyrmayr et al. (2013) reached opposite results. They estimated with a CGE model the impact of trade liberalization resulting from the TTIP on a large panel of countries. Their findings indicate a loss of income per capita following tariff elimination in most developing countries and in all African countries. The largest loss would be supported by Guinea (-7.4%), Côte d’Ivoire (-6.4%) and Namibia (-4.4%).
As a conclusion, the handful of studies that examined the economic consequences of mega-deals on other countries, especially on African countries, does not converge. Using a detailed geographical aggregation of African countries might limit some bias in the analysis.
3. Descriptive evidence
3.1. Trade evolution and specialization
In 2012, African exports of goods represent only 2.5% of world exports (BACI). Only 13.6% of African exports are intra-regional, which is very low compared to other regions (30% in European Union, 23.4% in South America, 46% in North America).
9 In 2012, only four African
countries exported a majority of their exports to other African countries: Rwanda (58%), Mali (56%), Zimbabwe (51%) and Togo (51%).
Over the last twenty years, African trade has become more geographically diversified. Emerging countries like China, India and Brazil, are absorbing an increasing share of sub-Saharan African exports (from 7% in 1998 to 24.5% in 2012), at the expense of traditional trade partners of Europe and North America. In 2012, the main African exporters to China 8 They find however that a few LICs would experience a significant decrease of their exports to TTIP parties, as Niger
and Ghana (oil) and Malawi (Tobacco). 9 All trade data cited in this paper come from the BACI database, which harmonizes bilateral trade data at the HS6 level
from the COMTRADE database (United Nations), starting from 1989 and ending in 2012 (Gaulier and Zignago, 2010).
CEPII Working Paper Mega-deals: What Consequences for sub-Saharan Africa?
8
were the Democratic Republic of the Congo, the Gambia, Angola, Zambia and Sierra Leone with exports to China representing respectively 72%, 51%, 49%, 47% and 46% of their total exports of goods. Guinea-Bissau was the most reliant on Indian imports (70% of its exports). In all other sub-Saharan African countries, exports to India represent less than 25% of the total. Some African countries are however still greatly dependent on imports from the European Union (Cape Verde 78%, Seychelles 63%, Mauritius 57%, Sao Tome and Principe 55%, Cameroon 51%, Niger 49%, etc.).
Since emerging markets mainly need raw materials, the geographical diversification of African trade has been accompanied by an increasing specialization in primary products and energy. Between 1998 and 2012, exports of primary products and energy have increased their share in total SSA countries’ exports by 10 pp (from 48% to 59%). Some African countries are very vulnerable because at least 40% of their exports depend on to one destination country. In 2012 this was the case of Angola (oil to China, 49%), Chad (oil to the United-States, 72%), Eritrea (gold to Canada, 88%), the Gambia (wood to China, 47%), Guinea-Bissau (cashew nuts to India, 70%), Mali (gold to South Africa (46%) and Sierra Leone (iron ore to China, 42%).
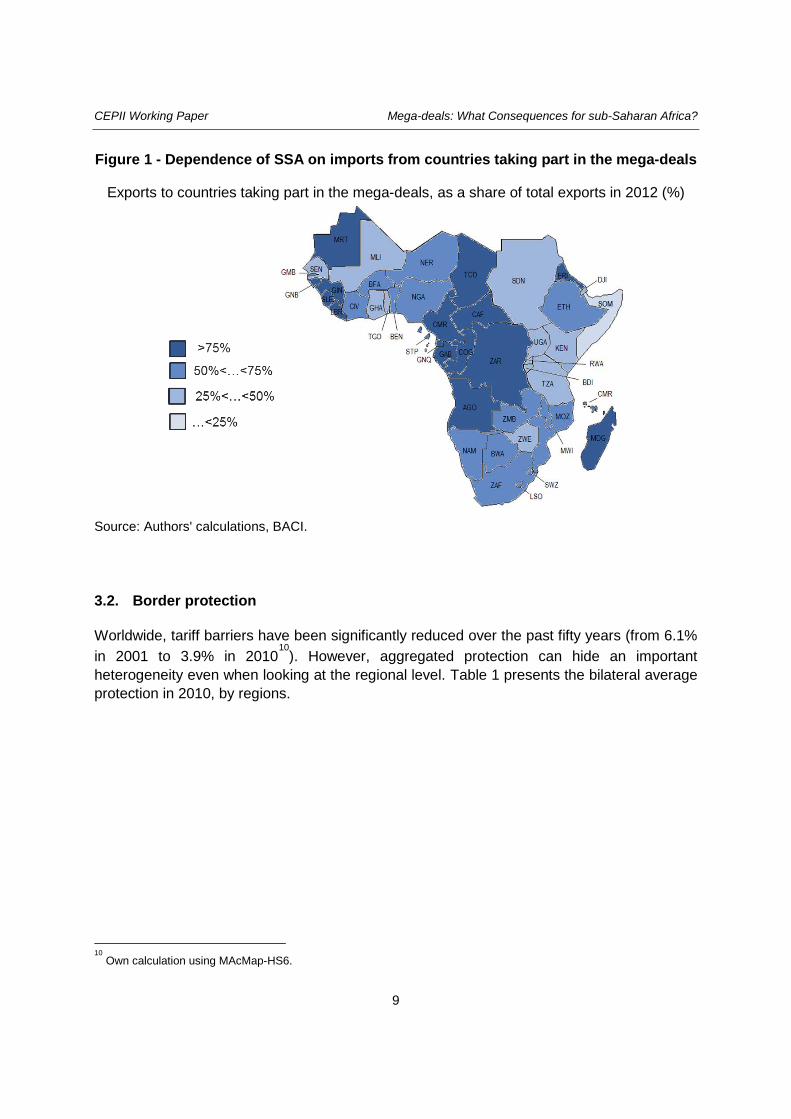
In 2012, countries that export the most to mega-deals’ countries are mainly located in Central Africa (see - Dependence of SSA on imports from countries taking part in the mega-deals), like Chad (99%), Eritrea (98%), Angola (95%), Equatorial Guinea (93%), Guinea Bissau (93%), Sierra Leone (91%) and Central African Republic (91%). However, products exported are mainly commodities that could not find substitutes in the production of countries taking part of the mega-deals.
CEPII Working Paper Mega-deals: What Consequences for sub-Saharan Africa?
9
Figure 1 - Dependence of SSA on imports from countries taking part in the mega-deals
Exports to countries taking part in the mega-deals, as a share of total exports in 2012 (%)
Source: Authors' calculations, BACI.
3.2. Border protection
Worldwide, tariff barriers have been significantly reduced over the past fifty years (from 6.1% in 2001 to 3.9% in 2010
10). However, aggregated protection can hide an important
heterogeneity even when looking at the regional level. Table 1 presents the bilateral average protection in 2010, by regions.
10
Own calculation using MAcMap-HS6.
CEPII Working Paper Mega-deals: What Consequences for sub-Saharan Africa?
10
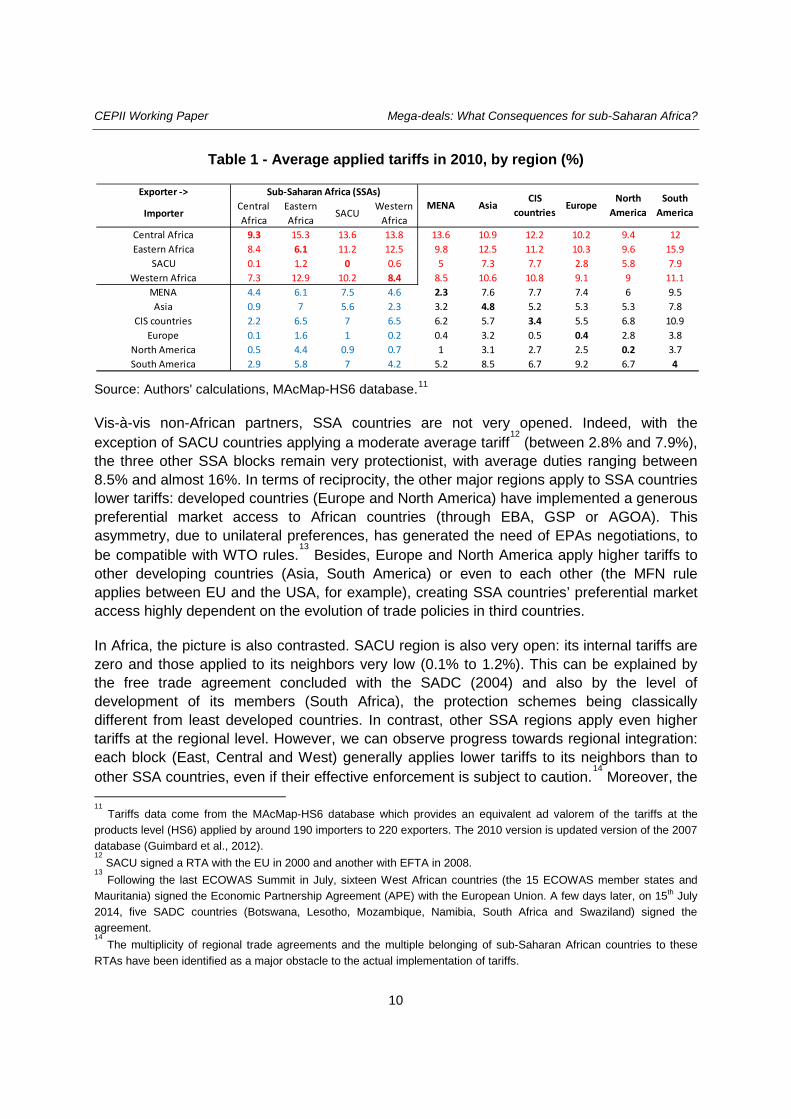
Table 1 - Average applied tariffs in 2010, by region (%)
Source: Authors' calculations, MAcMap-HS6 database.11
Vis-à-vis non-African partners, SSA countries are not very opened. Indeed, with the exception of SACU countries applying a moderate average tariff
12 (between 2.8% and 7.9%),
the three other SSA blocks remain very protectionist, with average duties ranging between 8.5% and almost 16%. In terms of reciprocity, the other major regions apply to SSA countries lower tariffs: developed countries (Europe and North America) have implemented a generous preferential market access to African countries (through EBA, GSP or AGOA). This asymmetry, due to unilateral preferences, has generated the need of EPAs negotiations, to be compatible with WTO rules.
13 Besides, Europe and North America apply higher tariffs to
other developing countries (Asia, South America) or even to each other (the MFN rule applies between EU and the USA, for example), creating SSA countries’ preferential market access highly dependent on the evolution of trade policies in third countries.
In Africa, the picture is also contrasted. SACU region is also very open: its internal tariffs are zero and those applied to its neighbors very low (0.1% to 1.2%). This can be explained by the free trade agreement concluded with the SADC (2004) and also by the level of development of its members (South Africa), the protection schemes being classically different from least developed countries. In contrast, other SSA regions apply even higher tariffs at the regional level. However, we can observe progress towards regional integration: each block (East, Central and West) generally applies lower tariffs to its neighbors than to other SSA countries, even if their effective enforcement is subject to caution.
14 Moreover, the
11
Tariffs data come from the MAcMap-HS6 database which provides an equivalent ad valorem of the tariffs at the products level (HS6) applied by around 190 importers to 220 exporters. The 2010 version is updated version of the 2007 database (Guimbard et al., 2012). 12
SACU signed a RTA with the EU in 2000 and another with EFTA in 2008. 13
Following the last ECOWAS Summit in July, sixteen West African countries (the 15 ECOWAS member states and Mauritania) signed the Economic Partnership Agreement (APE) with the European Union. A few days later, on 15th July 2014, five SADC countries (Botswana, Lesotho, Mozambique, Namibia, South Africa and Swaziland) signed the agreement. 14
The multiplicity of regional trade agreements and the multiple belonging of sub-Saharan African countries to these RTAs have been identified as a major obstacle to the actual implementation of tariffs.
Exporter ->
ImporterCentral Africa
Eastern Africa
SACUWestern
AfricaCentral Africa 9.3 15.3 13.6 13.8 13.6 10.9 12.2 10.2 9.4 12Eastern Africa 8.4 6.1 11.2 12.5 9.8 12.5 11.2 10.3 9.6 15.9
SACU 0.1 1.2 0 0.6 5 7.3 7.7 2.8 5.8 7.9Western Africa 7.3 12.9 10.2 8.4 8.5 10.6 10.8 9.1 9 11.1
MENA 4.4 6.1 7.5 4.6 2.3 7.6 7.7 7.4 6 9.5Asia 0.9 7 5.6 2.3 3.2 4.8 5.2 5.3 5.3 7.8
CIS countries 2.2 6.5 7 6.5 6.2 5.7 3.4 5.5 6.8 10.9Europe 0.1 1.6 1 0.2 0.4 3.2 0.5 0.4 2.8 3.8
North America 0.5 4.4 0.9 0.7 1 3.1 2.7 2.5 0.2 3.7South America 2.9 5.8 7 4.2 5.2 8.5 6.7 9.2 6.7 4
Sub-Saharan Africa (SSAs)MENA Asia
CIS countries
EuropeNorth
AmericaSouth
America
CEPII Working Paper Mega-deals: What Consequences for sub-Saharan Africa?
11
still significant protection within African blocks shows that their total implementation is not yet accomplished.
3.3. Non-Tariff Measures in goods
All recent RTAs negotiations include provisions about Non-tariff Measures (NTMs).This denomination covers areas as different as sanitary and phyto-sanitary standards, technical barriers to trade, administrative constraints, etc. all summed up in a single ad valorem equivalent used to model trade restrictions implied by these measures. Because NTMs are significant obstacles to intra-regional trade, recent African trade agreements and those being negotiated provide for their progressive elimination. For example, the Draft Tripartite Agreement mentions the removal of all Non-Tariff Barriers among its main objectives. Moreover, in sub-Saharan Africa, in addition to NTMs, we find the weakness of infrastructures as well as the complexity of customs and administrative procedures.
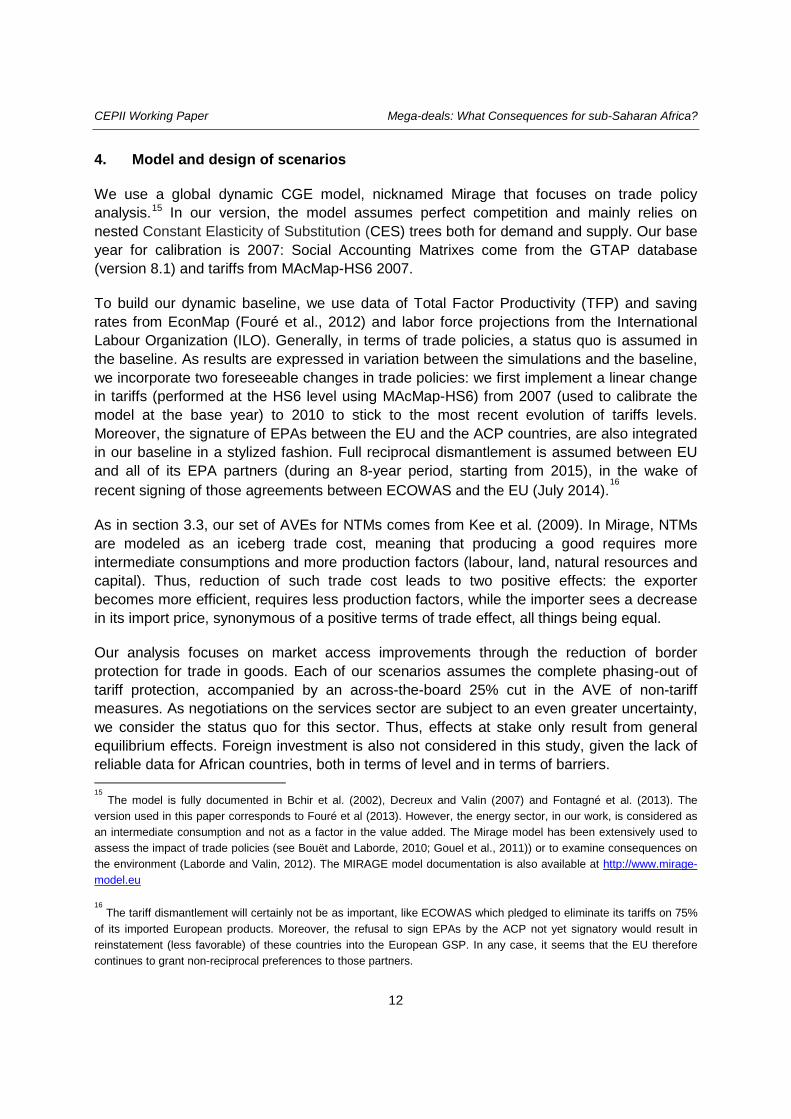
The Mirage model integrates NTMs for goods based on Kee et al. (2009), who proposed an estimation of ad valorem equivalents of NTMs for a panel of 78 countries at the six-digit level of the harmonized nomenclature (HS6), that we aggregate at our level of aggregation, using a trade weighted average. We add to this trade cost data from Minor and Tsigas (2008) for the time spent at the border. Table 2 provides the value of trade costs (in percentage) aggregated at the regional level for agriculture and industry.
Table 2 – Average ad valorem equivalent of Non Tariff Measures, by continent and aggregated sector
Sector Asia CIS countries Europe MENA North
America South
America SSA
countries Primary 50 46 55 46 53 46 48 Secondary 49 51 33 36 44 52 50
Source: Kee et al. (2009), Authors’ calculation.
The set of non-tariff measures, aggregated at the sectoral level, shows certain homogeneity. Not only their level are generally large (consistently between 30% and 60%), but, unlike tariffs, countries using the most binding measures are developed countries, especially regarding agriculture. SSA countries do not differ notably from the rest of the world, with an ad valorem equivalent of nearly 50%, for both agriculture and industry.
CEPII Working Paper Mega-deals: What Consequences for sub-Saharan Africa?
12
4. Model and design of scenarios
We use a global dynamic CGE model, nicknamed Mirage that focuses on trade policy analysis.15 In our version, the model assumes perfect competition and mainly relies on nested Constant Elasticity of Substitution (CES) trees both for demand and supply. Our base year for calibration is 2007: Social Accounting Matrixes come from the GTAP database (version 8.1) and tariffs from MAcMap-HS6 2007.
To build our dynamic baseline, we use data of Total Factor Productivity (TFP) and saving rates from EconMap (Fouré et al., 2012) and labor force projections from the International Labour Organization (ILO). Generally, in terms of trade policies, a status quo is assumed in the baseline. As results are expressed in variation between the simulations and the baseline, we incorporate two foreseeable changes in trade policies: we first implement a linear change in tariffs (performed at the HS6 level using MAcMap-HS6) from 2007 (used to calibrate the model at the base year) to 2010 to stick to the most recent evolution of tariffs levels. Moreover, the signature of EPAs between the EU and the ACP countries, are also integrated in our baseline in a stylized fashion. Full reciprocal dismantlement is assumed between EU and all of its EPA partners (during an 8-year period, starting from 2015), in the wake of recent signing of those agreements between ECOWAS and the EU (July 2014).
16
As in section 3.3, our set of AVEs for NTMs comes from Kee et al. (2009). In Mirage, NTMs are modeled as an iceberg trade cost, meaning that producing a good requires more intermediate consumptions and more production factors (labour, land, natural resources and capital). Thus, reduction of such trade cost leads to two positive effects: the exporter becomes more efficient, requires less production factors, while the importer sees a decrease in its import price, synonymous of a positive terms of trade effect, all things being equal.
Our analysis focuses on market access improvements through the reduction of border protection for trade in goods. Each of our scenarios assumes the complete phasing-out of tariff protection, accompanied by an across-the-board 25% cut in the AVE of non-tariff measures. As negotiations on the services sector are subject to an even greater uncertainty, we consider the status quo for this sector. Thus, effects at stake only result from general equilibrium effects. Foreign investment is also not considered in this study, given the lack of reliable data for African countries, both in terms of level and in terms of barriers. 15
The model is fully documented in Bchir et al. (2002), Decreux and Valin (2007) and Fontagné et al. (2013). The version used in this paper corresponds to Fouré et al (2013). However, the energy sector, in our work, is considered as an intermediate consumption and not as a factor in the value added. The Mirage model has been extensively used to assess the impact of trade policies (see Bouët and Laborde, 2010; Gouel et al., 2011)) or to examine consequences on the environment (Laborde and Valin, 2012). The MIRAGE model documentation is also available at http://www.mirage-model.eu 16
The tariff dismantlement will certainly not be as important, like ECOWAS which pledged to eliminate its tariffs on 75% of its imported European products. Moreover, the refusal to sign EPAs by the ACP not yet signatory would result in reinstatement (less favorable) of these countries into the European GSP. In any case, it seems that the EU therefore continues to grant non-reciprocal preferences to those partners.
CEPII Working Paper Mega-deals: What Consequences for sub-Saharan Africa?
13
Our central scenario, called “Mega Deals”, considers the implementation of five large agreements that are currently negotiated. We suppose the removal of tariffs and reduction in NTMs in the following agreements: EU-Japan, TTIP, TTP, the RECP (ASEAN+6)
17 and the
China-Japan-Korea FTA. We simulate each of those mega-deals one by one to disentangle their respective effects on SSA countries.
Then, to examine whether the liberalization of African trade could amplify or dampen the impact of “Mega Deals”, we consider additional cumulative scenarios. The “Tripartite” scenario assumes that in addition to the “Mega Deals” scenario, a tripartite free trade area including countries of COMESA, EAC and SADC, which is planned to be effective in 2015, is established.
18 This tripartite scenario is deepened by a larger African integration process in
the scenario called “SSA” which adds Western Africa to the tripartite area.19
To seek other outlets, two additional scenarios are performed. Both assume “Mega Deals”, “Tripartite” and “SSA” scenarios implemented. As a complement, the “Asia” scenario supposes a free trade zone between SSA countries and Asian countries, whereas “South America” considers the same ambition between SSA countries and South American countries. These stylized scenarios can be seen as possible directions in terms of trade policies for SSA countries.
Starting from 2015 and ending in 2025, all scenarios assume an 8-year phase-in period and are considered as fully implemented in 2023. Tariff reductions are computed at the HS6 level from 2010 tariff level, using the MAcMap-HS6 2010. Cuts in AVE of NTMs are also linearly implemented during the same period. Given the uncertainty on commitments (both on tariffs that can be replaced by tariff rate quotas and on NTMs), we choose to design stylized scenarios to get effects from large liberalization exercises. Sensitivity analyses will tackle some assumptions made in this section. Table 3 summarizes our set of trade policy scenarios.
17
In that case, liberalisation only involves ASEAN countries and each of their six partners. The latter do not take any commitment between each other. 18
Official documents contain a very ambitious proposal: removing of all tariffs and non tariff measures, among other topics. Thus, our stylized scenario seems to be less ambitious than what it is proposed. See http://www.tralac.org/resources/by-region/comesa-eac-sadc-tripartite-fta.html 19
We do not make any assumption of the Common External Tariffs (CET) that are not already in the data. We believe their effects are of second order regarding the results we obtain.
CEPII Working Paper Mega-deals: What Consequences for sub-Saharan Africa?
14
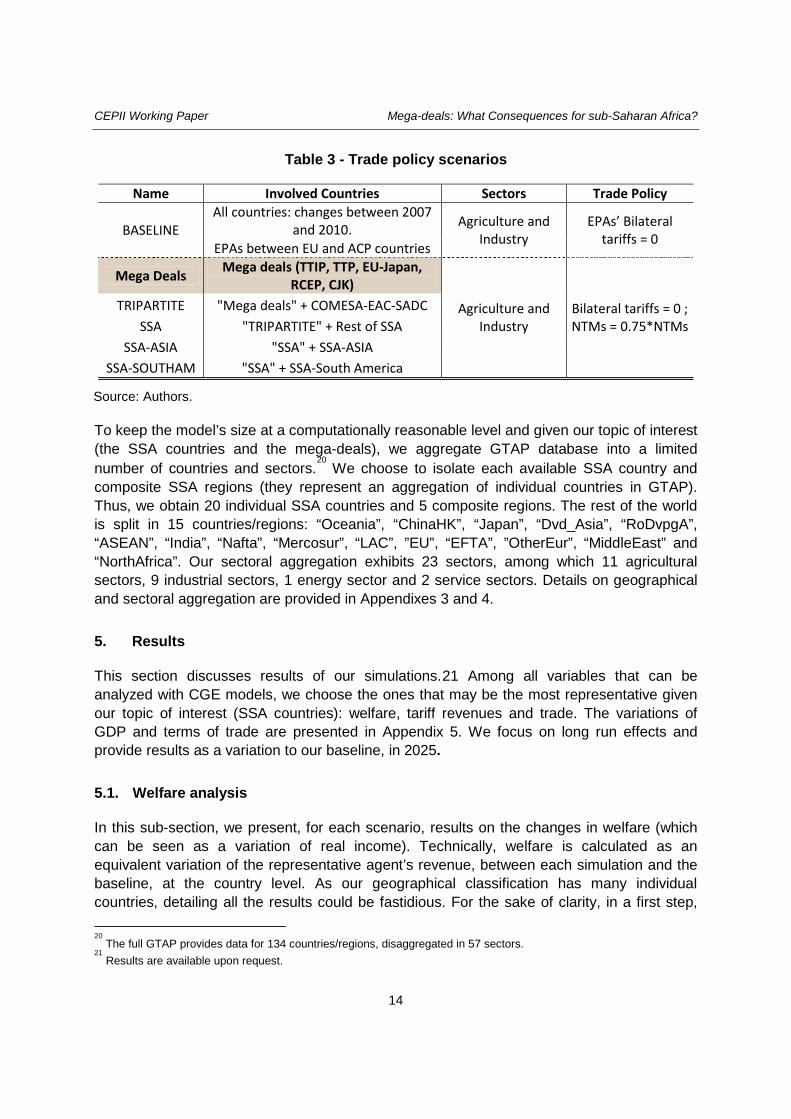
Table 3 - Trade policy scenarios
Name Involved Countries Sectors Trade Policy
BASELINE All countries: changes between 2007
and 2010. Agriculture and Industry
EPAs’ Bilateral tariffs = 0 EPAs between EU and ACP countries
Mega Deals Mega deals (TTIP, TTP, EU-Japan, RCEP, CJK)
Agriculture and Industry
Bilateral tariffs = 0 ; NTMs = 0.75*NTMs
TRIPARTITE "Mega deals" + COMESA-EAC-SADC SSA "TRIPARTITE" + Rest of SSA
SSA-ASIA "SSA" + SSA-ASIA SSA-SOUTHAM "SSA" + SSA-South America
Source: Authors.
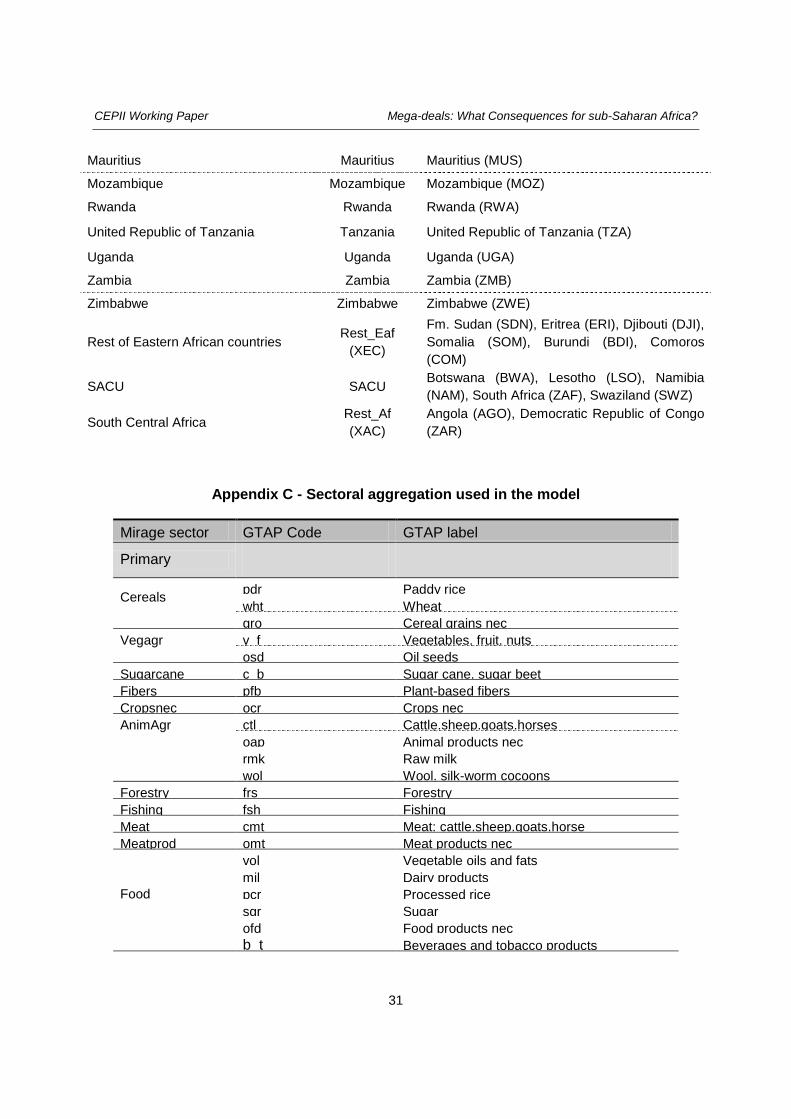
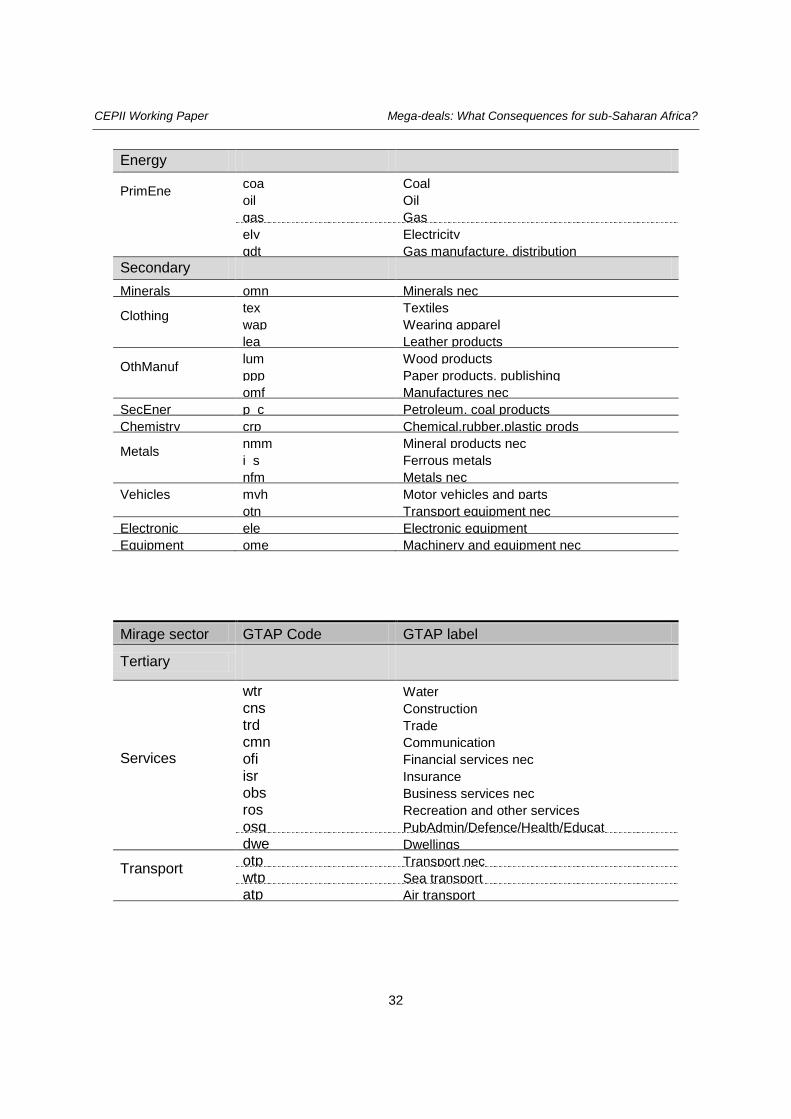
To keep the model’s size at a computationally reasonable level and given our topic of interest (the SSA countries and the mega-deals), we aggregate GTAP database into a limited number of countries and sectors.
20 We choose to isolate each available SSA country and
composite SSA regions (they represent an aggregation of individual countries in GTAP). Thus, we obtain 20 individual SSA countries and 5 composite regions. The rest of the world is split in 15 countries/regions: “Oceania”, “ChinaHK”, “Japan”, “Dvd_Asia”, “RoDvpgA”, “ASEAN”, “India”, “Nafta”, “Mercosur”, “LAC”, ”EU”, “EFTA”, ”OtherEur”, “MiddleEast” and “NorthAfrica”. Our sectoral aggregation exhibits 23 sectors, among which 11 agricultural sectors, 9 industrial sectors, 1 energy sector and 2 service sectors. Details on geographical and sectoral aggregation are provided in Appendixes 3 and 4.
5. Results
This section discusses results of our simulations.21 Among all variables that can be analyzed with CGE models, we choose the ones that may be the most representative given our topic of interest (SSA countries): welfare, tariff revenues and trade. The variations of GDP and terms of trade are presented in Appendix 5. We focus on long run effects and provide results as a variation to our baseline, in 2025.
5.1. Welfare analysis
In this sub-section, we present, for each scenario, results on the changes in welfare (which can be seen as a variation of real income). Technically, welfare is calculated as an equivalent variation of the representative agent’s revenue, between each simulation and the baseline, at the country level. As our geographical classification has many individual countries, detailing all the results could be fastidious. For the sake of clarity, in a first step, 20
The full GTAP provides data for 134 countries/regions, disaggregated in 57 sectors. 21
Results are available upon request.
CEPII Working Paper Mega-deals: What Consequences for sub-Saharan Africa?
15
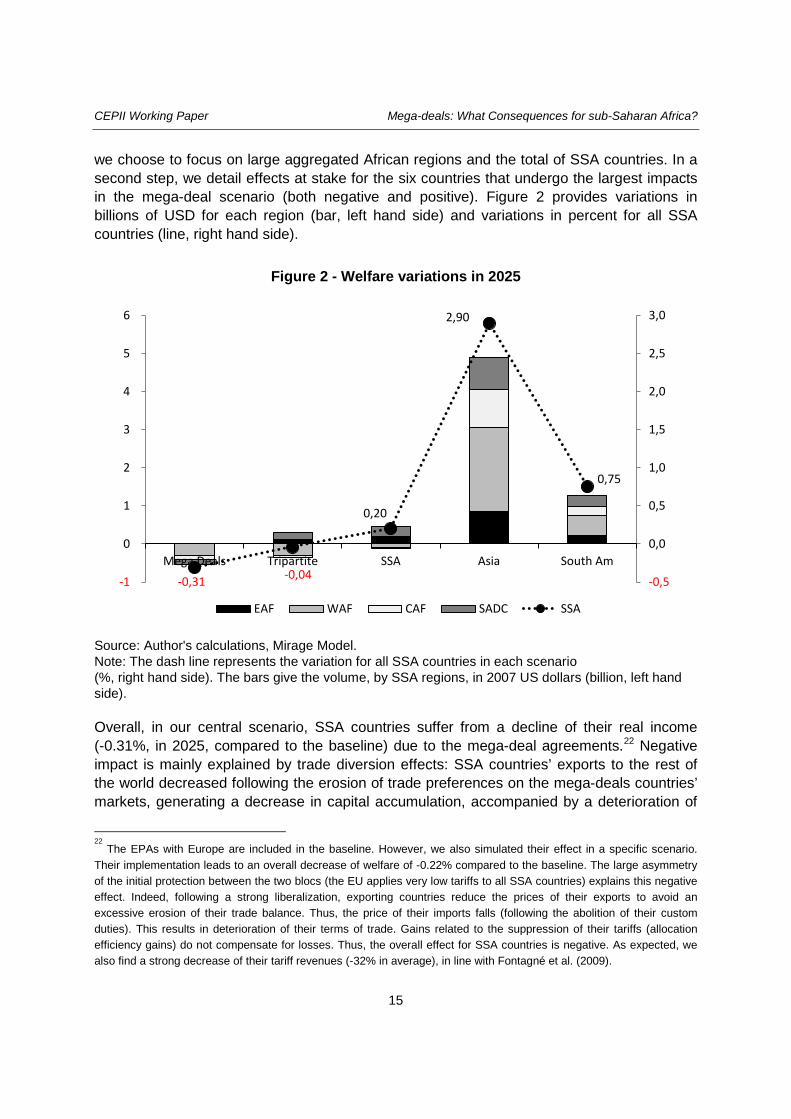
we choose to focus on large aggregated African regions and the total of SSA countries. In a second step, we detail effects at stake for the six countries that undergo the largest impacts in the mega-deal scenario (both negative and positive). Figure 2 provides variations in billions of USD for each region (bar, left hand side) and variations in percent for all SSA countries (line, right hand side).
Figure 2 - Welfare variations in 2025
Source: Author's calculations, Mirage Model. Note: The dash line represents the variation for all SSA countries in each scenario (%, right hand side). The bars give the volume, by SSA regions, in 2007 US dollars (billion, left hand side).
Overall, in our central scenario, SSA countries suffer from a decline of their real income (-0.31%, in 2025, compared to the baseline) due to the mega-deal agreements.22 Negative impact is mainly explained by trade diversion effects: SSA countries’ exports to the rest of the world decreased following the erosion of trade preferences on the mega-deals countries’ markets, generating a decrease in capital accumulation, accompanied by a deterioration of
22
The EPAs with Europe are included in the baseline. However, we also simulated their effect in a specific scenario. Their implementation leads to an overall decrease of welfare of -0.22% compared to the baseline. The large asymmetry of the initial protection between the two blocs (the EU applies very low tariffs to all SSA countries) explains this negative effect. Indeed, following a strong liberalization, exporting countries reduce the prices of their exports to avoid an excessive erosion of their trade balance. Thus, the price of their imports falls (following the abolition of their custom duties). This results in deterioration of their terms of trade. Gains related to the suppression of their tariffs (allocation efficiency gains) do not compensate for losses. Thus, the overall effect for SSA countries is negative. As expected, we also find a strong decrease of their tariff revenues (-32% in average), in line with Fontagné et al. (2009).
-0,31 -0,04
0,20
2,90
0,75
-0,5
0,0
0,5
1,0
1,5
2,0
2,5
3,0
-1
0
1
2
3
4
5
6
Mega Deals Tripartite SSA Asia South Am
EAF WAF CAF SADC SSA
CEPII Working Paper Mega-deals: What Consequences for sub-Saharan Africa?
16
terms of trade (lower export prices) to deal with this new competition. The latter implies changes in specialization that increase the negative effect, through losses in allocation efficiency.
The additional scenarios with African integration show two interesting aspects. On the one hand, the incapacity to offset losses due to the mega-deals with only an ambitious tripartite trade integration (-0.04%). On the other hand, the full integration in SSA countries exhibits positive real income gains (+0.2%), at the expenses of West African countries. The assumption of reducing non-tariff measures in the case of SSA can be seen as an extreme case of trade liberalization. However, it seems important to make that happen: reducing only customs duties does not allow fair competition against products that meet common standards.
Finally, the opening of trade with Asia (“SSA-ASIA”) helps counteracting all the negative effects associated with mega-deals (+2.9%). This liberalization scenario is the most promising for all SSA countries. Asia, and most likely China, India and ASEAN countries, are probably the partners with whom SSA countries could largely benefit from a trade agreement: not only they trade a lot with each other, but trade barriers remain important. The opening with South America (“SSA-SOUTHAM”) also provides positive gains for SSA as a whole (+0.75 pp), since exports to a few MERCOSUR countries are significant,
23 but remains
of second order compared to the scenario “SSA-ASIA”.
Aggregate results hide the heterogeneity at the country level. We now turn to individual variations, focusing on the three highest positive variations and the three largest losses (Table 4).
24
23
The main destination is Brazil that absorbed 2.4% of SSA exports in 2012 (rank 7th). 24
We chose to focus on variation (an alternative could be to look at changes in values) and to limit the interpretation of the results to 6 countries. We believe that the diversity we obtain is meaningful. For convenience, we omit composite regions as their construction remains subject to strong assumptions. See https://www.gtap.agecon.purdue.edu
CEPII Working Paper Mega-deals: What Consequences for sub-Saharan Africa?
17
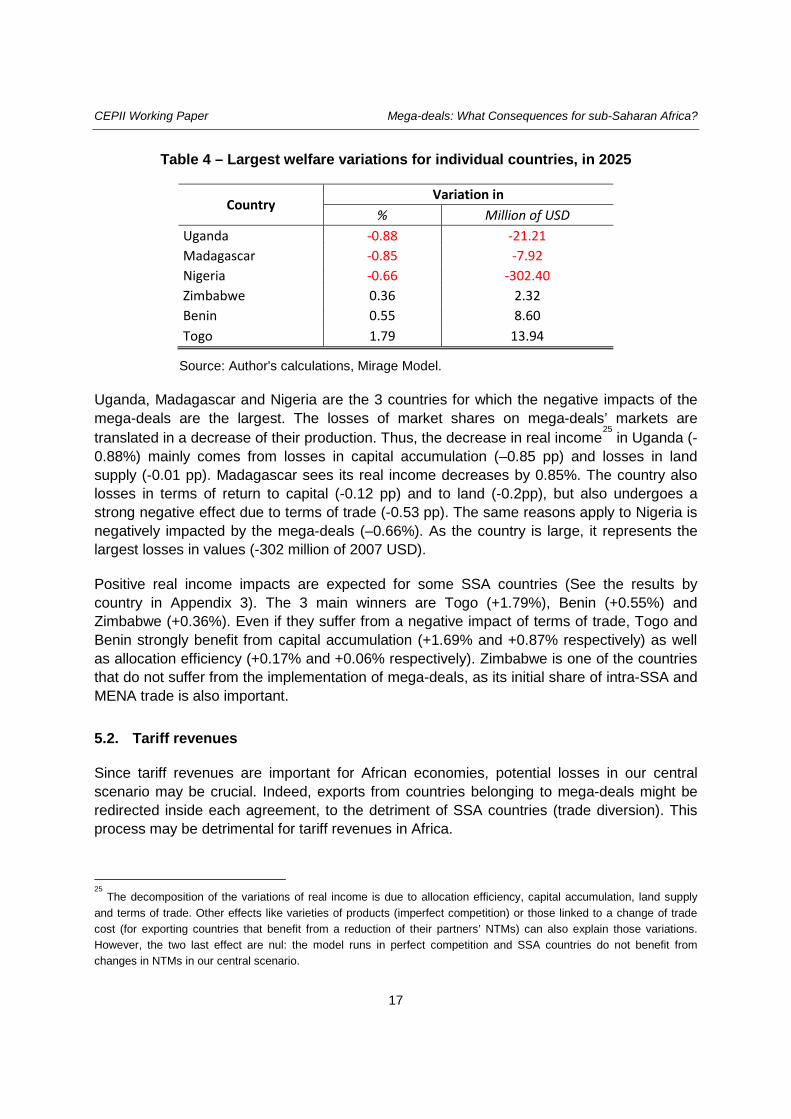
Table 4 – Largest welfare variations for individual countries, in 2025
Country Variation in
% Million of USD Uganda -0.88 -21.21 Madagascar -0.85 -7.92 Nigeria -0.66 -302.40 Zimbabwe 0.36 2.32 Benin 0.55 8.60 Togo 1.79 13.94
Source: Author's calculations, Mirage Model.
Uganda, Madagascar and Nigeria are the 3 countries for which the negative impacts of the mega-deals are the largest. The losses of market shares on mega-deals’ markets are translated in a decrease of their production. Thus, the decrease in real income
25 in Uganda (-
0.88%) mainly comes from losses in capital accumulation (–0.85 pp) and losses in land supply (-0.01 pp). Madagascar sees its real income decreases by 0.85%. The country also losses in terms of return to capital (-0.12 pp) and to land (-0.2pp), but also undergoes a strong negative effect due to terms of trade (-0.53 pp). The same reasons apply to Nigeria is negatively impacted by the mega-deals (–0.66%). As the country is large, it represents the largest losses in values (-302 million of 2007 USD).
Positive real income impacts are expected for some SSA countries (See the results by country in Appendix 3). The 3 main winners are Togo (+1.79%), Benin (+0.55%) and Zimbabwe (+0.36%). Even if they suffer from a negative impact of terms of trade, Togo and Benin strongly benefit from capital accumulation (+1.69% and +0.87% respectively) as well as allocation efficiency (+0.17% and +0.06% respectively). Zimbabwe is one of the countries that do not suffer from the implementation of mega-deals, as its initial share of intra-SSA and MENA trade is also important.
5.2. Tariff revenues
Since tariff revenues are important for African economies, potential losses in our central scenario may be crucial. Indeed, exports from countries belonging to mega-deals might be redirected inside each agreement, to the detriment of SSA countries (trade diversion). This process may be detrimental for tariff revenues in Africa.
25
The decomposition of the variations of real income is due to allocation efficiency, capital accumulation, land supply and terms of trade. Other effects like varieties of products (imperfect competition) or those linked to a change of trade cost (for exporting countries that benefit from a reduction of their partners’ NTMs) can also explain those variations. However, the two last effect are nul: the model runs in perfect competition and SSA countries do not benefit from changes in NTMs in our central scenario.
CEPII Working Paper Mega-deals: What Consequences for sub-Saharan Africa?
18
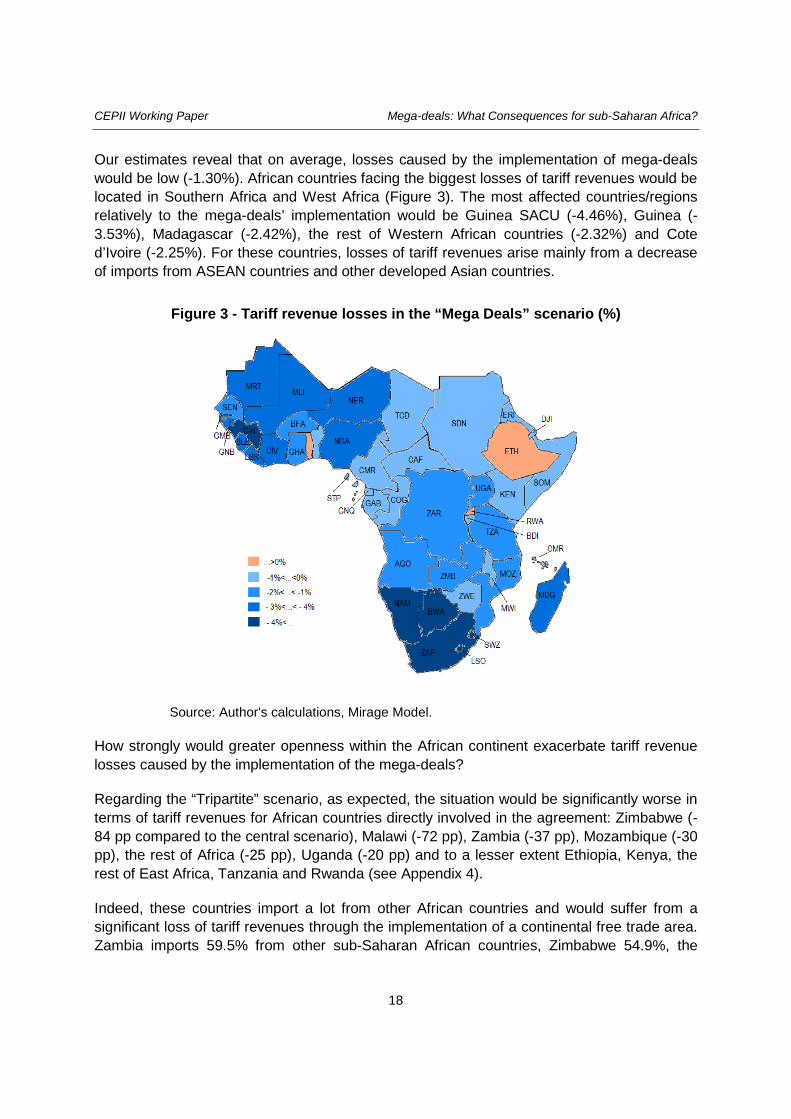
Our estimates reveal that on average, losses caused by the implementation of mega-deals would be low (-1.30%). African countries facing the biggest losses of tariff revenues would be located in Southern Africa and West Africa (Figure 3). The most affected countries/regions relatively to the mega-deals’ implementation would be Guinea SACU (-4.46%), Guinea (-3.53%), Madagascar (-2.42%), the rest of Western African countries (-2.32%) and Cote d’Ivoire (-2.25%). For these countries, losses of tariff revenues arise mainly from a decrease of imports from ASEAN countries and other developed Asian countries.
Figure 3 - Tariff revenue losses in the “Mega Deals” scenario (%)
Source: Author's calculations, Mirage Model.
How strongly would greater openness within the African continent exacerbate tariff revenue losses caused by the implementation of the mega-deals?
Regarding the “Tripartite” scenario, as expected, the situation would be significantly worse in terms of tariff revenues for African countries directly involved in the agreement: Zimbabwe (-84 pp compared to the central scenario), Malawi (-72 pp), Zambia (-37 pp), Mozambique (-30 pp), the rest of Africa (-25 pp), Uganda (-20 pp) and to a lesser extent Ethiopia, Kenya, the rest of East Africa, Tanzania and Rwanda (see Appendix 4).
Indeed, these countries import a lot from other African countries and would suffer from a significant loss of tariff revenues through the implementation of a continental free trade area. Zambia imports 59.5% from other sub-Saharan African countries, Zimbabwe 54.9%, the
CEPII Working Paper Mega-deals: What Consequences for sub-Saharan Africa?
19
Democratic Republic of Congo 44.2%, Malawi 43%, Mozambique 31.9%, Rwanda 31.7% and Uganda 17.8%.
For countries that keep a significant share of their tariff revenues despite the additional implementation of a continental free trade area, mainly West African countries (Benin, Cote d’Ivoire, Senegal, and Togo), the liberalization process with Asia would cancel almost all their remaining tariff revenues.
5.3. Trade
This section explores the effects of the mega-deals on African trade. Variations of global exports in each country for each scenario are provided in Appendix 4.
With the exception of Benin, Ethiopia, Rwanda and Togo, all SSA countries would experience a decrease of their exports to the rest of the world if mega-deals were implemented. However, export reductions following the realization of mega-deals are rather marginal (as a whole, SSA would suffer an export loss of 0.90 %).
The biggest loser in terms of exports would be Guinea (-2.79%). However, in value terms, SACU sees its exports decreased by 2.57 billions of USD (-1.46%), Nigeria ranks second and losses 2.05 billions of USD and the following individual country is Tanzania (-0.31 billions of USD equivalent to negative impact of -1.44%).The exports of SACU would mainly decrease to India (-9.5%, i.e. 1.03 billion), ASEAN (-8.58%, i.e. 0.48 billion) and China (-4.82%, i.e. 1 billion). Metal (-1.5 billion of USD), Chemistry (-0.7 billion) and Equipment (-0.5 billion) are the main impacted sectors for SACU. Those exports, originally destined to the EU, China and the USA, decline, due to the important competition of developed countries in those agreements (EU to the USA, Asian competition on Chinese market...). As for Nigeria, destinations for which exports fall are India (-14.05%, -8.08 billions), Mercosur (-7.64%, -1.54 billion) and the NAFTA (-0.59%, -0.53 billion). A large part of its losses is explained by a decrease of its exports in the energy sector to India (-14.07%) due to the competition of ASEAN countries which benefit from the elimination of tariffs and the reduction of NTMs in India (RECP). Tanzania experiences a much lower trade deviation, in value (0.31 billion, which represents a variation of -1.44%). It falls by -18.46% to ASEAN (0.18 billion), -13.89% to India (0.14 billion) and -4.68% to China (0.13 billion).
Looking at the “Tripartite” scenario we observe that for most of directly involved countries, the negative effect of mega-deals on their exports would be more than compensated by the tripartite free trade agreement (Ethiopia, Kenya, Malawi, Mozambique, SACU, Uganda, Zimbabwe, etc.), whereas the situation would be almost the same for other African countries. On the contrary, exports of sub-Saharan African countries excluded from the tripartite agreement would benefit significantly from a continental liberalization, while exports of the others would not vary widely.
CEPII Working Paper Mega-deals: What Consequences for sub-Saharan Africa?
20
6. Sensitivity analysis
6.1. Analysis
In this section, we test the robustness of our results to some choices we made in our central scenario (“Mega deals”). We only present results about welfare (Figure 4) which remains a synthetic indicator (Appendix 4 provides results at the country level in SSA).
Scenarios 1, 2, 3 and 4 quantify the impact of alternative assumptions regarding the trade policies implemented in the central scenario. To evaluate the consequences of the changes of NTMs, we perform two additional scenarios: scenario 1 (“NTMs 50%”) halves NTMs instead of reducing them by 25% and scenario 2 (“Tariffs Only”) only suppresses tariff barriers. To disentangle the potential effects of sensitive products (products that are excluded from the liberalization), scenario 3 (“Sensitive products”) starts from scenario 2 and considers the possibility, for each government, to use flexibilities when concluding a RTA, by excluding a list of products of tariff dismantlement. To define products as sensitive, we use the “90% of liberalized trade”
26 criteria as a definition of the “substantially all trade” used by
WTO to authorize RTAs between countries. To do so, we used a very simple method: exclude products that are subject to zero tariff, we sort bilateral trade at the HS6 product level by descending order. Then we exclude all HS6 lines from liberalization (their tariffs are kept constant) until the cumulative trade matches 10% of the total trade (consequently trade liberalization is applied on 90% of bilateral trade). Scenario 4 “NTMs spillovers” makes a simple assumption of spillovers effects of the creation of larges “unified” market within the mega-deals. Indeed, a greater compatibility regarding standards or norms between countries signing mega-deals may involve a greater facility (less costly) for third countries to export to those markets. Thus, to evaluate the consequences of such externality, we simply assume an ad hoc reduction of 5% of NTMs in countries taking part in the mega-deals vis-à-vis the rest of the world.
Scenario 5 (“Imperfect competition”) deals with modeling assumptions: we use an imperfect competition
27 set up for industrial sectors. The data for this modeling are relatively old and
difficult to update (especially for SSA countries), explaining why our central exercise exhibits perfect competition modeling. However, imperfect competition might enhance the impacts of trade liberalization.
26
We follow Fontagné et al. (2010) : “The ‘substantially all trade’ quantitative requirement is achieved here, following EU guidelines, considering 90% of bilateral trade in volume or 90% of tariff lines in the harmonized system (HS).” 27
See Bchir et al. (2002) for a description of modeling of imperfect competition in the Mirage model.
CEPII Working Paper Mega-deals: What Consequences for sub-Saharan Africa?
21
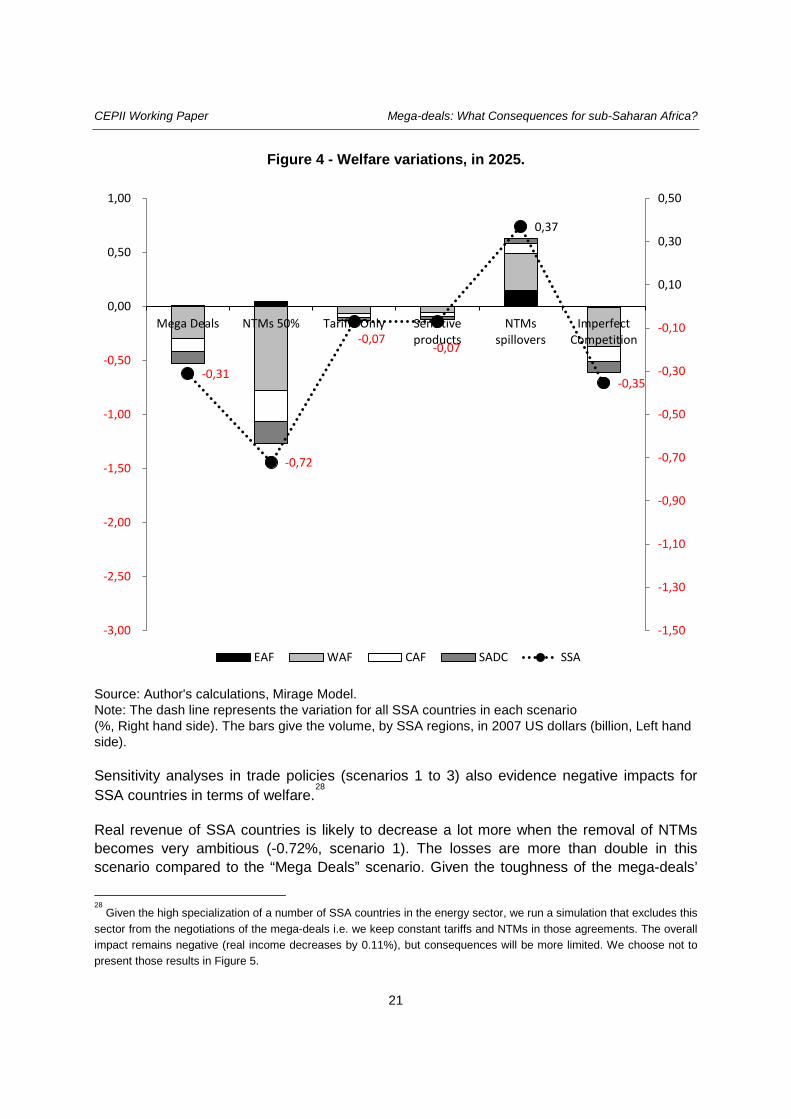
Figure 4 - Welfare variations, in 2025.
Source: Author's calculations, Mirage Model. Note: The dash line represents the variation for all SSA countries in each scenario (%, Right hand side). The bars give the volume, by SSA regions, in 2007 US dollars (billion, Left hand side).
Sensitivity analyses in trade policies (scenarios 1 to 3) also evidence negative impacts for SSA countries in terms of welfare.
28
Real revenue of SSA countries is likely to decrease a lot more when the removal of NTMs becomes very ambitious (-0.72%, scenario 1). The losses are more than double in this scenario compared to the “Mega Deals” scenario. Given the toughness of the mega-deals’
28
Given the high specialization of a number of SSA countries in the energy sector, we run a simulation that excludes this sector from the negotiations of the mega-deals i.e. we keep constant tariffs and NTMs in those agreements. The overall impact remains negative (real income decreases by 0.11%), but consequences will be more limited. We choose not to present those results in Figure 5.
-0,31
-0,72
-0,07 -0,07
0,37
-0,35
-1,50
-1,30
-1,10
-0,90
-0,70
-0,50
-0,30
-0,10
0,10
0,30
0,50
-3,00
-2,50
-2,00
-1,50
-1,00
-0,50
0,00
0,50
1,00
Mega Deals NTMs 50% Tariffs Only Sensitive products
NTMs spillovers
Imperfect Competition
EAF WAF CAF SADC SSA
CEPII Working Paper Mega-deals: What Consequences for sub-Saharan Africa?
22
negotiations (e.g. GMOs, hormones beef in the TTIP, rice or auto parts29
for Japan in the TTP), an ambitious cut in NTMs seems to be out of reach. However, this sensitivity analysis emphasizes the potential negative consequences of real trade integration within countries involved in the mega-deals, as of the integrated European market. In any case, it is clear that ambitious FTAs outside SSA countries, involving their export main destinations, may have large negative impacts on their economies. As an example, part of this additional integration in terms of NTMs can be thought as the 100% scanning between the EU and the USA in the TTIP negotiations (see Fontagné et al., 2013).
If the mega-deals only include provisions about tariffs (full removal), the negative impact on SSA countries will be limited (-0.07%, scenario 2). This scenario can be seen as the lower bound of the negative consequences of mega-deals on SSA countries. The rank of losses by large SSA regions is preserved, but at a much lower level. Besides, the countries involved in the mega-deals have much less to gain when negotiating only on tariff protection explaining why SSA countries loss less: less competition on the mega-deals’ markets is translated into a lower trade diversion and more favorable terms of trade.
When focusing only on tariffs, include sensitive products in the mega-deals does not change the overall picture. However, the aggregated welfare of SSA countries that goes down by 0.073% (scenario 3) is slightly more preferable to the consequences of the “Tariffs Only” scenario (-0.075%). The trade diversion is even less important in that case thanks to the products excluded from the negotiation, allowing SSA countries to still benefit from their preferential access on some agricultural products.
Assuming potential spillovers of mega-deals on third parties leads to positive results for SSA countries (+0.37%). Acting directly on production costs, the externality provides an additional effect on the real income of exporting countries (trade cost effect). Indeed, if we assume that relaxing this inefficiency is not going to reduce factor use, the released factors will help to produce other goods and services. In a dynamic perspective, this also allows a greater accumulation of capital, so the gain is growing beyond the direct cost constraints that were deleted. This is particularly the case for Nigeria (+0.58% of real income). We also perform a scenario in which NTMs against third countries are only cut by 2%. Results remain positive (+0.05% for SSA countries). As rough as they can be, those results show the necessity, for SSA countries, to follow up those large trade negotiations (for example on the modification of rules of origin).
The Imperfect Competition scenario leads to a greater negative impact for SSA countries. The aggregated welfare of the region declines by an additional 0.04 pp, compared to our central scenario. The design of the scenario that removes completely protection in agriculture and allows an important reduction of NTMs in this sector provides an important increase of
29
See: http://insidetrade.com/Inside-US-Trade/Inside-U.S.-Trade-10/03/2014/us-auto-parts-tariff-emerges-as-flashpoint-in-us-japan-tpp-talks/menu-id-710.html
CEPII Working Paper Mega-deals: What Consequences for sub-Saharan Africa?
23
agricultural and industrial production at the world level. However, SSA countries suffer more from the competition of other countries in this framework, especially in the industrial sectors.
6.2. Possible improvements
An important issue is the potential importance of informal cross-border trade (meaning trade flows not recorded in national statistics) between African countries. The extent of informal trade seems to be positively correlated with the costs associated with formal trade (duties applied, transaction costs coming from lengthy bureaucratic and administrative procedures, etc.), with the existence of quantitative restrictions on selected products, and with the extent of corruption at border points.
30
There are very few estimates of informal cross-border trade amounts between African countries. Most of international organisations, national authorities and academicians that attempted to quantify cross-border informal trade carried out border monitoring surveys. This methodology consists in recording at border points of a country all incoming and outgoing flows of products.
31 Some initiatives to evaluate the extent of informal cross-border trade
focused on agricultural products exchanged between selected country pairs. Nkendah (2013), for example, estimated the volume and the value of informal exports of agricultural and horticultural products
32 from Cameroon to its neighbors in 2008
33, and compares his
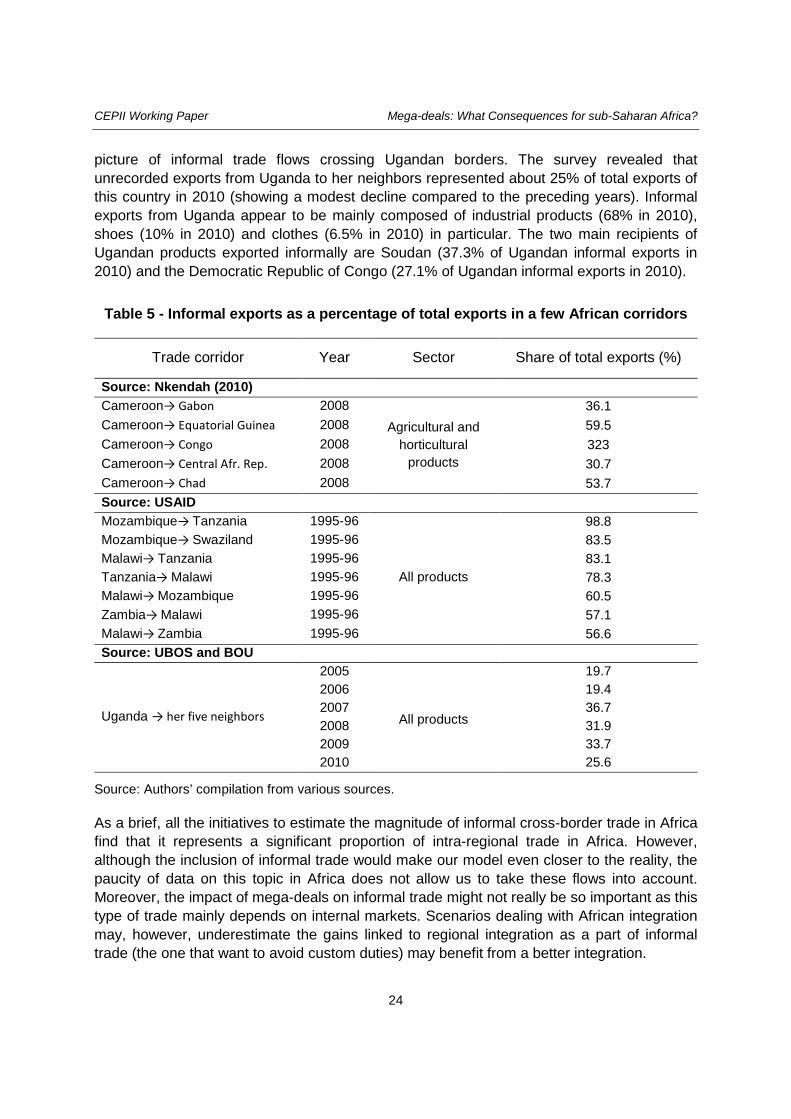
results with official statistics. According to his results, the value of informal exports of agricultural and horticultural products was almost equivalent (38 billions of CFAs) to the value of recorded outflows in this sector (39.5 billions). To put it another way, in this sector, informal exports represented about one half of total exports. The biggest destinations of informal trade were Equatorial Guinea and Chad, whose value of agricultural and horticultural products received via informal trade, exceeded the value of formal trade (see Table 5). Recent estimates of informal cross border trade of a few food commodities (maize, rice and beans) between Southern African countries (in volume) are also regularly published by Fews Net (Famine Early Warning Systems Network).
A series of technical papers published by USAID in 1997 give some information about total informal trade (in both agricultural and non-agricultural goods) between some Eastern and Southern African countries (Kenya-Uganda, Kenya-Tanzania, Tanzania-Mozambique, Tanzania-Zambia, Tanzania-Malawi, Malawi-Mozambique, etc.). According to these studies, total informal exports often represent a significant share of total exports (see Table 5). More recently, the Ugandan Bureau of Statistics (UBOS) and the Bank of Uganda (BOU) implemented the Informal Cross Border Trade (ICBT) Survey to have a more accurate
30
For an extensive presentation of the factors encouraging informal trade, see Lesser and Moisé-Leeman (2009). 31
As underlined by Lesser and Moisé-Leeman (2009), one of the limitations of this approach is that it only captures unrecorded trade flows going through official border points. 32
The author explains that informal trade includes mostly agricultural and horticultural commodities (more than manufactured products). 33
Investigations took place two weeks a month (weeks were selected randomly), all year long.
CEPII Working Paper Mega-deals: What Consequences for sub-Saharan Africa?
24
picture of informal trade flows crossing Ugandan borders. The survey revealed that unrecorded exports from Uganda to her neighbors represented about 25% of total exports of this country in 2010 (showing a modest decline compared to the preceding years). Informal exports from Uganda appear to be mainly composed of industrial products (68% in 2010), shoes (10% in 2010) and clothes (6.5% in 2010) in particular. The two main recipients of Ugandan products exported informally are Soudan (37.3% of Ugandan informal exports in 2010) and the Democratic Republic of Congo (27.1% of Ugandan informal exports in 2010).
Table 5 - Informal exports as a percentage of total exports in a few African corridors
Trade corridor Year Sector Share of total exports (%)
Source: Nkendah (2010) Cameroon→ Gabon 2008
Agricultural and horticultural
products
36.1 Cameroon→ Equatorial Guinea 2008 59.5 Cameroon→ Congo 2008 323 Cameroon→ Central Afr. Rep. 2008 30.7 Cameroon→ Chad 2008 53.7 Source: USAID Mozambique→ Tanzania 1995-96 98.8 Mozambique→ Swaziland 1995-96 83.5 Malawi→ Tanzania 1995-96 83.1 Tanzania→ Malawi 1995-96 All products 78.3 Malawi→ Mozambique 1995-96 60.5 Zambia→ Malawi 1995-96 57.1 Malawi→ Zambia 1995-96 56.6 Source: UBOS and BOU
Uganda → her five neighbors
2005
All products
19.7 2006 19.4 2007 36.7 2008 31.9 2009 33.7 2010 25.6
Source: Authors’ compilation from various sources.
As a brief, all the initiatives to estimate the magnitude of informal cross-border trade in Africa find that it represents a significant proportion of intra-regional trade in Africa. However, although the inclusion of informal trade would make our model even closer to the reality, the paucity of data on this topic in Africa does not allow us to take these flows into account. Moreover, the impact of mega-deals on informal trade might not really be so important as this type of trade mainly depends on internal markets. Scenarios dealing with African integration may, however, underestimate the gains linked to regional integration as a part of informal trade (the one that want to avoid custom duties) may benefit from a better integration.
CEPII Working Paper Mega-deals: What Consequences for sub-Saharan Africa?
25
7. Conclusion
An unprecedented wave of bilateral trade agreements involving major developed countries/areas (called mega-deals), from which sub-Saharan African countries are excluded, is being negotiated. Because large markets of Asia, North America and Europe remain the major destinations of African exports, this new integration process represents a major challenge for SSA economies. Using a CGEM, our results show that mega-deals, should they be implemented, would impact not only the signatory countries, but the entire world. Moreover, SSA countries would be the first losers.
The impact of each of these agreements depends on the participation of countries that are preferred destinations for African exports (Europe, China, United States), and also on the erosion of preferences linked to the increased competition of involved developing countries (trade diversion, e.g. with the RECP). It is therefore appropriate for African countries to follow-up the negotiations and to pay attention to decisions about mutual recognition of products or to the rules of origin potentially applied in these agreements. Indeed, unlike negotiations on tariffs, harmonization of non-tariff measures could (or not) enable them to benefit from facilities to export to previously less accessible destinations.
Moreover, an ambitious regional integration in Africa seems to be the key to counterbalance the negative consequences of mega-deals. This is already underway (African regional blocs, the Tripartite agreement, the Continental Free Trade Area), but it must be necessarily considered in an extended framework to limit trade diversion effects caused by the mega-deals.
Finally, the multilateralism card can also be another option: by relaunching the WTO machine with taking credible commitments, SSA countries could limit their exclusion from the world trade.
CEPII Working Paper Mega-deals: What Consequences for sub-Saharan Africa?
26
References
Bchir H., Y. Decreux, J.L. Guérin and S. Jean (2002), “MIRAGE, a Computable General Equilibrium Model for Trade Policy Analysis”, CEPII Working Paper, n°2002-17.
Bouët A., Y. Decreux, L. Fontagné, S. Jean and D. Laborde (2008), “Assessing applied protection across the world”, Review of International Economics, 16(5): 850-863.
Bouët, A. and D. Laborde (2010), “Why is the Doha Development Agenda Failing? And What Can Be Done? A Computable General Equilibrium–Game Theoretical Approach”, The World Economy, 33(11), 1486-1516.
Carrère, C. (2004), “African Regional Agreements: Impact on Trade with or Without Currency Unions”, Journal of African Economies, 13(2):199-239.
Decreux Y. and H. Valin (2007), “MIRAGE, Updated Version of the Model for Trade Policy Analysis: Focus on Agriculture and Dynamics”, CEPII Working Paper, n°2007-15.
Elbadawi, I. A. (1997), “The Impact of Regional Trade and Monetary Schemes on Intra-Sub-Saharan Africa trade”, in Ademola Oyejide, Ibrahim Elbadawi and Paul Collier (eds.), Regional Integration and Trade Liberalization in Sub-Saharan Africa.
Felbermayr, G., B. Heid and S. Lehwald (2013), “Transatlantic Trade and Investment Partnership (TTIP). Who benefit from a free trade deal?”.
Fontagné L., J. Gourdon and S. Jean (2013), “Transatlantic Trade: Whither Partnership, Which Economic Consequences?”, CEPII Policy Brief, n°1.
Fontagné L., D. Laborde and C. Mitaritonna (2011), “An Impact Study of the Economic Partnership Agreements in the Six ACP Regions”, Journal of African Economies, 20(2): 179-216.
Fontagné L., J. Fouré and M.P. Ramos (2013), “MIRAGE-e: A General Equilibrium Long-term Path of the World Economy”. CEPII Working Paper, n°2013-39.
François J., M. Manchin, H. Norberg, O. Pindyuk and P. Tomberger (2013), “Reducing Transatlantic Barriers to Trade and Investment: an Economic Assessment”, IIDE Discussion Papers, 20130401, Institue for International and Development Economics.
Gaulier G. and Zignago S. (2010), “BACI: International Trade Database at the Product-Level. The 1994-2007 Version”, CEPII Working Paper, n°2010-23.
Gouel, C., C. Mitaritonna and M.P. Ramos (2011), “Sensitive products in the Doha negotiations: The case of European and Japanese market access”, Economic Modelling, vol. 28(6), 2395-2403.
CEPII Working Paper Mega-deals: What Consequences for sub-Saharan Africa?
27
Guimbard, H., S. Jean, M. Mimouni, and X. Pichot (2012), “MacMap-HS6 2007, an exhaustive and consistent measure of applied protection in 2007”, International Economics, Q2, p99-122.
Laborde, D. and H. Valin ( 2012), "Modeling Land-Use Changes in a Global CGE: Assessing the EU Biofuel Mandates with the Mirage-BioF Model”, Climate Change Economics , Vol. 3(03), 1250017-1-1.
Lesser, C. and E. Moisé-Leeman (2009), “Informal Cross-Border Trade and Trade acilitation Reform in Sub-Saharan Africa”, OECD Trade Policy Working Papers, n°86, OECD Publishing.
Nkendah, R. (2013), “The Informal Cross-Border Trade of agricultural commodities between Cameroon and its CEMAC Neighbours”, Food Policy, Vol.41, p.133-144.
Petri, P. and M.G. Plummer (2012), “The Trans-Pacific Partnership and Asia-Pacific Integration: Policy Implications”, Policy Brief 12-16, Peterson Institute for International Economics Policy Brief.
Rollo, J., P. Holmes, S. Henson., M. Mendez Parra, S. Ollerenshaw, J. Lopez Gonzalez, X. Cirera and M. Sandi (2013), “Potential effects of the Proposed Transatlantic Trade and Investment Partnership on Selected Developing Countries”, CARIS and University of Sussex for the Department for International Development.
Turkson E.F. (2012), “Trade Agreements and Bilateral Trade in Sub-Saharan Africa: Estimating the Trade Effects of the EU-ACP TPA and RTAs”, CREDIT Research Paper 12/07, Nottingham School of Economics, University of Nottingham.
Uganda Bureau of Statistics (2008), “The Informal Cross-Border Trade Survey Report 2007”, Uganda Bureau of Statistics, Kampala.
Uganda Bureau of Statistics (2011), “The Informal Cross-Border Trade Survey Report 2009-2010”, Uganda Bureau of Statistics, Kampala.
Yang, Y. and S. Gupta (2005), “Regional Trade Arrangements in Africa: Past Performance and the Way Forward”, IMF Working Paper, WP/05/36.
CEPII Working Paper Mega-deals: What Consequences for sub-Saharan Africa?
28
Appendix A - Glossary
ACP Africa Caribbean and Pacific AEC African Economic Community AGOA African Growth and Opportunity Act APEC Asia-Pacific Economic Cooperation ASEAN Association of South East Asian Nations CES Constant Elasticity of Substitution CGEM Computable General Equilibrium Model DDA Doha Development Agenda EAC East African Community EBA Everything But Arms ECOWAS Economic Community Of West African States EFTA European Free Trade Association EPA Economic Partnership Agreements FTA Free Trade Agreement GSP Generalised System of Preferences GTAP GlobalTrade Analysis ICBT Informal Cross Border Trade MD Mega Deals MFN Most Favored Nation MIRAGE Modelling International Relationships in Applied General Equilibrium NTM Non-Tariff Measures RCEP Regional Comprehensive Economic Partnership REC Regional Economic Community RTA Regional Trade Agreement SACU Southern African Custom Union SADC Southern African Development Community SDT Special and Differentiated Treatment SSA Sub-Saharan Africa TFP Total Factor Productivity TTIP Transatlantic Trade and Investment Partnership TTP Trans-Pacific Partnership WTO World Trade Organization
CEPII Working Paper Mega-deals: What Consequences for sub-Saharan Africa?
29
Appendix B - Countries /country groups included in the model and regional classification
Geographical aggregation Code Countries/country groups included Asia
Oceania Oceania Australia (AUS), New Zealand (NZL), Rest of Oceania (XOC)
China and Hong-Kong ChinaHK China (CHN), Hong-Kong (HKG)
Japan Japan Japan (JPN)
Developed Asian countries Dvpd_Asia Republic of Korea (KOR), Taiwan (TWN)
Rest of Asian developing countries RestDvpgA
Mongolia (MNG), Rest of East Asia (XEA), Bangladesh (BGD), Nepal (NPL), Pakistan (PAK), Sri Lanka (LKA), Rest of south Asia (XSA), Rest of North America (XNA), Rest of the world (XTW)
ASEAN ASEAN
Cambodia (KHM), Indonesia (IDN), Lao People’s Democratic Republic (LAO), Malaysia (MYS), Philippines (PHL), Singapore (SGP), Thailand (THA), Viet Nam (VNM), Rest of Southeast Asia (XSE)
India India India (IND)
North America
Nafta Nafta Canada (CAN), United-States of America (USA), Mexico (MEX)
South America
Mercosur Mercosur Argentina (ARG), Brazil (BRA), Chile (CHL), Paraguay (PRY), Uruguay (URY)
Latin American countries LAC
Plurinational Republic of Bolivia (BOL), Colombia (COL), Ecuador (ECU), Peru (PER), Venezuela (VEN), Rest of South America (XSM), Costa Rica (CRI), Guatemala (GTM), Honduras (HND), Nicaragua (NIC), Panama (PAN), El Salvador (SLV), Rest of Central America (XCA), Caribbean (XCB)
Europe Europe
European Union EU27
Austria (AUT), Belgium (BEL), Cyprus (CYP), Czech Republic (CZE), Denmark (DNK), Estonia (EST), Finland (FIN), France (FRA), Germany (DEU), Greece (GRC), Hungary (HUN), Ireland (IRL), Italy (ITA), Latvia (LVA), Lithuania (LTU), Luxemburg (LUX), Malta (MLT), Netherlands (NLD), Poland (POL), Portugal (PRT), Slovakia
CEPII Working Paper Mega-deals: What Consequences for sub-Saharan Africa?
30
(SVK), Slovenia (SVN), Spain (ESP), Sweden (SWE), United-Kingdom (GBR)
EFTA EFTA Switzerland (CHE), Norway (NOR), Rest of EFTA (XEF)
Rus
Other European countries OtherEur
Albania (ALB), Belarus (BLR), Croatia (HRV), Russian Federation (RUS), Ukraine (UKR), Rest of Eastern Europe (XEE), Rest of Europe (XER), Kazakhstan (KAZ), Kyrgyz Republic (KGZ), Rest of Soviet Former Union (XSU), Armenia (ARM), Azerbaijan (AZE); Georgia (GEO), Turkey (TUR)
North Africa and Middle East
Middle East countries MiddleEast
Bahrain (BHR), Ismalic Republic of Iran (IRN), Israel (ISR), Kuwait (KWT), Oman (OMN), Qatar (QAT), Saudi Arabia (SAU), United Arab Emirates (ARE), Rest of Western Asia (XWS)
North African countries NorthAfr Egypt (EGY), Morocco (MAR), Tunisia (TUN), Rest of North Africa (XNF)
Africa Benin Benin Benin (BEN)
Burkina Faso Burkina Burkina Faso (BFA)
Cameroon Cameroon Cameroon (CMR)
Cote d’Ivoire CoteIV Cote d’Ivoire (CIV)
Ghana Ghana Ghana (GHA)
Guinea Guinea Guinea (GIN)
Nigeria Nigeria Nigeria (NGA)
Senegal Senegal Senegal (SEN)
Togo Togo Togo (TGO)
Rest of Western Africa Rest_Waf (XWF)
Cape Verde (CPV), the Gambia (GMB), Liberia (LBR), Mali (MLI), Mauritania (MRT), Niger (NER), Guinea Bissau (GNB), Sierra Leone (SLE)
Central Africa Central_Af (XCF)
Central African Republic (CAF), Gabon (GAB), Sao Tome & Principe (STP), Chad (TCD), Republic of Congo (COG), Equatorial Guinea (GNQ)
Ethiopia Ethiopia Ethiopia (ETH)
Kenya Kenya Kenya (KEN)
Madagascar Madagascar Madagascar (MDG)
Malawi Malawi Malawi (MWI)
CEPII Working Paper Mega-deals: What Consequences for sub-Saharan Africa?
31
Mauritius Mauritius Mauritius (MUS)
Mozambique Mozambique Mozambique (MOZ)
Rwanda Rwanda Rwanda (RWA)
United Republic of Tanzania Tanzania United Republic of Tanzania (TZA)
Uganda Uganda Uganda (UGA)
Zambia Zambia Zambia (ZMB)
Zimbabwe Zimbabwe Zimbabwe (ZWE)
Rest of Eastern African countries Rest_Eaf (XEC)
Fm. Sudan (SDN), Eritrea (ERI), Djibouti (DJI), Somalia (SOM), Burundi (BDI), Comoros (COM)
SACU SACU Botswana (BWA), Lesotho (LSO), Namibia (NAM), South Africa (ZAF), Swaziland (SWZ)
South Central Africa Rest_Af (XAC)
Angola (AGO), Democratic Republic of Congo (ZAR)
Appendix C - Sectoral aggregation used in the model
Mirage sector GTAP Code GTAP label
Primary
Cereals pdr Paddy rice wht Wheat gro Cereal grains nec
Vegagr v f Vegetables. fruit. nuts
osd Oil seeds
Sugarcane c b Sugar cane. sugar beet
Fibers pfb Plant-based fibers
Cropsnec
ocr Crops nec
AnimAgr
ctl Cattle.sheep.goats.horses
oap Animal products nec
rmk Raw milk
wol Wool. silk-worm cocoons
Forestry
frs Forestry Fishing
fsh Fishing Meat cmt Meat: cattle.sheep.goats.horse
Meatprod omt Meat products nec
Food
vol Vegetable oils and fats
mil Dairy products
pcr Processed rice
sgr Sugar
ofd Food products nec
b t Beverages and tobacco products
CEPII Working Paper Mega-deals: What Consequences for sub-Saharan Africa?
32
Energy
PrimEne
coa Coal oil Oil gas Gas ely Electricity gdt Gas manufacture. distribution
Secondary Minerals omn Minerals nec
Clothing tex Textiles
wap Wearing apparel lea Leather products
OthManuf lum Wood products
ppp Paper products. publishing
omf Manufactures nec
SecEner p c Petroleum. coal products
Chemistry crp Chemical.rubber.plastic prods
Metals nmm Mineral products nec
i s Ferrous metals nfm Metals nec
Vehicles mvh Motor vehicles and parts
otn Transport equipment nec Electronic ele Electronic equipment Equipment ome Machinery and equipment nec
Mirage sector GTAP Code GTAP label
Tertiary
Services
wtr Water cns Construction trd Trade cmn Communication ofi Financial services nec isr Insurance obs Business services nec ros Recreation and other services osg PubAdmin/Defence/Health/Educat dwe Dwellings
Transport otp Transport nec wtp Sea transport atp Air transport
CEPII Working Paper Mega-deals: What Consequences for sub-Saharan Africa?
33
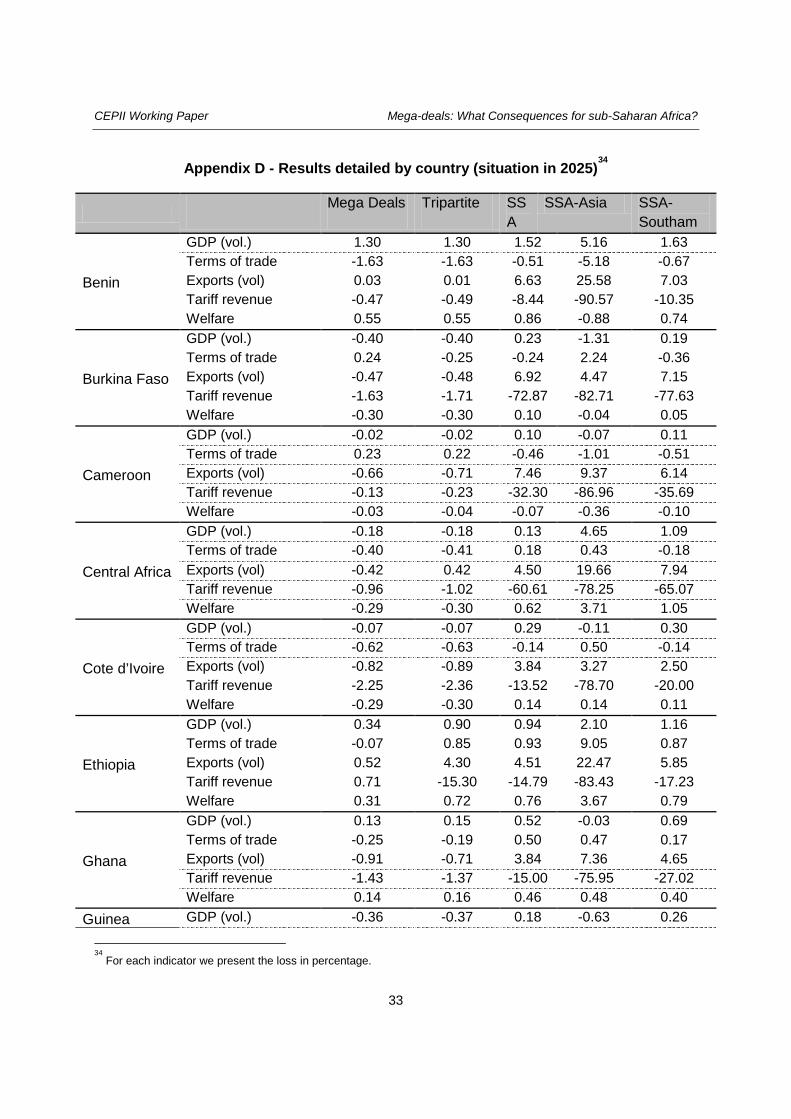
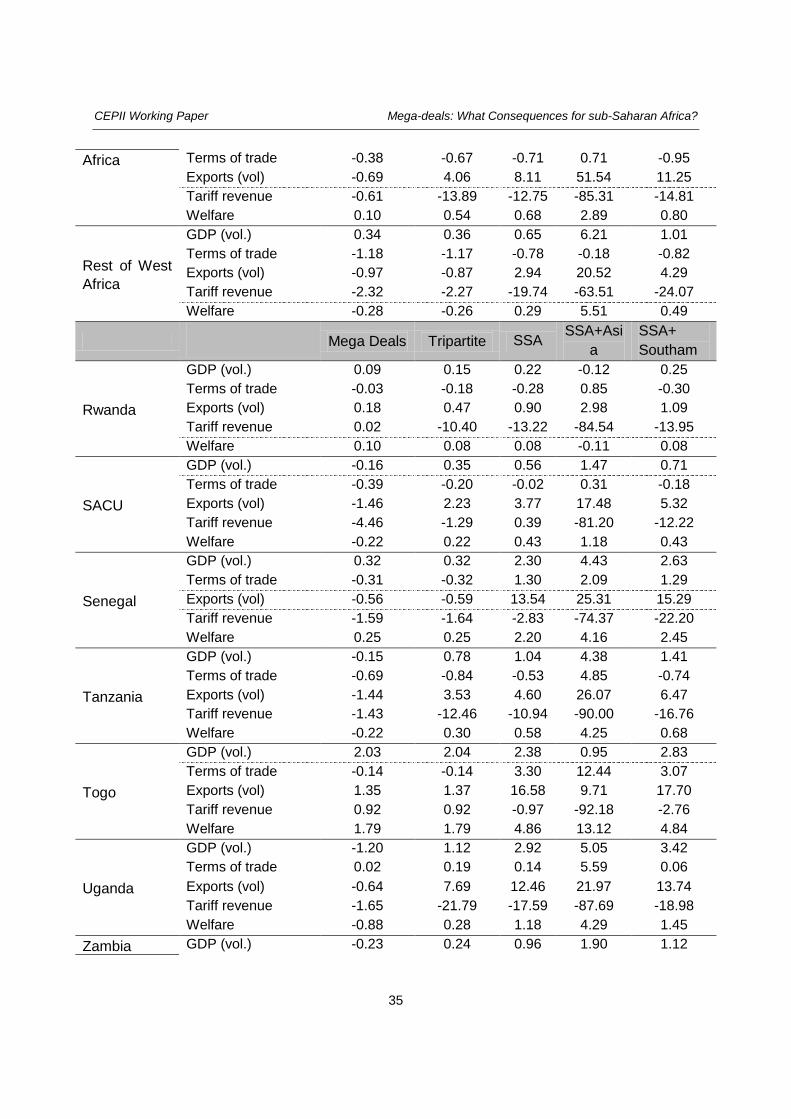
Appendix D - Results detailed by country (situation in 2025)34
Mega Deals Tripartite SS
A SSA-Asia SSA-
Southam
Benin
GDP (vol.) 1.30 1.30 1.52 5.16 1.63 Terms of trade -1.63 -1.63 -0.51 -5.18 -0.67 Exports (vol) 0.03 0.01 6.63 25.58 7.03 Tariff revenue -0.47 -0.49 -8.44 -90.57 -10.35 Welfare 0.55 0.55 0.86 -0.88 0.74
Burkina Faso
GDP (vol.) -0.40 -0.40 0.23 -1.31 0.19 Terms of trade 0.24 -0.25 -0.24 2.24 -0.36 Exports (vol) -0.47 -0.48 6.92 4.47 7.15 Tariff revenue -1.63 -1.71 -72.87 -82.71 -77.63 Welfare -0.30 -0.30 0.10 -0.04 0.05
Cameroon
GDP (vol.) -0.02 -0.02 0.10 -0.07 0.11 Terms of trade 0.23 0.22 -0.46 -1.01 -0.51 Exports (vol) -0.66 -0.71 7.46 9.37 6.14 Tariff revenue -0.13 -0.23 -32.30 -86.96 -35.69 Welfare -0.03 -0.04 -0.07 -0.36 -0.10
Central Africa
GDP (vol.) -0.18 -0.18 0.13 4.65 1.09 Terms of trade -0.40 -0.41 0.18 0.43 -0.18 Exports (vol) -0.42 0.42 4.50 19.66 7.94 Tariff revenue -0.96 -1.02 -60.61 -78.25 -65.07 Welfare -0.29 -0.30 0.62 3.71 1.05
Cote d’Ivoire
GDP (vol.) -0.07 -0.07 0.29 -0.11 0.30 Terms of trade -0.62 -0.63 -0.14 0.50 -0.14 Exports (vol) -0.82 -0.89 3.84 3.27 2.50 Tariff revenue -2.25 -2.36 -13.52 -78.70 -20.00 Welfare -0.29 -0.30 0.14 0.14 0.11
Ethiopia
GDP (vol.) 0.34 0.90 0.94 2.10 1.16 Terms of trade -0.07 0.85 0.93 9.05 0.87 Exports (vol) 0.52 4.30 4.51 22.47 5.85 Tariff revenue 0.71 -15.30 -14.79 -83.43 -17.23 Welfare 0.31 0.72 0.76 3.67 0.79
Ghana
GDP (vol.) 0.13 0.15 0.52 -0.03 0.69 Terms of trade -0.25 -0.19 0.50 0.47 0.17 Exports (vol) -0.91 -0.71 3.84 7.36 4.65 Tariff revenue -1.43 -1.37 -15.00 -75.95 -27.02 Welfare 0.14 0.16 0.46 0.48 0.40
Guinea GDP (vol.) -0.36 -0.37 0.18 -0.63 0.26
34
For each indicator we present the loss in percentage.
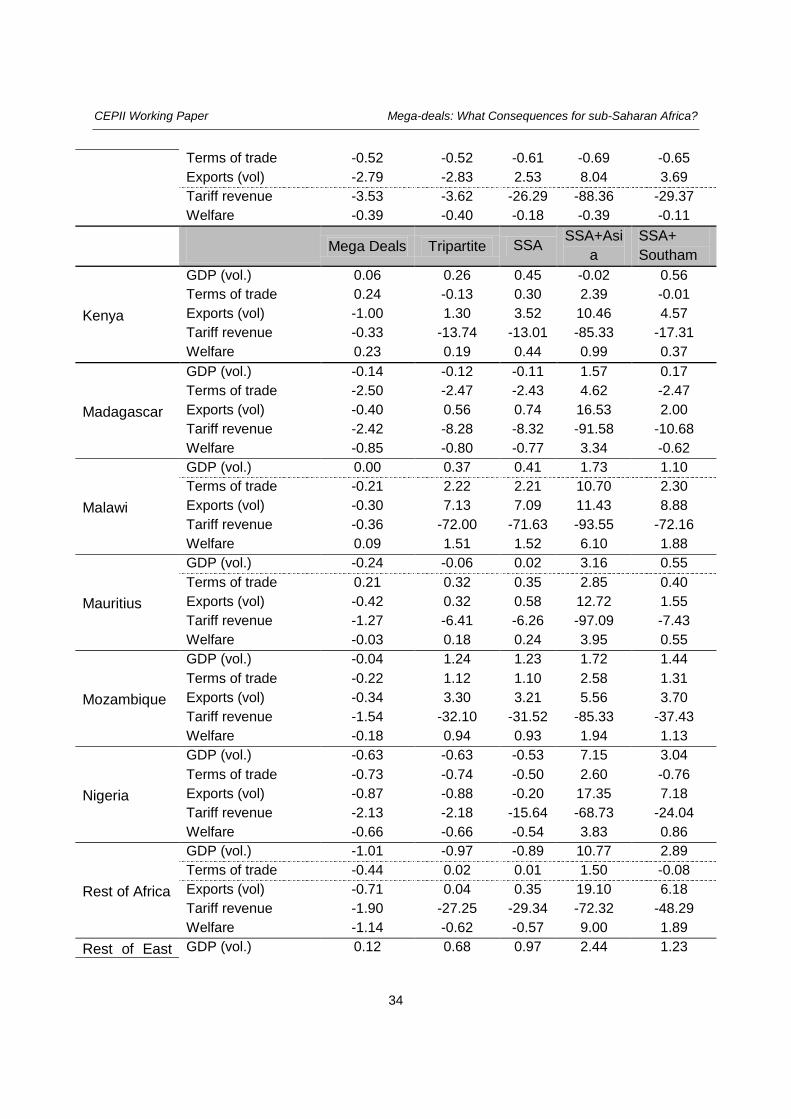
CEPII Working Paper Mega-deals: What Consequences for sub-Saharan Africa?
34
Terms of trade -0.52 -0.52 -0.61 -0.69 -0.65 Exports (vol) -2.79 -2.83 2.53 8.04 3.69 Tariff revenue -3.53 -3.62 -26.29 -88.36 -29.37 Welfare -0.39 -0.40 -0.18 -0.39 -0.11
Mega Deals
Tripartite SSA SSA+Asia
SSA+ Southam
Kenya
GDP (vol.) 0.06 0.26 0.45 -0.02 0.56 Terms of trade 0.24 -0.13 0.30 2.39 -0.01 Exports (vol) -1.00 1.30 3.52 10.46 4.57 Tariff revenue -0.33 -13.74 -13.01 -85.33 -17.31 Welfare 0.23 0.19 0.44 0.99 0.37
Madagascar
GDP (vol.) -0.14 -0.12 -0.11 1.57 0.17 Terms of trade -2.50 -2.47 -2.43 4.62 -2.47 Exports (vol) -0.40 0.56 0.74 16.53 2.00 Tariff revenue -2.42 -8.28 -8.32 -91.58 -10.68 Welfare -0.85 -0.80 -0.77 3.34 -0.62
Malawi
GDP (vol.) 0.00 0.37 0.41 1.73 1.10 Terms of trade -0.21 2.22 2.21 10.70 2.30 Exports (vol) -0.30 7.13 7.09 11.43 8.88 Tariff revenue -0.36 -72.00 -71.63 -93.55 -72.16 Welfare 0.09 1.51 1.52 6.10 1.88
Mauritius
GDP (vol.) -0.24 -0.06 0.02 3.16 0.55 Terms of trade 0.21 0.32 0.35 2.85 0.40 Exports (vol) -0.42 0.32 0.58 12.72 1.55 Tariff revenue -1.27 -6.41 -6.26 -97.09 -7.43 Welfare -0.03 0.18 0.24 3.95 0.55
Mozambique
GDP (vol.) -0.04 1.24 1.23 1.72 1.44 Terms of trade -0.22 1.12 1.10 2.58 1.31 Exports (vol) -0.34 3.30 3.21 5.56 3.70 Tariff revenue -1.54 -32.10 -31.52 -85.33 -37.43 Welfare -0.18 0.94 0.93 1.94 1.13
Nigeria
GDP (vol.) -0.63 -0.63 -0.53 7.15 3.04 Terms of trade -0.73 -0.74 -0.50 2.60 -0.76 Exports (vol) -0.87 -0.88 -0.20 17.35 7.18 Tariff revenue -2.13 -2.18 -15.64 -68.73 -24.04 Welfare -0.66 -0.66 -0.54 3.83 0.86
Rest of Africa
GDP (vol.) -1.01 -0.97 -0.89 10.77 2.89 Terms of trade -0.44 0.02 0.01 1.50 -0.08 Exports (vol) -0.71 0.04 0.35 19.10 6.18 Tariff revenue -1.90 -27.25 -29.34 -72.32 -48.29 Welfare -1.14 -0.62 -0.57 9.00 1.89
Rest of East GDP (vol.) 0.12 0.68 0.97 2.44 1.23
CEPII Working Paper Mega-deals: What Consequences for sub-Saharan Africa?
35
Africa Terms of trade -0.38 -0.67 -0.71 0.71 -0.95 Exports (vol) -0.69 4.06 8.11 51.54 11.25 Tariff revenue -0.61 -13.89 -12.75 -85.31 -14.81 Welfare 0.10 0.54 0.68 2.89 0.80
Rest of West Africa
GDP (vol.) 0.34 0.36 0.65 6.21 1.01 Terms of trade -1.18 -1.17 -0.78 -0.18 -0.82 Exports (vol) -0.97 -0.87 2.94 20.52 4.29 Tariff revenue -2.32 -2.27 -19.74 -63.51 -24.07 Welfare -0.28 -0.26 0.29 5.51 0.49
Mega Deals
Tripartite SSA SSA+Asia
SSA+ Southam
Rwanda
GDP (vol.) 0.09 0.15 0.22 -0.12 0.25 Terms of trade -0.03 -0.18 -0.28 0.85 -0.30 Exports (vol) 0.18 0.47 0.90 2.98 1.09 Tariff revenue 0.02 -10.40 -13.22 -84.54 -13.95 Welfare 0.10 0.08 0.08 -0.11 0.08
SACU
GDP (vol.) -0.16 0.35 0.56 1.47 0.71 Terms of trade -0.39 -0.20 -0.02 0.31 -0.18 Exports (vol) -1.46 2.23 3.77 17.48 5.32 Tariff revenue -4.46 -1.29 0.39 -81.20 -12.22 Welfare -0.22 0.22 0.43 1.18 0.43
Senegal
GDP (vol.) 0.32 0.32 2.30 4.43 2.63 Terms of trade -0.31 -0.32 1.30 2.09 1.29 Exports (vol) -0.56 -0.59 13.54 25.31 15.29 Tariff revenue -1.59 -1.64 -2.83 -74.37 -22.20 Welfare 0.25 0.25 2.20 4.16 2.45
Tanzania
GDP (vol.) -0.15 0.78 1.04 4.38 1.41 Terms of trade -0.69 -0.84 -0.53 4.85 -0.74 Exports (vol) -1.44 3.53 4.60 26.07 6.47 Tariff revenue -1.43 -12.46 -10.94 -90.00 -16.76 Welfare -0.22 0.30 0.58 4.25 0.68
Togo
GDP (vol.) 2.03 2.04 2.38 0.95 2.83 Terms of trade -0.14 -0.14 3.30 12.44 3.07 Exports (vol) 1.35 1.37 16.58 9.71 17.70 Tariff revenue 0.92 0.92 -0.97 -92.18 -2.76 Welfare 1.79 1.79 4.86 13.12 4.84
Uganda
GDP (vol.) -1.20 1.12 2.92 5.05 3.42 Terms of trade 0.02 0.19 0.14 5.59 0.06 Exports (vol) -0.64 7.69 12.46 21.97 13.74 Tariff revenue -1.65 -21.79 -17.59 -87.69 -18.98 Welfare -0.88 0.28 1.18 4.29 1.45
Zambia GDP (vol.) -0.23 0.24 0.96 1.90 1.12
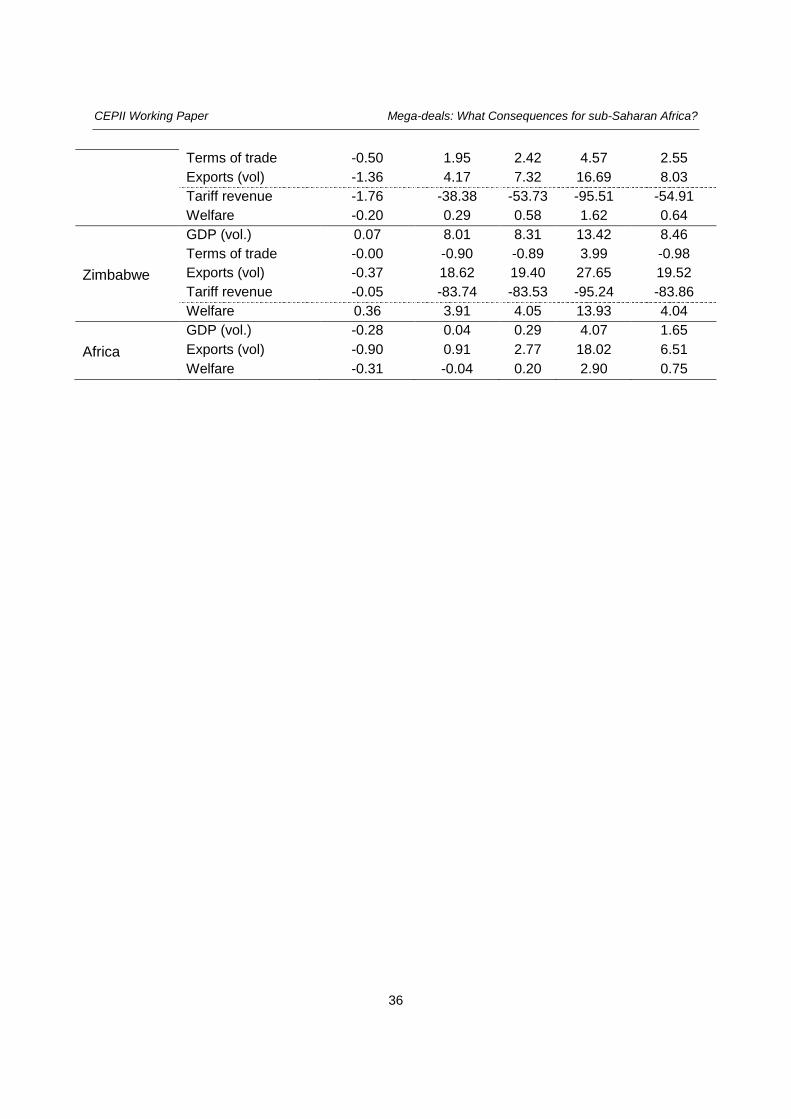
CEPII Working Paper Mega-deals: What Consequences for sub-Saharan Africa?
36
Terms of trade -0.50 1.95 2.42 4.57 2.55 Exports (vol) -1.36 4.17 7.32 16.69 8.03 Tariff revenue -1.76 -38.38 -53.73 -95.51 -54.91 Welfare -0.20 0.29 0.58 1.62 0.64
Zimbabwe
GDP (vol.) 0.07 8.01 8.31 13.42 8.46 Terms of trade -0.00 -0.90 -0.89 3.99 -0.98 Exports (vol) -0.37 18.62 19.40 27.65 19.52 Tariff revenue -0.05 -83.74 -83.53 -95.24 -83.86 Welfare 0.36 3.91 4.05 13.93 4.04
GDP (vol.) -0.28 0.04 0.29 4.07 1.65 Africa Exports (vol) -0.90 0.91 2.77 18.02 6.51 Welfare -0.31 -0.04 0.20 2.90 0.75
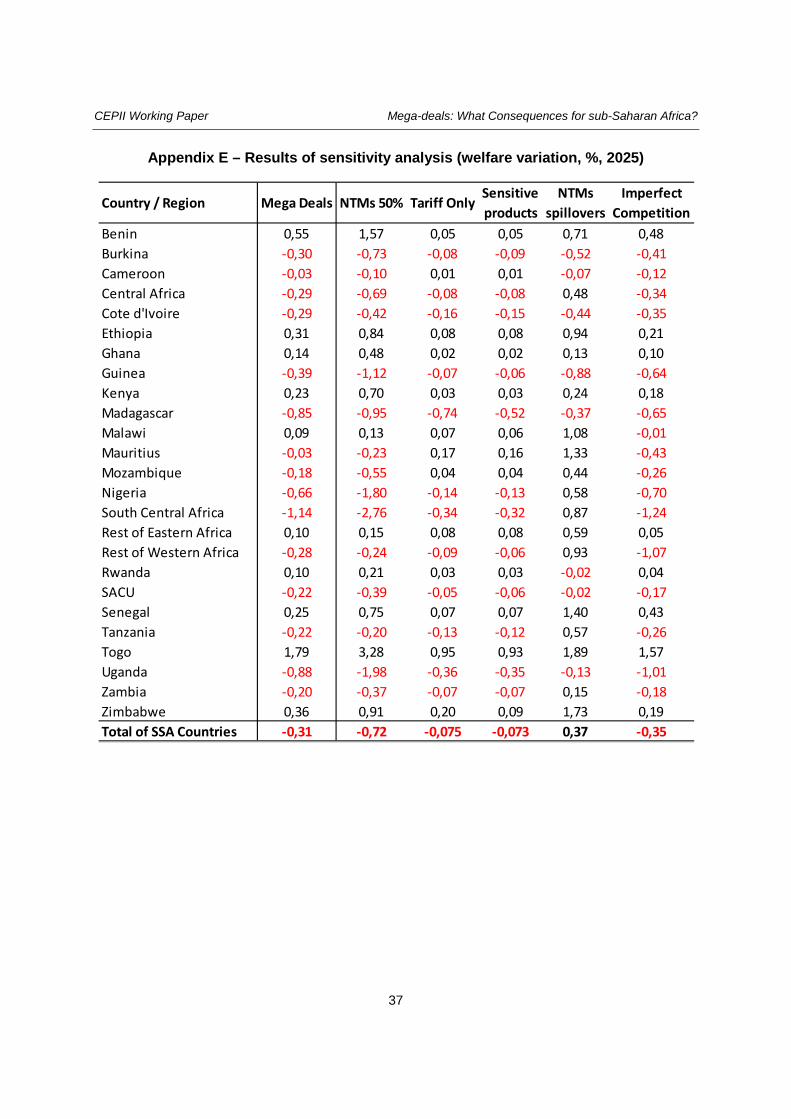
CEPII Working Paper Mega-deals: What Consequences for sub-Saharan Africa?
37
Appendix E – Results of sensitivity analysis (welfare variation, %, 2025)
Country / Region Mega Deals NTMs 50% Tariff OnlySensitive products
NTMs spillovers
Imperfect Competition
Benin 0,55 1,57 0,05 0,05 0,71 0,48 Burkina -0,30 -0,73 -0,08 -0,09 -0,52 -0,41 Cameroon -0,03 -0,10 0,01 0,01 -0,07 -0,12 Central Africa -0,29 -0,69 -0,08 -0,08 0,48 -0,34 Cote d'Ivoire -0,29 -0,42 -0,16 -0,15 -0,44 -0,35 Ethiopia 0,31 0,84 0,08 0,08 0,94 0,21 Ghana 0,14 0,48 0,02 0,02 0,13 0,10 Guinea -0,39 -1,12 -0,07 -0,06 -0,88 -0,64 Kenya 0,23 0,70 0,03 0,03 0,24 0,18 Madagascar -0,85 -0,95 -0,74 -0,52 -0,37 -0,65 Malawi 0,09 0,13 0,07 0,06 1,08 -0,01 Mauritius -0,03 -0,23 0,17 0,16 1,33 -0,43 Mozambique -0,18 -0,55 0,04 0,04 0,44 -0,26 Nigeria -0,66 -1,80 -0,14 -0,13 0,58 -0,70 South Central Africa -1,14 -2,76 -0,34 -0,32 0,87 -1,24 Rest of Eastern Africa 0,10 0,15 0,08 0,08 0,59 0,05 Rest of Western Africa -0,28 -0,24 -0,09 -0,06 0,93 -1,07 Rwanda 0,10 0,21 0,03 0,03 -0,02 0,04 SACU -0,22 -0,39 -0,05 -0,06 -0,02 -0,17 Senegal 0,25 0,75 0,07 0,07 1,40 0,43 Tanzania -0,22 -0,20 -0,13 -0,12 0,57 -0,26 Togo 1,79 3,28 0,95 0,93 1,89 1,57 Uganda -0,88 -1,98 -0,36 -0,35 -0,13 -1,01 Zambia -0,20 -0,37 -0,07 -0,07 0,15 -0,18 Zimbabwe 0,36 0,91 0,20 0,09 1,73 0,19 Total of SSA Countries -0,31 -0,72 -0,075 -0,073 0,37 -0,35
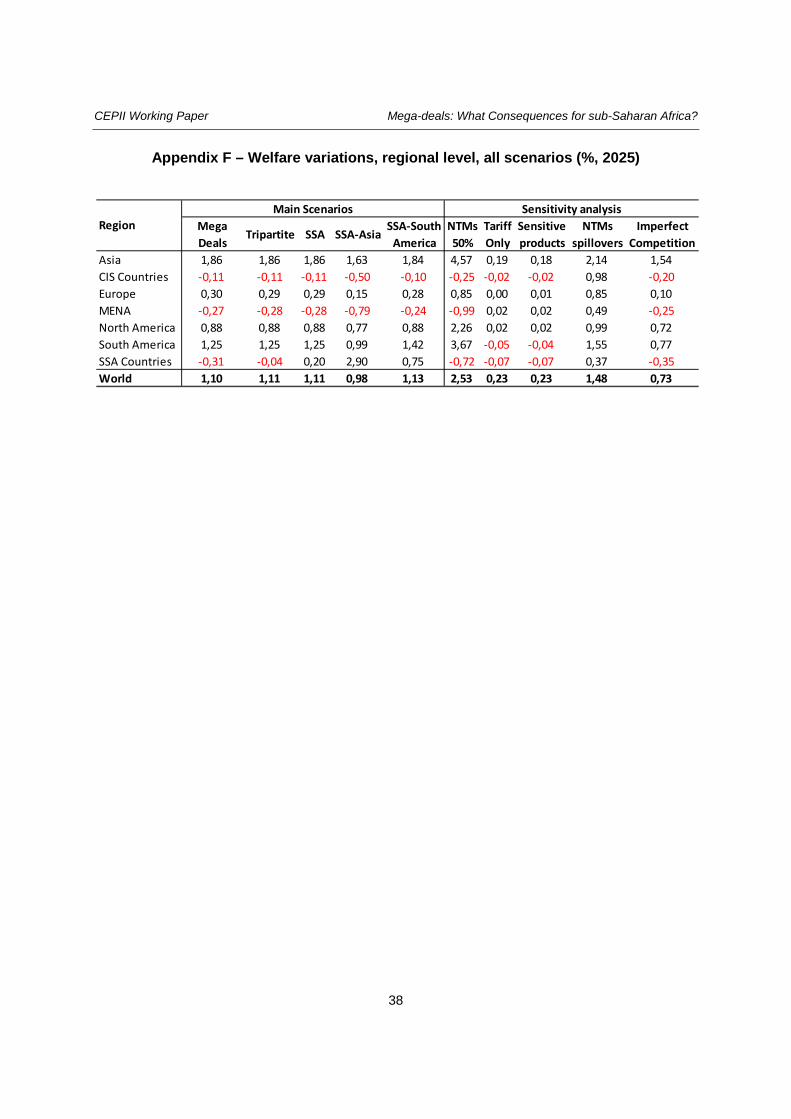
CEPII Working Paper Mega-deals: What Consequences for sub-Saharan Africa?
38
Appendix F – Welfare variations, regional level, all scenarios (%, 2025)
Mega Deals
Tripartite SSA SSA-AsiaSSA-South
AmericaNTMs 50%
Tariff Only
Sensitive products
NTMs spillovers
Imperfect Competition
Asia 1,86 1,86 1,86 1,63 1,84 4,57 0,19 0,18 2,14 1,54CIS Countries -0,11 -0,11 -0,11 -0,50 -0,10 -0,25 -0,02 -0,02 0,98 -0,20 Europe 0,30 0,29 0,29 0,15 0,28 0,85 0,00 0,01 0,85 0,10MENA -0,27 -0,28 -0,28 -0,79 -0,24 -0,99 0,02 0,02 0,49 -0,25 North America 0,88 0,88 0,88 0,77 0,88 2,26 0,02 0,02 0,99 0,72South America 1,25 1,25 1,25 0,99 1,42 3,67 -0,05 -0,04 1,55 0,77SSA Countries -0,31 -0,04 0,20 2,90 0,75 -0,72 -0,07 -0,07 0,37 -0,35 World 1,10 1,11 1,11 0,98 1,13 2,53 0,23 0,23 1,48 0,73
Main Scenarios Sensitivity analysisRegion