Embed Size (px)
DESCRIPTION
Results from The Physiological Society's Member survey conducted in Spring 2013
Citation preview
Membership survey 2013
Membership survey 2013
Contents
1 Executive summary 1
2 Methodology 3
3 Respondents 4
3.1 Respondents by membership category 5
3.2 Professional background 6
3.3 Age range 6
3.4 Geographical spread 7
3.5 Comments and suggestions 8
4 Membership 9
4.1 Society activities 10
4.2 Perceptions of membership 11
4.3 Perceptions of The Society 12
4.4 Comments and suggestions 13
Membership survey 2013
5 Communications 14
5.1 The Society online 15
5.2 Social media 16
5.3 Email newsletter 18
5.4 Physiology News 19
6 Society journals 22
6.1 Comments and suggestions 25
7 Scientific meetings 26
8 Science policy 30
9 Next steps 33
The Physiological Society is a company limited by guarantee. Registered in England and Wales, No. 323575.
Registered Office: Hodgkin Huxley House, 30 Farringdon Lane, London EC1R 3AW, UK. Registered Charity No. 211585.
‘The Physiological Society’ and the Physiological Society logo are trademarks belonging to The Physiological Society and are registered in the UK and in the EU respectively.
Membership survey 2013
1
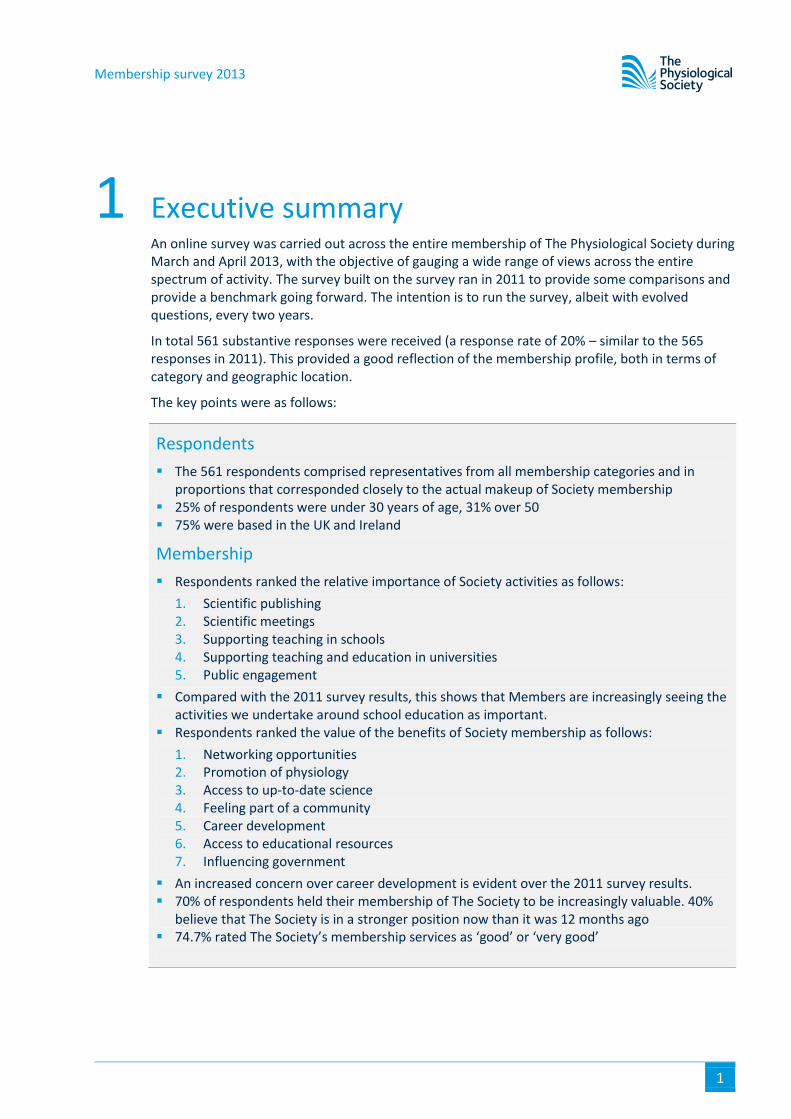
1 Executive summary An online survey was carried out across the entire membership of The Physiological Society during March and April 2013, with the objective of gauging a wide range of views across the entire spectrum of activity. The survey built on the survey ran in 2011 to provide some comparisons and provide a benchmark going forward. The intention is to run the survey, albeit with evolved questions, every two years.
In total 561 substantive responses were received (a response rate of 20% – similar to the 565 responses in 2011). This provided a good reflection of the membership profile, both in terms of category and geographic location.
The key points were as follows:
Respondents
The 561 respondents comprised representatives from all membership categories and in proportions that corresponded closely to the actual makeup of Society membership
25% of respondents were under 30 years of age, 31% over 50 75% were based in the UK and Ireland
Membership
Respondents ranked the relative importance of Society activities as follows:
1. Scientific publishing 2. Scientific meetings 3. Supporting teaching in schools 4. Supporting teaching and education in universities 5. Public engagement
Compared with the 2011 survey results, this shows that Members are increasingly seeing the activities we undertake around school education as important.
Respondents ranked the value of the benefits of Society membership as follows:
1. Networking opportunities 2. Promotion of physiology 3. Access to up-to-date science 4. Feeling part of a community 5. Career development 6. Access to educational resources 7. Influencing government
An increased concern over career development is evident over the 2011 survey results. 70% of respondents held their membership of The Society to be increasingly valuable. 40%
believe that The Society is in a stronger position now than it was 12 months ago 74.7% rated The Society’s membership services as ‘good’ or ‘very good’
Membership survey 2013
2
Communications
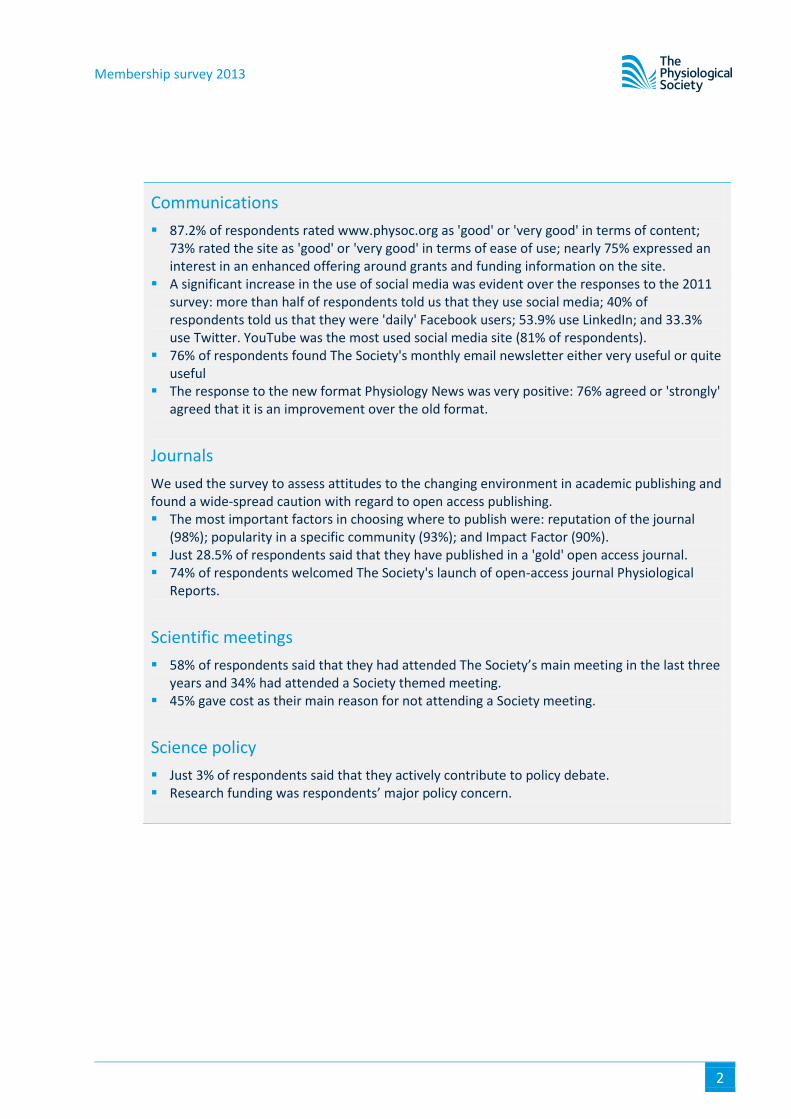
87.2% of respondents rated www.physoc.org as 'good' or 'very good' in terms of content; 73% rated the site as 'good' or 'very good' in terms of ease of use; nearly 75% expressed an interest in an enhanced offering around grants and funding information on the site.
A significant increase in the use of social media was evident over the responses to the 2011 survey: more than half of respondents told us that they use social media; 40% of respondents told us that they were 'daily' Facebook users; 53.9% use LinkedIn; and 33.3% use Twitter. YouTube was the most used social media site (81% of respondents).
76% of respondents found The Society's monthly email newsletter either very useful or quite useful
The response to the new format Physiology News was very positive: 76% agreed or 'strongly' agreed that it is an improvement over the old format.
Journals
We used the survey to assess attitudes to the changing environment in academic publishing and found a wide-spread caution with regard to open access publishing. The most important factors in choosing where to publish were: reputation of the journal
(98%); popularity in a specific community (93%); and Impact Factor (90%). Just 28.5% of respondents said that they have published in a 'gold' open access journal. 74% of respondents welcomed The Society's launch of open-access journal Physiological
Reports.
Scientific meetings
58% of respondents said that they had attended The Society’s main meeting in the last three years and 34% had attended a Society themed meeting.
45% gave cost as their main reason for not attending a Society meeting.
Science policy
Just 3% of respondents said that they actively contribute to policy debate. Research funding was respondents’ major policy concern.
Membership survey 2013
3
2 Methodology In March and April 2013 a survey was distributed to all categories of membership, via the Survey Monkey website. The survey is reproduced in Annex 1. Recipients were not obliged to respond to every section. In total, 561 responses were received, representing nearly 20% of total membership. Thanks must be given to all those Members, whether Honorary, Ordinary, Affiliate or Associate, who kindly contributed to the survey. Without their assistance we would not have had such a wealth of material.
Figures given in the results refer to all respondents as a whole unless otherwise stated.
Two prizes (iPad Minis) were offered to encourage responses: the winners were selected at random from those responding. Entries that merely returned name and addresses without responding to any section were excluded from the results and response count.
Analysis was carried out to cover:
total responses; Age groups – under 30s and over 50s; and analysis of comments in text boxes – these were reviewed in light of the response to the main
question and considered according to the balance of the overall response.
Membership survey 2013
4
3 Respondents
Key points 561 respondents, representing 17.5% of the total membership 57% of respondents were Ordinary Members and 28% Affiliates 94.7% of respondents were active in research – 47% of whom were also engaged in teaching 25% of respondents were under 30 years of age, 31% over 50 75% were based in the UK and Ireland
Membership survey 2013
5
3.1 Respondents by membership category
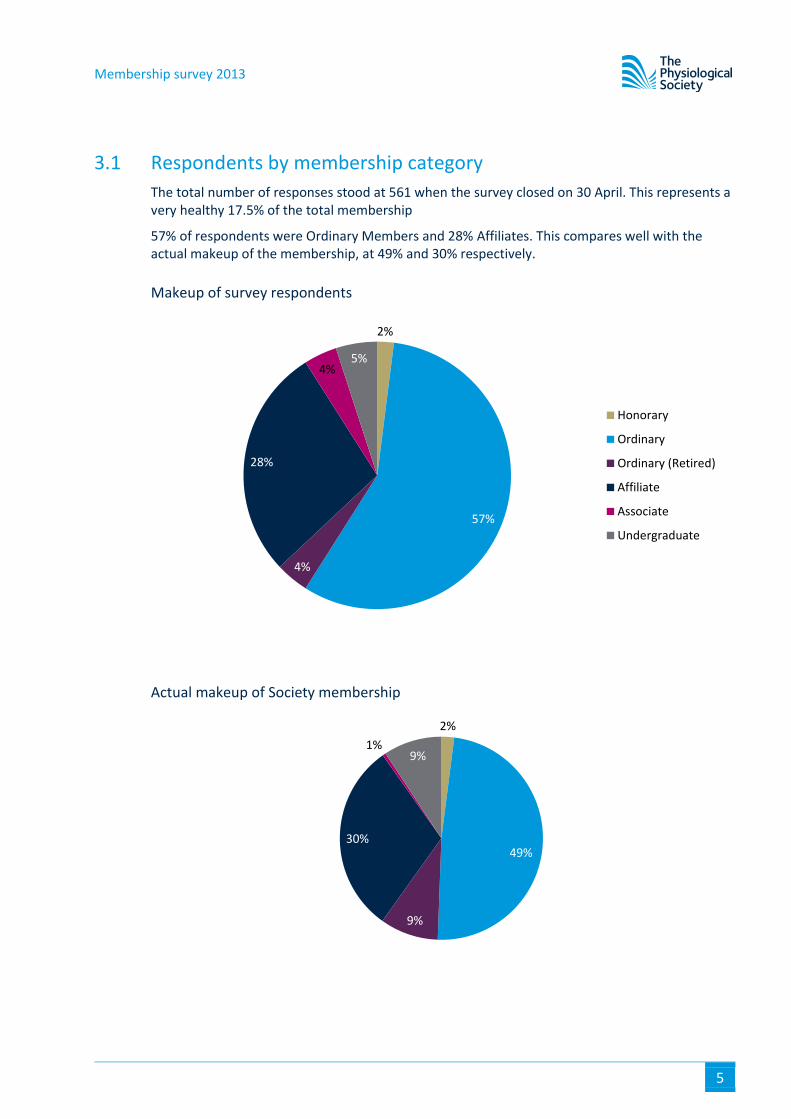
The total number of responses stood at 561 when the survey closed on 30 April. This represents a very healthy 17.5% of the total membership
57% of respondents were Ordinary Members and 28% Affiliates. This compares well with the actual makeup of the membership, at 49% and 30% respectively.
Makeup of survey respondents
Actual makeup of Society membership
2%
57%
4%
28%
4% 5%
Honorary
Ordinary
Ordinary (Retired)
Affiliate
Associate
Undergraduate
2%
49%
9%
30%
1% 9%
Membership survey 2013
6
3.2 Professional background
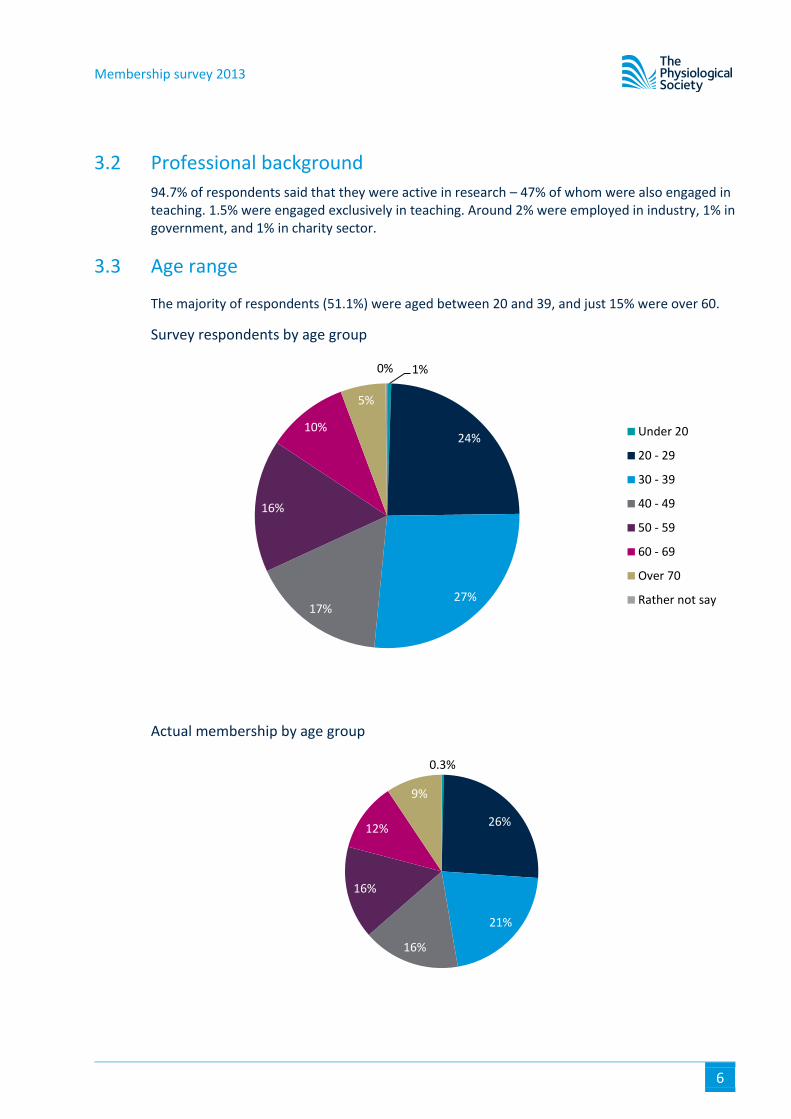
94.7% of respondents said that they were active in research – 47% of whom were also engaged in teaching. 1.5% were engaged exclusively in teaching. Around 2% were employed in industry, 1% in government, and 1% in charity sector.
3.3 Age range
The majority of respondents (51.1%) were aged between 20 and 39, and just 15% were over 60.
Survey respondents by age group
Actual membership by age group
1%
24%
27% 17%
16%
10%
5%
0%
Under 20
20 - 29
30 - 39
40 - 49
50 - 59
60 - 69
Over 70
Rather not say
0.3%
26%
21%
16%
16%
12%
9%
Membership survey 2013
7
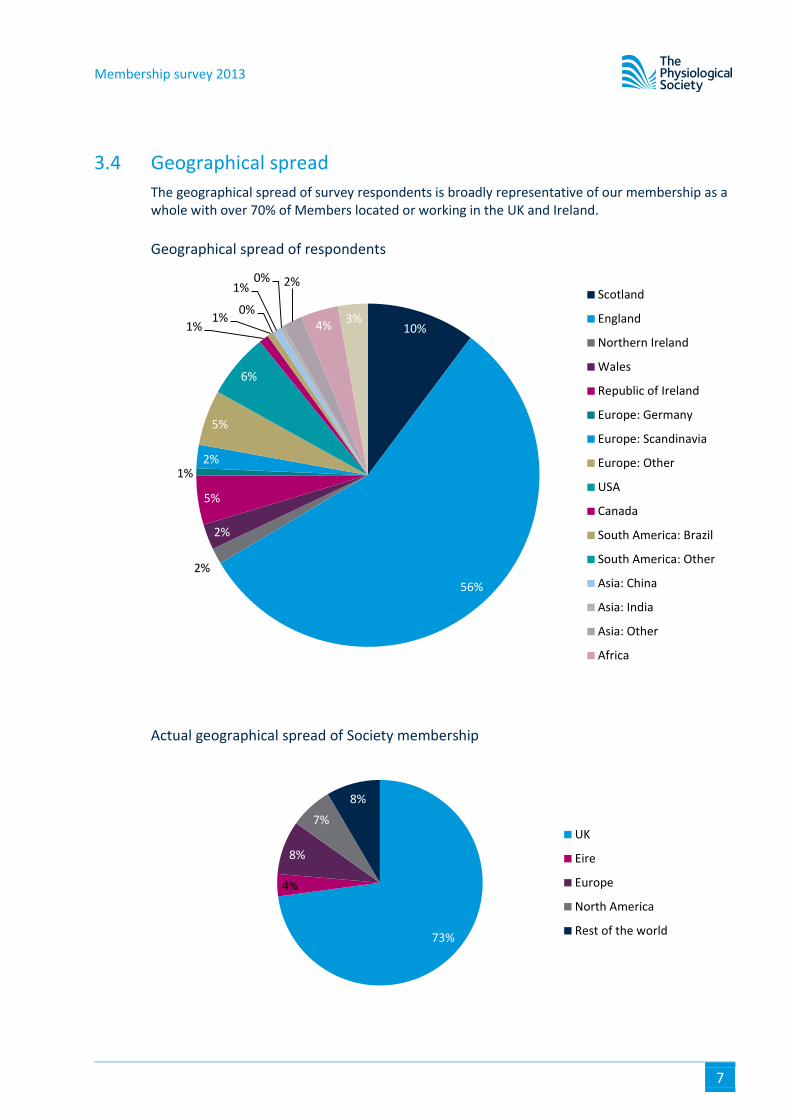
3.4 Geographical spread
The geographical spread of survey respondents is broadly representative of our membership as a whole with over 70% of Members located or working in the UK and Ireland.
Geographical spread of respondents
Actual geographical spread of Society membership
10%
56%
2%
2%
5%
1% 2%
5%
6%
1% 1%
0%
1% 0% 2%
4% 3%
Scotland
England
Northern Ireland
Wales
Republic of Ireland
Europe: Germany
Europe: Scandinavia
Europe: Other
USA
Canada
South America: Brazil
South America: Other
Asia: China
Asia: India
Asia: Other
Africa
73%
4%
8%
7%
8%
UK
Eire
Europe
North America
Rest of the world
Membership survey 2013
8
3.5 Comments and suggestions
66 respondents (11% of the total number of survey respondents) provided general comments/suggestions. These will be passed to the relevant departments for consideration. Some examples:
“The mentoring scheme of The Society should be extended to members outside the UK.”
“The administration of the Society has enlarged and strengthened greatly over the past decade and it is vital that the administration is constantly aware that it exists for the Members and not vice versa.”
“Small grants for early-career researchers to generate pilot data for larger applications would be very helpful.”
“The meetings are too glossy and expensive. Better to not provide expensive trimmings but enable scientists with a low budget for travel costs to attend more frequent meetings that are relevant.”
“The Physiological Society should consider 'disability' an additional criteria for providing scholarships to the faculty members from developing countries.”
“The ‘departmental rep’ system needs complete overhaul. It fails particularly when Members of The Society are distributed over different parts of a large institution.”
“It would be very useful to encourage and advertise summer placements or even 1–2 week long placements throughout the year at different labs where undergraduates could get a taster of life in a lab.”
Membership survey 2013
9
4 Membership
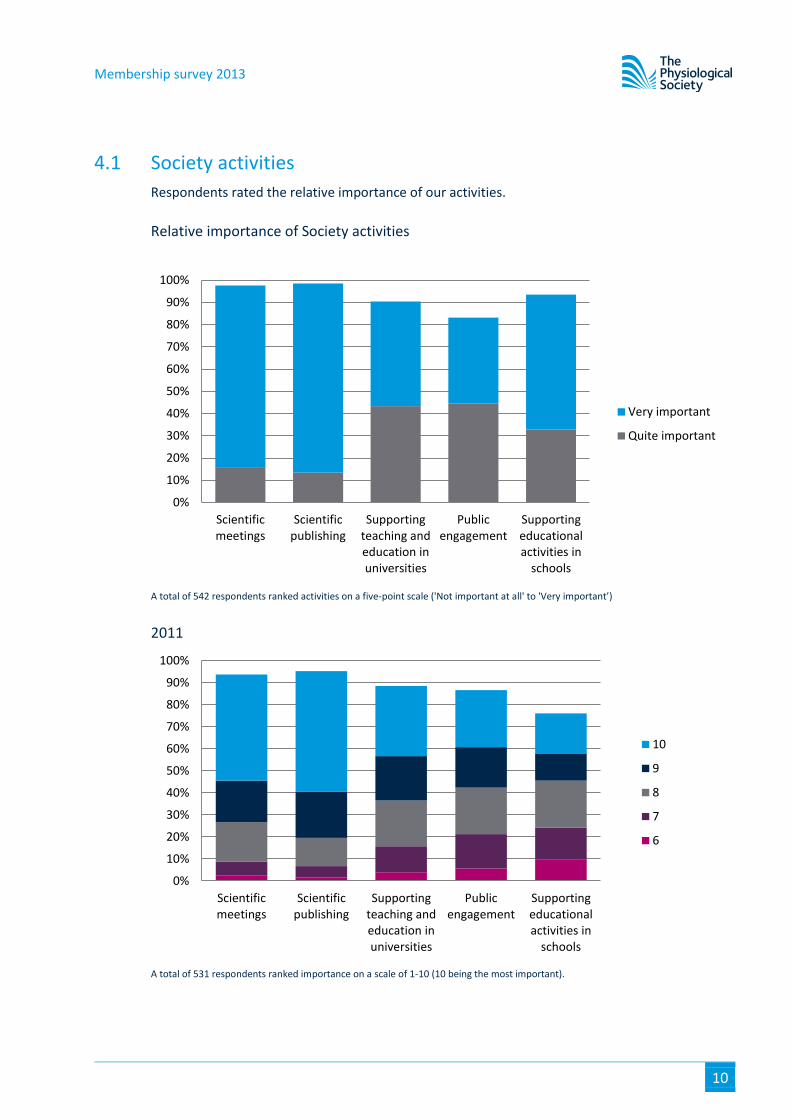
Key points Scientific publishing was held to be the most important of The Society’s activities, with 98.5%
of respondents rating it as ‘very important’ or ‘quite important’, with scientific meetings a close second at 97.5%
Educational activities in schools was seen as more important than in the 2011 survey, ranking third of the five main Society activities
Networking opportunities proved the most valued aspect of Society membership at 64% followed by promotion of physiology at 62%
Both networking and career development were both rated as more important than in the 2011 survey, demonstrating an increased concern for one’s own career
70% agreed or ‘strongly agreed’ with the statement that ‘Membership of The Society is increasingly valuable’
86% of respondents rated our membership services as ‘good’ or ‘very good’
Membership survey 2013
10
4.1 Society activities
Respondents rated the relative importance of our activities.
Relative importance of Society activities
A total of 542 respondents ranked activities on a five-point scale ('Not important at all' to 'Very important’)
2011
A total of 531 respondents ranked importance on a scale of 1-10 (10 being the most important).
0%
10%
20%
30%
40%
50%
60%
70%
80%
90%
100%
Scientificmeetings
Scientificpublishing
Supportingteaching andeducation inuniversities
Publicengagement
Supportingeducationalactivities in
schools
Very important
Quite important
0%
10%
20%
30%
40%
50%
60%
70%
80%
90%
100%
Scientificmeetings
Scientificpublishing
Supportingteaching andeducation inuniversities
Publicengagement
Supportingeducationalactivities in
schools
10
9
8
7
6
Membership survey 2013
11
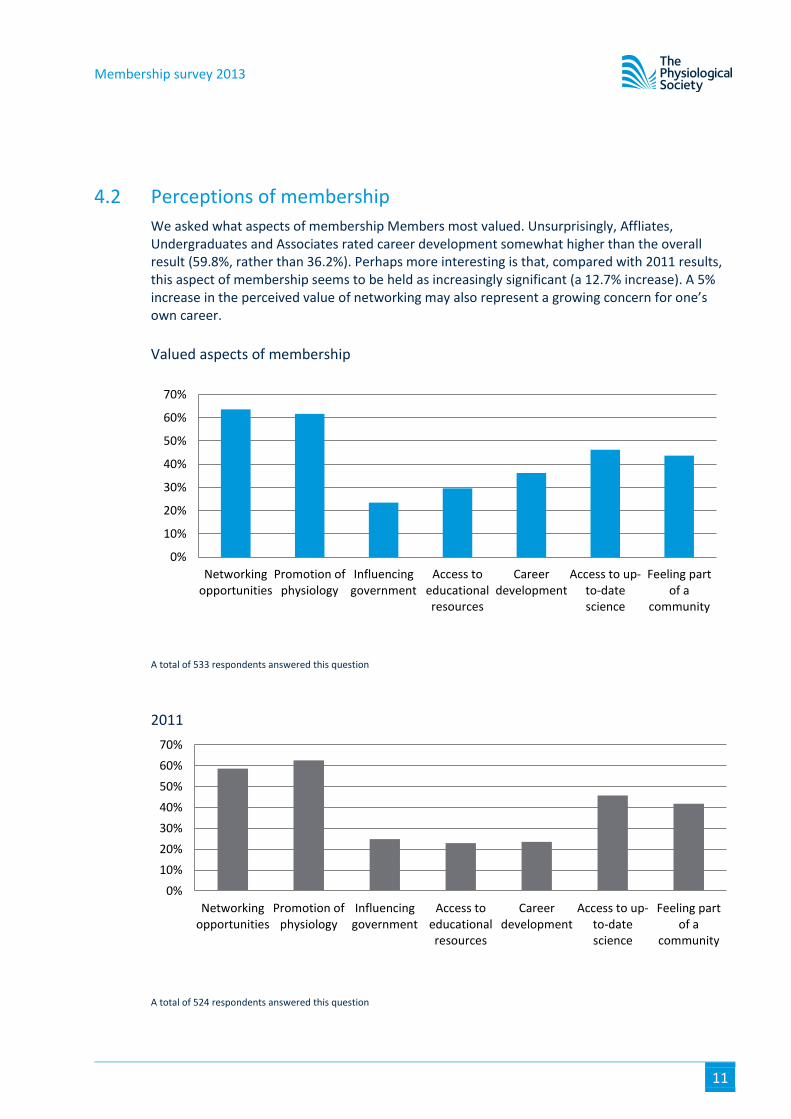
4.2 Perceptions of membership
We asked what aspects of membership Members most valued. Unsurprisingly, Affliates, Undergraduates and Associates rated career development somewhat higher than the overall result (59.8%, rather than 36.2%). Perhaps more interesting is that, compared with 2011 results, this aspect of membership seems to be held as increasingly significant (a 12.7% increase). A 5% increase in the perceived value of networking may also represent a growing concern for one’s own career.
Valued aspects of membership
A total of 533 respondents answered this question
0%
10%
20%
30%
40%
50%
60%
70%
Networkingopportunities
Promotion ofphysiology
Influencinggovernment
Access toeducationalresources
Careerdevelopment
Access to up-to-datescience
Feeling partof a
community
2011
A total of 524 respondents answered this question
0%
10%
20%
30%
40%
50%
60%
70%
Networkingopportunities
Promotion ofphysiology
Influencinggovernment
Access toeducationalresources
Careerdevelopment
Access to up-to-datescience
Feeling partof a
community
Membership survey 2013
12
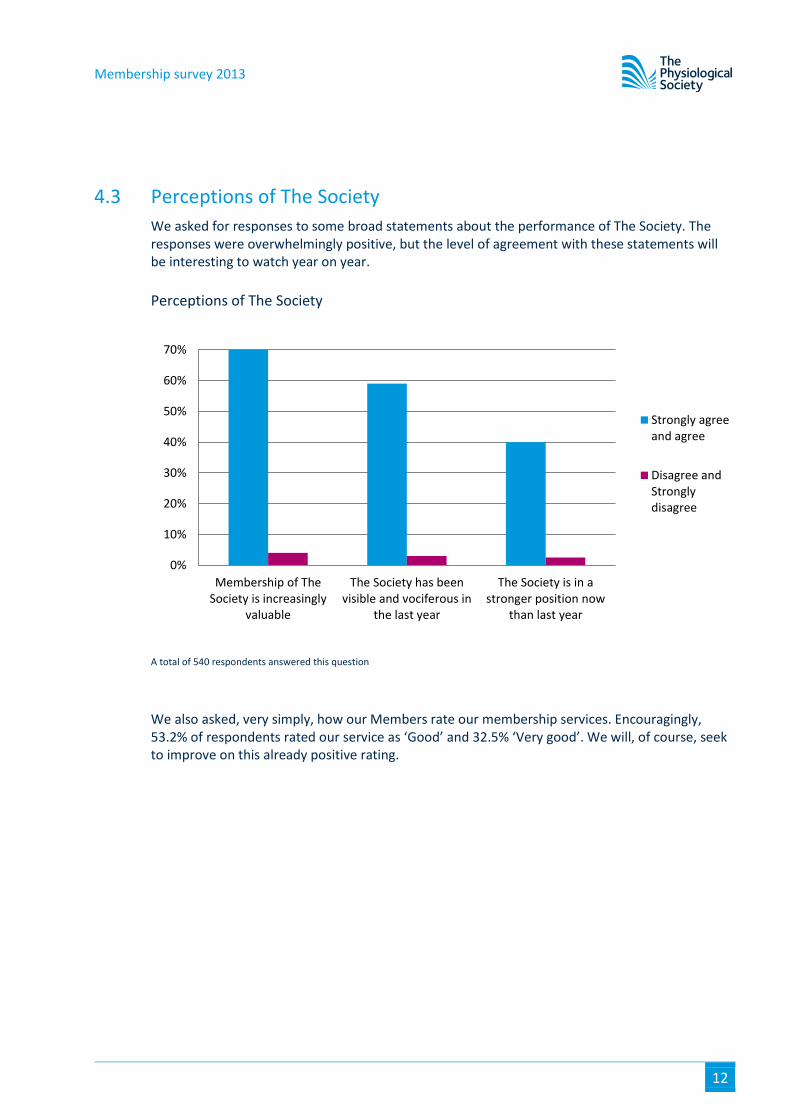
4.3 Perceptions of The Society
We asked for responses to some broad statements about the performance of The Society. The responses were overwhelmingly positive, but the level of agreement with these statements will be interesting to watch year on year.
Perceptions of The Society
A total of 540 respondents answered this question
We also asked, very simply, how our Members rate our membership services. Encouragingly, 53.2% of respondents rated our service as ‘Good’ and 32.5% ‘Very good’. We will, of course, seek to improve on this already positive rating.
0%
10%
20%
30%
40%
50%
60%
70%
Membership of TheSociety is increasingly
valuable
The Society has beenvisible and vociferous in
the last year
The Society is in astronger position now
than last year
Strongly agreeand agree
Disagree andStronglydisagree
Membership survey 2013
13
4.4 Comments and suggestions
74 respondents (13%) left comments on membership. Of these, 28 (37%) were positive, 16 (21%) neutral and 30 (40%) critical.
Positive comments included:
“Of all the professional societies I have joined, PhySoc feels like the most valuable and engaging.”
“The society has struck a good balance between modernization, and keeping the feeling of long-standing traditions (on which I was reared as a postgraduate) alive.”
“Generous support through meeting grants and travel grants has been very helpful.”
Negative comments included:
“The response of the Membership section to my emails has been inconsistent.”
“On-going issue of not being able to pay by direct debit from Republic of Ireland. Society is meant to represent both UK and Ireland.”
“I feel that membership of the society is less useful now than 5 years ago as it is more difficult to find meetings where my group can present data.”
Membership survey 2013
14
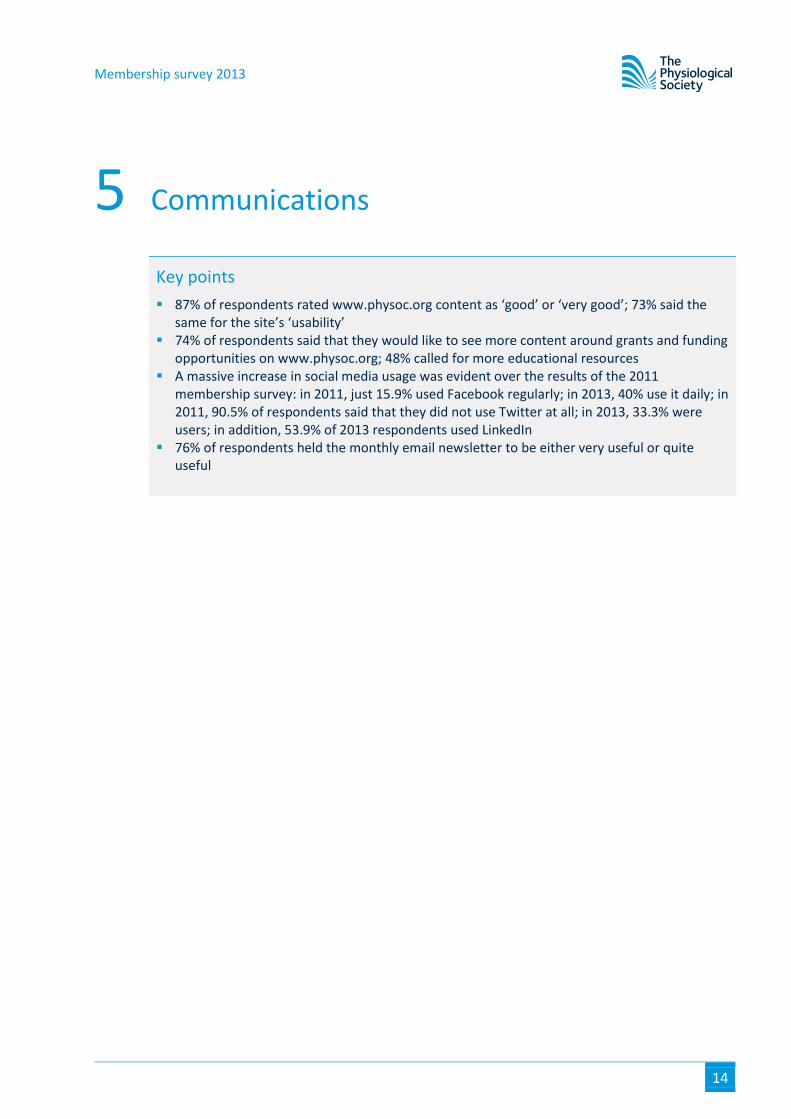
5 Communications
Key points
87% of respondents rated www.physoc.org content as ‘good’ or ‘very good’; 73% said the same for the site’s ‘usability’
74% of respondents said that they would like to see more content around grants and funding opportunities on www.physoc.org; 48% called for more educational resources
A massive increase in social media usage was evident over the results of the 2011 membership survey: in 2011, just 15.9% used Facebook regularly; in 2013, 40% use it daily; in 2011, 90.5% of respondents said that they did not use Twitter at all; in 2013, 33.3% were users; in addition, 53.9% of 2013 respondents used LinkedIn
76% of respondents held the monthly email newsletter to be either very useful or quite useful
Membership survey 2013
15
5.1 The Society online
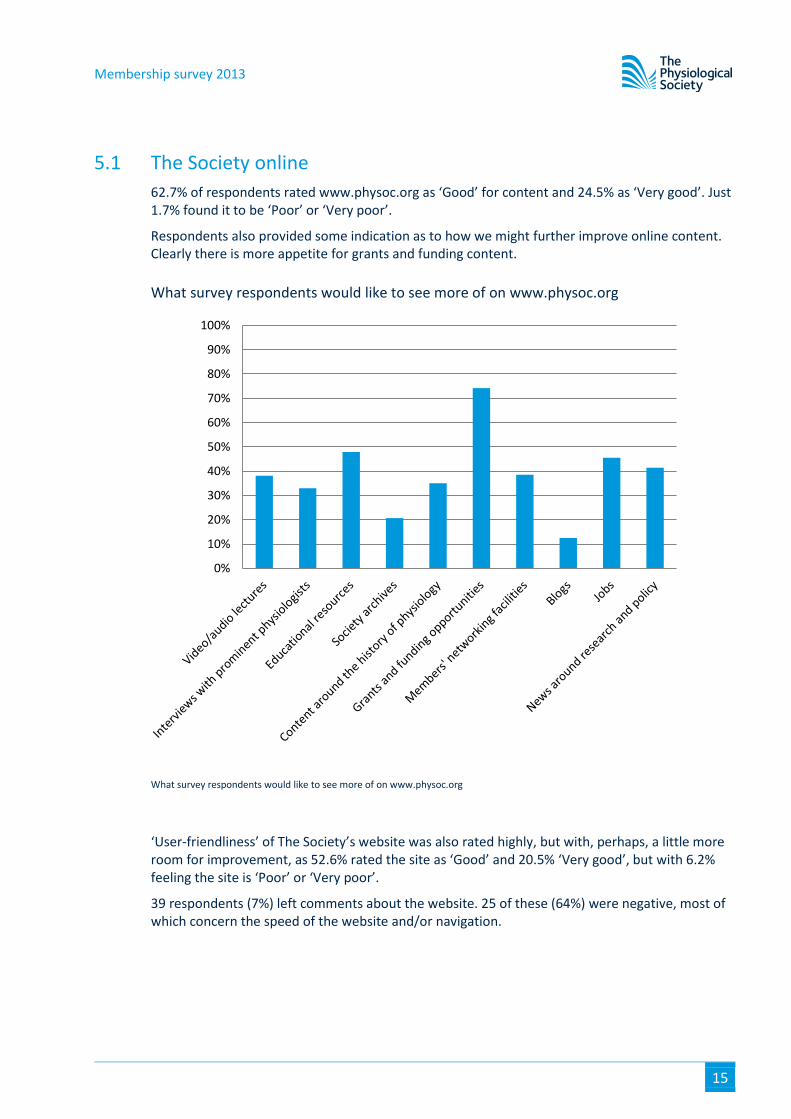
62.7% of respondents rated www.physoc.org as ‘Good’ for content and 24.5% as ‘Very good’. Just 1.7% found it to be ‘Poor’ or ‘Very poor’.
Respondents also provided some indication as to how we might further improve online content. Clearly there is more appetite for grants and funding content.
What survey respondents would like to see more of on www.physoc.org
What survey respondents would like to see more of on www.physoc.org
‘User-friendliness’ of The Society’s website was also rated highly, but with, perhaps, a little more room for improvement, as 52.6% rated the site as ‘Good’ and 20.5% ‘Very good’, but with 6.2% feeling the site is ‘Poor’ or ‘Very poor’.
39 respondents (7%) left comments about the website. 25 of these (64%) were negative, most of which concern the speed of the website and/or navigation.
0%
10%
20%
30%
40%
50%
60%
70%
80%
90%
100%
Membership survey 2013
16
5.2 Social media
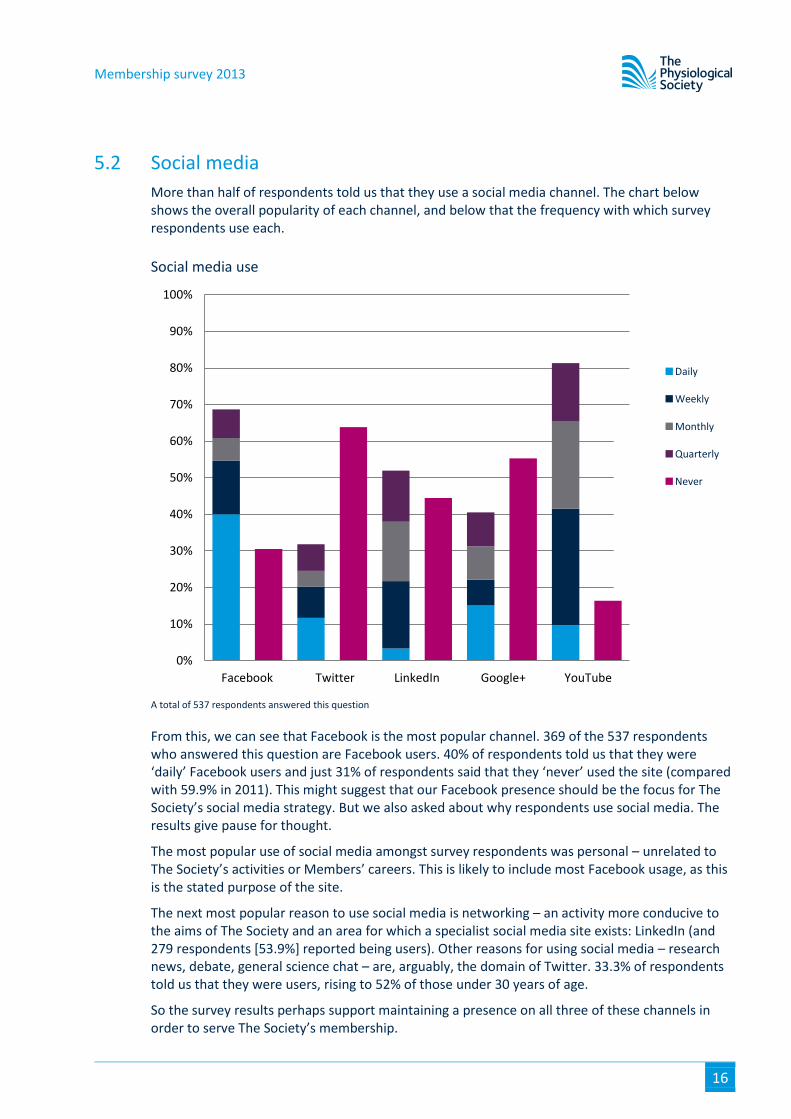
More than half of respondents told us that they use a social media channel. The chart below shows the overall popularity of each channel, and below that the frequency with which survey respondents use each.
Social media use
A total of 537 respondents answered this question
From this, we can see that Facebook is the most popular channel. 369 of the 537 respondents who answered this question are Facebook users. 40% of respondents told us that they were ‘daily’ Facebook users and just 31% of respondents said that they ‘never’ used the site (compared with 59.9% in 2011). This might suggest that our Facebook presence should be the focus for The Society’s social media strategy. But we also asked about why respondents use social media. The results give pause for thought.
The most popular use of social media amongst survey respondents was personal – unrelated to The Society’s activities or Members’ careers. This is likely to include most Facebook usage, as this is the stated purpose of the site.
The next most popular reason to use social media is networking – an activity more conducive to the aims of The Society and an area for which a specialist social media site exists: LinkedIn (and 279 respondents [53.9%] reported being users). Other reasons for using social media – research news, debate, general science chat – are, arguably, the domain of Twitter. 33.3% of respondents told us that they were users, rising to 52% of those under 30 years of age.
So the survey results perhaps support maintaining a presence on all three of these channels in order to serve The Society’s membership.
0%
10%
20%
30%
40%
50%
60%
70%
80%
90%
100%
Facebook Twitter LinkedIn Google+ YouTube
■ Daily
■ Weekly
■ Monthly
■ Quarterly
■ Never
Membership survey 2013
17
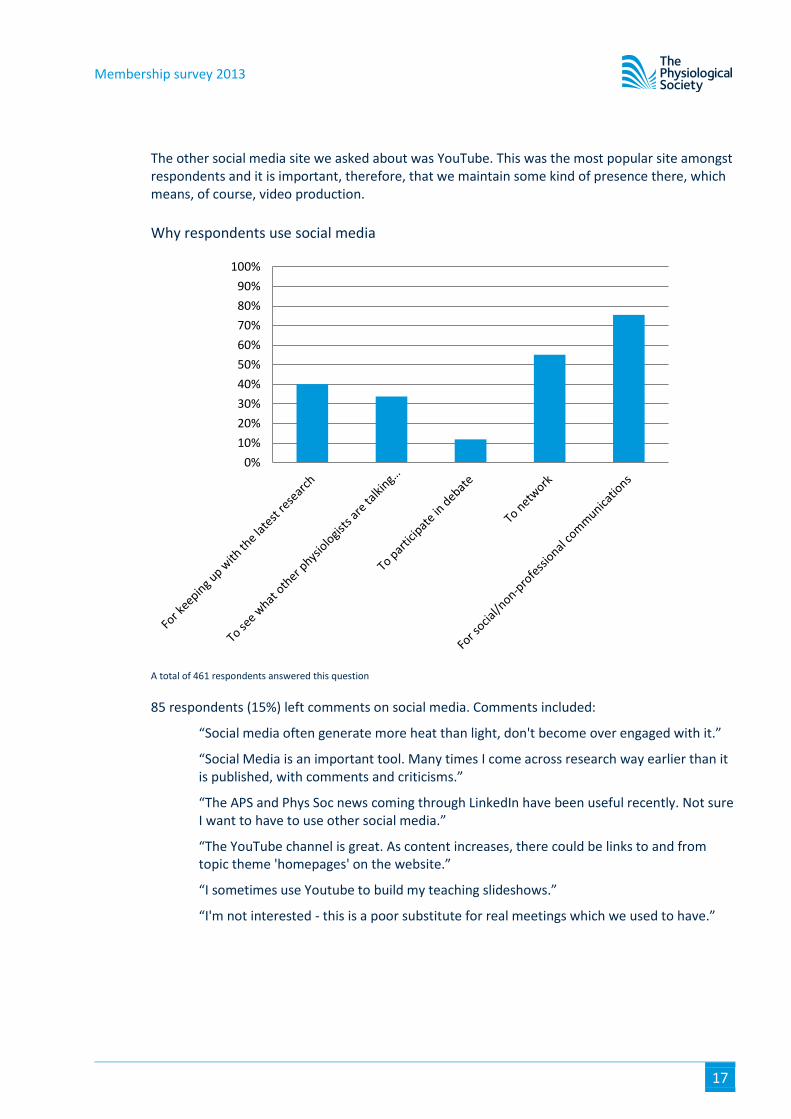
The other social media site we asked about was YouTube. This was the most popular site amongst respondents and it is important, therefore, that we maintain some kind of presence there, which means, of course, video production.
Why respondents use social media
A total of 461 respondents answered this question
85 respondents (15%) left comments on social media. Comments included:
“Social media often generate more heat than light, don't become over engaged with it.”
“Social Media is an important tool. Many times I come across research way earlier than it is published, with comments and criticisms.”
“The APS and Phys Soc news coming through LinkedIn have been useful recently. Not sure I want to have to use other social media.”
“The YouTube channel is great. As content increases, there could be links to and from topic theme 'homepages' on the website.”
“I sometimes use Youtube to build my teaching slideshows.”
“I'm not interested - this is a poor substitute for real meetings which we used to have.”
0%
10%
20%
30%
40%
50%
60%
70%
80%
90%
100%
Membership survey 2013
18
5.3 Email newsletter
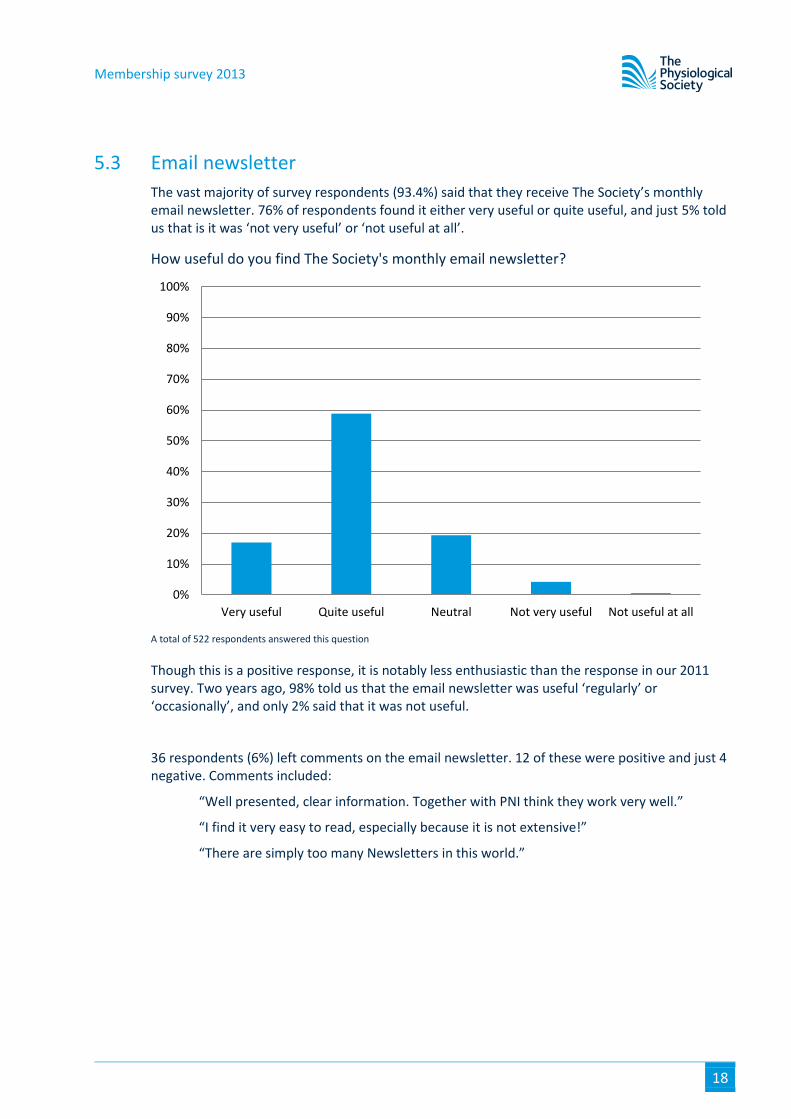
The vast majority of survey respondents (93.4%) said that they receive The Society’s monthly email newsletter. 76% of respondents found it either very useful or quite useful, and just 5% told us that is it was ‘not very useful’ or ‘not useful at all’.
How useful do you find The Society's monthly email newsletter?
A total of 522 respondents answered this question
Though this is a positive response, it is notably less enthusiastic than the response in our 2011 survey. Two years ago, 98% told us that the email newsletter was useful ‘regularly’ or ‘occasionally’, and only 2% said that it was not useful.
36 respondents (6%) left comments on the email newsletter. 12 of these were positive and just 4 negative. Comments included:
“Well presented, clear information. Together with PNI think they work very well.”
“I find it very easy to read, especially because it is not extensive!”
“There are simply too many Newsletters in this world.”
0%
10%
20%
30%
40%
50%
60%
70%
80%
90%
100%
Very useful Quite useful Neutral Not very useful Not useful at all
Membership survey 2013
19
5.4 Physiology News
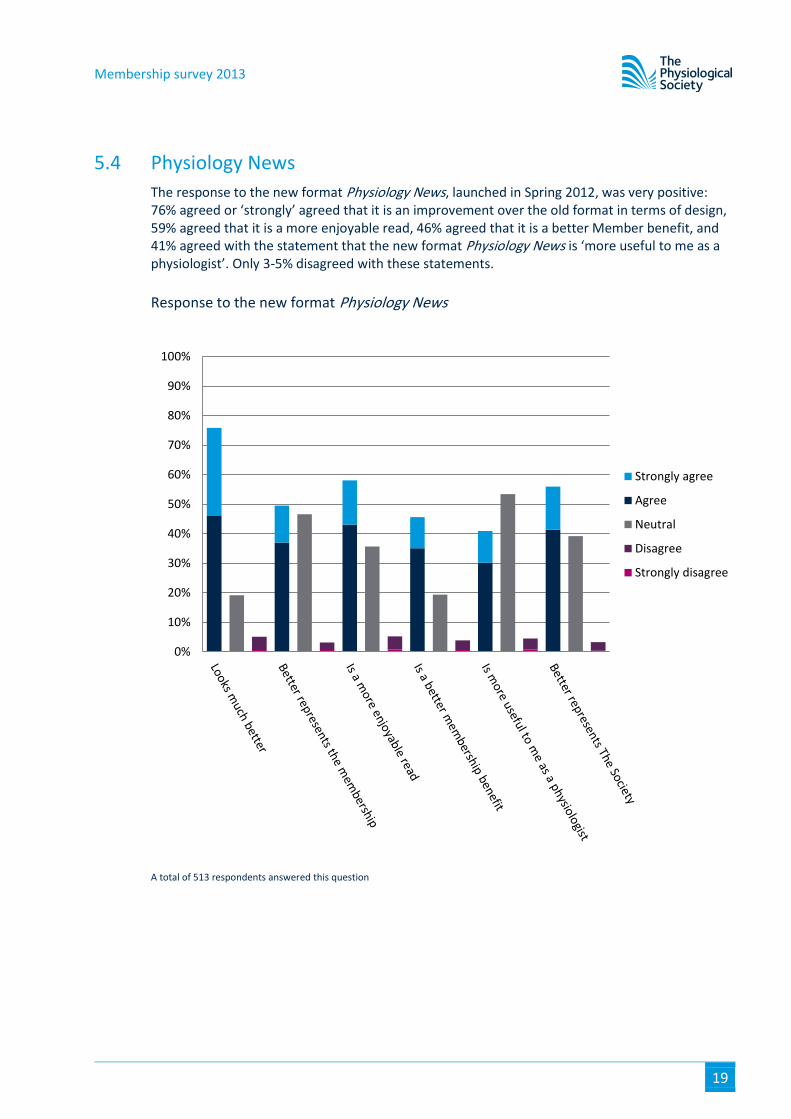
The response to the new format Physiology News, launched in Spring 2012, was very positive: 76% agreed or ‘strongly’ agreed that it is an improvement over the old format in terms of design, 59% agreed that it is a more enjoyable read, 46% agreed that it is a better Member benefit, and 41% agreed with the statement that the new format Physiology News is ‘more useful to me as a physiologist’. Only 3-5% disagreed with these statements.
Response to the new format Physiology News
A total of 513 respondents answered this question
0%
10%
20%
30%
40%
50%
60%
70%
80%
90%
100%
Strongly agree
Agree
Neutral
Disagree
Strongly disagree
Membership survey 2013
20
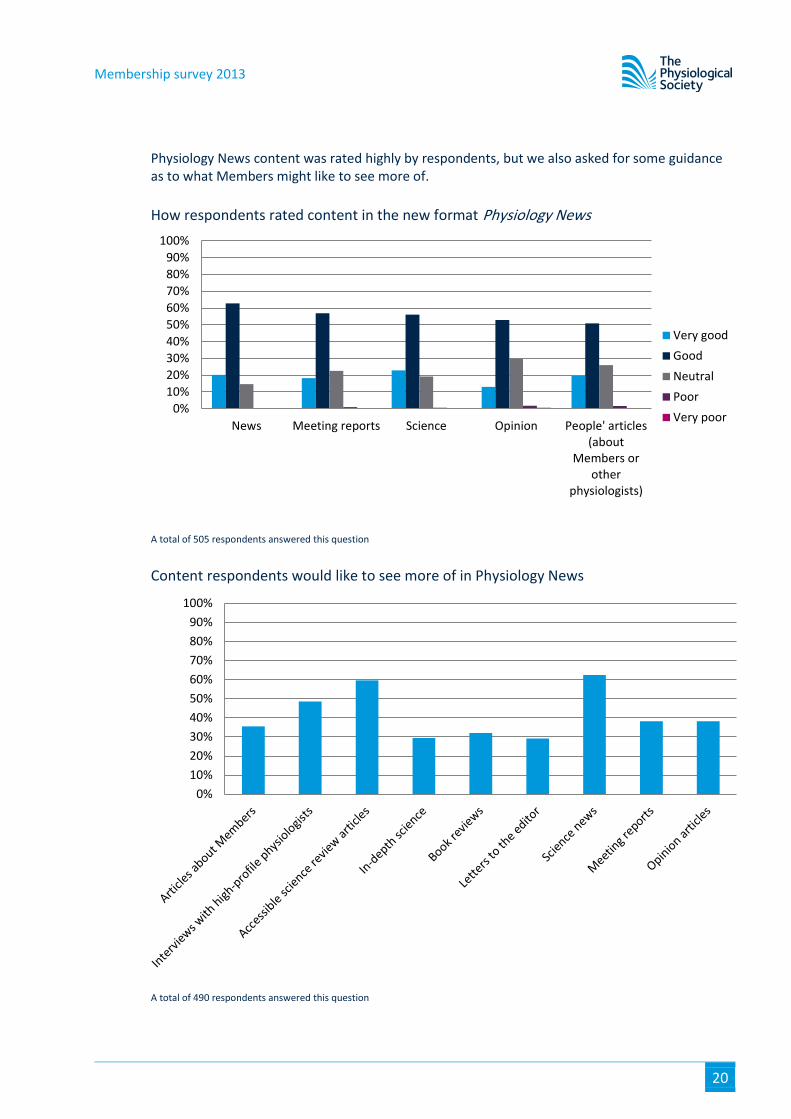
Physiology News content was rated highly by respondents, but we also asked for some guidance as to what Members might like to see more of.
How respondents rated content in the new format Physiology News
A total of 505 respondents answered this question
Content respondents would like to see more of in Physiology News
A total of 490 respondents answered this question
0%
10%
20%
30%
40%
50%
60%
70%
80%
90%
100%
News Meeting reports Science Opinion People' articles(about
Members orother
physiologists)
Very good
Good
Neutral
Poor
Very poor
0%
10%
20%
30%
40%
50%
60%
70%
80%
90%
100%
Membership survey 2013
21
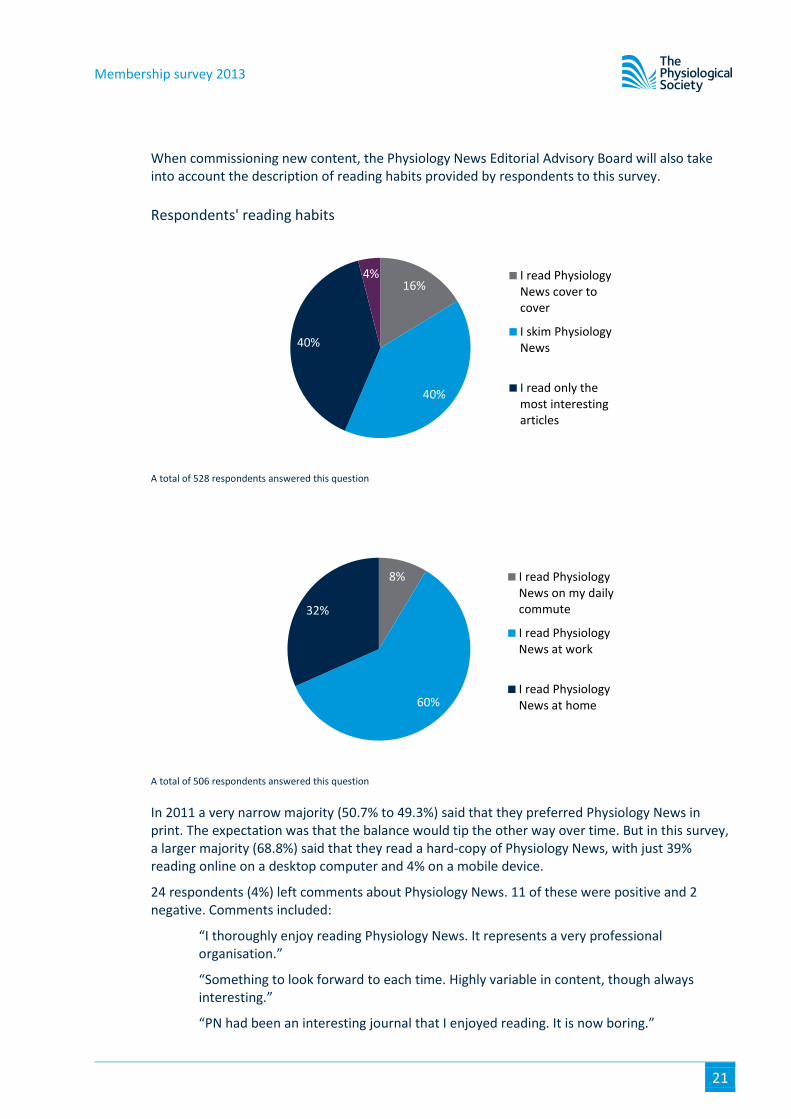
When commissioning new content, the Physiology News Editorial Advisory Board will also take into account the description of reading habits provided by respondents to this survey.
Respondents' reading habits
A total of 528 respondents answered this question
A total of 506 respondents answered this question
In 2011 a very narrow majority (50.7% to 49.3%) said that they preferred Physiology News in print. The expectation was that the balance would tip the other way over time. But in this survey, a larger majority (68.8%) said that they read a hard-copy of Physiology News, with just 39% reading online on a desktop computer and 4% on a mobile device.
24 respondents (4%) left comments about Physiology News. 11 of these were positive and 2 negative. Comments included:
“I thoroughly enjoy reading Physiology News. It represents a very professional organisation.”
“Something to look forward to each time. Highly variable in content, though always interesting.”
“PN had been an interesting journal that I enjoyed reading. It is now boring.”
16%
40%
40%
4% I read PhysiologyNews cover tocover
I skim PhysiologyNews
I read only themost interestingarticles
8%
60%
32%
I read PhysiologyNews on my dailycommute
I read PhysiologyNews at work
I read PhysiologyNews at home
Membership survey 2013
22
6 Society journals
Key points When choosing a journal in which to publish their work, 98% of respondents said that
reputation of the journal was ‘very’ or ‘quite’ important; 93% said the same of constructive peer review
Just 28.5% of respondents said that they have published in a ‘gold’ open access journal 45% of respondents said that they did feel well informed about policy changes around open
access and 46% welcomed those changes 73% of respondents said that they welcome the launch of Physiological Reports, the journal
produced by The Society in collaboration with the American Physiological Society
Membership survey 2013
23
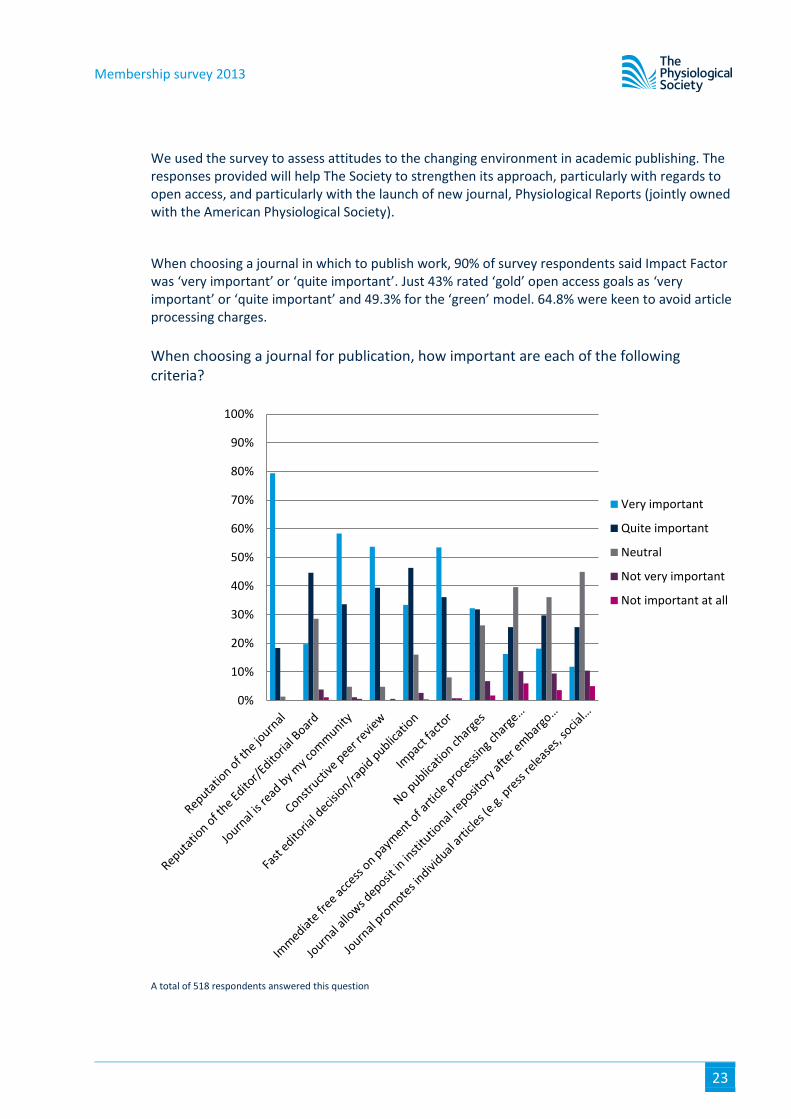
We used the survey to assess attitudes to the changing environment in academic publishing. The responses provided will help The Society to strengthen its approach, particularly with regards to open access, and particularly with the launch of new journal, Physiological Reports (jointly owned with the American Physiological Society).
When choosing a journal in which to publish work, 90% of survey respondents said Impact Factor was ‘very important’ or ‘quite important’. Just 43% rated ‘gold’ open access goals as ‘very important’ or ‘quite important’ and 49.3% for the ‘green’ model. 64.8% were keen to avoid article processing charges.
When choosing a journal for publication, how important are each of the following criteria?
A total of 518 respondents answered this question
0%
10%
20%
30%
40%
50%
60%
70%
80%
90%
100%
Very important
Quite important
Neutral
Not very important
Not important at all
Membership survey 2013
24
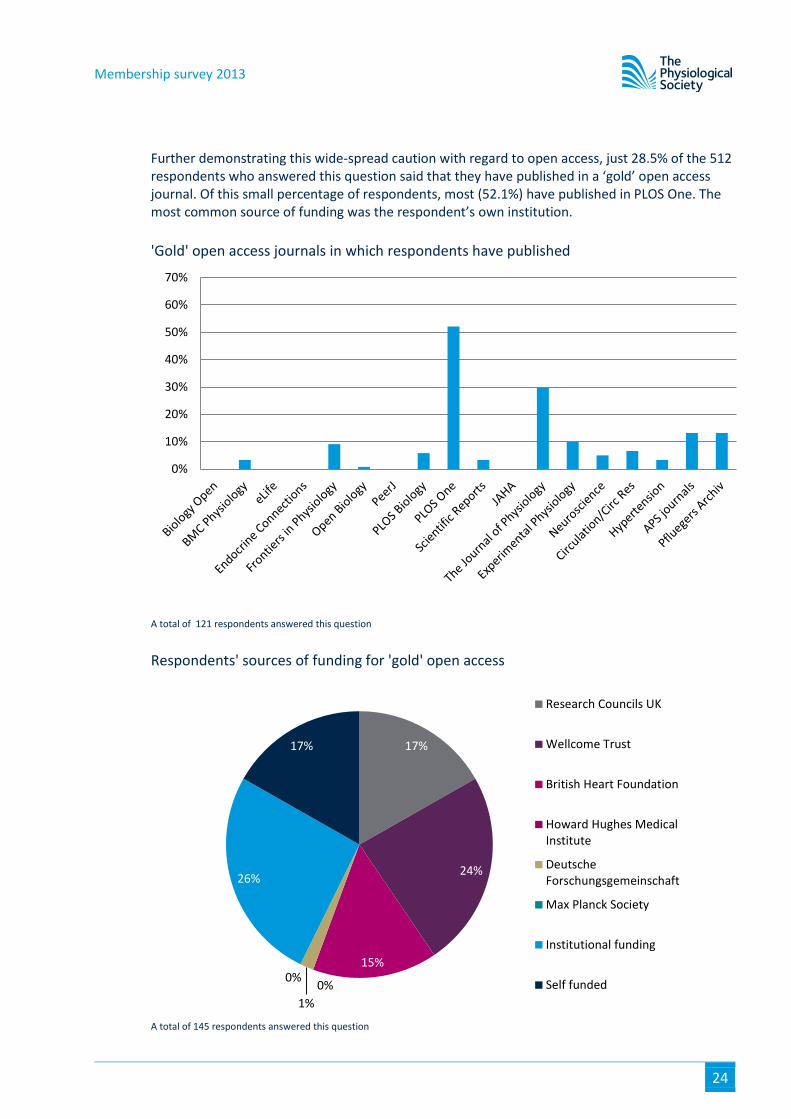
Further demonstrating this wide-spread caution with regard to open access, just 28.5% of the 512 respondents who answered this question said that they have published in a ‘gold’ open access journal. Of this small percentage of respondents, most (52.1%) have published in PLOS One. The most common source of funding was the respondent’s own institution.
'Gold' open access journals in which respondents have published
A total of 121 respondents answered this question
Respondents' sources of funding for 'gold' open access
A total of 145 respondents answered this question
0%
10%
20%
30%
40%
50%
60%
70%
17%
24%
15%
0%
1%
0%
26%
17%
Research Councils UK
Wellcome Trust
British Heart Foundation
Howard Hughes MedicalInstitute
DeutscheForschungsgemeinschaft
Max Planck Society
Institutional funding
Self funded
Membership survey 2013
25
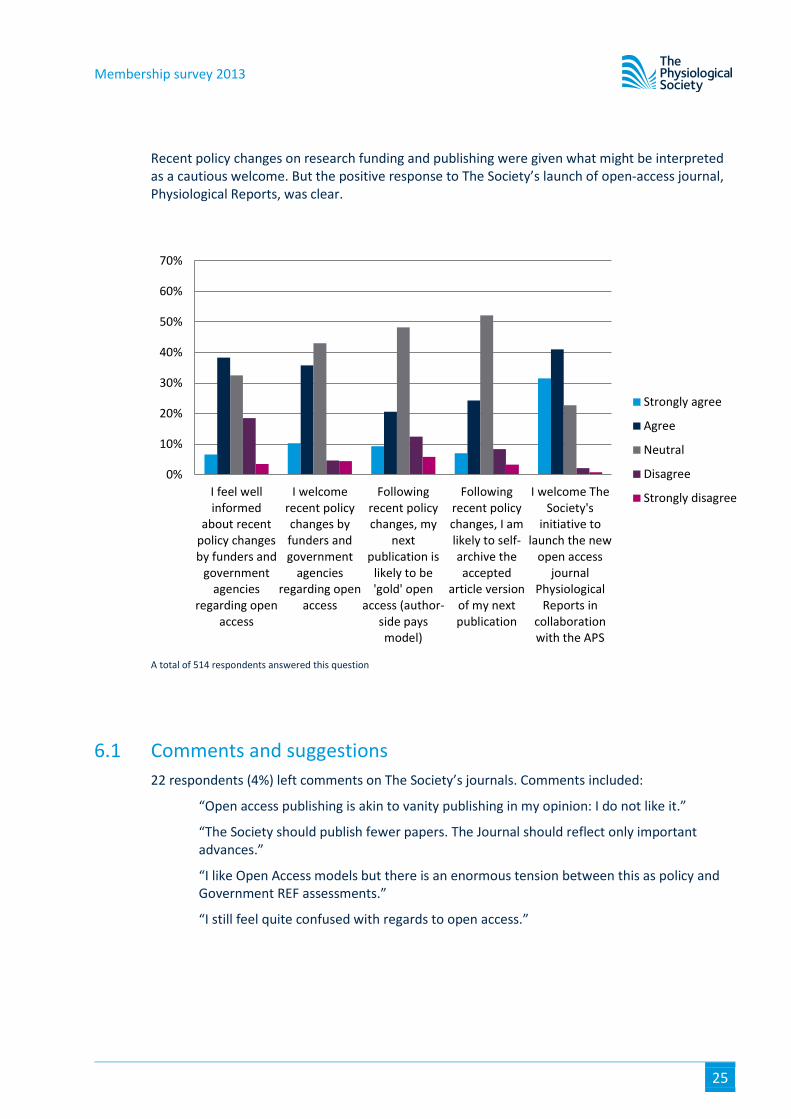
Recent policy changes on research funding and publishing were given what might be interpreted as a cautious welcome. But the positive response to The Society’s launch of open-access journal, Physiological Reports, was clear.
A total of 514 respondents answered this question
6.1 Comments and suggestions
22 respondents (4%) left comments on The Society’s journals. Comments included:
“Open access publishing is akin to vanity publishing in my opinion: I do not like it.”
“The Society should publish fewer papers. The Journal should reflect only important advances.”
“I like Open Access models but there is an enormous tension between this as policy and Government REF assessments.”
“I still feel quite confused with regards to open access.”
0%
10%
20%
30%
40%
50%
60%
70%
I feel wellinformed
about recentpolicy changesby funders and
governmentagencies
regarding openaccess
I welcomerecent policychanges byfunders andgovernment
agenciesregarding open
access
Followingrecent policychanges, my
nextpublication is
likely to be'gold' open
access (author-side paysmodel)
Followingrecent policychanges, I amlikely to self-archive theaccepted
article versionof my nextpublication
I welcome TheSociety's
initiative tolaunch the new
open accessjournal
PhysiologicalReports in
collaborationwith the APS
Strongly agree
Agree
Neutral
Disagree
Strongly disagree
Membership survey 2013
26
7 Scientific meetings
Key points 58% of respondents said that they had attended The Society’s main meeting in the last three
years, down 7.4% on the 2011 membership survey results 45% of those who had not attended Society meetings gave cost as their main reason 72% of respondents said that hearing the latest, cutting-edge research was the main reason
to choose to attend an event
Membership survey 2013
27
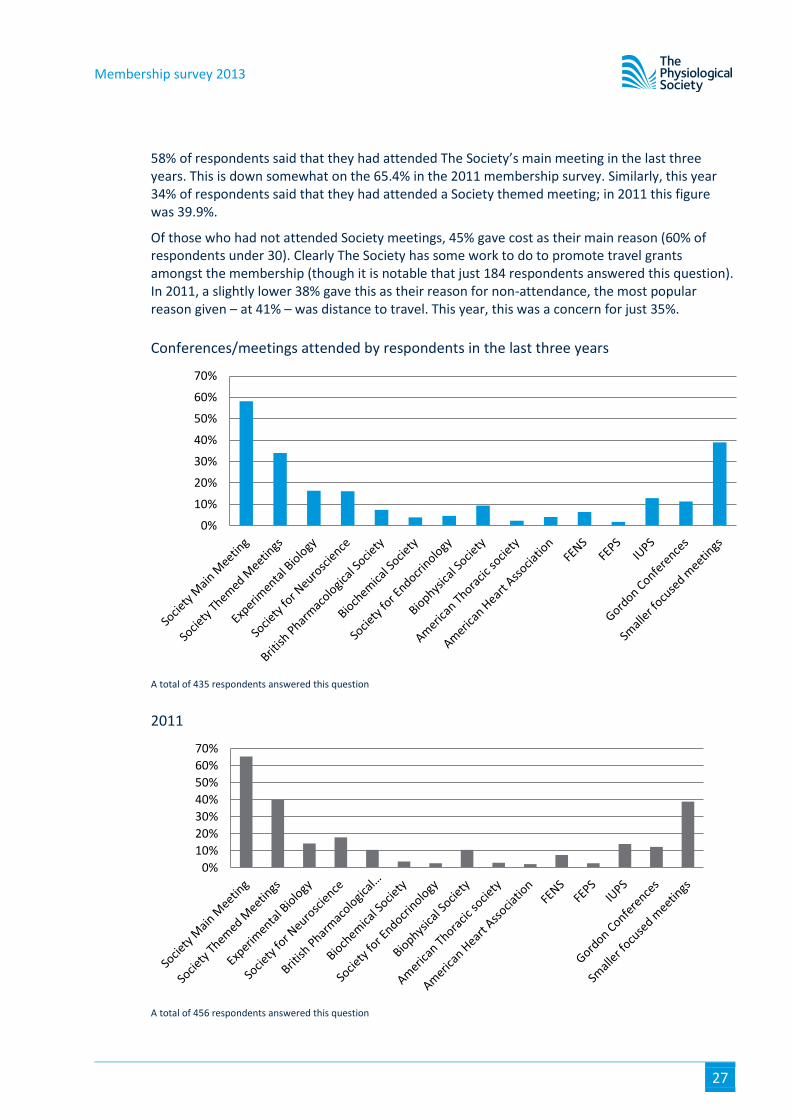
58% of respondents said that they had attended The Society’s main meeting in the last three years. This is down somewhat on the 65.4% in the 2011 membership survey. Similarly, this year 34% of respondents said that they had attended a Society themed meeting; in 2011 this figure was 39.9%.
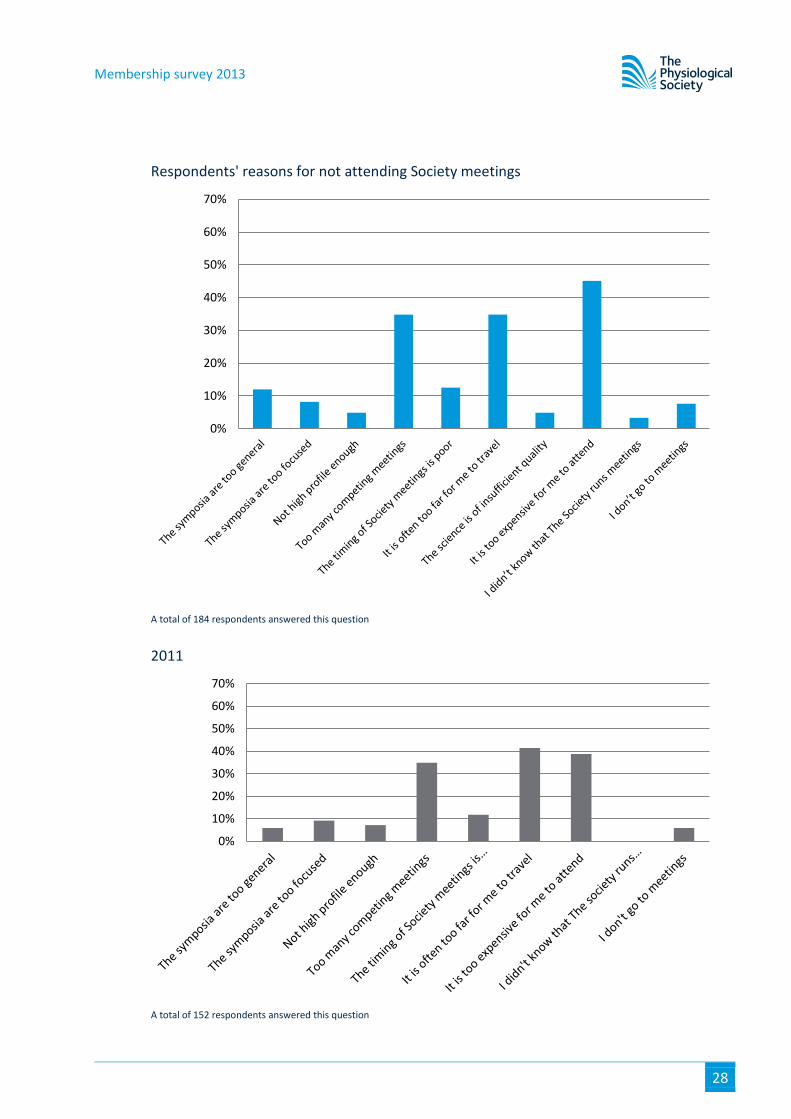
Of those who had not attended Society meetings, 45% gave cost as their main reason (60% of respondents under 30). Clearly The Society has some work to do to promote travel grants amongst the membership (though it is notable that just 184 respondents answered this question). In 2011, a slightly lower 38% gave this as their reason for non-attendance, the most popular reason given – at 41% – was distance to travel. This year, this was a concern for just 35%.
Conferences/meetings attended by respondents in the last three years
A total of 435 respondents answered this question
2011
A total of 456 respondents answered this question
0%
10%
20%
30%
40%
50%
60%
70%
0%
10%
20%
30%
40%
50%
60%
70%
Membership survey 2013
28
Respondents' reasons for not attending Society meetings
A total of 184 respondents answered this question
2011
A total of 152 respondents answered this question
0%
10%
20%
30%
40%
50%
60%
70%
0%
10%
20%
30%
40%
50%
60%
70%
Membership survey 2013
29
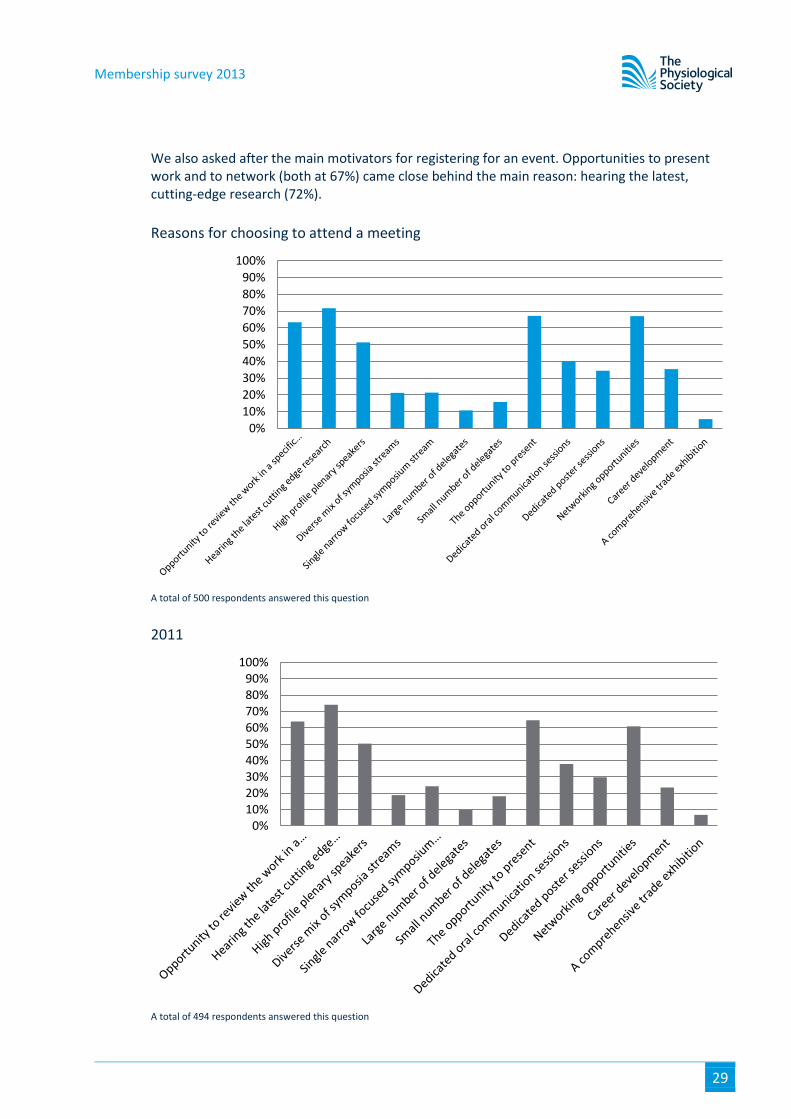
We also asked after the main motivators for registering for an event. Opportunities to present work and to network (both at 67%) came close behind the main reason: hearing the latest, cutting-edge research (72%).
Reasons for choosing to attend a meeting
A total of 500 respondents answered this question
2011
A total of 494 respondents answered this question
0%
10%
20%
30%
40%
50%
60%
70%
80%
90%
100%
0%10%20%30%40%50%60%70%80%90%
100%
Membership survey 2013
30
8 Science policy
Key points 61% of respondents said that they do not regularly contribute to policy debates; a slight
improvement on the 64% who said the same in 2011 With regards to respondents’ policy priorities, 75% held the research funding environment
to be ‘very important’, 67% held university funding for research to be very important Animal research was ‘very important’ to just 48.6% of respondents
Membership survey 2013
31
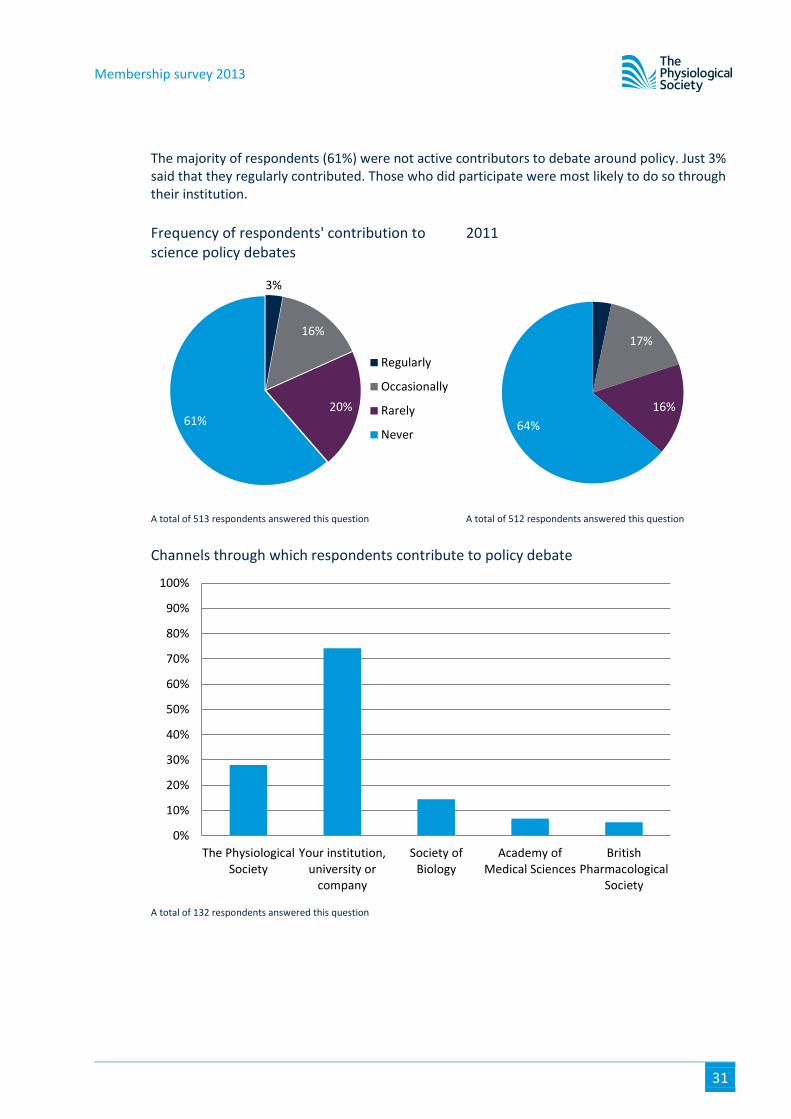
The majority of respondents (61%) were not active contributors to debate around policy. Just 3% said that they regularly contributed. Those who did participate were most likely to do so through their institution.
Frequency of respondents' contribution to science policy debates
2011
A total of 513 respondents answered this question A total of 512 respondents answered this question
Channels through which respondents contribute to policy debate
A total of 132 respondents answered this question
3%
16%
20% 61%
Regularly
Occasionally
Rarely
Never
3%
17%
16%
64%
0%
10%
20%
30%
40%
50%
60%
70%
80%
90%
100%
The PhysiologicalSociety
Your institution,university or
company
Society ofBiology
Academy ofMedical Sciences
BritishPharmacological
Society
Membership survey 2013
32
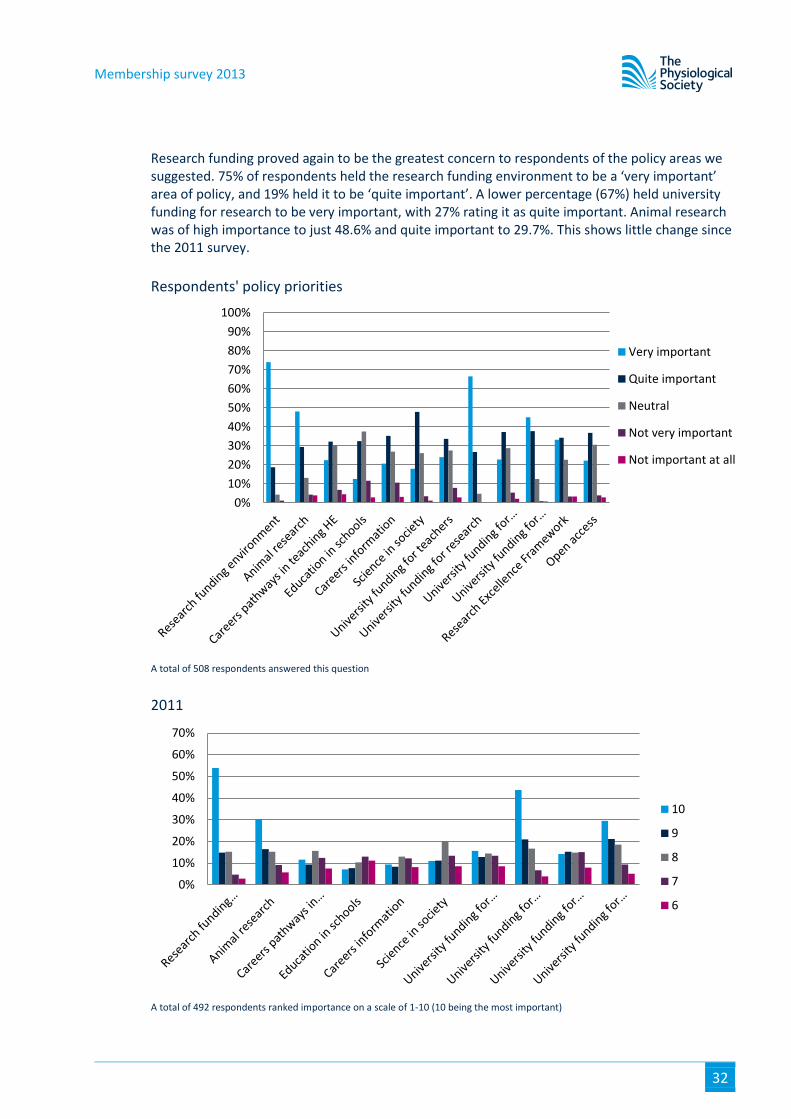
Research funding proved again to be the greatest concern to respondents of the policy areas we suggested. 75% of respondents held the research funding environment to be a ‘very important’ area of policy, and 19% held it to be ‘quite important’. A lower percentage (67%) held university funding for research to be very important, with 27% rating it as quite important. Animal research was of high importance to just 48.6% and quite important to 29.7%. This shows little change since the 2011 survey.
Respondents' policy priorities
A total of 508 respondents answered this question
2011
A total of 492 respondents ranked importance on a scale of 1-10 (10 being the most important)
0%
10%
20%
30%
40%
50%
60%
70%
80%
90%
100%
Very important
Quite important
Neutral
Not very important
Not important at all
0%
10%
20%
30%
40%
50%
60%
70%
10
9
8
7
6
Membership survey 2013
33
9 Next steps The results of the survey will be shared with the relevant committees within The Society and will be used to inform strategic and operational decisions.

Membership survey 2013
34

Membership survey 2013
35
The Physiological Society Hodgkin Huxley House 30 Farringdon Lane London EC1R 3AW United Kingdom
Registered Charity No. 211585. Registered company in England and Wales No. 323575 020 7269 5710 www.physoc.org