Embed Size (px)
Citation preview
Bill Bradbury Chair
Oregon
Jennifer Anders Vice Chair Montana
Henry Lorenzen
Oregon
W. Bill Booth Idaho
James A. Yost
Idaho
Pat Smith Montana
Tom Karier Washington
Phil Rockefeller
Washington
October 28, 2014
MEMORANDUM TO: Council members FROM: Tom Eckman, Power Division Director SUBJECT: Briefing on Power Planning Under Uncertainty BACKGROUND: Presenter: Tom Eckman Summary: Staff will present an overview of Council’s approach to resource planning,
focusing on how its analytical processes address the inherent uncertainty in major drivers of electricity demand, resource costs and risks. This is the second in a two-part series designed to provide Council members and interested stakeholders with background on the analytical methods used in plan development.
Relevance: The Council is engaged in the development of is 7th Power Plan. The
product of that development process is a plan that represents the Council’s collective assessment of resource development and other actions that will “assure the Pacific Northwest of an adequate, efficient, economical and reliable power supply.”
Workplan: 1D - Prepare for Seventh Power Plan and maintain analytical capability Background: In 1982, shortly after the Council was formed, Dr. Kai Lee, then a
professor at the University of Washington and who later served as Washington Council member, authored a paper entitled, The Path Along
the Ridge: Regional Planning in the Face of Uncertainty.1 In his paper Dr. Lee described how the Council’s planning process departed from traditional utility power planning.
In the Council’s power plans there is an explicit recognition that the future is uncertain and that risk management strategies to deal with that uncertainty are needed. For example, until the Council’s first plan, utility resource planning was based on a single forecast of the region’s most likely energy demand. Resources that took ten or 15 years to build were planned and constructed to that best guess; if the future turned out differently, the region faced the problem of either having under built or overbuilt resources. The cost of error on either side was enormous.
The Council explicitly recognizes that the future cannot be predicted accurately and that uncertainty is a fact of life in power planning. To accommodate this problem, the Council has developed plans to meet a broad range of potential growth in energy demand, setting a boundary of high and low load growth forecasts over the next 20 years. The Council’s plans have also identified flexible resources such as conservation and options that shorten the lead time of generating resources. This presentation will expand on the types of uncertainty the Council’s planning process must address as well as describe the analytical methods used by the Council to evaluate and identify resource strategies that can be used to mitigate risk at an acceptable cost.
More Info: See linked paper “An Overview of the Council’s Planning Methods.” From March 2011.
1 Lee, Kai N. The Path Along the Ridge: Regional Planning in the Face of Uncertainty. University of Washington Law Review, 1982-1983, Volume 58, pp 317 – 342. ( https://digital.law.washington.edu/dspace-law/bitstream/handle/1773.1/104/volume%2058.pdf?sequence=1)
Planning for Uncertainty An Introduction to the Council’s
Power Planning Process
Tom Eckman Director, Power Division
Northwest Power and Conservation Council November 5, 2014
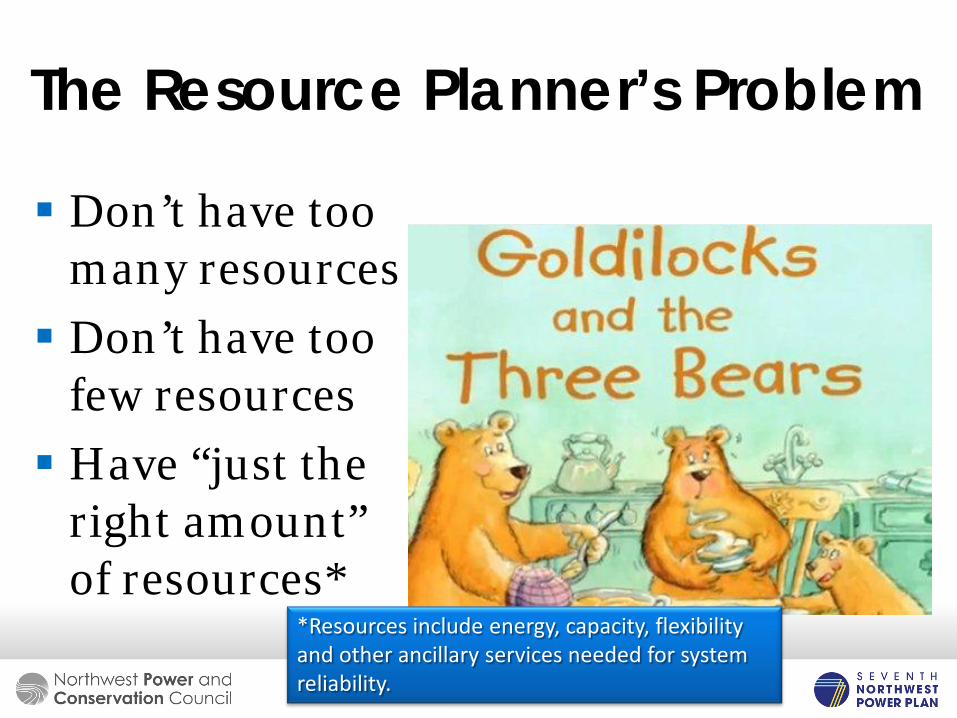
The Resource Planner’s Problem
Don’t have too many resources Don’t have too
few resources Have “just the
right amount” of resources*
*Resources include energy, capacity, flexibility and other ancillary services needed for system reliability.
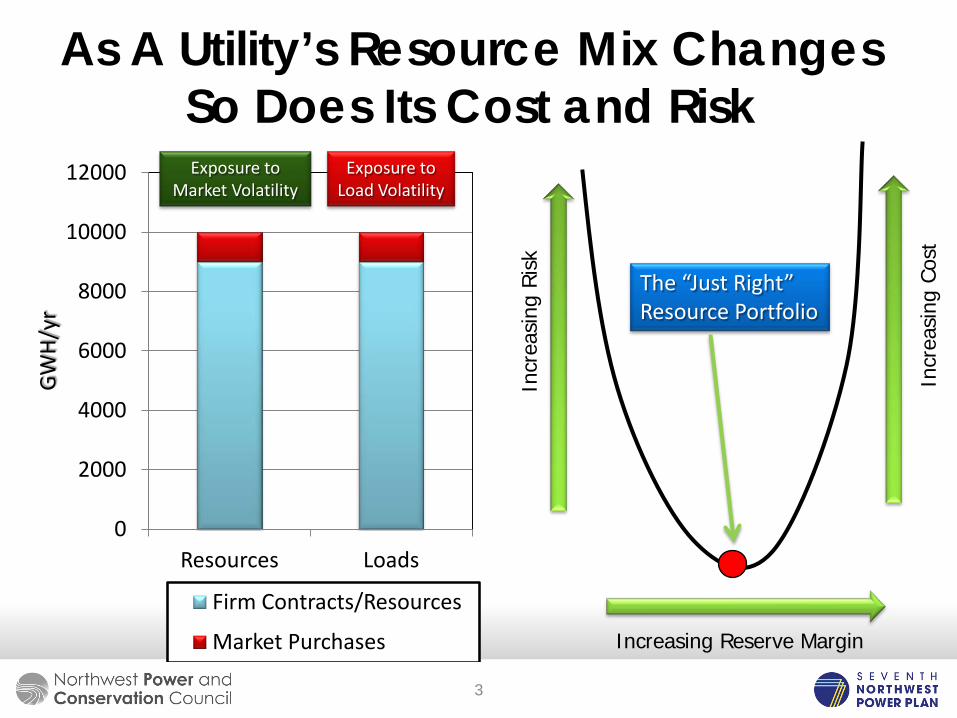
As A Utility’s Resource Mix Changes So Does Its Cost and Risk
0
2000
4000
6000
8000
10000
12000
Resources Loads
GWH/
yr
Firm Contracts/Resources
Market Purchases
Incr
easi
ng R
isk
Increasing Reserve Margin
Exposure to Market Volatility
Exposure to Load Volatility
Incr
easi
ng C
ost
The “Just Right” Resource Portfolio
3
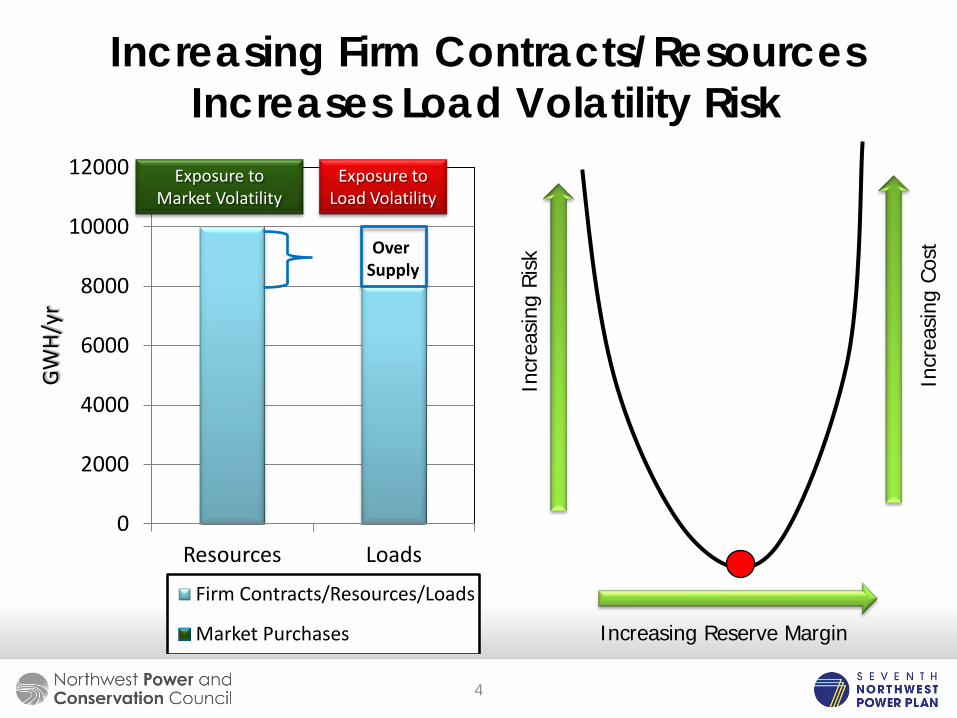
Increasing Firm Contracts/Resources Increases Load Volatility Risk
0
2000
4000
6000
8000
10000
12000
Resources Loads
GWH/
yr
Firm Contracts/Resources/Loads
Market Purchases
Incr
easi
ng R
isk
Increasing Reserve Margin
Exposure to Market Volatility
Exposure to Load Volatility
Incr
easi
ng C
ost Over
Supply
4
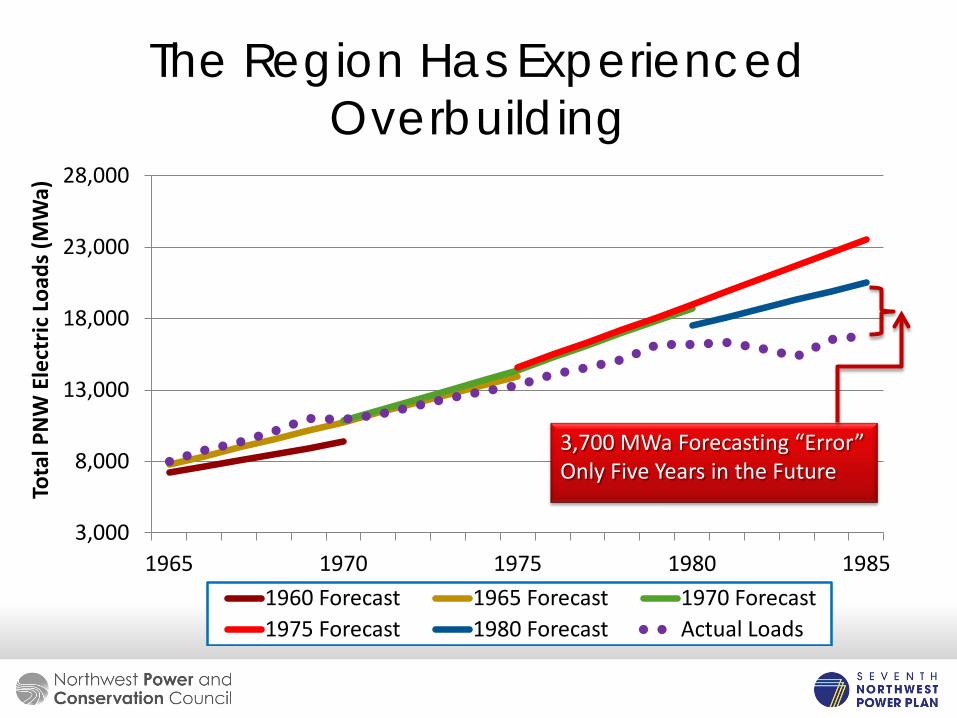
The Region Has Experienced Overbuilding
3,000
8,000
13,000
18,000
23,000
28,000
1965 1970 1975 1980 1985
Tota
l PN
W E
lect
ric L
oads
(MW
a)
1960 Forecast 1965 Forecast 1970 Forecast 1975 Forecast 1980 Forecast Actual Loads
3,700 MWa Forecasting “Error” Only Five Years in the Future
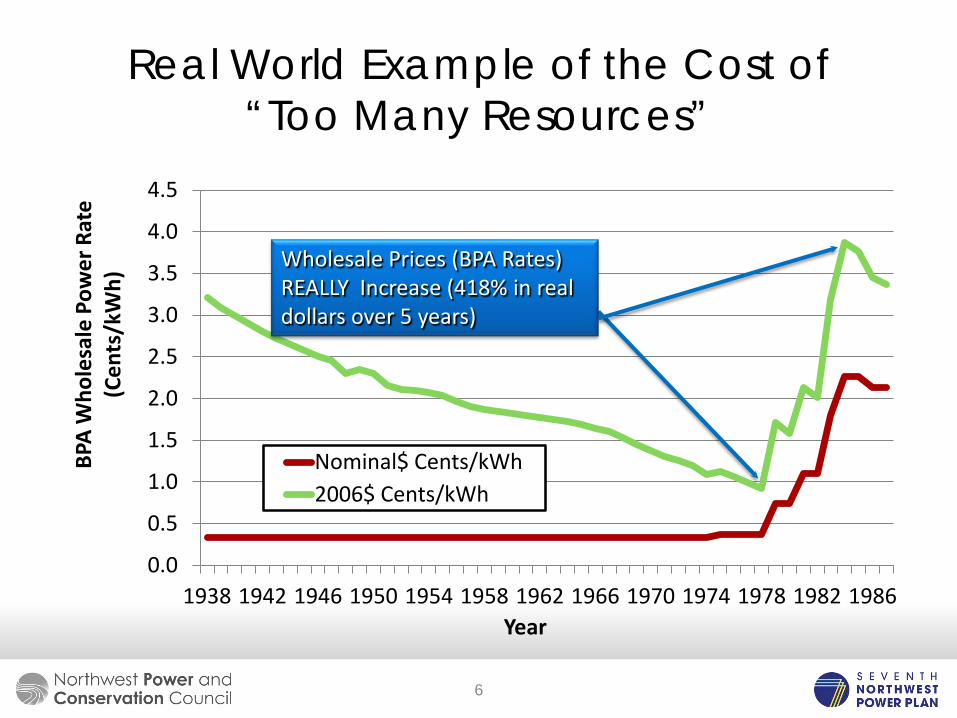
Real World Example of the Cost of “Too Many Resources”
0.0
0.5
1.0
1.5
2.0
2.5
3.0
3.5
4.0
4.5
1938 1942 1946 1950 1954 1958 1962 1966 1970 1974 1978 1982 1986
BPA
Who
lesa
le P
ower
Rat
e (C
ents
/kW
h)
Year
Nominal$ Cents/kWh 2006$ Cents/kWh
Wholesale Prices (BPA Rates) REALLY Increase (418% in real dollars over 5 years)
6
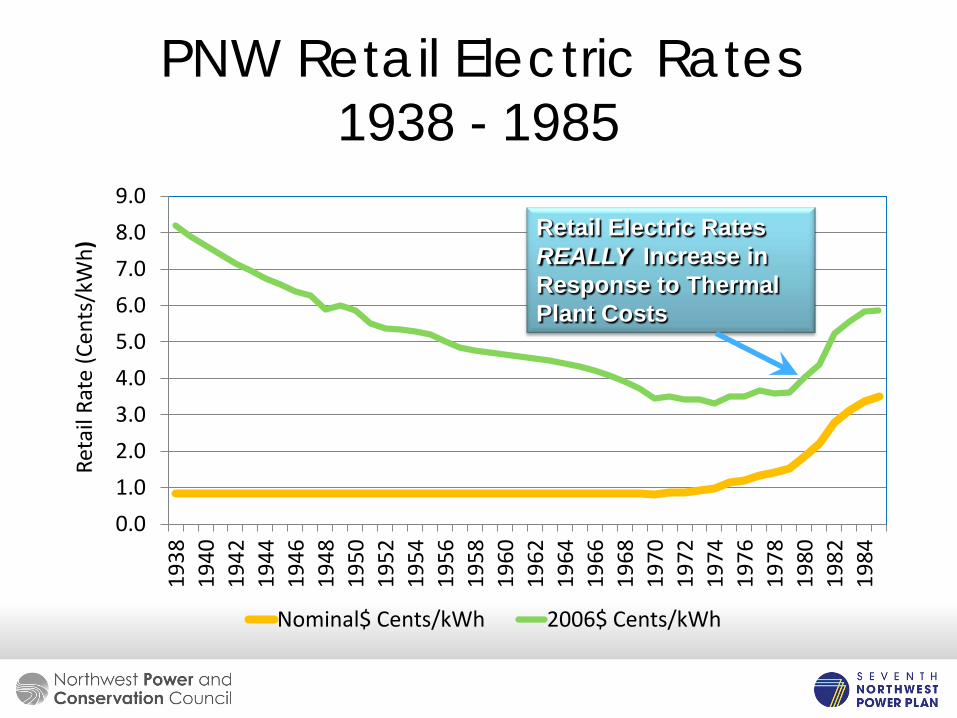
PNW Retail Electric Rates 1938 - 1985
0.0 1.0 2.0 3.0 4.0 5.0 6.0 7.0 8.0 9.0
1938
19
40
1942
19
44
1946
19
48
1950
19
52
1954
19
56
1958
19
60
1962
19
64
1966
19
68
1970
19
72
1974
19
76
1978
19
80
1982
19
84
Reta
il Ra
te (C
ents
/kW
h)
Nominal$ Cents/kWh 2006$ Cents/kWh
Retail Electric Rates REALLY Increase in Response to Thermal Plant Costs
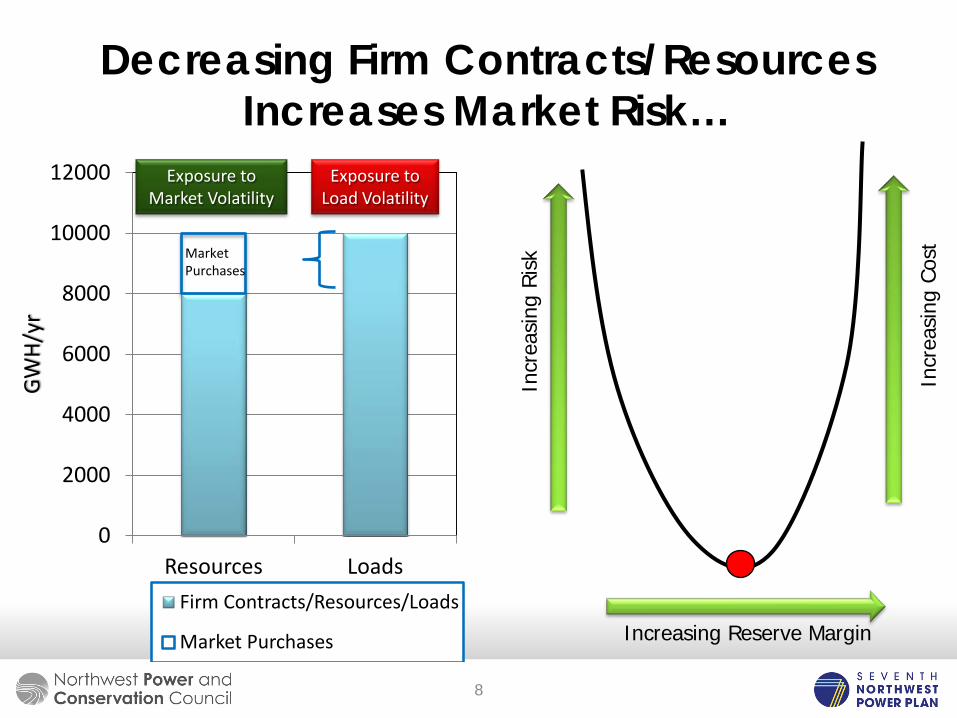
Decreasing Firm Contracts/Resources Increases Market Risk…
0
2000
4000
6000
8000
10000
12000
Resources Loads
GWH/
yr
Firm Contracts/Resources/Loads
Market Purchases
Incr
easi
ng R
isk
Increasing Reserve Margin
Exposure to Market Volatility
Exposure to Load Volatility
Incr
easi
ng C
ost Market
Purchases
8
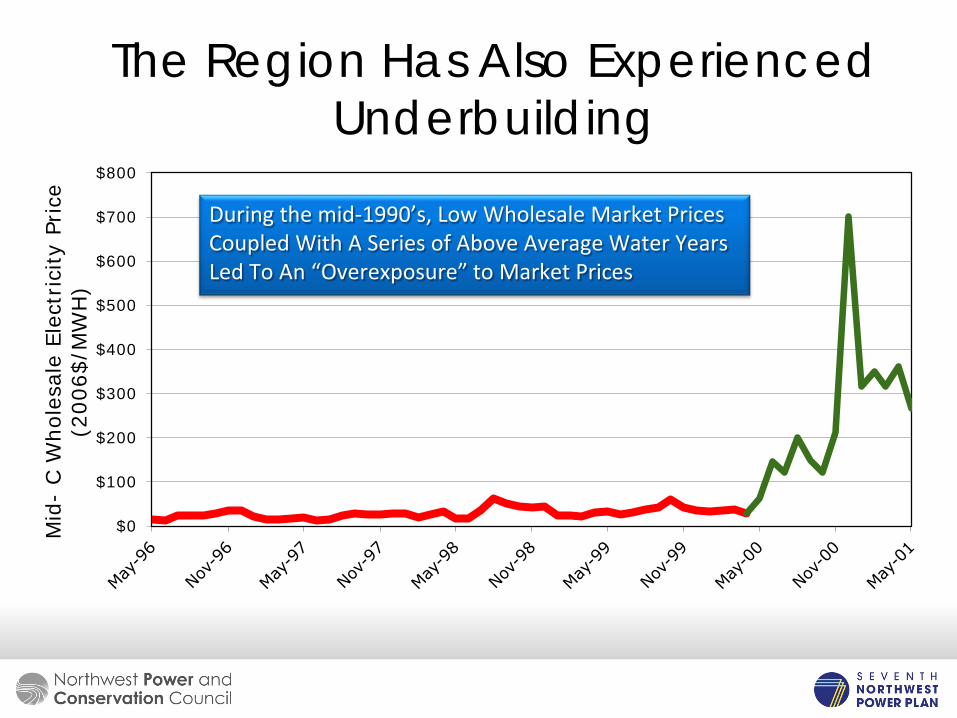
The Region Has Also Experienced Underbuilding
$0
$100
$200
$300
$400
$500
$600
$700
$800
Mid
- C W
hole
sale
Ele
ctrici
ty P
rice
(2
006$
/MW
H)
During the mid-1990’s, Low Wholesale Market Prices Coupled With A Series of Above Average Water Years Led To An “Overexposure” to Market Prices
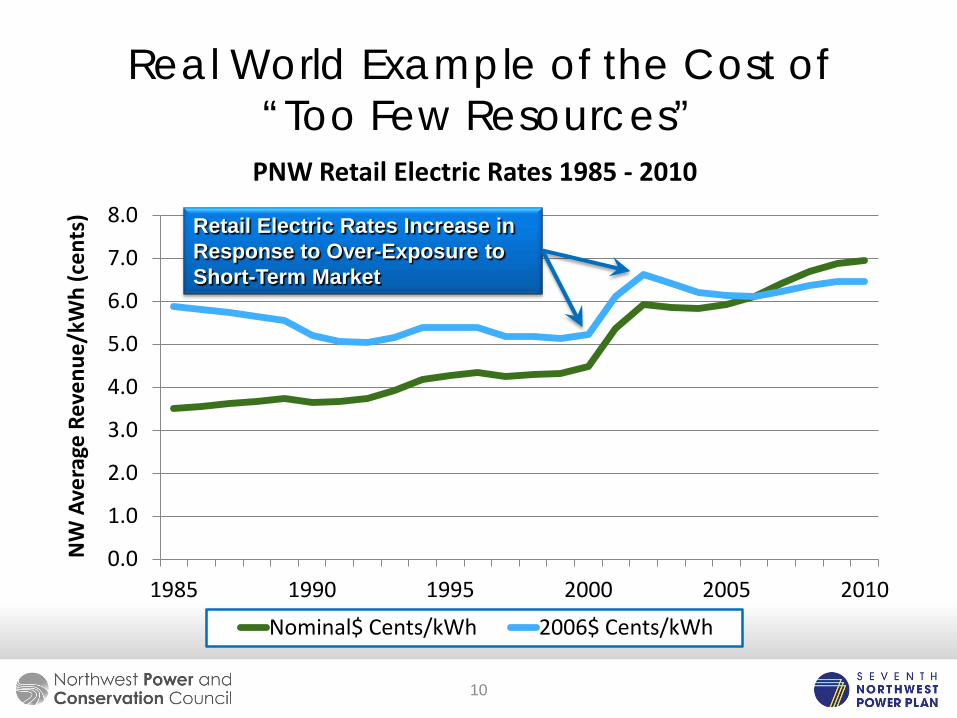
Real World Example of the Cost of “Too Few Resources”
0.0
1.0
2.0
3.0
4.0
5.0
6.0
7.0
8.0
1985 1990 1995 2000 2005 2010
NW
Ave
rage
Rev
enue
/kW
h (c
ents
)
PNW Retail Electric Rates 1985 - 2010
Nominal$ Cents/kWh 2006$ Cents/kWh
Retail Electric Rates Increase in Response to Over-Exposure to Short-Term Market
10
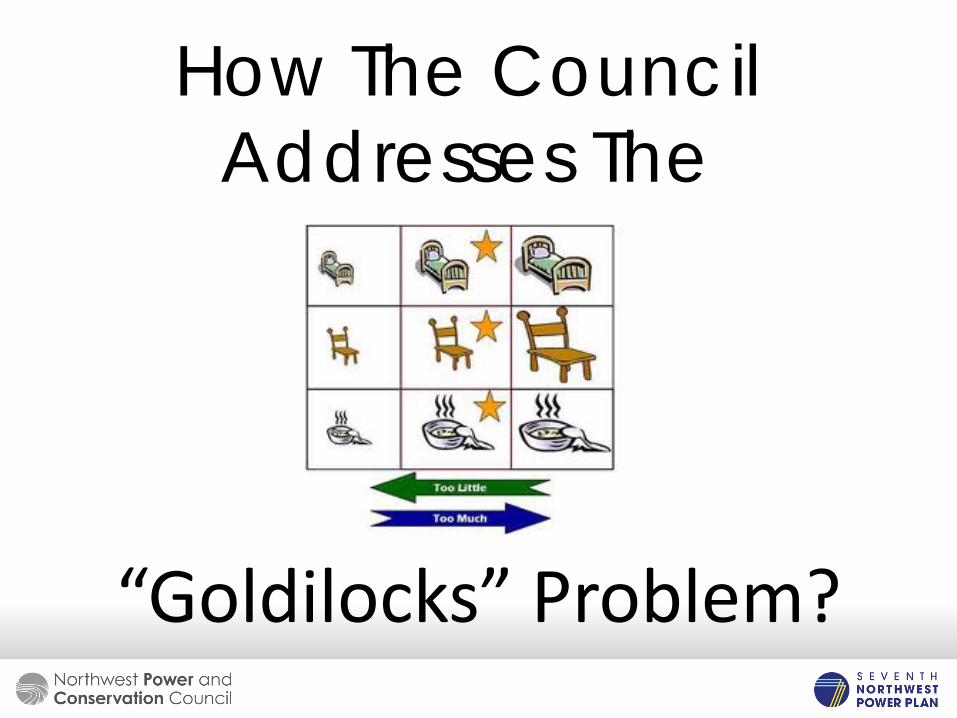
How The Council Addresses The
“Goldilocks” Problem?
First, We’ve Broken the Problem Into Six Simple Questions
1. When Will We Need Resources? 2. How Much Will We Need? 3. What Should We Build/Buy? 4. How Much Will It Cost? 5. What’s the Risk? 6. Who Can We Blame If We Get It Wrong?
(Answer – the Staff)
All Plans Require Assumptions About the Future
However, it is an occupational hazard of planners!
Perfect Foresight (i.e., prescience) is not possible.
13
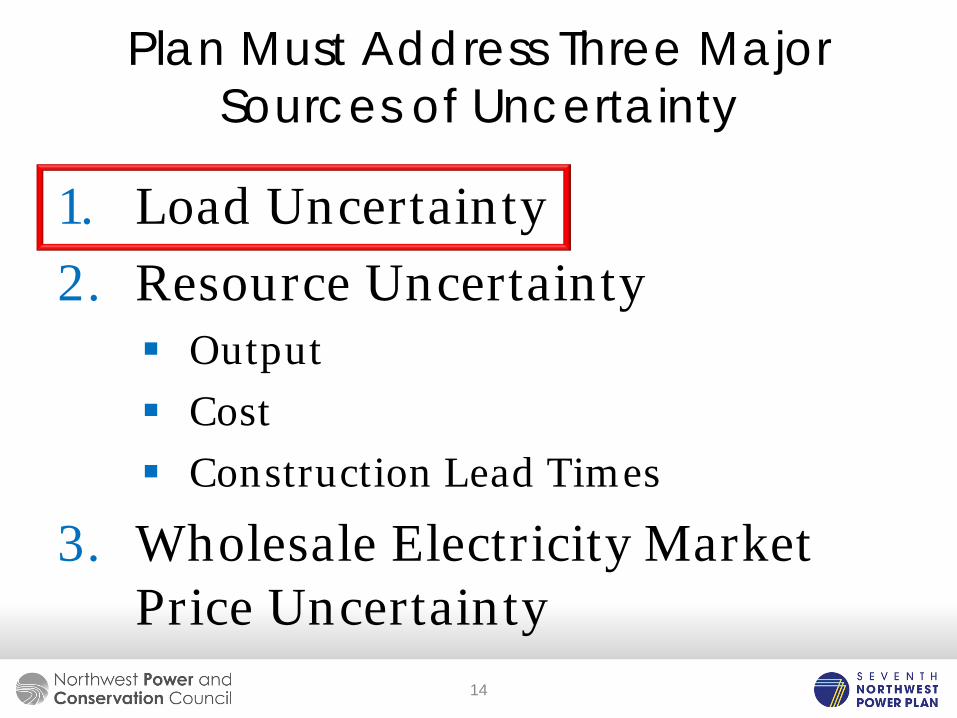
Plan Must Address Three Major Sources of Uncertainty
1. Load Uncertainty 2. Resource Uncertainty
Output Cost Construction Lead Times
3. Wholesale Electricity Market Price Uncertainty
14
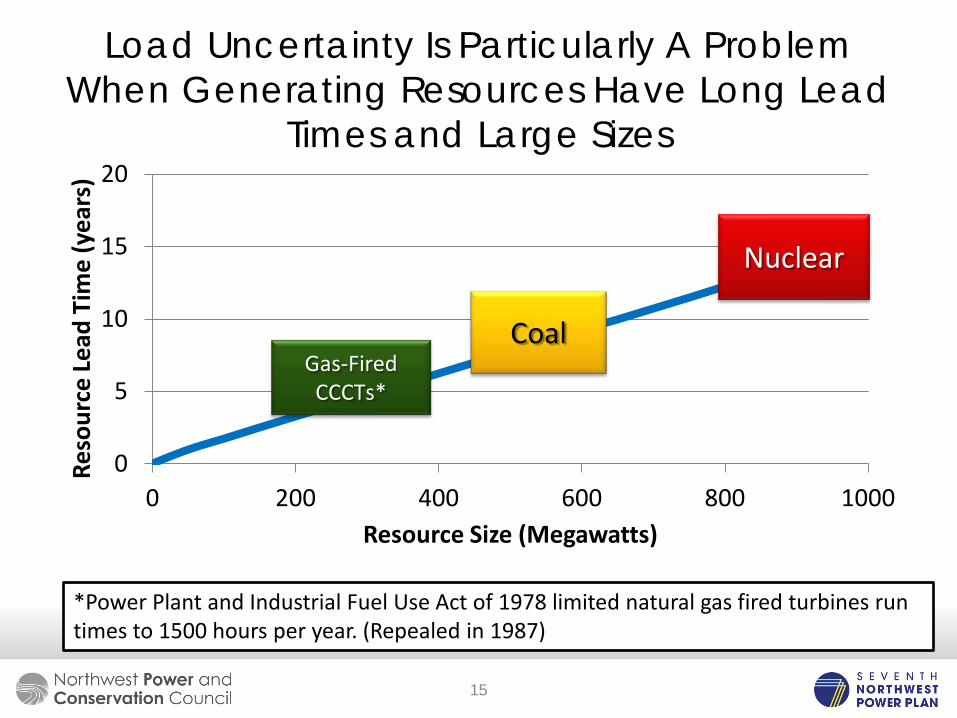
Load Uncertainty Is Particularly A Problem When Generating Resources Have Long Lead
Times and Large Sizes
0
5
10
15
20
0 200 400 600 800 1000
Reso
urce
Lead
Tim
e (y
ears
)
Resource Size (Megawatts)
Nuclear
Coal Gas-Fired CCCTs*
*Power Plant and Industrial Fuel Use Act of 1978 limited natural gas fired turbines run times to 1500 hours per year. (Repealed in 1987)
15
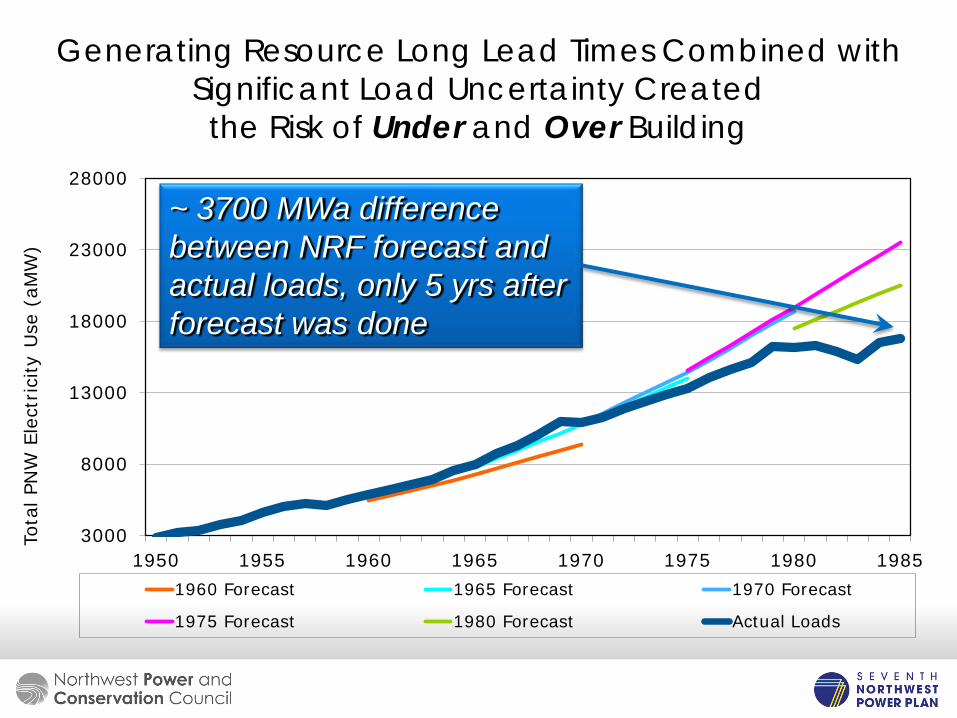
Generating Resource Long Lead Times Combined with Significant Load Uncertainty Created the Risk of Under and Over Building
3000
8000
13000
18000
23000
28000
1950 1955 1960 1965 1970 1975 1980 1985
Tota
l PN
W E
lect
rici
ty U
se (
aMW
)
1960 Forecast 1965 Forecast 1970 Forecast
1975 Forecast 1980 Forecast Actual Loads
~ 3700 MWa difference between NRF forecast and actual loads, only 5 yrs after forecast was done
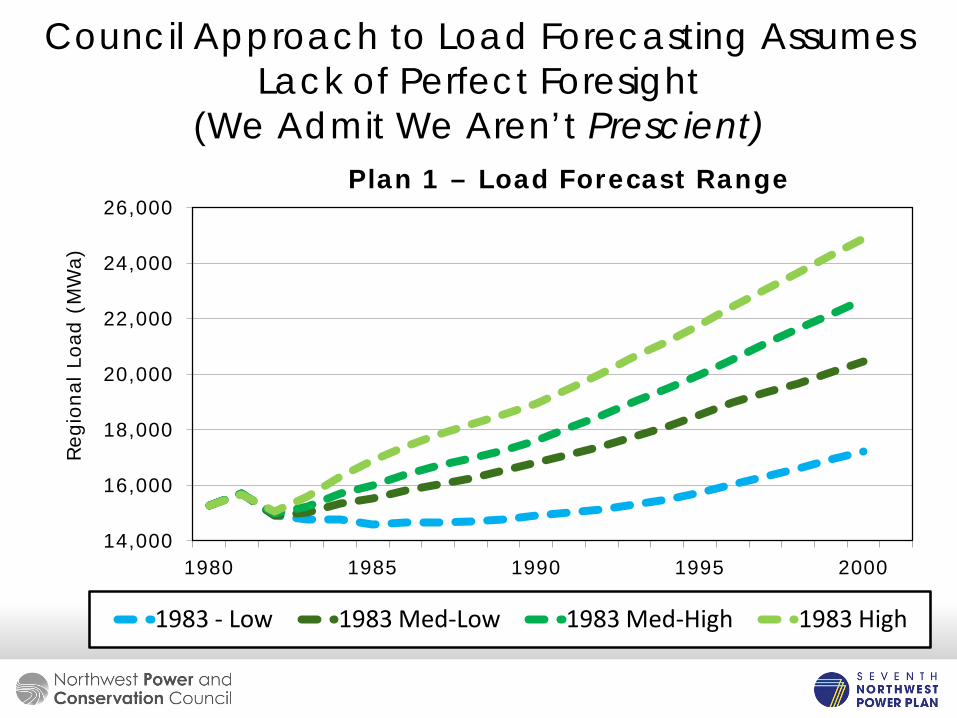
Council Approach to Load Forecasting Assumes Lack of Perfect Foresight
(We Admit We Aren’t Prescient)
14,000
16,000
18,000
20,000
22,000
24,000
26,000
1980 1985 1990 1995 2000
Regi
onal
Loa
d (M
Wa)
Plan 1 – Load Forecast Range
1983 - Low 1983 Med-Low 1983 Med-High 1983 High
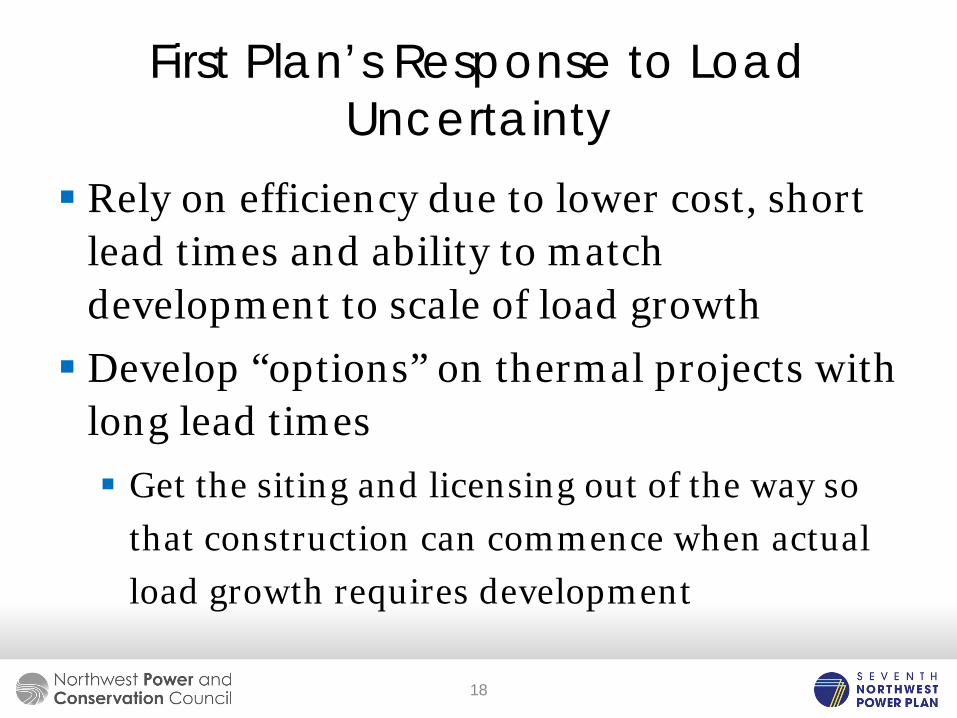
First Plan’s Response to Load Uncertainty
Rely on efficiency due to lower cost, short lead times and ability to match development to scale of load growth Develop “options” on thermal projects with
long lead times Get the siting and licensing out of the way so
that construction can commence when actual load growth requires development
18
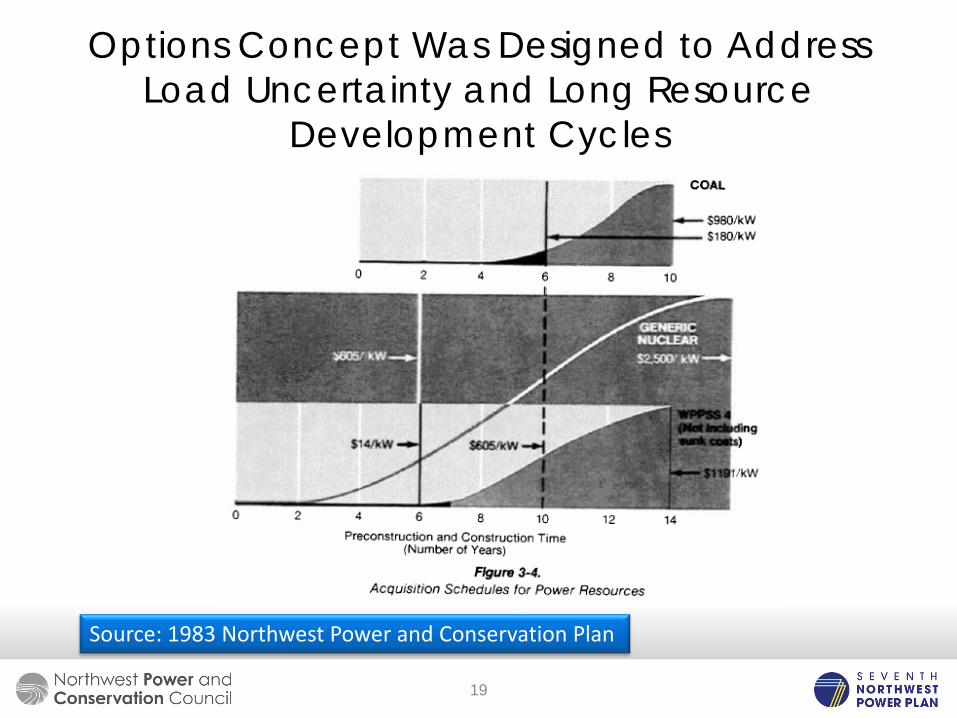
Options Concept Was Designed to Address Load Uncertainty and Long Resource
Development Cycles
Source: 1983 Northwest Power and Conservation Plan
19
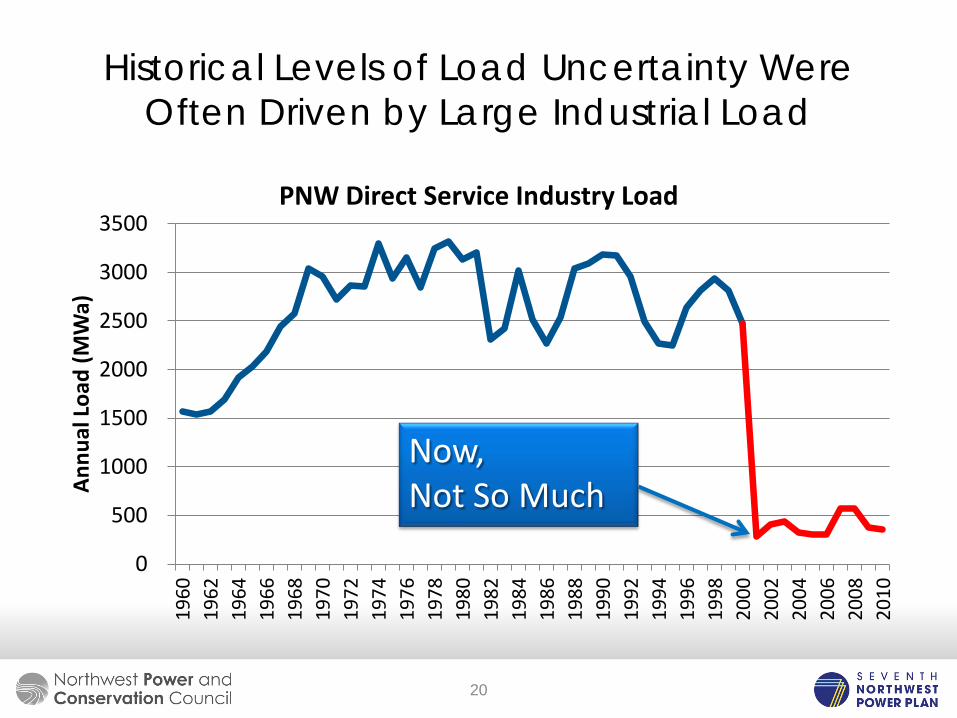
Historical Levels of Load Uncertainty Were Often Driven by Large Industrial Load
0
500
1000
1500
2000
2500
3000
3500
1960
19
62
1964
19
66
1968
19
70
1972
19
74
1976
19
78
1980
19
82
1984
19
86
1988
19
90
1992
19
94
1996
19
98
2000
20
02
2004
20
06
2008
20
10
Annu
al Lo
ad (M
Wa)
PNW Direct Service Industry Load
Now, Not So Much
20
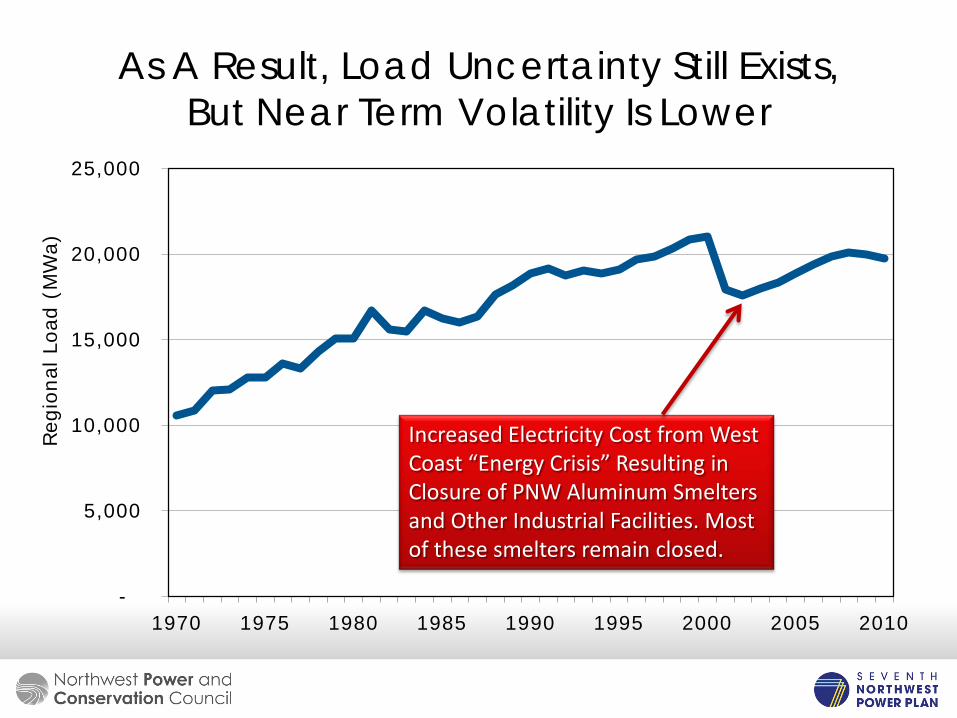
As A Result, Load Uncertainty Still Exists, But Near Term Volatility Is Lower
-
5,000
10,000
15,000
20,000
25,000
1970 1975 1980 1985 1990 1995 2000 2005 2010
Regi
onal
Loa
d (M
Wa)
Increased Electricity Cost from West Coast “Energy Crisis” Resulting in Closure of PNW Aluminum Smelters and Other Industrial Facilities. Most of these smelters remain closed.
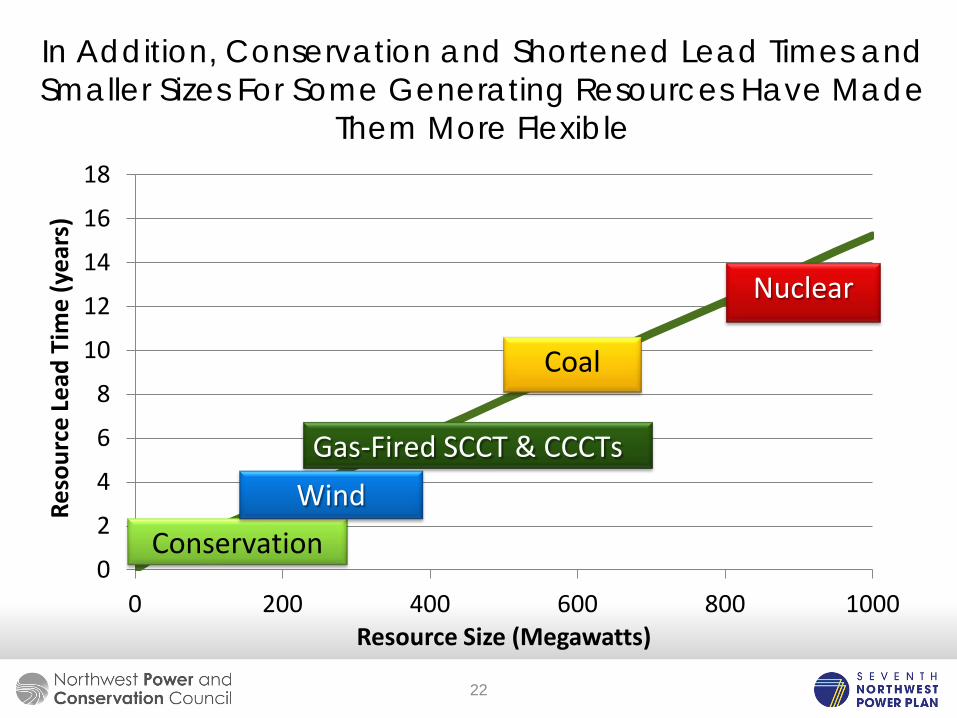
In Addition, Conservation and Shortened Lead Times and Smaller Sizes For Some Generating Resources Have Made
Them More Flexible
0
2
4
6
8
10
12
14
16
18
0 200 400 600 800 1000
Reso
urce
Lead
Tim
e (y
ears
)
Resource Size (Megawatts)
Nuclear
Coal
Conservation
Gas-Fired SCCT & CCCTs Wind
22
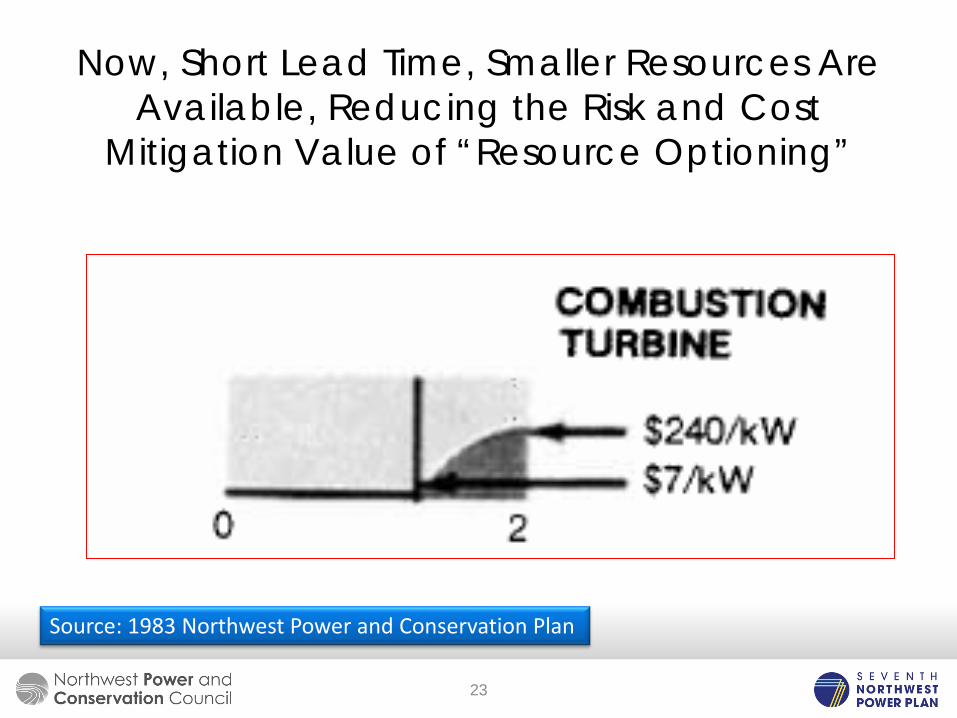
Now, Short Lead Time, Smaller Resources Are Available, Reducing the Risk and Cost
Mitigation Value of “Resource Optioning”
Source: 1983 Northwest Power and Conservation Plan
23
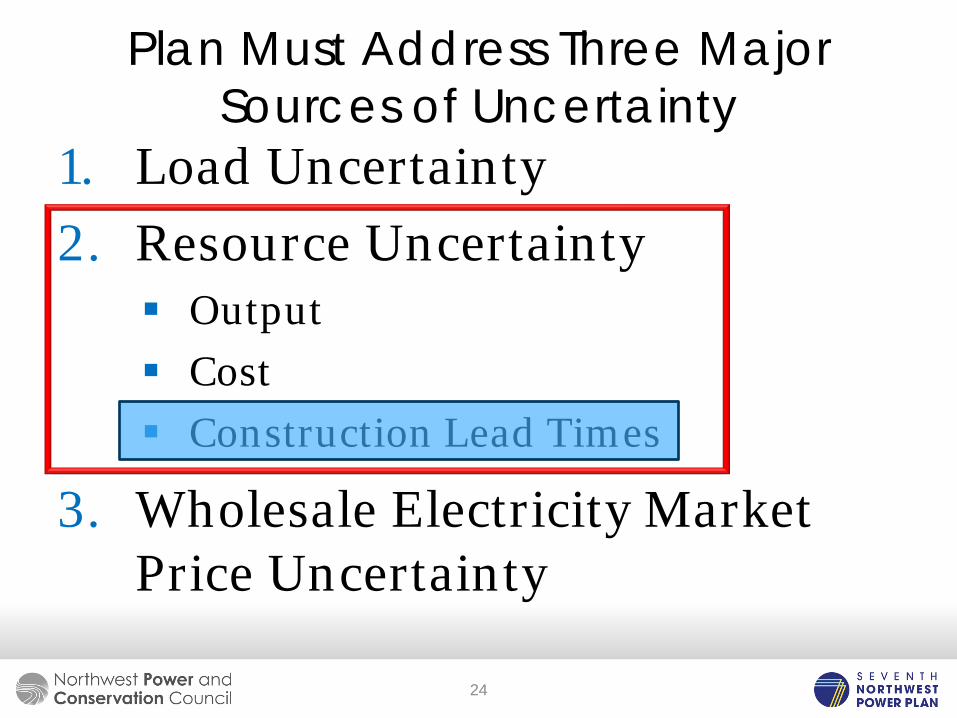
Plan Must Address Three Major Sources of Uncertainty
1. Load Uncertainty 2. Resource Uncertainty
Output Cost Construction Lead Times
3. Wholesale Electricity Market Price Uncertainty
24
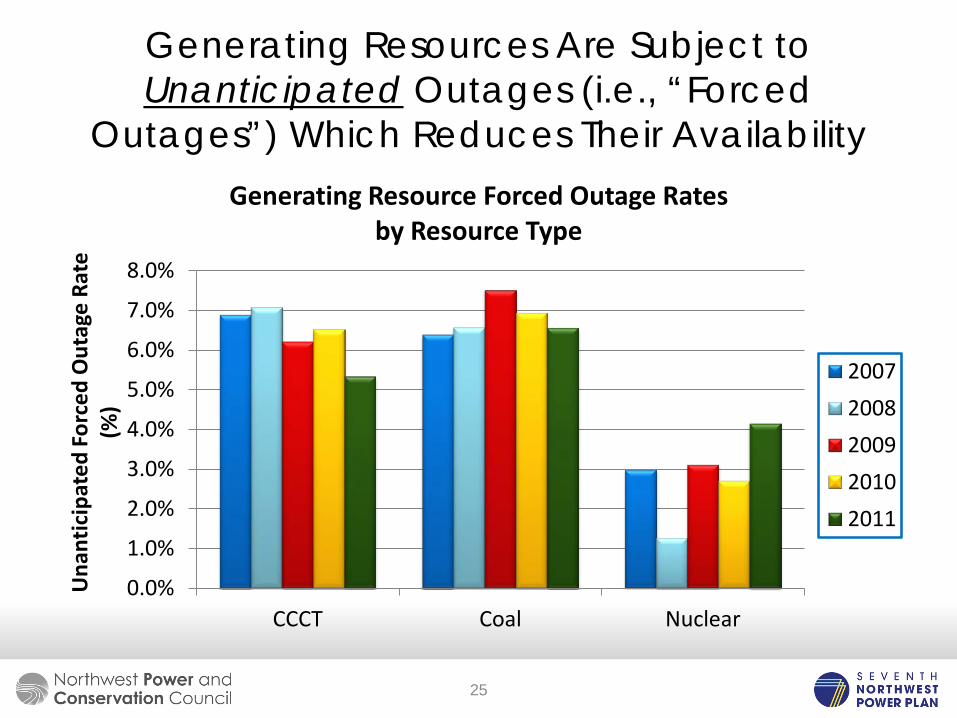
Generating Resources Are Subject to Unanticipated Outages (i.e., “Forced
Outages”) Which Reduces Their Availability
0.0%
1.0%
2.0%
3.0%
4.0%
5.0%
6.0%
7.0%
8.0%
CCCT Coal Nuclear
Una
ntic
ipat
ed F
orce
d O
utag
e Ra
te
(%)
Generating Resource Forced Outage Rates by Resource Type
2007 2008 2009 2010 2011
25
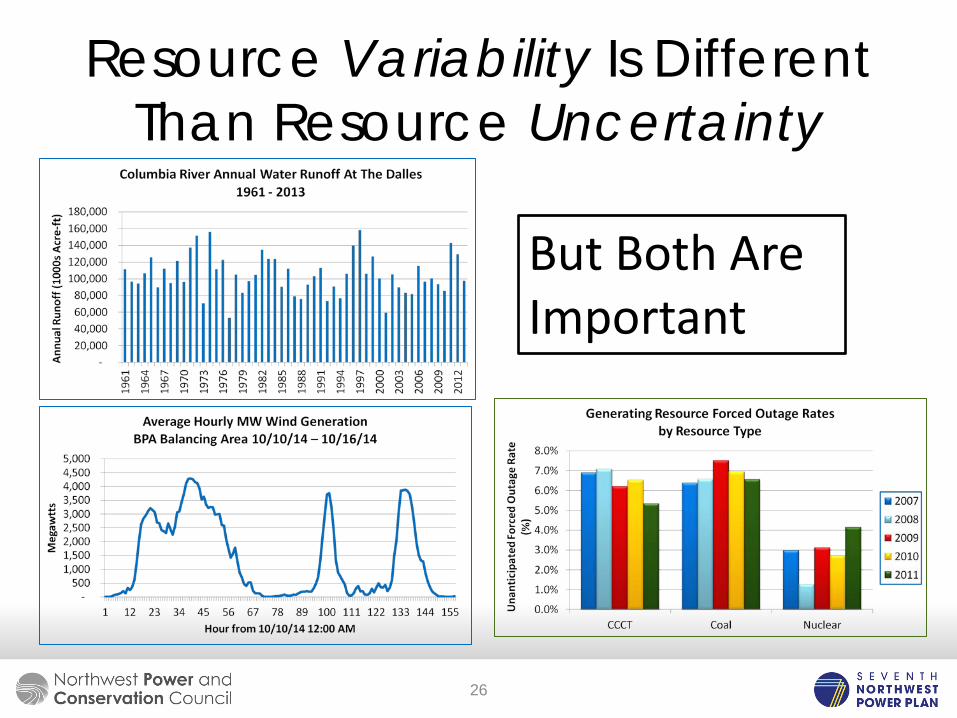
Resource Variability Is Different Than Resource Uncertainty
But Both Are Important
26
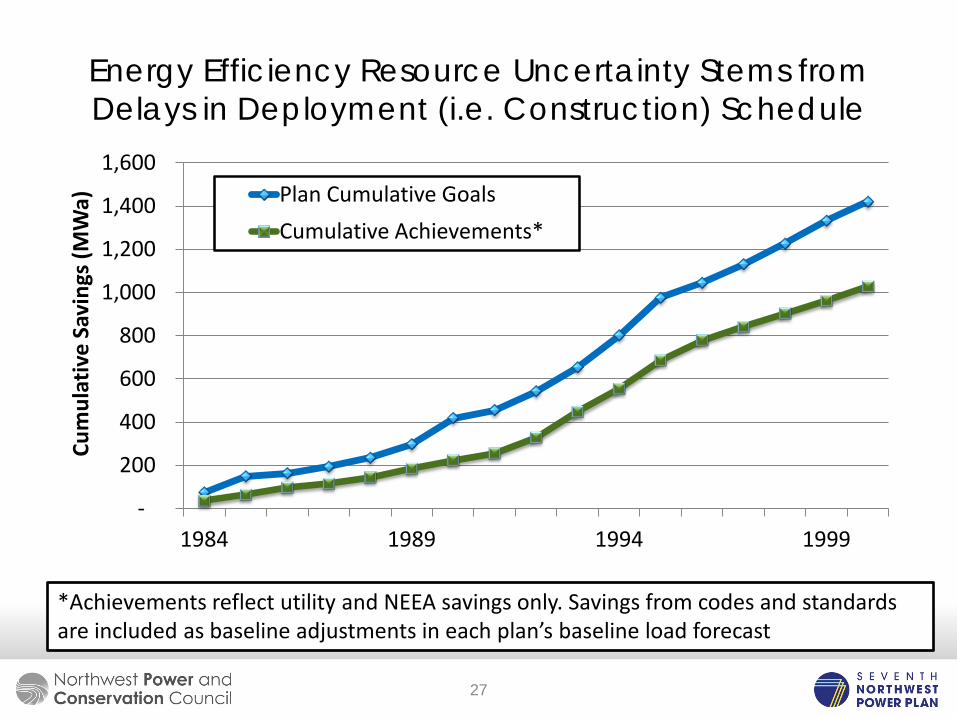
Energy Efficiency Resource Uncertainty Stems from Delays in Deployment (i.e. Construction) Schedule
-
200
400
600
800
1,000
1,200
1,400
1,600
1984 1989 1994 1999
Cum
ulat
ive
Savi
ngs (
MW
a) Plan Cumulative Goals
Cumulative Achievements*
*Achievements reflect utility and NEEA savings only. Savings from codes and standards are included as baseline adjustments in each plan’s baseline load forecast
27
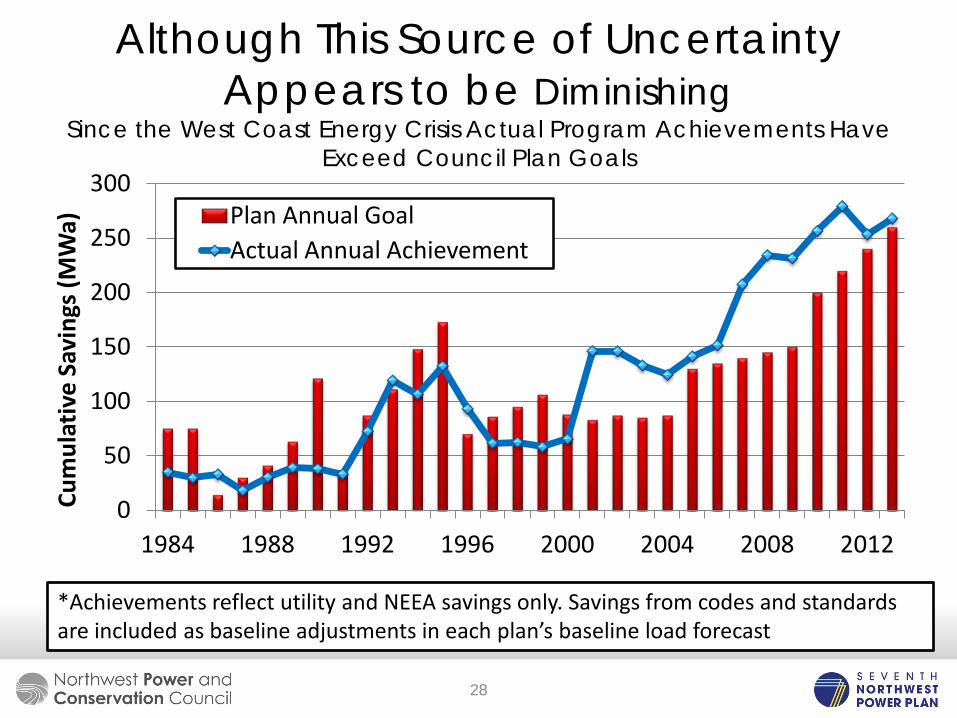
Although This Source of Uncertainty Appears to be Diminishing
Since the West Coast Energy Crisis Actual Program Achievements Have Exceed Council Plan Goals
0
50
100
150
200
250
300
1984 1988 1992 1996 2000 2004 2008 2012
Cum
ulat
ive
Savi
ngs (
MW
a) Plan Annual Goal
Actual Annual Achievement
*Achievements reflect utility and NEEA savings only. Savings from codes and standards are included as baseline adjustments in each plan’s baseline load forecast
28
$0
$50
$100
$150
$200
$250
$300
10% 20% 30% 40% 50% 60% 70% 80% 90% 100%
Real
Lev
elize
d Co
st (2
006$
/MW
h)
Lifetime Capacity Factor
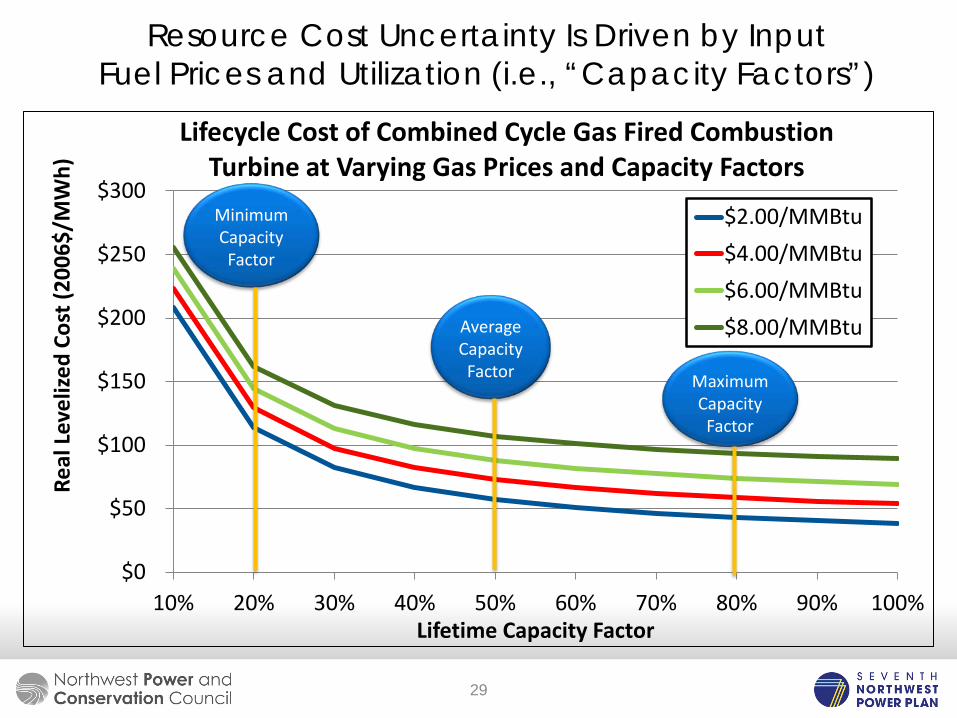
Lifecycle Cost of Combined Cycle Gas Fired Combustion Turbine at Varying Gas Prices and Capacity Factors
$2.00/MMBtu $4.00/MMBtu $6.00/MMBtu $8.00/MMBtu
Resource Cost Uncertainty Is Driven by Input Fuel Prices and Utilization (i.e., “Capacity Factors”)
Minimum Capacity
Factor
Average Capacity
Factor Maximum Capacity
Factor
29
-
2.0
4.0
6.0
8.0
10.0
12.0
14.0
16.0 Ja
n-91
Jan-
92
Jan-
93
Jan-
94
Jan-
95
Jan-
96
Jan-
97
Jan-
98
Jan-
99
Jan-
00
Jan-
01
Jan-
02
Jan-
03
Jan-
04
Jan-
05
Jan-
06
Jan-
07
Jan-
08
Jan-
09
Jan-
10
Jan-
11
Jan-
12
Jan-
13
Pric
e In
dex
Com
pare
d to
Ja
n-19
91 P
rice
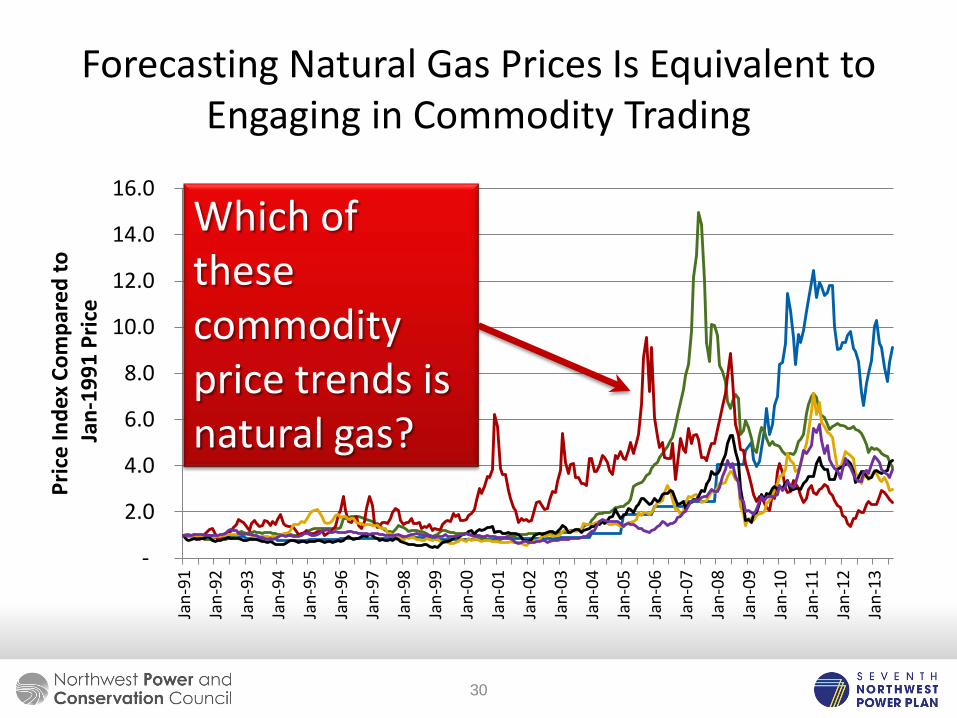
Iron Ore Wheat Natural Gas (Henry HUB) Rubber Crude Oil - West Texas Uranium
Forecasting Natural Gas Prices Is Equivalent to Engaging in Commodity Trading
Which of these commodity price trends is natural gas?
30
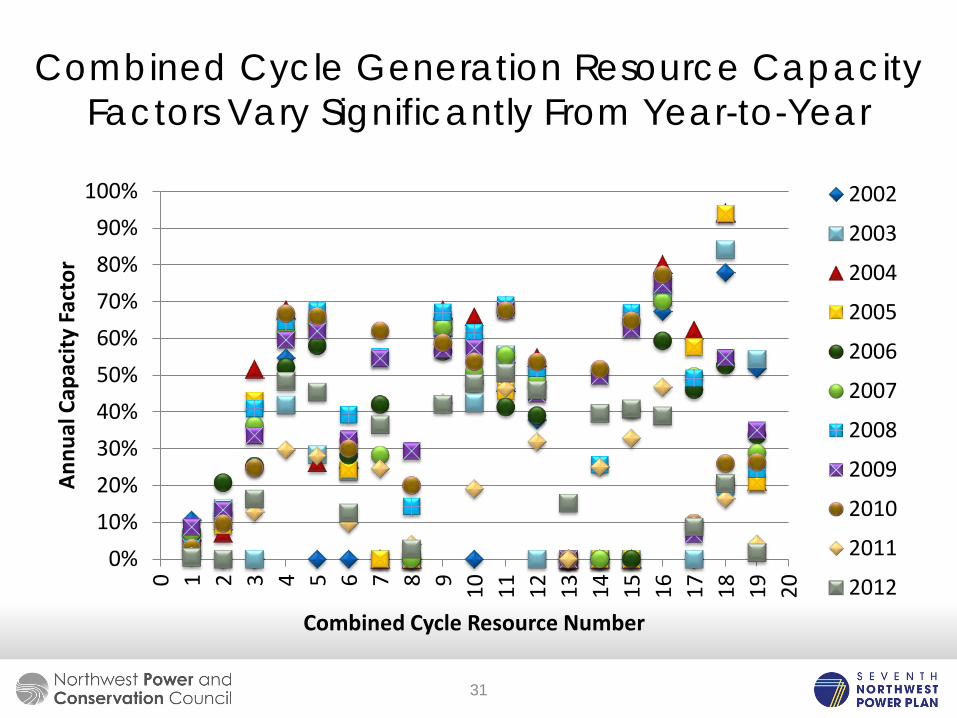
Combined Cycle Generation Resource Capacity Factors Vary Significantly From Year-to-Year
0% 10% 20% 30% 40% 50% 60% 70% 80% 90%
100% 0 1 2 3 4 5 6 7 8 9 10
11
12
13
14
15
16
17
18
19
20
Annu
al C
apac
ity F
acto
r
Combined Cycle Resource Number
2002
2003
2004
2005
2006
2007
2008
2009
2010
2011
2012
31
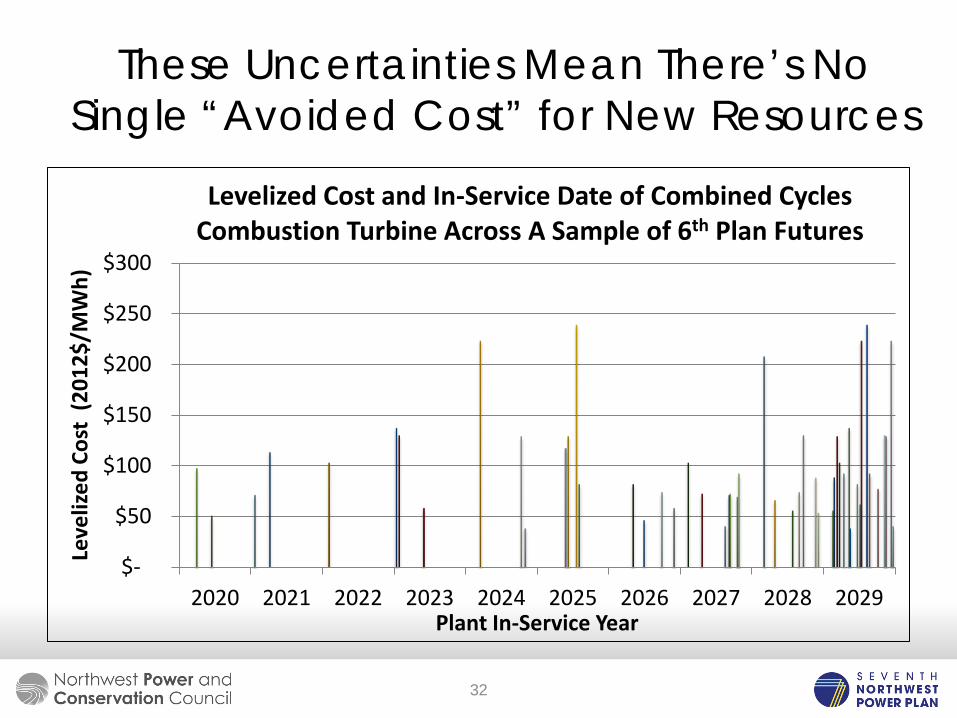
These Uncertainties Mean There’s No Single “Avoided Cost” for New Resources
$-
$50
$100
$150
$200
$250
$300
2020 2021 2022 2023 2024 2025 2026 2027 2028 2029
Leve
lized
Cos
t (2
012$
/MW
h)
Plant In-Service Year
Levelized Cost and In-Service Date of Combined Cycles Combustion Turbine Across A Sample of 6th Plan Futures
32
Plan Must Address Three Major Sources of Uncertainty
1. Load Uncertainty 2. Resource Uncertainty
Output Cost Construction Lead Times
3. Wholesale Electricity Market Price Uncertainty
33
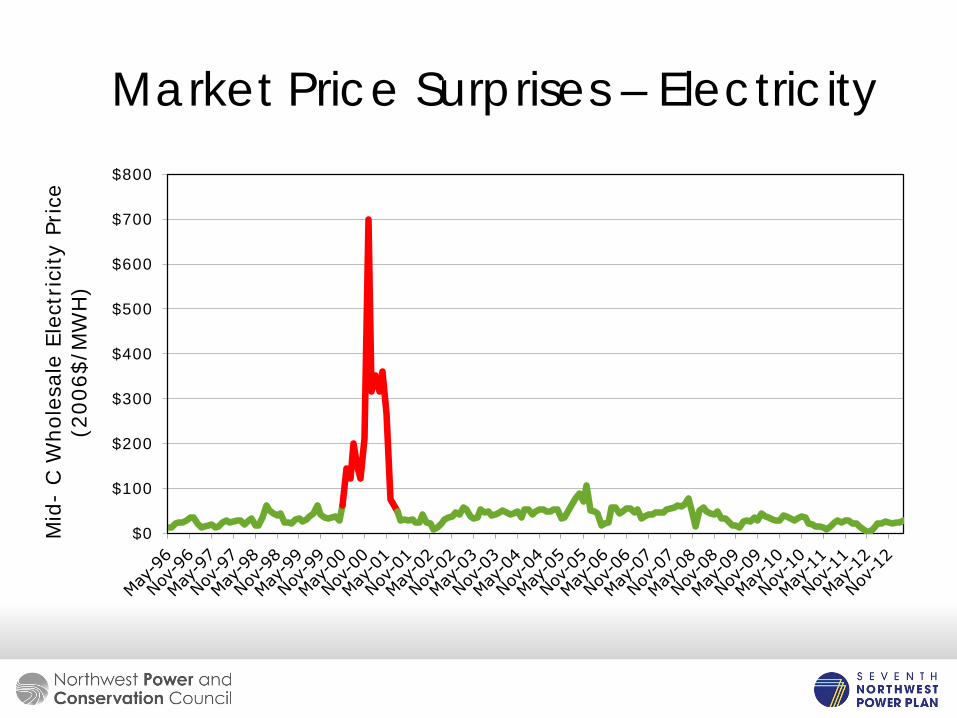
Market Price Surprises – Electricity
$0
$100
$200
$300
$400
$500
$600
$700
$800
Mid
- C W
hole
sale
Ele
ctrici
ty P
rice
(2
006$
/MW
H)
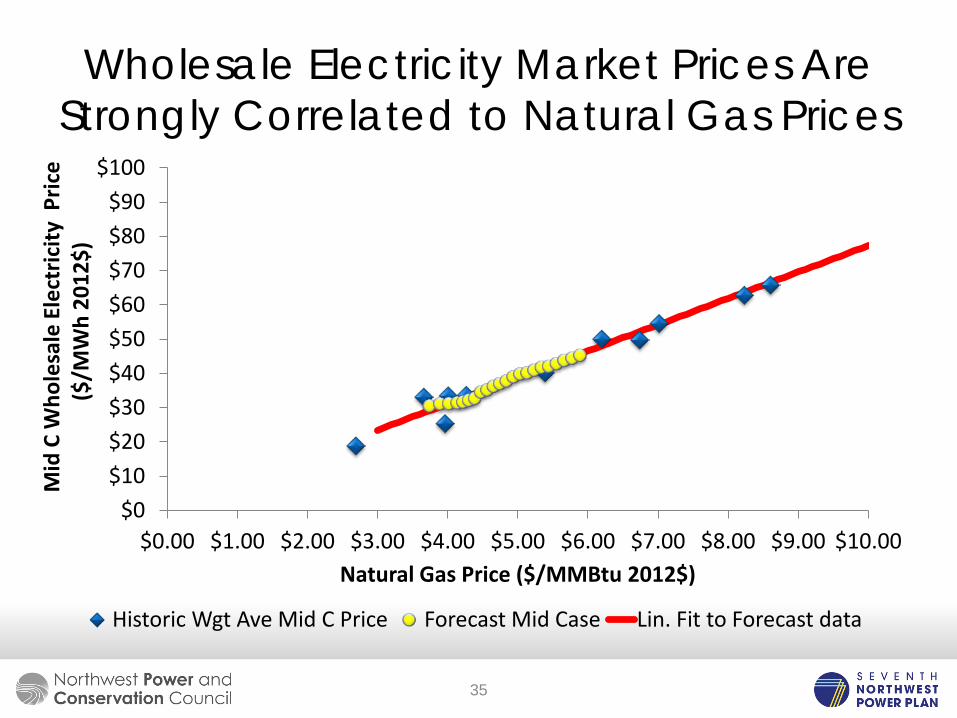
$0 $10 $20 $30 $40 $50 $60 $70 $80 $90
$100
$0.00 $1.00 $2.00 $3.00 $4.00 $5.00 $6.00 $7.00 $8.00 $9.00 $10.00
Mid
C W
hole
sale
Ele
ctric
ity P
rice
($/
MW
h 20
12$)
Natural Gas Price ($/MMBtu 2012$)
Historic Wgt Ave Mid C Price Forecast Mid Case Lin. Fit to Forecast data
Wholesale Electricity Market Prices Are Strongly Correlated to Natural Gas Prices
35
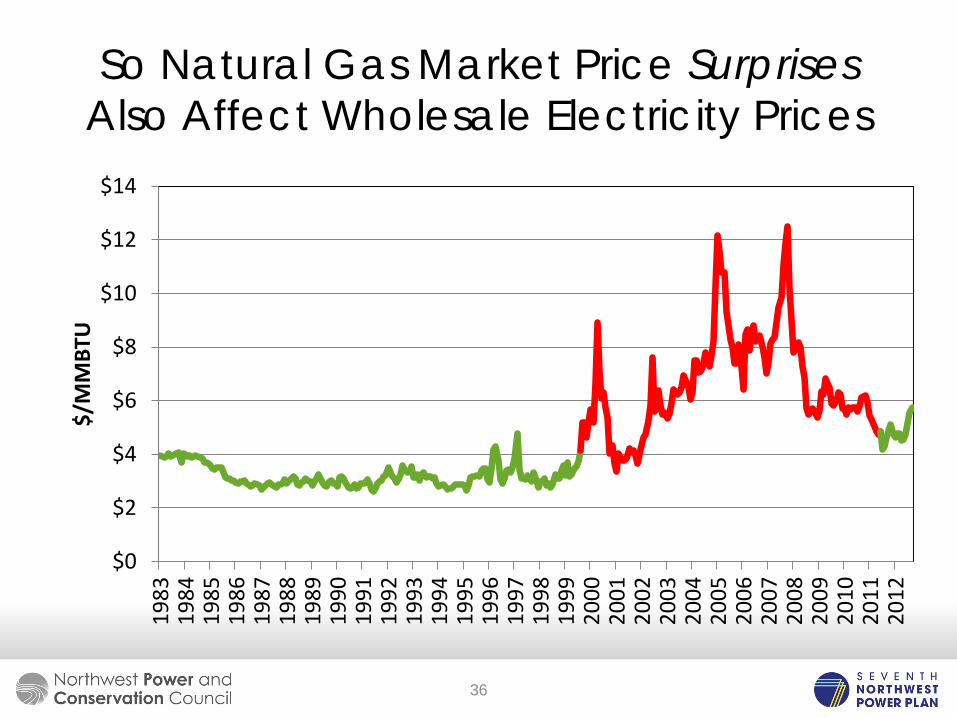
So Natural Gas Market Price Surprises Also Affect Wholesale Electricity Prices
$0
$2
$4
$6
$8
$10
$12
$14 19
83
1984
19
85
1986
19
87
1988
19
89
1990
19
91
1992
19
93
1994
19
95
1996
19
97
1998
19
99
2000
20
01
2002
20
03
2004
20
05
2006
20
07
2008
20
09
2010
20
11
2012
$/M
MBT
U
36
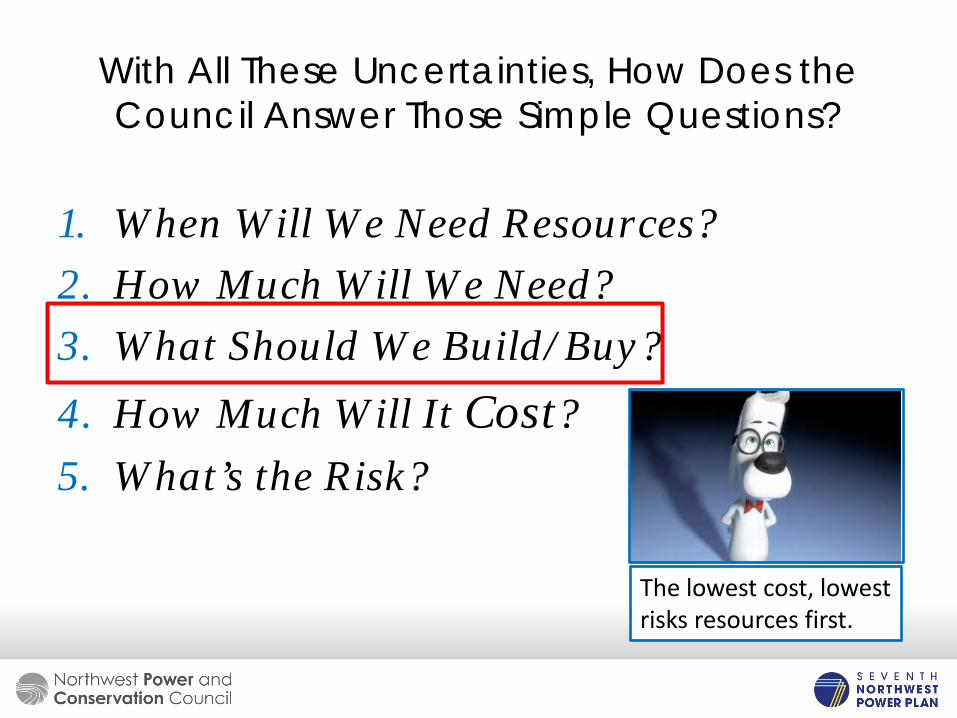
With All These Uncertainties, How Does the Council Answer Those Simple Questions?
1. When Will We Need Resources? 2. How Much Will We Need? 3. What Should We Build/Buy? 4. How Much Will It Cost? 5. What’s the Risk?
The lowest cost, lowest risks resources first.
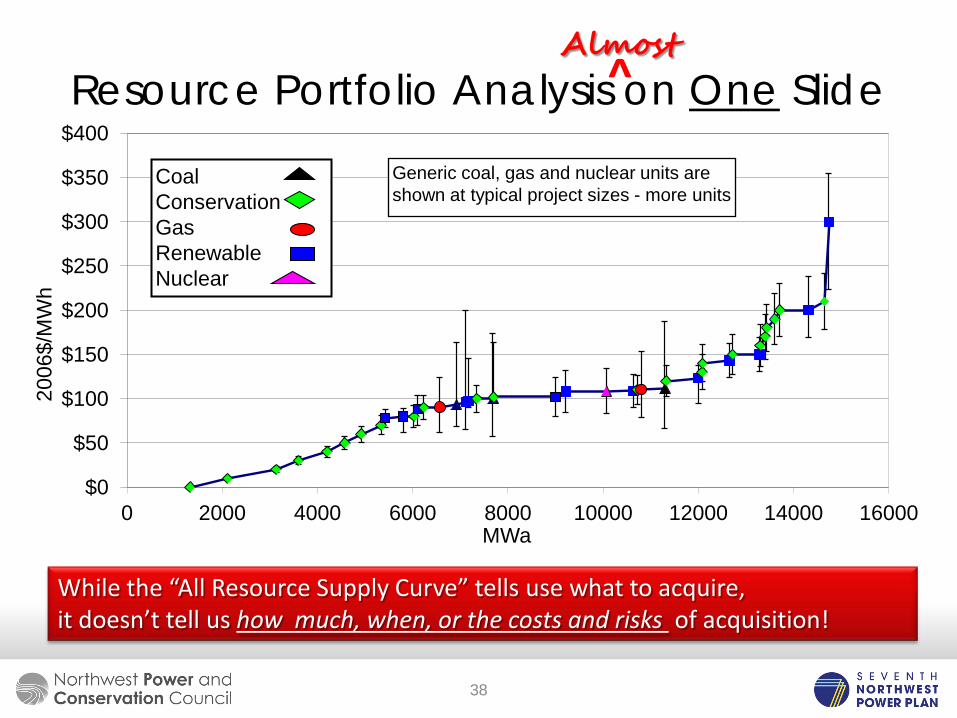
Resource Portfolio Analysis on One Slide
$0
$50
$100
$150
$200
$250
$300
$350
$400
0 2000 4000 6000 8000 10000 12000 14000 16000
2006
$/M
Wh
MWa
Coal Conservation Gas Renewable Nuclear
Generic coal, gas and nuclear units are shown at typical project sizes - more units
While the “All Resource Supply Curve” tells use what to acquire, it doesn’t tell us how much, when, or the costs and risks of acquisition!
^ Almost
38
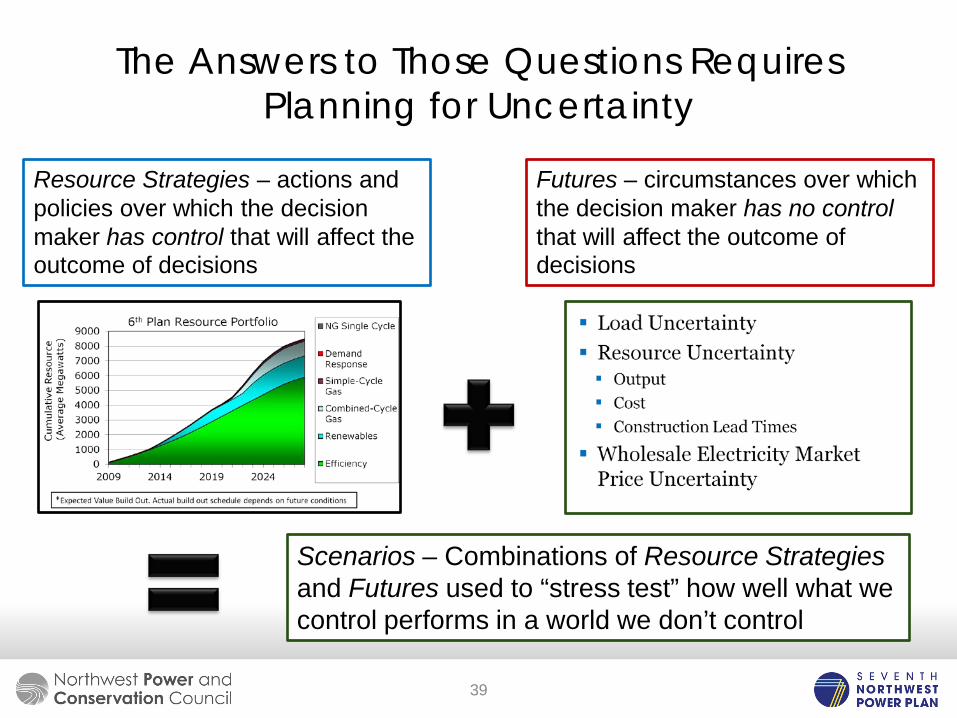
The Answers to Those Questions Requires Planning for Uncertainty
Resource Strategies – actions and policies over which the decision maker has control that will affect the outcome of decisions
Futures – circumstances over which the decision maker has no control that will affect the outcome of decisions
Scenarios – Combinations of Resource Strategies and Futures used to “stress test” how well what we control performs in a world we don’t control
39
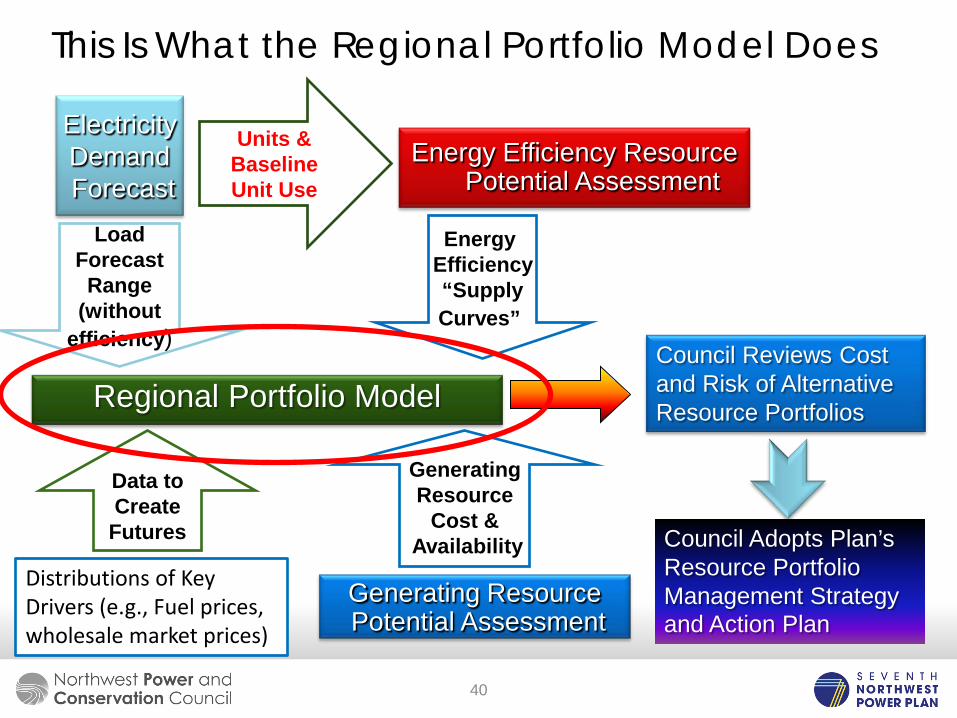
This Is What the Regional Portfolio Model Does
Electricity Demand Forecast
Regional Portfolio Model
Generating Resource Potential Assessment
Energy Efficiency “Supply Curves”
Load Forecast Range
(without efficiency)
Generating Resource
Cost & Availability
Energy Efficiency Resource Potential Assessment
Units & Baseline Unit Use
Council Reviews Cost and Risk of Alternative Resource Portfolios
Distributions of Key Drivers (e.g., Fuel prices, wholesale market prices)
Data to Create
Futures Council Adopts Plan’s Resource Portfolio Management Strategy and Action Plan
40
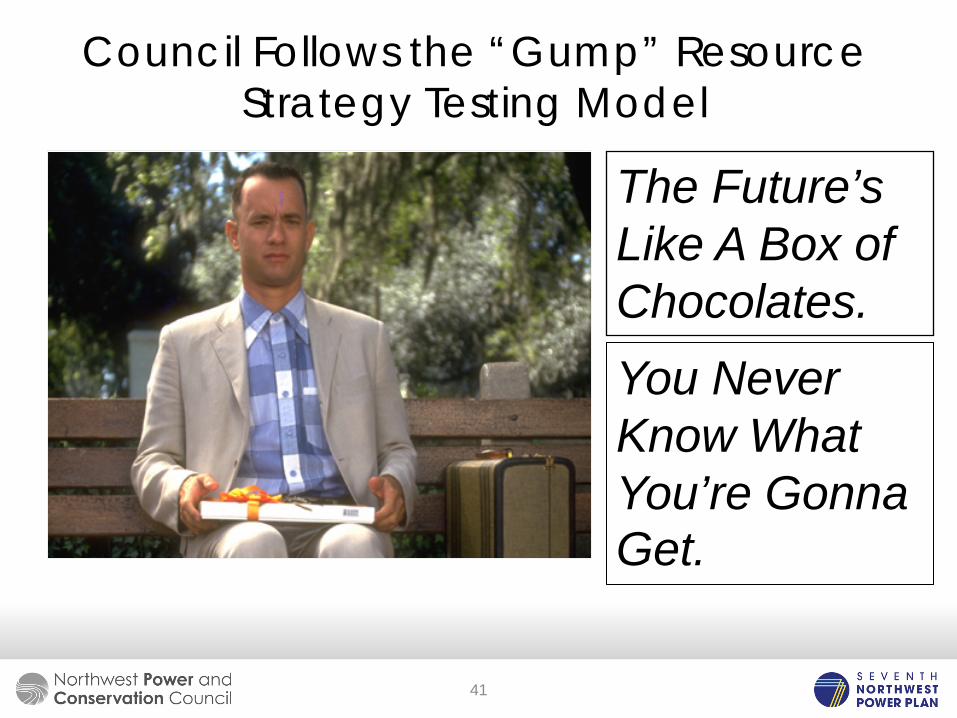
Council Follows the “Gump” Resource Strategy Testing Model
The Future’s Like A Box of Chocolates. You Never Know What You’re Gonna Get.
41
0% 2% 4% 6% 8%
10% 12% 14% 16%
0.8%
1.0%
1.3%
1.5%
1.8%
2.0%
2.3%
2.5%
2.8%
3.0%
3.3%
3.5%
3.8%
4.0%
Prob
abili
ty (
%)
Annual Load Growth
$0
$5
$10
$15
$20
$25
2010 2015 2020 2025
2006
$/M
MBtu
Natural Gas Prices
$0
$50
$100
$150
$200
$250
$300
2010 2015 2020 2025
2006
$/M
WH
Wholesale Market Electricity Price
$0
$20
$40
$60
$80
$100
$120
2010 2015 2020 2025
2006
$/To
n
Carbon Price
0
2
4
6
8
10
12
245 514 1598 2202 2560 3444 4934 6735 8945
Rea
l Lev
eliz
ed C
ost
(Cen
ts/k
Wh
- 20
00$)
Cumulative Supply (MW)
Resource Supply Curve
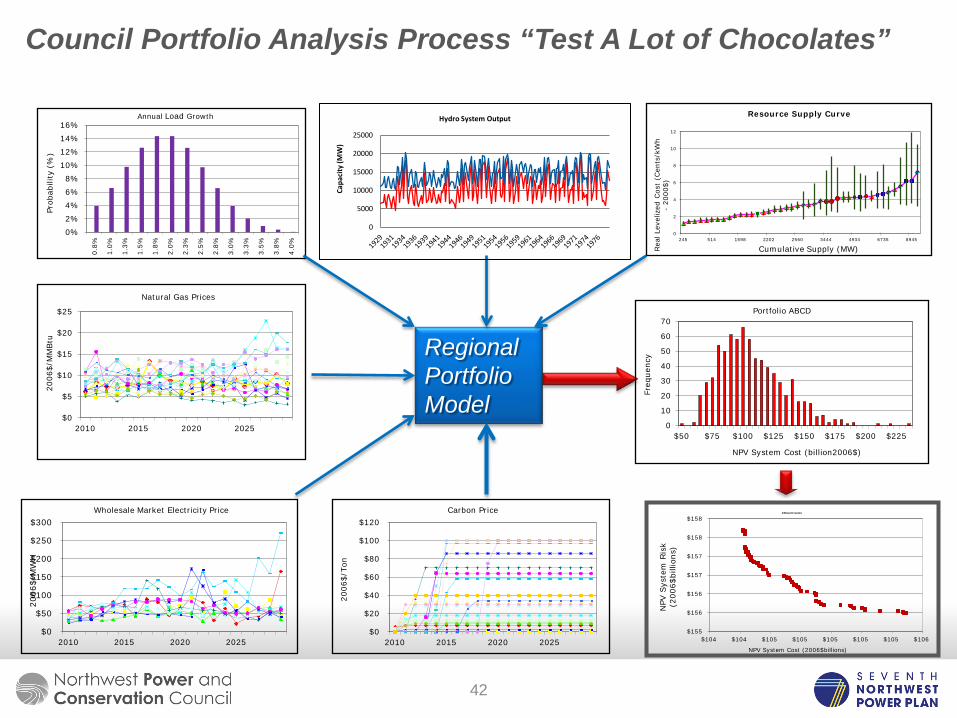
Regional Portfolio Model
0
10
20
30
40
50
60
70
$50 $75 $100 $125 $150 $175 $200 $225
Freq
uenc
y
NPV System Cost (billion2006$)
Portfolio ABCD
$155
$156
$156
$157
$157
$158
$158
$104 $104 $105 $105 $105 $105 $105 $106
NPV
Sys
tem
Ris
k (2
006$
billi
ons)
NPV System Cost (2006$billions)
Efficient Frontier
Council Portfolio Analysis Process “Test A Lot of Chocolates”
0
5000
10000
15000
20000
25000
Capa
city
(MW
)
Hydro System Output
42
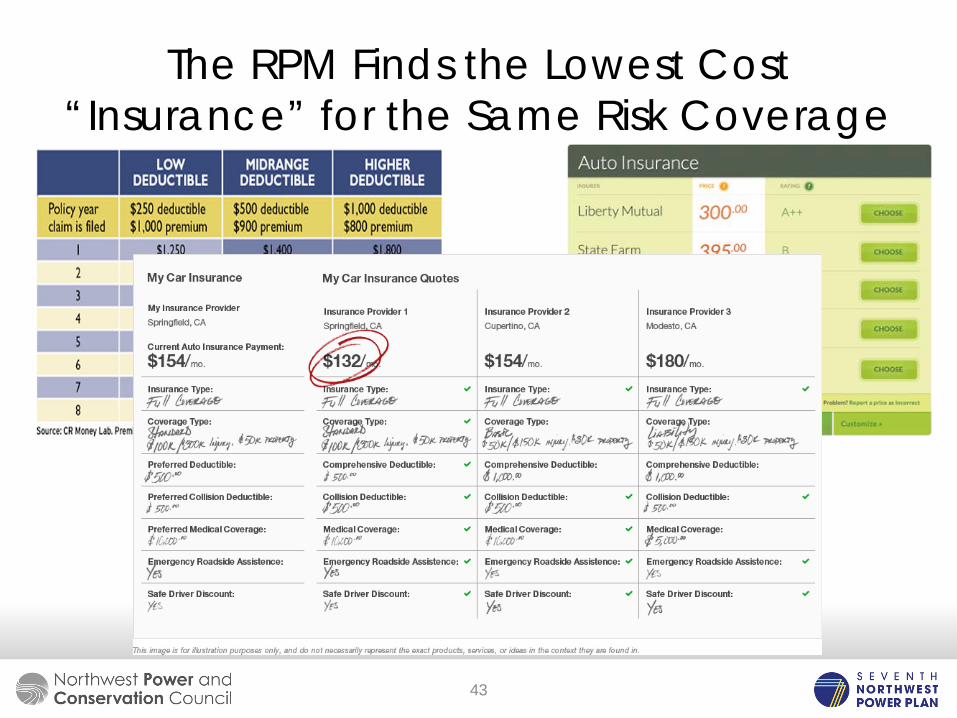
The RPM Finds the Lowest Cost “Insurance” for the Same Risk Coverage
43
What We Learn From “Stress Testing” Alternative Resource Strategies Forms the Basis
of “The Plan”
Does the amount and pace of energy efficiency development change across “low cost” and “low risk” futures? How sensitive are resource strategies to
assumptions regarding future carbon risk/ prices? What resource strategies provide the
greatest “hedge” against electricity and gas price uncertainty?
44
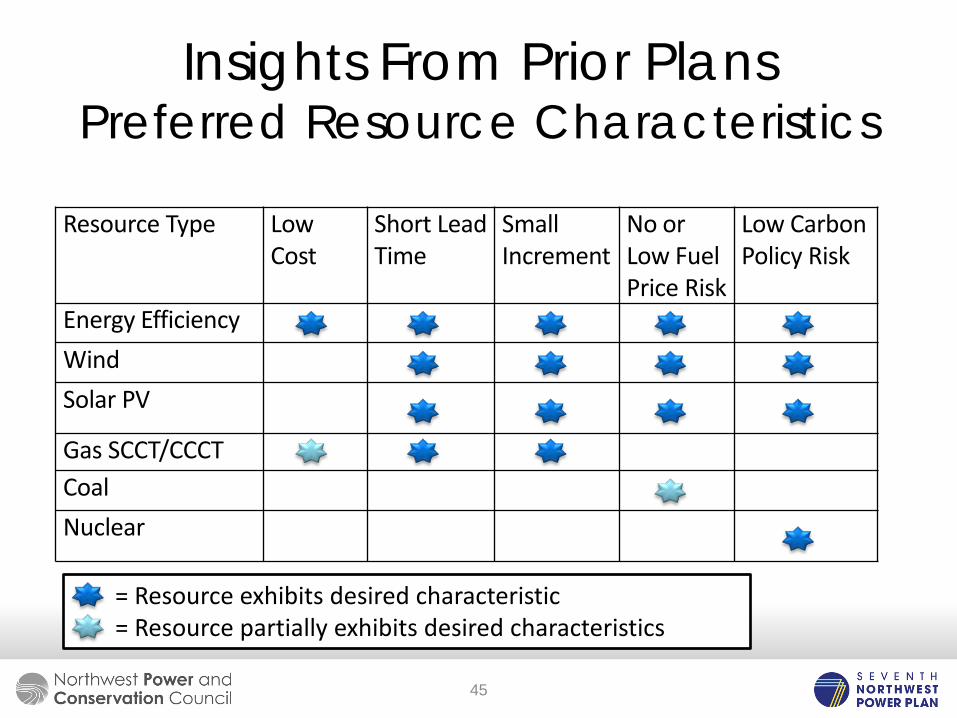
Insights From Prior Plans Preferred Resource Characteristics
Resource Type Low Cost
Short Lead Time
Small Increment
No or Low Fuel Price Risk
Low Carbon Policy Risk
Energy Efficiency Wind Solar PV
Gas SCCT/CCCT Coal Nuclear
= Resource exhibits desired characteristic = Resource partially exhibits desired characteristics
45
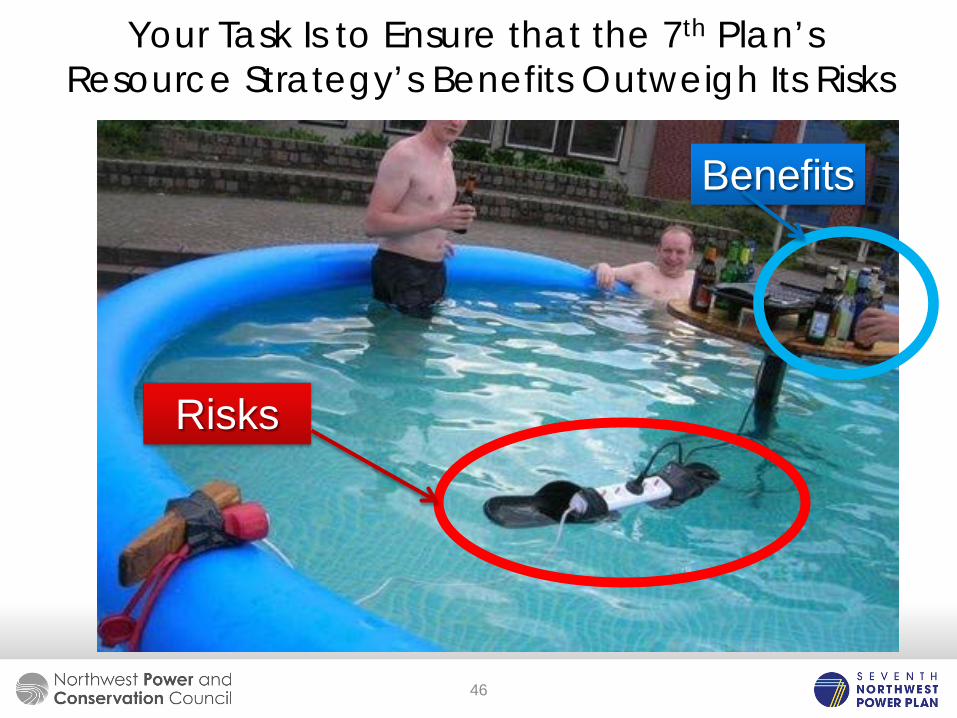
Your Task Is to Ensure that the 7th Plan’s Resource Strategy’s Benefits Outweigh Its Risks
Benefits
Risks
46

Any Questions?