Embed Size (px)
Citation preview
CHAPTER OUTLINELEARNING OBJECTIVES
INTRODUCTION
SOME FUNDAMENTALSResearch methods and statisticsCarrying out quality researchThe role of theory in psychology
DESIGNING EXPERIMENTS IN PSYCHOLOGYWhat can we measure?A rundown on research methodsExperiment versus surveyWhich is the best method to use?Deciding what to manipulateDeciding what to measureDifferent ways of measuringProducing trustworthy results
STATISTICS IN PSYCHOLOGYSamples and populations – sorting out the jargonDescribing numerical resultsHow can we confidently generalize our results?Finding out if our results are remarkableJudging whether two variables are relatedUnderstanding correlation
FINAL THOUGHTS
SUMMARY
REVISION QUESTIONS
FURTHER READING
Methodology 2
PSY_C02.qxd 1/2/05 3:19 pm Page 24
Learning ObjectivesBy the end of this chapter you should appreciate that:
n scientific psychologists follow strict methods when they conduct research;
n there is a significant difference between reliability and validity;
n there are different types of psychological data (e.g. behavioural, self-report and physiological);
n statistics are vital to psychological research;
n experiments help us to tackle the question of causation;
n there is an important difference between causation and correlation;
n ethical research practice is essential.
‘Psychology is the scientific study of behaviour.’‘Psychology is the science of the mind.’ ‘Psycho-logy is an approach to understanding behaviourthat uses scientific methods.’ If you study psycho-logy long enough you are likely to hear statementslike these.
Why are words like ‘science’ and ‘method’ soimportant to psychologists? Why do they continu-ally talk about ways of doing things, rather thanjust doing them? Surely anyone can be a psy-chologist just by being interested in the mind or inbehaviour?
The answers to these questions are actuallypretty simple. Whether they admit it or not, every-body is interested in the mind and behaviour. Andjust about everybody believes that he or she is an expert when it comes to understanding their own mental life and thoughts. This is understand-able. After all, even if all the experts who havecontributed to this book were watching you readthis chapter, for all their expertise, they would notknow as well as you do what is going through yourmind.
But being interested in the mind or claimingthat you are an expert is not enough to make youa psychologist. What is more, there are lots ofother experts, such as philosophers and anthro-pologists, who are interested in the study of mindand behaviour. What sets psychologists apart fromthese other experts is their training in psycholo-gical methods. Many of these methods also appearin other scientific disciplines, partly because psy-chological methods are derived from general scien-tific methods. Not all psychologists agree entirelywith all the methods, but they all understandthem and know how to use the ones relevant totheir own work. It is this common training that,more than anything else, makes us psychologists.
Of course, psychologists have methods for doingmany different things. The methods we discuss inthis chapter are those used for doing research. Inother words, they are methods for finding out the answers to questions about the mind andbehaviour.
You know from your own experience that differ-ent people often come up with different answers
INTRODUCTION
PSY_C02.qxd 1/2/05 3:19 pm Page 25
2626 Methodology
to the same question. What is the tallest moun-tain in the world? You might say Mount Everest,but your answer is only correct if you measure theheight from sea level, as we generally do. If youmeasure from the centre of the Earth, then somemountains in South America are actually taller(because the Earth is not quite round). So theanswer to the question depends on how you inter-pret it. This does not necessarily mean there isno such thing as truth or that everything is arbi-trary, but simply that the methods used to reacha conclusion need to be understood fully.
It can be much harder to answer interesting psy-chological questions than to measure the heightof a mountain. There are plenty of psychologicalquestions that have been asked many times andhave not been definitively answered. For this rea-son, it is all the more important that we under-stand the ways that different psychologists tryto answer the questions they are interested in.Then, if we find an unusual answer, we can decidewhether it is in some sense worth taking seriouslyif we first understand the methods that have beenused to reach it.
In the nineteenth century, before the science of psychology was established, a lot of peopleinterested in the mind and behaviour studiedphrenology. Phrenologists believed that behaviourcould be understood by studying the bumps on
people’s heads. A particular bump in a particularplace was supposed to be associated with par-ticular types of behaviour. We now know that thisis nonsense.
Nonsense or not, if the last hundred or soyears of research in experimental psychology hadnot taken place, we would have no systematicway of knowing that this is nonsense (see chapter 14). To this day people put forward bad,sometimes harmful, ideas related to importanttasks such as treating psychological disorders,assessing employees’ ability to do a job, or teach-ing children to read. Psychological methods allow us to assess these ideas. This means thatwe can move beyond just arguing about whetheran idea is good, and evaluate the evidence with reference to some shared and pre-determined criteria.
This is a vast topic. Even if every page of thismassive text were devoted to research methodsand statistics, most psychologists would agreethat there was still more material that you neededto absorb to become an expert.
The aim of this chapter is to provide some sign-posts that will help to guide you. It will not enableyou to deal with every statistical and methodolo-gical question that you might face, but you willlearn how to develop and set about answeringyour own questions.
RESEARCH METHODS AND STATISTICS
We study research methods and statistics in order to benefit fromthe science of psychology – to qualify as a psychologist, to usepsychological knowledge in other fields, or simply to apply psy-chology to issues that crop up in everyday life.
Imagine that your employer requires you to sit an intelligencetest before you can be considered for higher duties in your organ-ization. You sit the test and are told that your IQ score is 110.What does this mean? Your immediate future may depend on thisnumber, but you can only understand it if you know somethingabout intelligence testing (see chapter 13) and standard scores.
Similarly, newspapers and other sources are full of reportsrelating to research on psychological issues. Many draw alarmingconclusions – often because they mistakenly assume that correla-tion is the same as causation (see below). A good knowledge of
SOME FUNDAMENTALSpsychological research methods allows you to avoid making the mistakes that journalists, politicians and many others makebecause they lack the necessary scientific understanding.
Another consideration is that, in most countries, in order tobecome a psychologist you need to be not just an informed consumer of psychological research but also a producer of it. Inother words, you need to conduct a piece (or several pieces) ofresearch. Imagine you were employed by a school to determinewhether its students are more or less intelligent than students atanother school, or in an average school. You would not be ableto answer this question properly without conducting a well-planned piece of psychological research.
Even if you do not go on to further study, the ability to con-duct, analyse and evaluate psychological research is a very mar-ketable skill that is central to a large number of occupations, suchas marketing, management or policy making.
Finally, the intellectual challenges explored in this chapter can be stimulating and interesting in themselves. They are notinconsiderable, but if you can master them you will be betterequipped to understand psychology as a whole. This is not because
PSY_C02.qxd 1/2/05 3:19 pm Page 26
Some Fundamentals 2727
studying methodology and statistics is an end itself (though it canbe), but because it is a tool that allows you to get more (person-ally, intellectually and scientifically) from doing psychology.
CARRYING OUT QUALITY RESEARCH
Psychological research enables us to find out more about humanbehaviour and the mental processes that underpin it. We alsoneed to be sure that our answers are correct.
Suppose we are interested in whether ‘absence makes the heartgrow fonder’. Is it enough simply to look around, make informalobservations and come to a conclusion we feel comfortable with?In one sense it is, and, as naturally inquisitive people, we do thissort of thing all the time as a means of forming our own opinions.But this approach inevitably leads different people to differentconclusions – because we each focus on different information andhave different experiences, different agendas. So some peoplethink absence makes the heart grow fonder while others think thevery opposite, that ‘absence leads the heart to wander’.
To know which is correct,when each is correct and,more importantly, why, weneed to act as scientists, notlay-scientists. Using the sci-entific method differentiatespsychology from other dis-ciplines that address similar
questions. The scientific method is a set of procedures for acquir-ing and testing knowledge through systematic observation orexperimentation.
Reliability and validity
The most prized qualities ofpsychological research arereliability and validity. Putsimply, reliability relates toour confidence that a givenfinding can be replicated –and is not just a ‘freak’ orchance occurrence. Reliabil-ity in psychological researchhas much the same meaning
in relation to a car. A reliable car is one that nearly always works.A reliable finding can nearly always be reproduced.
Validity relates to our confidence that a given finding showswhat we believe it to show. A valid car is a genuine car (a car thatdoes what it is meant to do). A valid finding is a genuine finding(a finding that is what it purports to be – i.e. one that enhancesyour understanding in the manner indicated).
Imagine we carry out a study in which we send someone to anexotic overseas location on a number of occasions to see whetherthis makes them think more favourably of their partner. Let usassume that it does. If it does so repeatedly, then it is a reliablefinding. However, the study does not necessarily show thatabsence makes the heart grow fonder, but may instead demon-
strate that exotic holidays make people feel better about theirlives in a general way – including about their partners. Thefinding is therefore almost certainly not valid in a specific sense.
Disputed validity is one of the most common and thorny prob-lems in psychological research. Disputes arise when findingswhich purport to show one thing are reinterpreted to suggest thatthey actually show something completely different. The fact that the validity of research is often questioned is no bad thing.Indeed, this form of analysis and debate is central to psycholo-gical research and to one’s skill as a researcher.
Other qualities of good research
As well as being valid and reliable, psychological research needsto be public, cumulative and parsimonious.
To become public, research must be published in a reputablescholarly journal. Sometimes, though rarely, it is translated intopopular writing, as was the work of Freud, Pavlov, Piaget andMilgram. The likelihood of a piece of psychological researchbeing adopted for popular publication can depend on such thingsas topicality, shock value or political trends, and its impact maybe transitory. In contrast, the criteria for publication in scientificjournals are much more clearly laid out, and they provide anenduring record of the key findings that emerge from a particularpiece (or programme) of research.
Cumulative research builds on and extends existing knowledgeand theory. It is not enough just to collect information in a hap-hazard or random fashion. Instead, research should build on pre-vious insights in a given area. Newton expressed this idea clearlywhen he observed: ‘if I have been able to see further than othersit is because I have stood on the shoulders of giants’. Generallyspeaking, a piece of psychological research does not have value inisolation, but by virtue of extending or challenging other work inthe field.
The cumulative nature of research is often revealed throughliterature reviews. These are research papers (normally publishedin reputable scientific journals)that discuss the results ofmultiple studies by differentresearchers. In some casesthese reviews involve statist-ical analyses combining theresults of many studies. Thisprocess is called meta-analysis.
Parsimonious research develops explanations of findings thatare as simple, economical and efficient as possible. In explainingthe results in a given field, psychologists therefore attempt toaccount for as many different findings as possible using the small-est number of principles. For example, it may be that person Aperforms better than person B on a test of memory because A wasmore alert as a consequence of being tested at a different time ofday. Or A might have ingested a psychoactive agent before test-ing took place, whereas B had not. By controlling for the possibleinfluences of time of day, ingested substances and so on, we areleft with the most parsimonious explanation for why A and B dif-fer in their level of memory performance.
scientific method a procedure foracquiring and evaluating knowledgethrough systematic observation orexperimentation
reliability the extent to which a givenfinding will be consistently reproducedon other occasions
validity the extent to which a givenstudy investigates what it purports toinvestigate
meta-analysis a quantitative methodfor combining results across a numberof studies by first converting thefindings of each study into a metric forcomparison
PSY_C02.qxd 1/2/05 3:19 pm Page 27
2828 Methodology
THE ROLE OF THEORY IN PSYCHOLOGY
Science does not progress simply through the accumulation ofindependent facts. These facts have to be integrated in terms of theoretical explanations (theories). Theories are statements ofwhy, not just what. They are capable of:
1. accounting for multiple facts, and2. predicting what might happen in novel situations.
The purpose of most psy-chological research is to testsuch predictions in the formof hypotheses – i.e. statementsof cause and effect that are
derived from a given theory and tested by research. So theoriesgenerally precede experimentation, not vice versa.
For example, the statement that absence makes the heart growfonder does not provide a theoretical framework, but the follow-ing statement is distinctly more theory-based: ‘separation from anobject causes us to exaggerate an object’s qualities (whether goodor bad) because memory distorts reality’. This is because thisstatement attempts to explain and not just describe the relation-ship between separation and emotion. Moreover, having made
this statement, we can test itby generating hypotheses anddoing appropriate research.One hypothesis might be thatpeople with memory disor-ders will make less extremejudgements of absent lovedones than people withoutsuch disorders.
WHAT CAN WE MEASURE?
Something that differentiates psychology from other sciences isthat the things in which we are interested – mental states and pro-cesses – can never be directly observed or measured. You cannottouch or see a mood, a thought, a disposition, a memory or anattitude. You can only observe things that are associated withthese phenomena.
While this problem does occur in other sciences (such asastronomy), it can often be overcome through technologicaldevelopment (e.g. a better telescope). Psychology has madesignificant advances too (e.g. measuring skin conductance andbrain blood flow), but these techniques still only allow psycholo-gists to study the outcomes of mental activity, or things that areassociated with it – never the activity itself.
Psychologists have developed three main types of measure tohelp them examine mental processes and states:
DESIGNING EXPERIMENTSIN PSYCHOLOGY
1 Behavioural measures These involve observation of particu-lar forms of behaviour in order to make inferences about the psychological phenomena that caused or contributed to them.For example, developmental psychologists (see chapter 9) mightobserve which toys are approached or avoided by children ina play situation. On the basis of such observations, they mightplausibly infer that decisions to approach a toy are determined by the toy’s colourfulness.
2 Self-report measures These involve asking people abouttheir thoughts, feelings or reaction to a particular question.Provided that it is possible for the participants to reflect con-sciously on the relevant thoughts or behaviours, their responsescan be used either to supplement other behavioural measures or as data in themselves. So a researcher could ask a six-year-old(but clearly not a six-month-old) ‘Which toys do you like?’ or ‘Didyou pick that toy because it was brightly coloured?’
3 Physiological measures These involve measuring thingsthat are believed to be associated with particular forms of mentalactivity. For example, heart rate or galvanic skin response (GSR –a measure of the electrical conductivity of the skin) can serve asmeasures of anxiety or arousal. In our developmental example,researchers might look at children’s heart rate to see whetherthey become more excited when particular toys are presented ortaken away.
Decisions about which of the above measures to use will be dictated by a number of factors. Many of these are practicaland will be linked to other methodological choices. For example,self-report measures are relatively cheap and easy to administer,and so lend themselves tosurvey-based research exam-ining large numbers of peoplein naturalistic settings. On the other hand, physiologicalmeasures can be difficult and expensive to obtain, so theyare normally used only in experimental research withvery few participants. How-ever, decisions about whichmeasures to use are guided as much by the particularquestion a researcher wantsto address as by practical considerations.
A RUNDOWN ONRESEARCH METHODS
Psychological research in-volves four main methods: the(true) experimental method,the quasi-experimental method,the survey method (sometimes
theory a coherent framework used tomake sense of, and integrate, a numberof empirical findings
hypothesis a statement about thecausal relationship between particularphenomena (i.e. A causes B), usuallyderived from a particular theoreticalframework, which is designed to betested via research investigation
experimental method a researchmethod in which one or more inde-pendent variables are systematicallymanipulated and all other potentiallyinfluential variables are controlled (i.e.kept constant), in order to assess theimpact of manipulated (independent)variables on relevant outcome (depend-ent) variables
quasi-experimental method embodiesthe same features as the experimentalmethod but does not involve the random assignment of participants toexperimental conditions
survey method the systematic col-lection of information about differentvariables in order to investigate therelationship between them
PSY_C02.qxd 1/2/05 3:19 pm Page 28
Designing Experiments in Psychology 2929
called the correlationalmethod), and the case studymethod.
The experimental method
One very common researchmethod is to manipulate oneor more variables and toexamine the effect of thismanipulation on an outcomevariable. To do this, theresearcher examines particip-ants’ responses in the pres-ence and the absence of themanipulation. Experimentalcontrol is used to make thedifferent situations identicalin every respect except for the presence or absence of
the manipulation. Experiments can involve different people in each situation or the same people in different situations. People who take part in experiments are called participants, but if youread older research papers they are generally referred to as subjects.
Here is an example. To test the effect of a new training method(a manipulation) on memory, we might take 100 people and
expose half of them to thenew method. For reasons wewill discuss in more detailbelow, we would assign par-ticipants to the two groupson a random basis (e.g. bythe toss of a coin). We willcall the first group the experi-mental group, as it is subjectedto a relevant experimentaltreatment. The other half ofour participants would notbe exposed to the new train-ing method. As they receiveno experimental treatment,they are referred to as a con-trol group (also discussed inmore detail below). Afteradministering the treatment,we would measure the per-formance of the two groupson a memory task and thencompare the results.
The various levels of treatment in an experiment(including the control) arereferred to as conditions. Thisexperiment has two condi-tions and a between-subjects
design (because the design involves making comparisons betweendifferent participants in different conditions). Note, however, thatthe same question could also have been addressed in a within-subjects design, which wouldinvolve comparing the mem-ory performance of the samepeople with and without thenew training method. Thetwo basic designs have differ-ent strengths and weaknesses,which we will discuss below in relation to issues of experimentalcontrol.
The different conditions inthe experiment make up theindependent variable (or IV),sometimes called the treat-ment variable. A variable issimply something that changesor varies (is not constant). Intrue experiments, the independent variable is systematicallymanipulated or varied by the experimenter. Experiments can(and typically do) have more than one independent variable.
Experiments also involveat least one dependent variable(or DV). This is an outcomeor measurement variable,and it is this variable that theexperimenters are interestedin observing and which provides them with data. In our lastexample, the dependent variable is the level of memory perfor-mance. Use the initial letter ‘d’ to remember the link between thedependent variable and the data it provides.
Control is the basis of experimental design. It involves makingdifferent conditions identical in every respect except the treat-ment (i.e. the independent variable).
In a between-subjects experiment, this is achieved by a processof random assignment of participants to the different conditions.For example, people shouldbe assigned at random (e.g.on the basis of coin tossing),rather than putting, say, thefirst 50 people in one condi-tion and the second 50 inanother. This practice rules out the possibility that there are systematic differences in, say, intelligence, personality or agebetween the groups.
If there is a difference in results obtained from measuring thedependent variable for each group, and we have equated thegroups in every respect by means of random assignment, we caninfer that the difference must be due to our manipulation of theindependent variable.
The quasi-experimental method
In quasi-experimental studies the independent variable is not (orcannot be) manipulated as such, and so assignment to experi-mental groups cannot be random. The fact that no manipulation
case study method research methodthat involves a single participant orsmall group of participants who are typ-ically studied quite intensively
manipulation the process of system-atically varying an independent variableacross different experimental conditions(sometimes referred to as the experi-mental treatment or intervention)
experimental control the method ofensuring that the groups being studiedare the same except for the manipula-tion or treatment under investigation
experimental group participants in anexperiment who are exposed to a par-ticular level of a relevant manipulationor treatment (as distinct from a controlgroup)
treatment the experimental manipula-tion of the independent variable
control group participants in an experi-ment who are not subjected to thetreatment of interest (as distinct fromthe experimental group)
condition a situation in a research studyin which participants are all treated thesame way
between-subjects design a researchstudy involving a systematic manipu-lation of an independent variable withdifferent participants being exposed todifferent levels of that variable
within-subjects design a research designin which the same participants areexposed to different levels of the inde-pendent variable
independent variable the treatmentvariable manipulated in an experiment,or the causal variable believed to beresponsible for particular effects or outcomes
dependent variable the variable inwhich a researcher is interested in mon-itoring effects or outcomes
random assignment the process ofassigning participants to study condi-tions on a strictly unsystematic basis
PSY_C02.qxd 1/2/05 3:19 pm Page 29
3030 Methodology
occurs interferes dramatically with our ability to make conclusivecausal inferences. Examples of independent variables that cannotbe manipulated by an experimenter include gender and age.Obviously experimenters cannot change the gender or age of par-ticipants, but they can compare the responses of groups of peoplewith different ages or of different genders.
Compared to the experimental method, there is no real controlover the independent variable, so we cannot conclude that it isnecessarily responsible for any change in the dependent variable.On this basis, as we will see, the quasi-experimental method actu-ally has more in common with survey methodology than withthe experimental method. It has all the weaknesses of the experi-mental method, but it lacks the main strength. In practice, it isoften conducted in conjunction with the experimental method.For example, in our learning study we might compare the effectof the new training method on both men and women.
The survey (or correlational) method
The survey method is commonly used to identify the naturallyoccurring patterning of variables in the ‘real world’ rather than toexplain those patterns (though often people want to put anexplanatory gloss on them).
So to examine whether absence makes the heart grow fonderwe could conduct a survey to see if people who are separatedfrom their partners because of travelling away from home (groupA) say more positive things about their partners than people whonever travel away from home without their partners (group B).This might be an interesting exercise, but the validity of anycausal statements made on the basis of such findings would bevery limited.
For example, if we found from our survey that group A saidmore positive things about their partners when they were tra-velling than group B, it would be impossible to demonstrate con-clusively that absence was the cause of the difference betweengroups A and B. In other words, while our survey could show usthat absence is associated with a fonder heart, it could not con-clusively show that absence actually causes the heart to growfonder. It is quite possible (odd as it may sound) that the sorts ofpeople who travel away from home without their partners are
simply those that like their partners more (so fondness makes theheart go absent). Or perhaps both fondness and absence arecaused by something else – for example, social class (i.e. beingwealthy makes people both fond and absent).
In large part, then, surveys rely on methodologies that identifyrelationships between variables but do not allow us to make con-clusive causal inferences.
The case study method
Most of the above methods are used for studies involving largenumbers of participants. But what if only a few are available?How, for example, would you do research if you were interestedin the reading difficulties of people with particular forms of braindamage? To investigate questions like this, researchers often resortto the case study method, which involves intensive analysis of avery small sample. This has particular problems (often with reli-ability), but some of the most famous studies in psychology haveused this method – in particular the work of Freud (see chapter 14).
Taking a qualitative approach
When researchers report and comment on behaviour, withoutattempting to quantify it, they are using a qualitative researchmethod. This involves attempts to understand behaviour by doingmore than merely converting evidence into numbers.
Qualitative methods can include coding, grouping and collect-ing observations without assigning actual numbers to the obser-vation. So a qualitative analysis of the speed of animals mightresult in the statement that the cheetah is a fast land animal, anda quantitative analysis might involve comparing the maximumspeed of animals over (say) 20 metres. To take an example ofhuman behaviour, you probably take a qualitative approach tothe friendliness of the people you meet. In other words, youprobably judge people as relatively friendly or unfriendly, butyou would be unlikely to come up with a number that expressestheir friendliness quotient.
Qualitative techniques are sometimes used in the initial stagesof quantitative research programmes to complement the quant-itative techniques, but they are also used by psychologists whochallenge conventional approaches to psychological research.This may be because they believe that the conventional methodsare inadequate for addressing the richness and complexity ofhuman behaviour. In turn, many mainstream psychologists arecritical of qualitative methods. (For further discussion of qualita-tive methods, see Haslam & McGarty (2003).)
EXPERIMENT VERSUS SURVEY
One common, but mistaken, belief is that the difference betweensurveys and experiments is a question of location, with surveysbeing conducted in the community and experiments in the labor-atory. This is often the case, but not always. Experiments can beconducted outside laboratories, and surveys can be conducted inthem.
Pioneer
Donald Thomas Campbell (1916–96) trained as a socialpsychologist. He was a master methodologist and is bestknown for devising the method of quasi-experimentation,a statistics-based approach that allows replication of theeffects of true randomization, which is often impossible inthe study of human behaviour. Campbell also supporteduse of qualitative methods, according to the goals and con-text of the study. He promoted the concept of triangula-tion – that every method has its limitations, and multiplemethods are usually needed to tackle important researchquestions.
PSY_C02.qxd 1/2/05 3:19 pm Page 30
Designing Experiments in Psychology 3131
The main differences between experiments and surveys relateto the sorts of questions that each can answer. As we suggestedearlier, experiments tend to be concerned with establishing causalrelationships between variables, and they achieve this by randomlyassigning participants to different treatment conditions. Surveys,on the other hand, tend to be concerned with measuring natur-ally occurring and enduring relationships between variables.Researchers who use surveys usually want to generalize from thesample data they obtain to a wider population. They do this byusing the sample to estimate the characteristics of the populationthey are interested in.
Why choose to carry out a survey rather than an experiment?Two reasons: sometimes we are only interested in observing rela-tionships, and sometimes manipulations simply are not possible.This reasoning is not restricted to psychology. Astronomers orgeologists rarely conduct experiments, simply because it is oftenimpossible to manipulate the independent variables of interest(e.g. the position of certain stars or the gravitational force of aplanet). Instead they rely largely on the same logic of controlledobservation that underpins psychological surveys. But this doesnot mean that astronomy or geology are unscientific.
Surveys can also allow researchers to eliminate some causallinks. If there is no relationship (at least in the survey environ-ment) between variables, this allows us to conclude that one does not cause the other. For example, if no relationship is foundbetween age and intelligence, then it is impossible for intelligenceto cause age, or vice versa (bearing in mind that a relationshipcould be concealed by a third, or background, variable).
WHICH IS THE BEST METHOD TO USE?
This is a very complex issue and depends on many factors, notleast practical ones – including the amount of time, money andexpertise that a researcher has. However, as a general principle, itis worth emphasising that no one method is universally superior.Part of any research psychologist’s role is to make judgementsabout the appropriateness of a method for investigating the issuesat hand. Being a good researcher is not a question of whether youdo experiments or surveys: it is more a matter of when and howyou do them.
In view of the potential limitations of any one method, manyresearchers consider using multiple research methods to explorethe same issue in many different ways. This is the process of tri-angulation. If consistent results are obtained from a variety of dif-ferent methods (perhaps from a quantitative experiment, a surveyand qualitative case studies), this will tend to justify greater con-fidence in the findings. For this reason, the need to make metho-dological choices should be seen as an asset for researchers, ratherthan a basis for arguments about who has the best methods. Thechallenge researchers face is to exploit that asset appropriately.
DECIDING WHAT TO MANIPULATE
In selecting an independent variable for any piece of research, we must first decide what we are interested in. For example,
we might be interested in whether attributional style (the way people explain events) affects people’s responses to failure. Wemight hypothesize that people who tend to blame themselves for failure (i.e. those who internalize failure) are more likely tobecome depressed than people who blame their failure on otherthings (i.e. who externalize failure).
So the central theoretical variable – the focus of our interest –is the participants’ attributional style. But, how can we manipu-late this for the purposes of our experiment? Clearly we cannotopen up people’s heads and turn a dial that says ‘attributionalstyle’ to maximum or minimum.
To get around such obstacles, psychologists usually manipu-late the theoretical variable indirectly. They do this by identifyingan independent variable that they believe will have a specificimpact upon a given mental process, and then check that this isthe case.
In our example, the researchers may expose participants to fail-ure (e.g. in a test) and then ask some of them to answer questionslike ‘Can you explain why you did so much worse than everyoneelse?’ – questions that encourage the participants to reflect ontheir own contribution to their performance (i.e. to internalize).They may then ask other participants questions like ‘Do youthink the fact that you were not allowed to revise for the testaffected your performance?’ – questions that encourage them toreflect on the contribution of other factors to their performance(i.e. to externalize).
To be sure that this mani-pulation has had the desiredeffect on the theoretical vari-able, the researchers maythen want to perform a mani-pulation check. For example,in the case given above, theresearchers might measurewhether the ‘internalizing’ question produces greater agreementwith a measure such as: ‘How much do you think you wereresponsible for the test outcome?’
Note also the significant ethical issues relating to this study.The experimental manipulation could have the effect of makingsome participants more depressed – indeed, that is the hypothes-ized outcome in the condition where participants are encouragedto internalize their failure. We discuss ethical issues later in thischapter.
DECIDING WHAT TO MEASURE
As with the selection of IVs, the selection of dependent variablesis often complicated by practical constraints. For example, if weare investigating the impact of alcohol consumption on roadfatalities, we may manipulate the independent variable straight-forwardly (by getting experimental groups to consume differentquantities of alcohol). But it would be irresponsible (and illegal)to then get the participants to drive down a busy street so that wecan count how many pedestrians they knock down!
To get round this, we may ask the high alcohol group to con-sume only a few beverages. But there are two problems with this.
manipulation check a procedure thatchecks the manipulation of the inde-pendent variable has been successful inchanging the causal variable the experi-menter wants to manipulate
PSY_C02.qxd 1/2/05 3:19 pm Page 31
3232 Methodology
First, alcohol may only affect driving behaviour when more thana few beverages are consumed. Second, our dependent variable(number of pedestrians killed) will not be sufficiently sensitive todetect the independent variable’s impact. In other words, we mayhave good reason to think that alcohol could impair driving per-formance, but the degree of impairment may not (fortunately!)be so profound as to cause a detectable increase in the number ofdeaths caused.
To deal with this, we therefore have to select dependent vari-ables that are both relevant to the outcome we have in mind andsensitive to the independent variable. In the case of drink-driving,we may look at participants’ reaction time, because we believethat this is a critical determinant in driving safety and is likely tobe a sensitive enough variable to detect an impairment in drivingperformance due to alcohol. We can then design and carry out astudy in the laboratory, measuring the impact of alcohol con-sumption on reaction time.
In our attributional style example, too, it is unlikely that ourmanipulation of the independent variable will have a dramatic
impact on the participants’ depression. So if our dependent vari-able was the number of participants who need to be treated by aclinical psychologist, our experiment is very unlikely to uncoverany effects. To get around this problem, we could administer adepression inventory, in which we ask the participants a batteryof questions (e.g. ‘Are you self-confident?’, ‘Do you feel hopelessabout the future?’) in order to measure their susceptibility todepression. We could then test our hypothesis by seeing whetherscores on the depression inventory revealed a higher susceptibil-ity to depression among participants who had been encouragedto make internal attributions.
DIFFERENT WAYS OF MEASURING
The psychologist S.S. Stevens developed a famous distinctionbetween forms of data that psychologists can deal with. The fourtypes he came up with are nominal, ordinal, interval and ratiomeasures.
Testing the effectiveness of therapy for depression‘I’m feeling depressed.’ Most likely you have heard someone say this. But such statements should not be confused withclinical depression, a disorder that produces greater impairment in everyday functioning than many physical health prob-lems (e.g. hypertension, arthritis, diabetes; see chapter 15). You have approximately a 15 per cent chance of experiencingclinical depression in your lifetime. Should you be unfortunate enough to experience a depressive disorder you would surelywant to get treatment for it that is effective. Cognitive behaviour therapy and non-directive counselling are common treat-ments for people with depressive symptoms (see chapter 16). But are these treatments any more effective than usual gen-eral practitioner (GP) care?
You might turn to psychological research for an answer. But how can psychologists evaluate the effectiveness of cognit-ive behaviour therapy, non-directive counselling and usual GP care in treating depression? An effective test requires the use of an experimental design in which patients are randomly assigned to treatment groups. This is necessary to allow anyeffects to be attributed to treatment type, rather than any other variable that might lead a participant to choose one treat-ment over another.
Ward et al. (2000) followed this procedure and allocated patients to one of three treatment groups: two psychologicaltreatments (non-directive counselling and cognitive behaviour therapy) and one control condition (usual GP care). They meas-ured the patients’ level of depression before treatment began, at four months and at 12 months following the completionof the treatment.
What did they find? At four months, patients in both the psychological treatment groups (non-directive counselling andcognitive behaviour therapy) had significantly lower depression scores than patients in the control condition (usual GP care).There was no significant difference between the effectiveness of the two psychological treatments.
We can conclude from this experimental test (known as a ‘clinical trial’ when treatments are being tested; see chapter16) that the two psychological treatments for depression are effective, at least in the short term. Ideally, however, youwould want a treatment that produces lasting results, especially in light of the fact that depression tends to be both chronicand recurrent (see chapter 15). But when Ward et al. examined depressive symptoms at 12 months following treatmentthere was no significant difference between any of the three groups. In this study, then, the psychological treatments fordepression were shown to be effective in the short term but not in the long term. Happily, there are other studies that docu-ment the longer-term effectiveness of cognitive behaviour therapy as a treatment for depression (see chapter 16).
Ward, E., King, M., Lloyd, M. et al., 2000, ‘Randomised controlled trial of non-directive counselling, cognitive-behaviour therapy, and usual general practitioner care for patients with depression. I: Clinical effectiveness’, British Medical Journal,321, 1383–8.
EverEveryday Psychologyyday Psychology
PSY_C02.qxd 1/2/05 3:19 pm Page 32
Statistics in Psychology 3333
Nominal measures
The data collected in this way are in the form of names, whichcan be categorized but cannot be compared numerically in anyway. Examples include genders, countries and personality types.
Ordinal measures
These can be ranked in some meaningful way. Examples are theplacings obtained by competitors in a race or an ordered set ofcategories (e.g. low stress, moderate stress and high stress).
Interval measures
Numerical measures without a true zero point are called intervalmeasures, and cannot be used to form ratios. An example is tem-perature. The zero point has been arbitrarily chosen to be thefreezing point of water rather than absolute zero (where there isno temperature), and it is simply not true that 40 degrees Celsiusis twice as hot as 20 degrees Celsius. Similarly, it would not makesense to say that someone who responded with a ‘6’ on the attri-bution scale above was twice as much of an externalizer as some-one who responded with a ‘3’.
Ratio measures
Full numerical measures with a true zero point are ratio meas-ures. Psychologists frequently assume that scores obtained frompsychological measurement can be treated as ratio measures. Butthis assumption is not always justified.
PRODUCING TRUSTWORTHY RESULTS
Internal validity
We can be confident about the results of psychological researchwhen the methods are valid. An experiment is said to have
internal validity when we areconfident that the resultshave occurred for the reasonswe have hypothesized, andwe can rule out alternativeexplanations of them.
These alternative explana-tions (or threats to internalvalidity) can involve anexperimental confound – anunintended manipulation ofan independent variable. Therisk of confounds can bereduced by better experimental design.
Suppose we conduct a study to look at the effect of crowdingon psychological distress by putting 50 people in a crowded roomand 50 people in an open field. Having found that the people inthe room get more distressed, we may want to conclude thatcrowding causes distress. But the participants’ body temperature(generated by having a lot of people in one room) may representa confound in the study: it may be the heat, not the crowding,that produces the effects on the dependent variable. The experi-ment could be redesigned to control for the effects of this con-found by using air-conditioning to keep the temperature thesame in both conditions.
External validity
A study has a high level ofexternal validity when there areno reasons to doubt that theeffects obtained would occuragain outside the researchsetting. We might, for example, question a study’s external valid-ity if participants responded in a particular way because theyknew that they were taking part in a psychological experiment.They might inadvertently behave in a way that either confirms orundermines what they believe to be the researcher’s hypothesis.In experiments we usually try to deal with this specific poten-tial problem by not telling experimental participants about thehypotheses that we are investigating until after the experimenthas finished.
SAMPLES AND POPULATIONS – SORTINGOUT THE JARGON
You will often hear psychologists talking about samples and populations in relation to statistical analysis of research. What dothey mean by these terms?
A population is a set of people, things or events that we areinterested in because we wish to draw some conclusion aboutthem. The population could consist of all people, or all people
STATISTICS IN PSYCHOLOGY
Pioneer
Stanley Smith Stevens (1906–73) made significant contri-butions to several areas of psychology. He was an experton the psychophysics of hearing and was interested in mea-surement and experimental psychology. Stevens set out toredefine psychological measurement by changing the per-spective from that of inventing operations (the physicalview) to that of classifying scales (a mathematical view).He also discovered that methods such as ‘just noticeabledifferences’, rating scale categories and paired comparisonsproduce only ordinal scales. Stevens’ most oustanding con-tribution was his successful argument that there are differ-ent kinds of scales of measurement, being the first to defineand discuss nominal, ordinal, interval and ratio scales.
confound an unintended or accidentalmanipulation of an independent vari-able that threatens the validity of anexperiment
external validity the extent to which aresearch finding can be generalized toother situations
internal validity the extent to whichthe effect of an independent (manip-ulated) variable on a dependent (out-come) variable is interpreted correctly
PSY_C02.qxd 1/2/05 3:19 pm Page 33
3434 Methodology
with schizophrenia, or all right-handed people, or even just a single person.
A sample is a set selected from the population of interest andused to make an inference about the population as a whole. Thiskind of inference is called a generalization. A sample would norm-
ally be a group of peopleselected from a larger group,but it could also be a sampleof behaviour from one person, or even a sample ofneurons from a region of the brain (see chapter 3).
If we wish to generalize to a population, we need to make surethat the sample is truly representative of the population as awhole. This means that the sample should be similar to the population in terms of relevant characteristics. For example, if weare doing research on the human visual system, then members of our sample group need to have eyesight that is similar to the
rest of the human population(as opposed to being, forexample, noticeably worse).The easiest and fastest wayto achieve this is to draw arandom sample (of a reasonablesize) from the population.
DESCRIBING NUMERICAL RESULTS
Two key properties, referredto as descriptive statistics,come into play when wedescribe a set of data – or theresults of our research. Theseare the central tendency (whatwe usually call the average)and the amount of dispersion– or variation.
Imagine a choreographerselecting a group of dancersfor a performance support-ing a lead dancer who hasalready been cast. The chore-ographer wants the support-ing cast to be pretty muchthe same height as the leaddancer and also pretty muchthe same height as eachother. So the choreographeris interested in the average
height (which would need to be about the same as the leaddancer’s height) and the dispersion, or variation, in height (whichwould need to be close to zero).
There are a number of ways in which the choreographer – orthe psychologist – can measure central tendency (average) anddispersion.
Measures of central tendency
Measures of central tendency give us a typical value for our data.Clearly, ‘typical’ can mean different things. It could mean:
n the average value;n the value associated with the most typical person; orn the most common value.
In fact, all three are used by researchers to describe central tend-ency, giving us the following measures:
n The mean is the aver-age value (response)calculated by summingall the values and divid-ing the total by thenumber of values.
n The median is the valuewith an equal numberof values above andbelow it. So, if all val-ues are ranked from 1to N, the median is the((N + 1)/2)th value if Nis odd. If N is even, themedian is the mean of the two middle values.
n The mode is the value that occurs most frequently in a givendata set.
Measures of dispersion
We might also want to describe the typical distance of responsesfrom one another – that is, how tightly they are clustered aroundthe central point. This is typically established using one of twomeasures. The first and probably most obvious is the range ofresponses – the difference between the maximum and minimumvalues. But in fact the most commonly used measure of dis-persion is standard deviation(SD). This is equal to thesquare root of the sum of thesquares of all the differences(deviations) between eachscore and the mean, dividedby the number of scores (infact, the number of scoresminus one if we want a population estimate, as weusually do). If this soundscomplex, do not be too con-cerned: scientific calculatorsallow you to compute stand-ard deviations very easily.The square of the standarddeviation is called the variance.
generalization related to the conceptof external validity, this is the process ofmaking statements about the generalpopulation on the basis of research
random sample a sample of particip-ants in which each has the same chanceof being included, ensured by using random participant selection methods(e.g. drawing lots)
descriptive statistics numerical state-ments about the properties of data,such as the mean or standard deviation
central tendency measures of the‘average’ (most commonly the mean,median and mode), which tell us whatconstitutes a typical value
dispersion measures of dispersion (mostcommonly range, standard deviationand variance) describe the distance ofseparate records or data points fromeach other
mean the sum of all the scores dividedby the total number of scores
median the middle score of a rankedarray – equal to the ((N + 1)/2)th value,where N is the number of scores in thedata set
mode the most commonly occurringscore in a set of data
standard deviation the square root ofthe sum of the squares of all the differ-ences (deviations) between each scoreand the mean, divided by the numberof scores (or the number of scoresminus 1 for a population estimate)
variance the mean of the sum ofsquared differences between a set of scores and the mean of that set ofscores; the square of the standard deviation
PSY_C02.qxd 1/2/05 3:19 pm Page 34
Statistics in Psychology 3535
Compared to the range alone, standard deviation tells us a lotabout a distribution of scores, particularly if they are normally dis-tributed – a feature we discuss further below. If this is the case, weknow, for example, that about 68 per cent of all values will fallwithin 1 SD of the mean, 95 per cent fall within 2 SDs and 99 percent fall within 3 SDs. For reasons that will become clear in laterchapters (e.g. chapter 13), this sort of information is very useful.
HOW CAN WE CONFIDENTLYGENERALIZE OUR RESULTS?
Although psychologists often spend a lot of time studying thebehaviour of samples, most of the time they want to generalizetheir results to say something about a whole population – oftencalled the underlying population. Knowing how ten particularpeople are going to vote in an election may be interesting in itself,but it is even more interesting if it tells us who is likely to win thenext election.
But how can we makeinferences of this sort con-fidently? By using inferentialstatistics we can make state-ments about underlying pop-ulations based on detailedknowledge of the sample we study and the nature ofrandom processes. The keypoint here is that, while random processes are (as the name tellsus) random, in the long run they are highly predictable. Not convinced? Toss a coin. Clearly, there is no way that we canconfidently predict whether it is going to come down heads ortails. But if we were to toss the coin fifty times, we could predict,reasonably accurately, that we would get around twenty-fiveheads. The more tosses we make, the more certain we can be thataround about 50 per cent of the tosses will come up heads (and itis this certainty that makes the business of running casinos veryprofitable).
A survey on psychiatric disordersThe research issue
Until the mid 1980s, research into the prevalence of psychiatric disorders, such as affective (mood) disorders, relied oninstitutional records. Lubin et al. (1988) set out to investigate the relationships between affect and demographic and phys-ical health variables in a representative population sample.
Design and procedureThe Revised Multiple Affect Adjective Check List (MAACL-R) was administered to 1,543 adults throughout the United States.This sample was designed to produce an approximation of the adult civilian population at the time. The MAACL-R providedmeasures of five traits: anxiety, depression, hostility, positive affect (optimistic mood state) and sensation seeking. In addition, participants were interviewed in order to elicit demographic information and subjective impressions of physicalhealth.
Results and implicationsThe sensation-seeking scale was not found to be internally reliable and so was not used in further analyses. Theresearchers analysed the data primarily using t-tests, analysis of variance and correlation.
Statistical tests showed that females scored significantly higher than males on measures of anxiety, depression and pos-itive affect. Correlational analyses revealed significant relationships between measures of affect and subjective measuresof physical health. Positive affect had a highly significant positive correlation with physical health (r = .30), while anxiety (r = −.10), depression (r = −.20) and hostility (r = −.09) were all significantly negatively correlated with physical health(though the correlations were relatively small).
Note, however, that this study does not allow us to conclude that feeling healthy causes one to be happier, less anxious,less depressed and less hostile, or that being happy (and not anxious, depressed or hostile) causes one to be physicallyhealthy.
Lubin, B., Zuckerman, M., Breytspraak, L.M., Bull, N.C., Gumbhir, A.K., & Rinck, C.M., 1988, ‘Affects, demographic vari-ables, and health’, Journal of Clinical Psychology, 44, 131–41.
ResearResearch close-up 1ch close-up 1
inferential statistics numerical tech-niques used to estimate the probabilitythat purely random sampling from anexperimental population of interest canyield a sample such as the one obtainedin the research study
PSY_C02.qxd 1/2/05 3:19 pm Page 35
3636 Methodology
Of course, psychologists do not usually study coin tosses, butexactly the same principles apply to things they do study. Forexample, the mean IQ is 100 (with an SD of 15), so we know thatif we study a large number of people, about 50 per cent will havean IQ greater than 100. So if we get data from 100 people (e.g. aclass of psychology students) and find that all of them have IQsgreater than 100, we can infer with some confidence that there issomething psychologically ‘special’ about this sample.
Our inference will take the form of a statement to the effectthat the pattern we observe in our sample is ‘unlikely to havearisen as a result of randomly selecting (sampling) people fromthe population’. In this case, we know this is true, because weknow that psychology students are not selected randomly fromthe population but are selected on the basis of their performanceon tests related to IQ. But even if we did not know this, we wouldbe led by the evidence to make an inference of this kind.
Inferential statistics allow researchers to quantify the probabil-ity that the findings are caused by random influences rather thana ‘real’ effect or process. We do this by comparing the distribu-tion obtained in an empirical investigation with the distribution
suggested by statistical the-ory – in this case the normaldistribution. We then makepredictions about what thedistributions would look likeif certain assumptions (regard-ing the lack of any real effect
on the data) were true. If the actual distribution looks very differ-ent from the one we expect, then we become more confident thatthose assumptions are wrong, and there is in fact a real effect orprocess operating.
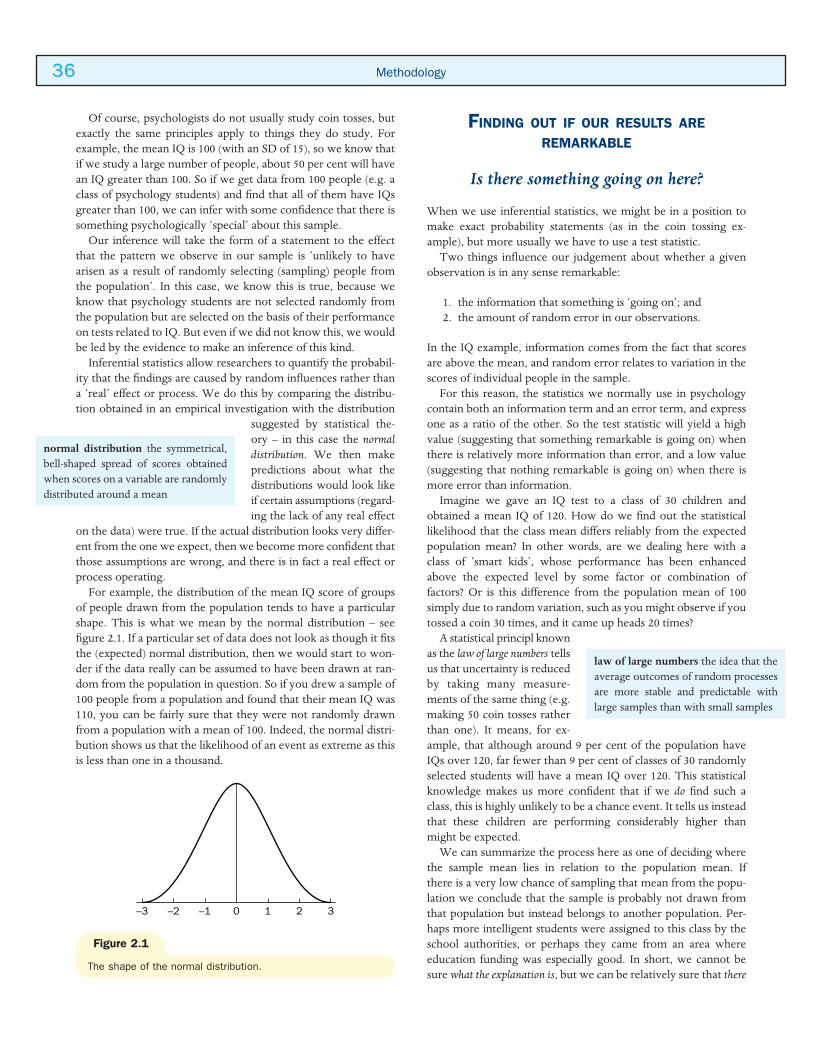
For example, the distribution of the mean IQ score of groupsof people drawn from the population tends to have a particularshape. This is what we mean by the normal distribution – seefigure 2.1. If a particular set of data does not look as though it fitsthe (expected) normal distribution, then we would start to won-der if the data really can be assumed to have been drawn at ran-dom from the population in question. So if you drew a sample of100 people from a population and found that their mean IQ was110, you can be fairly sure that they were not randomly drawnfrom a population with a mean of 100. Indeed, the normal distri-bution shows us that the likelihood of an event as extreme as thisis less than one in a thousand.
FINDING OUT IF OUR RESULTS AREREMARKABLE
Is there something going on here?
When we use inferential statistics, we might be in a position tomake exact probability statements (as in the coin tossing ex-ample), but more usually we have to use a test statistic.
Two things influence our judgement about whether a givenobservation is in any sense remarkable:
1. the information that something is ‘going on’; and2. the amount of random error in our observations.
In the IQ example, information comes from the fact that scoresare above the mean, and random error relates to variation in thescores of individual people in the sample.
For this reason, the statistics we normally use in psychologycontain both an information term and an error term, and expressone as a ratio of the other. So the test statistic will yield a highvalue (suggesting that something remarkable is going on) whenthere is relatively more information than error, and a low value(suggesting that nothing remarkable is going on) when there ismore error than information.
Imagine we gave an IQ test to a class of 30 children andobtained a mean IQ of 120. How do we find out the statisticallikelihood that the class mean differs reliably from the expectedpopulation mean? In other words, are we dealing here with aclass of ‘smart kids’, whose performance has been enhancedabove the expected level by some factor or combination of factors? Or is this difference from the population mean of 100simply due to random variation, such as you might observe if youtossed a coin 30 times, and it came up heads 20 times?
A statistical principl knownas the law of large numbers tellsus that uncertainty is reducedby taking many measure-ments of the same thing (e.g.making 50 coin tosses ratherthan one). It means, for ex-ample, that although around 9 per cent of the population haveIQs over 120, far fewer than 9 per cent of classes of 30 randomlyselected students will have a mean IQ over 120. This statisticalknowledge makes us more confident that if we do find such aclass, this is highly unlikely to be a chance event. It tells us insteadthat these children are performing considerably higher thanmight be expected.
We can summarize the process here as one of deciding wherethe sample mean lies in relation to the population mean. If there is a very low chance of sampling that mean from the popu-lation we conclude that the sample is probably not drawn fromthat population but instead belongs to another population. Per-haps more intelligent students were assigned to this class by theschool authorities, or perhaps they came from an area where education funding was especially good. In short, we cannot besure what the explanation is, but we can be relatively sure that there
–3 –2 –1 0 1 2 3
normal distribution the symmetrical,bell-shaped spread of scores obtainedwhen scores on a variable are randomlydistributed around a mean
law of large numbers the idea that theaverage outcomes of random processesare more stable and predictable withlarge samples than with small samples
Figure 2.1
The shape of the normal distribution.
PSY_C02.qxd 1/2/05 3:19 pm Page 36
Statistics in Psychology 3737
is something to be explained and this is the purpose of conductingstatistical tests.
Judging when two conditions in anexperiment are sufficiently different to be
worth interpreting
Think back to our ‘memory training study’, in which one groupof participants in an experimental condition experience a newtraining method and another group in a control condition do not,then both groups take a memory test. Common sense tells us thatwe are likely to get two sets of memory scores – one for theexperimental condition, one for the control – with differentmeans.
But how do we decide whether the difference is big enough tobe meaningful? This is where inferential statistics come into play.Appropriate statistical procedures allow us to decide how likely it is that this difference could occur by chance alone. If that like-lihood is sufficiently low (typically less than 1 in 20 or 5 per cent),
we would reject the nullhypothesis (expressed as H0)that there is no differencebetween the means and thatthe manipulation of the inde-pendent variable has had noeffect. Instead we would con-clude that the manipulationof the IV has had a significantimpact on the dependentvariable – that is, that train-ing does indeed improve
memory. This process is typically referred to as significance testing,and this is one of the main approaches to statistical inference.While statistical tests can never tell us whether our results aredue to chance, they can guide us in judging whether chance is aplausible explanation.
How does significance testing work in this case – that is, whencomparing two means? In essence it comes down to the differ-ence between the means relative to the variation around thosemeans and the number of responses on which the means arebased. The statistics that we calculate for comparing means arecalled t and F statistics. A large t or F statistic means there is asmall probability that a difference as big as the one we haveobtained could have occurred by randomly selecting two groupsfrom the same population (i.e. it is not likely that the difference isdue to chance). If that probability is sufficiently small, we con-clude that there probably is a real difference between the means– in other words, that the difference is statistically significant.
JUDGING WHETHER TWO VARIABLESARE RELATED
A lot of what we have discussed so far relates to comparisonsbetween means, which is typically what we do when we use
experimental methodology. But in a range of other research situ-ations we are interested in assessing the relationship between twovariables. For example, how is height related to weight? How isstress related to heart disease?
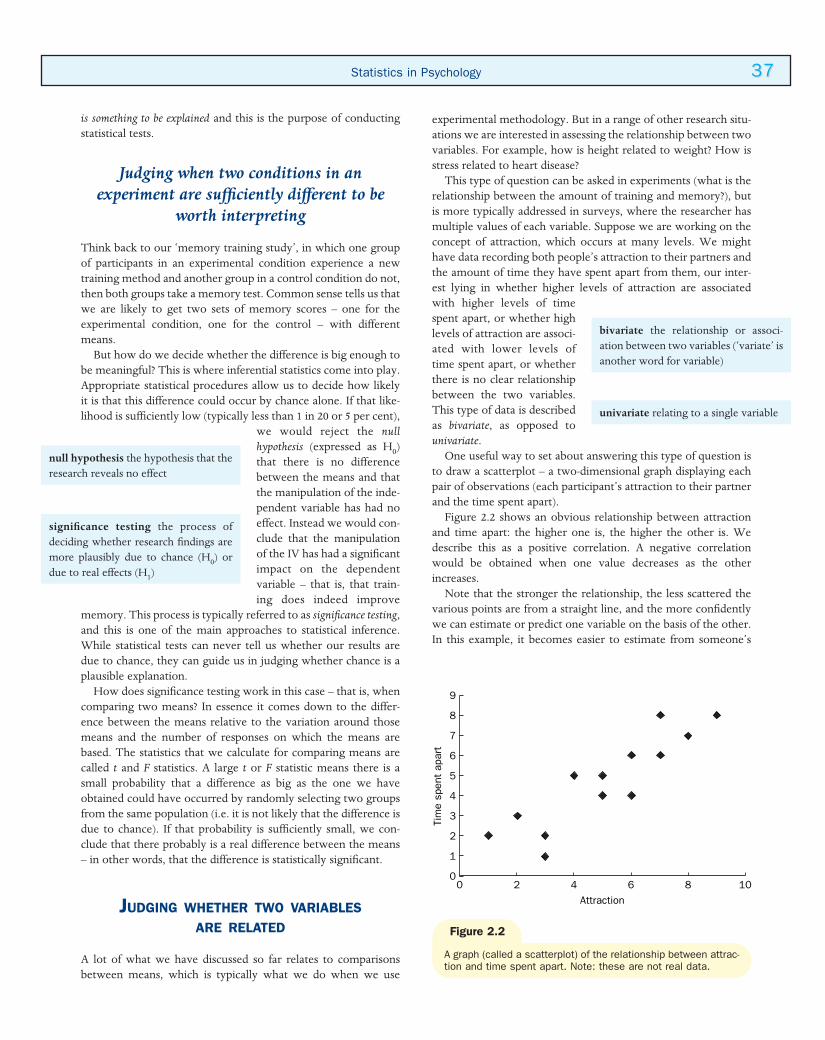
This type of question can be asked in experiments (what is therelationship between the amount of training and memory?), butis more typically addressed in surveys, where the researcher hasmultiple values of each variable. Suppose we are working on theconcept of attraction, which occurs at many levels. We mighthave data recording both people’s attraction to their partners andthe amount of time they have spent apart from them, our inter-est lying in whether higher levels of attraction are associated with higher levels of timespent apart, or whether highlevels of attraction are associ-ated with lower levels oftime spent apart, or whetherthere is no clear relationshipbetween the two variables. This type of data is describedas bivariate, as opposed tounivariate.
One useful way to set about answering this type of question isto draw a scatterplot – a two-dimensional graph displaying eachpair of observations (each participant’s attraction to their partnerand the time spent apart).
Figure 2.2 shows an obvious relationship between attractionand time apart: the higher one is, the higher the other is. Wedescribe this as a positive correlation. A negative correlationwould be obtained when one value decreases as the otherincreases.
Note that the stronger the relationship, the less scattered thevarious points are from a straight line, and the more confidentlywe can estimate or predict one variable on the basis of the other.In this example, it becomes easier to estimate from someone’s
null hypothesis the hypothesis that theresearch reveals no effect
significance testing the process ofdeciding whether research findings aremore plausibly due to chance (H0) ordue to real effects (H1)
9
8
7
6
5
4
3
2
1
01086
Attraction
420
Tim
e sp
ent
apar
t
Figure 2.2
A graph (called a scatterplot) of the relationship between attrac-tion and time spent apart. Note: these are not real data.
bivariate the relationship or associ-ation between two variables (‘variate’ isanother word for variable)
univariate relating to a single variable
PSY_C02.qxd 1/2/05 3:19 pm Page 37
3838 Methodology
attraction how much time they have spent apart from their part-ner, or to estimate level of attraction from the time spent apart.
UNDERSTANDING CORRELATION
Correlation does not imply causation
A mistake that is made by researchers more often than it ought tobe is to assume that, because two variables are highly correlated,one is responsible for variation in the other. Always remember thatcorrelation does not imply causation.
Suppose we conduct a study that reveals a strong positive cor-relation between the consumption of alcohol and aggressiveness.On this basis it cannot be concluded that alcohol causes aggres-siveness. You could equally argue that aggressiveness causes people to drink more, or the relationship may be the product of athird factor, such as upbringing. Perhaps having hostile parentsleads people to be aggressive and also to drink more. It is there-fore possible that upbringing encourages alcohol consumptionand aggressiveness, without each having a direct effect on the other.
There are many real-life examples of spurious correlations that have arisen from the influence of a third factor. For example,when researchers found that there was a high correlationbetween the presence of ‘spongy tar’ in children’s playgroundsand the incidence of polio, they misguidedly inferred that ‘spongy tar’ caused polio. As a result, some schools went to greatexpense to get rid of it. In fact, both spongy tar and polio wereboth linked to a third factor: excessively high temperature. So itwas this that needed to be controlled, not the type of tar in theplayground.
This inability to draw strict causal inferences (and the asso-ciated temptation to do so) is by far the most serious problemassociated with both correlational and survey methodology.
The measurement of correlation
Correlations are usually mea-sured in terms of correlationcoefficients. The most com-mon of these is the Pearsonproduct–moment correlation,
An experiment on group pressureThe research issue
Group pressure and conformity have been researched extensively in social psychology. One of the most influential studiesis Asch’s (1951) experiment involving a line judgement task. Asch wanted to investigate whether participants would choosean incorrect answer in order to conform to the group, and whether conformity would increase as the size of the groupincreased.
Design and procedureParticipants were shown two cards. One card showed one line, while the other card showed three. The participant’s taskwas to indicate which of the three lines on the second card was the same length as the line on the first card.
Each participant was assigned to one of seven group size conditions, ranging from completing the task alone to com-pleting the task with 16 other group members. The other group members were confederates and were trained to give thesame wrong answer on 12 out of the 18 trials. Using this experimental design, Asch was able to test his null hypothesis,which was that the confederates would not affect the participants’ responses.
Results and implicationsAsch rejected his null hypothesis because, on average, participants chose the wrong line more often when there were con-federates present than when they completed the task alone.
Furthermore, the mean number of errors increased as the group size increased. This led Asch to conclude that there wasprobably pressure to conform to a group’s opinions and decisions, and that this pressure was likely to increase as groupsbecame larger. Nonetheless, the results of this study were not subjected to statistical testing, so there is uncertainty asto the conclusions that can be drawn from this particular study.
Since then, however, other studies researching group pressure have found similar results that have been proved statis-tically significant. (See chapter 18 for more on this.)
Asch, S.E., 1951, ‘Effects of group pressure on the modification and distortion of judgements’ in H. Guetzkow (ed.), Groups,Leadership and Men, Pittsburgh: Carnegie.
ResearResearch close-up 2ch close-up 2
correlation coefficient a measure ofthe degree of correspondence or asso-ciation between two variables that arebeing studied
PSY_C02.qxd 1/2/05 3:19 pm Page 38
Final Thoughts 3939
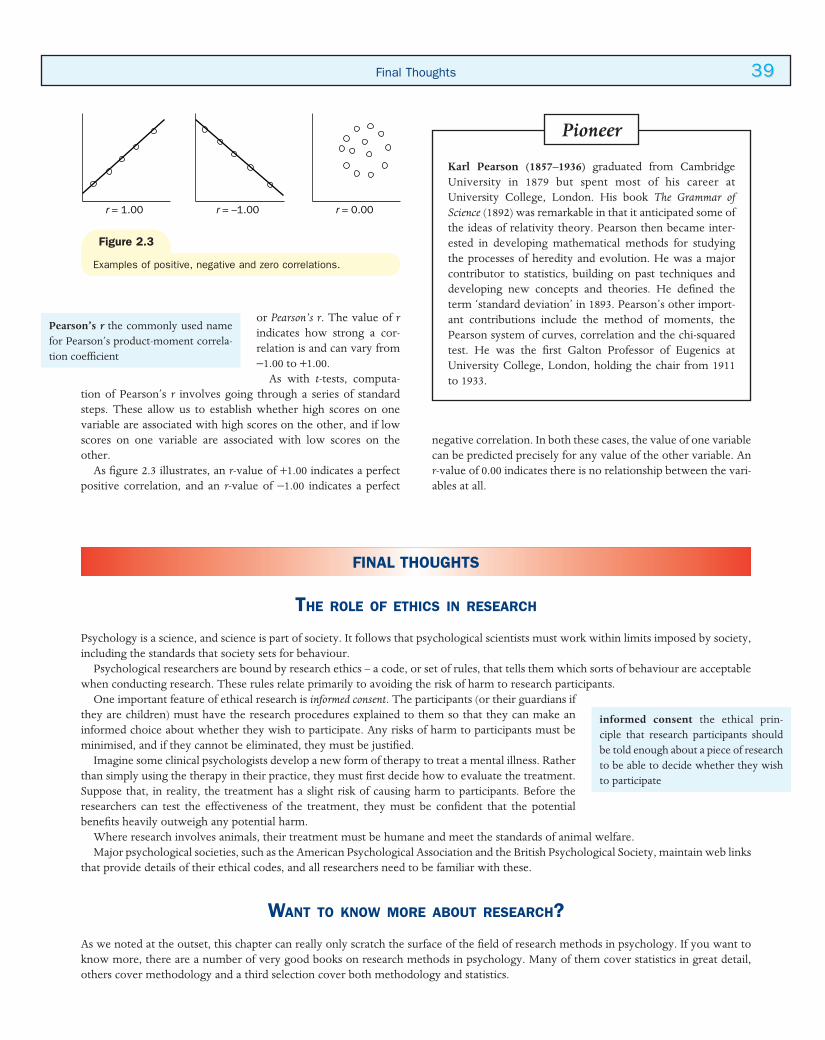
or Pearson’s r. The value of rindicates how strong a cor-relation is and can vary from−1.00 to +1.00.
As with t-tests, computa-tion of Pearson’s r involves going through a series of standardsteps. These allow us to establish whether high scores on onevariable are associated with high scores on the other, and if lowscores on one variable are associated with low scores on theother.
As figure 2.3 illustrates, an r-value of +1.00 indicates a perfectpositive correlation, and an r-value of −1.00 indicates a perfect
THE ROLE OF ETHICS IN RESEARCH
Psychology is a science, and science is part of society. It follows that psychological scientists must work within limits imposed by society,including the standards that society sets for behaviour.
Psychological researchers are bound by research ethics – a code, or set of rules, that tells them which sorts of behaviour are acceptablewhen conducting research. These rules relate primarily to avoiding the risk of harm to research participants.
One important feature of ethical research is informed consent. The participants (or their guardians ifthey are children) must have the research procedures explained to them so that they can make aninformed choice about whether they wish to participate. Any risks of harm to participants must beminimised, and if they cannot be eliminated, they must be justified.
Imagine some clinical psychologists develop a new form of therapy to treat a mental illness. Ratherthan simply using the therapy in their practice, they must first decide how to evaluate the treatment.Suppose that, in reality, the treatment has a slight risk of causing harm to participants. Before theresearchers can test the effectiveness of the treatment, they must be confident that the potentialbenefits heavily outweigh any potential harm.
Where research involves animals, their treatment must be humane and meet the standards of animal welfare.Major psychological societies, such as the American Psychological Association and the British Psychological Society, maintain web links
that provide details of their ethical codes, and all researchers need to be familiar with these.
WANT TO KNOW MORE ABOUT RESEARCH?
As we noted at the outset, this chapter can really only scratch the surface of the field of research methods in psychology. If you want toknow more, there are a number of very good books on research methods in psychology. Many of them cover statistics in great detail,others cover methodology and a third selection cover both methodology and statistics.
FINAL THOUGHTS
Pioneer
Karl Pearson (1857–1936) graduated from CambridgeUniversity in 1879 but spent most of his career atUniversity College, London. His book The Grammar ofScience (1892) was remarkable in that it anticipated some ofthe ideas of relativity theory. Pearson then became inter-ested in developing mathematical methods for studyingthe processes of heredity and evolution. He was a majorcontributor to statistics, building on past techniques anddeveloping new concepts and theories. He defined theterm ‘standard deviation’ in 1893. Pearson’s other import-ant contributions include the method of moments, thePearson system of curves, correlation and the chi-squaredtest. He was the first Galton Professor of Eugenics atUniversity College, London, holding the chair from 1911to 1933.
Pearson’s r the commonly used namefor Pearson’s product-moment correla-tion coefficient
r = 1.00 r = –1.00 r = 0.00
negative correlation. In both these cases, the value of one variablecan be predicted precisely for any value of the other variable. Anr-value of 0.00 indicates there is no relationship between the vari-ables at all.
informed consent the ethical prin-ciple that research participants shouldbe told enough about a piece of researchto be able to decide whether they wishto participate
Figure 2.3
Examples of positive, negative and zero correlations.
PSY_C02.qxd 1/2/05 3:19 pm Page 39
4040 Methodology
However your training in psychology develops, your most important aspiration should be to become an informed and critical user ofits methods. It is only by confidently exploring the limits and strengths of methodology that we are able to extend the limits and build onthe strengths of psychological knowledge.
Summaryn Research, as well as being important in its own right, underpins every aspect of involvement in psychology from introductory
studies right through to professional practice.n It is important therefore that research is done effectively. This means ensuring that research achieves valid findings through
reliable and reproducible methods that involve testing and developing explanations (theories) of these findings.n Psychologists have various methods at their disposal, and being a good researcher means choosing the appropriate method for
the question in hand. The appropriateness of a method also depends on how ethical it is.n Experiments have substantial advantages: by using random assignment to equate conditions in all respects except for the
manipulation, they allow us to explain any results in terms of two competing explanations – chance, and the effects of theexperimental treatment.
n Statistical tests are particularly useful for helping us to decide between these two explanations. For example, if we find differ-ences in the mean scores of two different conditions that are much larger than we would expect, it is unlikely that both con-ditions are identical (i.e. belong to the same statistical population).
n Statistics can also help us to judge whether it is plausible that two variables are related. Such relationships are called correla-tions, and there are many ways to measure them. In considering any correlation, it is always crucial to remember that correla-tion does not imply causation. Just because two variables are related, we cannot conclude that the first variable causes the second, even if this seems plausible. It is also possible that the second causes the first, or that some third factor causes both.
1. Does it matter whether psychology is a science? If so, why?2. What is problematic about findings that are reliable but not valid?3. What do you think are the relative merits of behavioural, self-report and physiological measures of psy-
chological processes?4. How do experiments help us to deal with the problem that correlation does not imply causation?5. What are the main descriptive statistics?6. Why do we carry out statistical tests?7. Can statistical tests tell us whether results are due to chance?8. Are positive correlations stronger than negative correlations?9. What purpose do research ethics serve?
REVISION QUESTIONS
FURTHER READING
BPS Code of Conduct, Ethical Principles & Guidelines (Nov. 2000). London: British Psychological Society. www.bps.org.uk/documents/Code.pdfSimilar guidelines have been developed by the American Psychological Association (http://www.apa.org/ethics/code2002.html), theAustralian Psychological Society (http://www.psychsociety.com.au/aps/ethics/default.asp) and the New Zealand Psychological Society(www.psychology.org.nz/psychinnz/2002%20Code%20Cover.pdf ).
Campbell, D.T., & Stanley, J.C. (1963). Experimental and Quasi-experimental Designs for Research. Chicago: Rand McNally.The classic short text on research design that all psychologists should read (and read again).
Cohen, J. (1994). The Earth is round (p < .05). American Psychologist, 49, 997–1003.An interesting discussion of some of the problems with the significance testing approach that we have outlined here.
PSY_C02.qxd 1/2/05 3:19 pm Page 40

Further Reading 4141
Haslam, S.A., & McGarty, C. (2003). Research Methods and Statistics in Psychology. London: Sage.This is the book on which this chapter was based. It involves a far more detailed treatment of the material (especially statistical tests) thanis possible here.
Howell, D.C. (1999). Fundamental Statistics for the Behavioral Sciences. Belmont, CA: Duxbury.An accessible and widely used introduction to statistics written by a psychologist.
Leong, T.L., & Austin, J.T. (1996). The Psychology Research Handbook: A Guide for Graduate Students and Research Assistants. Thousand Oaks,CA: Sage.A useful guide on a whole range of research matters from research design to publication.
Contributing authors:Craig McGarty & Alex Haslam
PSY_C02.qxd 1/2/05 3:19 pm Page 41