Embed Size (px)
Citation preview

Mice and Men: Their Promoter PropertiesVladimir B. Bajic1,2*, Sin Lam Tan1,2, Alan Christoffels3,4, Christian Schonbach5, Leonard Lipovich6, Liang Yang7,
Oliver Hofmann2, Adele Kruger2, Winston Hide2, Chikatoshi Kai8, Jun Kawai8,9, David A. Hume10, Piero Carninci8,9,
Yoshihide Hayashizaki8,9
1 Knowledge Extraction Laboratory, Institute for Infocomm Research, Singapore, 2 South African National Bioinformatics Institute, University of the Western Cape, Bellville,
South Africa, 3 Temasek Life Sciences Laboratory, National University of Singapore, Singapore, 4 School of Biological Sciences, Nanyang Technological University, Singapore,
5 Immunoinformatics Research Team, Advanced Genome Information Technology Research Group, RIKEN Genomic Sciences Center, RIKEN Yokohama Institute, Yokohama,
Japan, 6 Genome Institute of Singapore, Singapore, 7 Department of Obstetrics and Gynecology, National University Hospital, National University of Singapore, Singapore,
8 Genome Exploration Research Group (Genome Network Project Core Group), RIKEN Genomic Sciences Center, RIKEN Yokohama Institute, Yokohama, Japan, 9 Genome
Science Laboratory, Discovery Research Institute, RIKEN Wako Institute, Wako, Japan, 10 Australian Research Council Special Research Centre for Functional and Applied
Genomics, Institute for Molecular Bioscience, University of Queensland, Brisbane, Queensland, Australia
Using the two largest collections of Mus musculus and Homo sapiens transcription start sites (TSSs) determined basedon CAGE tags, ditags, full-length cDNAs, and other transcript data, we describe the compositional landscapesurrounding TSSs with the aim of gaining better insight into the properties of mammalian promoters. We classifiedTSSs into four types based on compositional properties of regions immediately surrounding them. These propertieshighlighted distinctive features in the extended core promoters that helped us delineate boundaries of thetranscription initiation domain space for both species. The TSS types were analyzed for associations with initiatingdinucleotides, CpG islands, TATA boxes, and an extensive collection of statistically significant cis-elements in mouseand human. We found that different TSS types show preferences for different sets of initiating dinucleotides and cis-elements. Through Gene Ontology and eVOC categories and tissue expression libraries we linked TSS characteristics toexpression. Moreover, we show a link of TSS characteristics to very specific genomic organization in an example ofimmune-response-related genes (GO:0006955). Our results shed light on the global properties of the twotranscriptomes not revealed before and therefore provide the framework for better understanding of thetranscriptional mechanisms in the two species, as well as a framework for development of new and more efficientpromoter- and gene-finding tools.
Citation: Bajic VB, Tan SL, Christoffels A, Schonbach C, Lipovich L, et al. (2006) Mice and men: Their promoter properties. PLoS Genet 2(4): e54. DOI: 10.1371/journal.pgen.0020054
Introduction
The computational identification and functional analysis ofmammalian promoters has, to date, been constrained by therelatively small datasets of experimentally confirmed tran-scription start sites (TSSs). For example, promoters withindbTSS were recently updated with the mapping of 195,446FANTOM2 mouse full-length cDNA sequences to 6,875RefSeq mouse genes [1,2]. Functional analyses of thesemammalian promoters have been restricted to shared tran-scription factor binding sites (TFBSs) between human andmouse datasets [2]. Using the same collection of promoterscontained in dbTSS, Aerts et al. embarked on a character-ization of promoters by extending their study to Drosophilamelanogaster and Fugu rubripes [3]. Further characterization ofmammalian promoters is dependent on the availability ofexperimentally verified TSSs that would complement andextend existing datasets represented by the FANTOMcollection, dbTSS, the H-Invitational database [4], and
RefSeq. The latest effort of the FANTOM3 consortium [5]has provided the scientific community with the largestcollection of transcriptome data for Mus musculus (mouse),and has complemented this with CAGE tags of Homo sapiens(human). Based on these data we provide a comprehensivecomparative analysis of mouse and human promoters thatresults in a number of new insights that help us to betterunderstand the transcriptional scenario in these two species.GC properties are well-known global factors that influence
promoter characteristics and gene expression [3,6–9]. Inaddition, GC characteristics influence important DNAproperties such as the ‘‘bendability’’ and curvature of theDNA helix and consequently influence the interplay of DNAand chromatin, which impacts transcription. We set out to
Editors: Judith Blake (The Jackson Laboratory, US), John Hancock (MRC-Harwell,UK), Bill Pavan (NHGRI-NIH, US), and Lisa Stubbs (Lawrence Livermore NationalLaboratory, US), together with PLoS Genetics EIC Wayne Frankel (The JacksonLaboratory, US)
Received August 15, 2005; Accepted February 27, 2006; Published April 28, 2006
DOI: 10.1371/journal.pgen.0020054
Copyright: � 2006 Bajic et al. This is an open-access article distributed under theterms of the Creative Commons Attribution License, which permits unrestricteduse, distribution, and reproduction in any medium, provided the original authorand source are credited.
Abbreviations: CGI, CpG island; GO, Gene Ontology; Inr, initiator; ORI, over-representation index; PE, promoter element; TF, transcription factor; TFBS,transcription factor binding site; TSS, transcription start site
* To whom correspondence should be addressed. E-mail: [email protected]
PLoS Genetics | www.plosgenetics.org April 2006 | Volume 2 | Issue 4 | e540614

characterize the regions immediately surrounding TSSs basedon such compositional properties. Our determination oftentative TSS locations has been based on the use of CAGEtags [10] and ditags [11] enriched with additional independ-ent pieces of evidence of transcript existence including 59
expressed sequence tags, long 59-SAGE, and the 59 ends offully sequenced cDNAs from full-length libraries.
In this study, we report several distinctive features in theextended core promoters that helped us delineate theboundaries of the transcription initiation domain space forboth mouse and human, as well as delineate species-specificcharacteristics within that space. We describe the associationof TSS types with the initiating dinucleotide, CGIs, TATAboxes, and an extensive collection of statistically significant
cis-elements in mouse and human, and correlate TSS proper-ties with expression data through comparison with GeneOntology (GO) [12] and eVOC [13] categories, tissueexpression libraries, and specific genome organization.
Results/Discussion
GC Content and TSS TypesWe considered TSS properties based on the GC character-
istics of the segments immediately upstream and downstreamof experimentally estimated TSSs. We split TSSs into fourdistinct classes based on the GC content upstream anddownstream of the TSS, as shown in Table 1 (see Materialsand Methods). These four tentative TSS types have been usedas a tool to investigate different promoter features in mouseand human. Two TSS types do not differ in GC richnessbetween the upstream and downstream regions. They are GC-rich (GC-GC, type A) or AT-rich (AT-AT, type D) bothupstream and downstream. The other two are GC-richupstream and AT-rich downstream (GC-AT, type B) and,vice versa, AT-rich upstream and GC-rich downstream (AT-GC, type C). The distributions of TSS positions in the case ofmouse and human are depicted in Figure 1. A strongpolarization of the TSS distribution exists, with TSS types Aand D being most prevalent (Figure 1A). The number of TSSsin each of the TSS types remains almost unchanged if thelength of the upstream and downstream regions changes
Table 1. Four TSS Types Defined Based on the GC ContentUpstream and Downstream of the TSS
TSS Type Upstream GC Content Downstream GC Content
A GC-rich GC-rich
B GC-rich AT-rich
C AT-rich GC-rich
D AT-rich AT-rich
GC-rich means GþC . 50% in the considered region. AT-rich (i.e., GC-poor) means GþC� 50% in the considered region. In our case, the upstream region is [�100,�1], and thedownstream region is [þ1,þ100] relative to the TSS.DOI: 10.1371/journal.pgen.0020054.t001
Figure 1. Transcription Initiation Domains for Mouse and Human
Distribution of mouse (red) TSSs overlapped by human (blue) TSSs based on (A) Cþ G content, (B) Aþ G content, and (C) Tþ G content. Nucleotidecontent is determined for upstream [�100,�1] and downstream [þ1,þ100] regions relative to the TSS. The distribution of TSS locations is more or lessrandom when viewed in terms of A þ G content (B) or T þ G content (C). Strong polarization of distributions is evident only in the G þ C case (A).DOI: 10.1371/journal.pgen.0020054.g001
PLoS Genetics | www.plosgenetics.org April 2006 | Volume 2 | Issue 4 | e540615
Promoter Properties
Synopsis
Tens of thousands of mammalian genes are expressed in variouscells at different times, controlled mainly at the promoter levelthrough the interaction of transcription factors with cis-elements.The authors analyzed properties of a large collection of exper-imental mouse (Mus musculus) and human (Homo sapiens) tran-scription start sites (TSSs). They defined four types of TSSs based onthe compositional properties of surrounding regions and showedthat (a) the regions surrounding TSSs are much richer in propertiesthan previously thought, (b) the four TSSs types are associated withdistinct groups of cis-elements and initiating dinucleotides, (c) theregions upstream of TSSs are distinctly different from the down-stream ones in terms of the associated cis-elements, and (d) mouseand human TSS properties relative to CpG islands (CGIs) and TATAbox elements suggest species-specific adaptation. The authorslinked TSS characteristics to gene expression through categoriesdefined by the Gene Ontology and eVOC classifications and tissueexpression libraries. They provided examples of the preference ofimmune response genes for TSS types and specific genomicorganization. Their results shed light on the fine compositionalproperties of TSSs in mammals and could lead to better design ofpromoter- and gene-finding tools, better annotation of promotersby cis-elements, and better regulatory network reconstructions.These areas represent some of the focal topics of bioinformatics andgenomics research that are of interest to a wide range of lifescientists.

(Figure S1); it also only gradually changes with a change ofthreshold for GC richness (Figure S1). These findings suggestrobustness of our TSS classification.
Are Two TSS Types (GC-Rich and AT-Rich) Sufficient to
Consider?Promoters are usually classified as either GC-rich or AT-
rich, without separating such properties into upstream anddownstream characteristics relative to the TSS [3]. In ourstudy we observed that many of the TSSs that are notevidently GC-rich (both upstream and downstream of theTSS) have changing GC content when going from upstream todownstream regions (Figure 2). The types of patterns wereAT!GC, AT!AT, and GC!AT, containing 1,911, 1,528, and1,440 instances, respectively, in our mouse TSS dataset. Wefound it reasonable to assign the TSSs with a change of GCcontent around the TSS (AT!GC and GC!AT) to differentclasses because they represent about 2/3 of all non-GC-GCtypes. We use this profiling of TSS characteristics as amethodological convenience. However, the biological justifi-cation for this relies on the fact that many cis-elements have a
preference for GC-rich or AT-rich domains, as found instudies of promoter groups [14,15]. Thus, consideringseparately the GC-rich (AT-rich) upstream and downstreamsegments around TSSs provides an opportunity to analyzedifferent groups of binding sites that may confer differenttranscription initiation scenarios.An essential support for the biological relevance of our
introduced TSS classification relies on the fact that someeukaryotic genomes have dominant TSS characteristics of theclasses we defined. For example, based on the work of Aerts etal. [3], TSS types B and C appear prevalent in F. rubripes andtype D in D. melanogaster, while type A is characteristic of thehuman genome. There are other ways to classify promotersusing certain functional rather than compositional proper-ties. Kadonaga [16] used the presence of functional corepromoter elements (PEs) such as TATA boxes, initiators, anddownstream promoter elements (DPEs) to classify promotersinto several types. A different approach was used by Kim et al.[17]: the properties of preinitiation complex binding topromoter and the observed transcript expression state wereused to define four promoter groups.
Figure 2. Distribution of Mononucleotides in Mouse Promoters in the Region Surrounding the TSS
The nucleotides adenine, cytosine, guanine, and thymine are represented by blue, green, red, and light blue, respectively. The TSS types that are GC-poor upstream (C and D) show very characteristic enrichment in adenine and thymine nucleotides around [�35,�20], suggesting a potential dominantinfluence of TATA box and similar AT-rich elements in transcription initiation in these types. In type B and A TSSs, this influence does not seem to bedominant, but the presence of such elements is suggested by a significant reduction of the GC content in the [�35,�20] region. In principle, one couldattempt to link the types of AT-rich upstream elements with initiating dinucleotides characteristic of different TSS types.DOI: 10.1371/journal.pgen.0020054.g002
Figure 3. Distribution of Densities of Selected PEs in Promoters of the Four TSS Types in Mouse
The density of PEs is calculated from the region covering [�100,þ100] relative to the TSS. Density is determined for bins of length 50 bp and shifted by10 bp. In total, there are 17 bins. The vertical axis shows the percentage of TSSs of the considered type that contain the PE.(A) Distribution of selected PEs that prefer GC-rich (left) and AT-rich (right) domains in type B (above) and type C (below) TSS groups. Bin number 9 iscentered around the TSS. It can be seen that groups of PEs change significantly in their concentrations in transition from upstream to downstreamregions and characterize two distinct TSS types (B and C).(B) Distribution of selected PEs across all four TSS types. Blue, green, red, and light blue correspond to distributions characterized by type A, B, C, and DTSSs. The first five PEs are those that prefer GC-rich regions, and the last seven PEs prefer AT-rich regions (the plus or minus sign in front of the TFBSsymbol denotes the strand where the TFBS is found).DOI: 10.1371/journal.pgen.0020054.g003
PLoS Genetics | www.plosgenetics.org April 2006 | Volume 2 | Issue 4 | e540616
Promoter Properties

PLoS Genetics | www.plosgenetics.org April 2006 | Volume 2 | Issue 4 | e540617
Promoter Properties

We found through several sources of evidence thatexpanding a crude classification of GC-rich and AT-richTSSs by two additional subclasses makes biological sense andpresents certain fine details more explicitly than is possible ifall TSSs are lumped into only two (GC-rich and AT-rich)classes. Very obvious examples of such details, in addition tolargely different compositions of the putative cis-elementsthat reside in the upstream and downstream regions, are (a)specialized, but different, initiating dinucleotides overrepre-sented in a statistically significant manner in TSSs ofdifferent types, (b) clear differences in the surroundingenvironment of the initiating dinucleotides between the fourTSS types, and (c) different preferences of some functionalgene groups for particular TSS types. These features cannotbe observed if the groups are lumped.
GC Content of TSS Surroundings Reflects Types ofPutative cis-Elements
By considering the GC content upstream and downstreamseparately, we allowed for one more degree of freedom inobserving global TSS properties. Here we denote a PE as aTFBS and the strand where it is found. Many PEs havepreferences for either GC-rich or GC-poor regions [14,15].For example, the well-known TATA box element, being AT-rich, will be found more frequently in AT-rich regions, whilethe Sp1-binding sites, being GC-rich, will be found morefrequently in GC-rich regions. Thus, the four TSS types thatwe consider could be correlated in a global manner with thepotential PEs that may control the respective genes. Supportfor the influence of potential PEs on specific TSS types isobtained from the distributions of PE densities (Figure 3).Density distributions of selected PEs that prefer GC-rich (AT-rich) domains in type B and type C TSSs are depicted inFigure 3A. We observe that PE groups change their concen-trations significantly in transition from upstream to down-stream regions. Moreover, in Figure 3B we presentdistributions for selected PEs across all four TSS types. Thefirst five PEs in Figure 3B (þZF5, �AP-2, �Churchill, �EGR,and �PCF2) are those that prefer GC-rich regions (the plusand minus signs in front of the TFBS symbols denotes thestrand where the TFBS is found). It is interesting to observethat these PEs occur in high concentrations in the type Agroup (GC-GC), occur in considerably lower concentrationsin type D (AT-AT), and follow the change of GC content intypes B and C. We observe the converse for the remainingseven PEs, which prefer AT-rich regions. These propertiessuggest that the four TSS types selectively associate withdifferent groups of PEs.
Upstream and Downstream Regions Are Different:Enrichment by Specific PEs
We analyzed the preference of upstream and downstreamregions in the four TSS types for significantly enriched (atleast 3-fold) PEs in one region as opposed to the other region.The results are presented in Figure 4. To our surprise, wefound that for all TSS types the number of enriched PEs inthe upstream region is much higher than in the downstreamregion. In three types (A, C, and D) the number of PEs in thedownstream region is minimal compared to the upstreamregion. The only exception is type B, for which there are asignificant number of enriched PEs in the downstreamregion. The data suggest for type A TSSs a high influence of
PEs that reside upstream and prefer GC-rich domains, whilefor type C TSSs such influence is likely through PEs that arelocated upstream of the TSS but prefer AT-rich domains.Contrary to these patterns, promoters with type B TSSs seemto utilize a mix of both GC-rich-preferring and AT-rich-preferring PEs. A conclusion cannot be made for type D TSSsbecause of the very small number of highly enriched elementsoverall. Moreover, applying the Chi-square test for theequality of distributions in the upstream and downstreamregions we get p¼ 1.343 10�07, which strongly rejects the nullhypothesis that these distributions are the same. All thesefindings suggest that upstream and downstream regionsshould be considered separately (as we do). The resultsemphasize enrichment of different PE groups associated withupstream and downstream regions in the promoters of thefour TSS types.
Four TSS Types Associate with Different Sets of PEsDifferent compositional properties of the four TSS types
suggest that the TSSs may be controlled by specializedcollections of transcription factors (TFs). Thus, we attemptedto find the potential TFs that could play dominant roles inthe four TSS types by identifying (a) the specificity of the top-ranked PEs (relative to overrepresentation index [ORI]; seeMaterials and Methods) in different TSS types, (b) unique andcommon motifs in the GC-rich/AT-rich upstream/down-stream regions for different TSS types, and (c) the mostsignificant PEs/TFs upstream/downstream of TSSs of types A,B, C, and D.To carry out these analyses we initially compared the
incidence of predicted DNA-binding sites of known TFs inthe different promoter segments in mouse in the four TSStypes against those in random mouse DNA. For the top 150predicted motifs (representing approximately 10% of allelements found in these comparisons) determined based onORI [15], we calculated Bonferroni corrected p-values forenrichment in the considered promoter segments. In theselection of these top 10% of motifs we required that they bepresent in at least 10% of the promoters in the target groupsand that they have an ORI value not less than 1.5. In thesecomparisons we found that the corrected p-value was belowthe threshold of 0.05 for the great majority of cases. Thesecomparisons indicate that most of the motifs for theconsidered TSS types are highly specific relative to randomDNA (Table S1).Next we aimed to see if promoter segments with the same
GC richness share the same set of PEs. We compared theupstream regions of groups A versus B and C versus D, andthe downstream regions of groups A versus C and groups Bversus D. It is interesting to note that the upstream (GC-rich)regions of type A and B TSSs do share, as expected, a subsetof predicted motifs, but each type is characterized also by aspecialized collection of putative binding sites that do notappear in the top 150 ranked sites of the other type (forexample, ETS appears in promoters of type B TSSs, but not inpromoters of type A TSSs) (Table S2).Even those TFs that are found to be common in the
upstream parts of both type A and type B TSSs appear insignificantly different proportions of promoters of thesetypes, as summarized in Figure S2. For example, Ets (Table S1)appears in AT-rich downstream segments (types B and D).However, in type B TSSs it appears in 17.08% of promoters,
PLoS Genetics | www.plosgenetics.org April 2006 | Volume 2 | Issue 4 | e540618
Promoter Properties

but only on the minus strand, while in type D it appears in13.48% of promoters, but only on the plus strand.
Moreover, if we consider unique motifs that appear indifferent groups, they are commonly present in largeproportions of promoters of those target groups. Forexample, in transcripts initiated from type D TSSs, we findonly two unique PEs in the downstream region. One is DBP, atranscriptional activator in hepatic cells [18] and member ofthe C/EBP family, which appears in 26.77% of promoters withtype D TSSs and only on the minus strand. The otherelement, Ncx, is enteric neuron homeobox and acts as anactivator [19] that is required for proper positional specifi-cation, differentiative cell fate, and maintenance of properfunction of enteric neurons [20,21]. It is present in 41.75% ofpromoters with type D TSSs and only on the plus strand.
Since any two of the four TSS types could differ in their GCcontent in the upstream, downstream, or both regions, andconsequently harbor different sets of significant motifs, weconclude that, overall, TSS types contain sets of significantsignature motifs (denoted by a plus sign next to the ORI valuein Table S1 and a plus sign in Table S2) that potentially maycontribute to orientation, and are likely to interact withdistinct set of TFs. This concurs with the results of thepreceding two subsections and suggests overall differenttranscriptional programs present in the transcripts of theseTSS types. Lists of the most significant PEs that appear in theTSS groups are provided in Table S3.
The Initiating Dinucleotide and Its EnvironmentWe analyzed in mouse and human datasets the initiating
dinucleotide, that is, the one that occupies positions [�1,þ1]relative to the TSS. We found that a number of differentinitiating dinucleotides are statistically significant acrossvarious TSS types and that they show certain regularitiesrelated to the GC content of upstream and downstream
regions surrounding the TSS. Table 2 shows for mouse andhuman data all statistically significant cases based on the p-value obtained by the right-sided Fisher’s exact test andcorrected for multiplicity testing by the Bonferroni method.The association of initiating dinucleotide to TSS properties isvery specific. It is interesting to note that the initiatingdinucleotide TA is significantly enriched in TSS types that areAT-rich upstream, downstream, or both (B, C, and D), whiledinucleotides that start with guanine (GA or GG) aresignificantly enriched in TSS types that are AT-rich specif-ically downstream (B and D). Type A TSSs are significantlyenriched for dinucleotides that start with cytosine (CC, CG,and CT). However, the canonical initiating dinucleotide CAappears statistically significant only for TSS types that changeGC richness (B and C). Finally, the TSS type C group containsAG and TG dinucleotides at a statistically significant level,while these do not appear significant in any other TSS type.This compositional property of the initiating dinucleotide
being linked in a statistically significant manner to the GCproperties of the upstream and downstream regions wouldnot be detectable if the TSS groups were lumped. We see thatthese properties characterize significant numbers of TSSs inour mouse dataset, namely, 10,547 (30.80%), 889 (61.74%),1,372 (70.61%), and 534 (34.95%) of TSSs of type A, B, C, andD, respectively, and thus they do not appear to be artifacts ofthe proposed TSS classification that we have introduced. Theconclusion is that the initiating dinucleotides show specificpreferences at statistically significant levels to different TSSenvironments and that a significant portion of TSSs in ourdatasets are characterized by these initiating dinucleotides.Moreover, almost all of them are different from the canonicalCA dinucleotide.This last observation leads us to hypothesize that different
TSS types may be controlled by different initiator (Inr)elements. Figure 2 depicts the quite different composition ofthe regions immediately surrounding tentative TSSs. The Inrelements—if they appear biologically relevant for thesegroups—should overlap TSSs and may be qualitativelydifferent for different TSS types. Different initiating dinu-cleotides of highly statistically significant enrichment supportsuch a hypothesis, and, at the same time, the variability of theobserved initiating dinucleotides could explain the non-specific consensus of the octamer Inr element [22]. We havegenerated sequence logos of the TSS surroundings [�5,þ5] inboth mouse and human, and present them in Figure 5A. Weobserve that the nucleotide distributions for type A (GC-GC)TSSs are about the same in mouse and human. However, forTSS types B, C, and D, there is evident difference in thesedistributions in the region surrounding the TSS, which doesnot contradict our hypothesis of potentially different Inrelements for different TSS types. Figure 5B shows logos ofregions [�35, þ20] for the four TSS types in mouse andhuman. Again, we observe significant similarity between thespecies in the composition of the region for type A TSSs,while the other TSS types show significantly more variability.This may suggest species-specific organization of the corepromoters for these minority TSS types (B, C, and D).
Relation of TSS Types to TATA Box Elements and CpGIslandsWe analyzed the four TSS types in mouse and in human
(Tables 3 and 4) for the presence of TATA box elements and
Figure 4. Distribution of Selected Groups of PEs That Are Highly
Enriched (at Least 3-Fold) Upstream or Downstream of the TSS
The upstream region considered covers [�100, �1], while the down-stream region covers [þ1,þ100] relative to the TSS. In all TSS types, theupstream region contains significantly more enriched PEs than thedownstream region.DOI: 10.1371/journal.pgen.0020054.g004
PLoS Genetics | www.plosgenetics.org April 2006 | Volume 2 | Issue 4 | e540619
Promoter Properties

association with CGIs. Globally, there are similarities in theseproperties of TSS types between these two species, but thereare also significant differences. This mouse–human compar-ison must be treated with some caution, since the mouse andhuman datasets are based upon analysis of distinct tissues,and the human set is probably less comprehensive. In somemeasure, the distinctions may also relate to depth of coveragein the two species. However, since we considered a statisti-cally large number of well-defined TSS locations in mouse(39,156) and in human (10,255), this makes comparisonbetween the two species feasible.
Based on Bonferroni corrected p-values we find that themouse and human datasets differ significantly in a number ofpromoter features (Tables 3 and 4). Mouse promoters aresignificantly enriched in (a) the number of promoters notassociated with CGIs in TSS types A and B, and overall; (b) thenumber of TATA-less promoters in group A; (c) the overallnumber of promoters that have TATA boxes but are notassociated with CGIs; and (d) the number of TATA-lesspromoters not associated with CGIs in TSS groups A and B,and overall. Conversely, human promoters are significantlyenriched in (a) the number of promoters associated with CGIsin TSS types A and B, and overall; (b) the number of TATA-box-containing promoters in TSS type A; (c) the number ofTATA-box-containing promoters associated with CGIs in TSStypes A, B, and C, and overall; and (d) the number of TATA-less promoters associated with CGIs in TSS types A and B,and overall. These data suggest that there are species-specificsolutions for transcriptional initiation in mouse and humanfor the analyzed TSS types.
There are a number of core PEs other than TATA boxesand Inr elements, such as the downstream promoter element(DPE) [23–26], the TFIIB response element (BRE) [27], themotif ten element (MTE) [28], and the downstream core
element (DCE) [29,30]. It would be of interest to investigatetheir presence around mammalian TSSs. Unfortunately, suchan analysis represents a study on its own and requires reliablematrix models of these elements in mammals that are not yetavailable.
Linking TSS Properties and Gene ExpressionWe were interested to find out if the TSS types show any
correlation with broad expression categories. We usedassociation of transcripts with different GO [12] and eVOC[13] categories, as well as FANTOM3 tissue expressionlibraries, and analyzed their TSS distribution across the fourtypes in mouse. While it is not possible to make definiteconclusions because of incomplete GO, eVOC, tissue library,and transcript data, we were able to find a number of classesthat associate with specific TSS types in a statisticallysignificant manner (Tables 5, 6, S4, and S5). Moreover, wesearched for ortholog transcript groups in mouse and humanwhose promoters preserve enrichment in specific TSS typesin both species (Table S4). Under the conditions of our studywe found that 100% of GO categories whose mappedtranscripts emanate from type B TSSs preserve their enrich-ment; this is true for 64% of GO categories associated withtype C TSSs and for 80% of GO categories associated withtype D TSSs. These results suggest that between mouse andhuman the TSS character within the GO categories is largelyconserved. Distributions of all mouse TSSs across the fourTSS types for GO categories and FANTOM3 tissue librariesare provided in Table S5.We further analyzed several specific cases. For many GO
categories we found that transcripts associated with themprefer specific GC-rich/GC-poor transcription initiationframeworks (Table 5). For example, the immune responsegroup (GO:0006955) (Figure 6) appears with 1.58-, 4.85-, and
Table 2. Starting Dinucleotide [�1,þ1] for Various TSS Types in Mouse and Human Datasets
Organism Starting
Dinucleotide
TSS
Type
Number of
Cases
Number of TSSs
with Starting
Dinucleotide
Total Number
of TSSs in
the Same
TSS Group
Total
Number
of TSSs
Multiplicity
Correction
Factor
p-Value Bonferroni
Corrected
p-Value
Mouse AG C 172 1,943 2,524 39,156 16 1.41 3 10�5 2.25 3 10�4
CA B 458 1,440 10,000 39,156 16 3.25 3 10�8 5.20 3 10�7
CA C 558 1,943 10,000 39,156 16 6.09 3 10�4 9.75 3 10�3
CC A 1,299 34,245 1,410 39,156 16 7.17 3 10�9 1.15 3 10�7
CG A 8,669 34,245 9,076 39,156 16 1.06 3 10�185 1.69 3 10�184
CT A 579 34,245 635 39,156 16 1.80 3 10�3 2.88 3 10�2
GA B 16 1,440 171 39,156 16 6.09 3 10�4 9.75 3 10�3
GA D 15 1,528 171 39,156 16 2.99 3 10�3 4.79 3 10�2
GG B 264 1,440 2,952 39,156 16 1.32 3 10�42 2.12 3 10�41
GG D 350 1,528 2,952 39,156 16 8.28 3 10�83 1.33 3 10�81
TA B 151 1,440 2,703 39,156 16 1.86 3 10�7 2.97 3 10�6
TA C 187 1,943 2,703 39,156 16 2.30 3 10�6 3.68 3 10�5
TA D 169 1,528 2,703 39,156 16 7.82 3 10�10 1.25 3 10�8
TG C 455 1,943 7,381 39,156 16 1.55 3 10�7 2.48 3 10�6
Human AA D 12 385 88 10,255 16 1.03 3 10�4 1.65 3 10�3
CG A 2,777 9,269 2,878 10,255 16 2.37 3 10�46 3.79 3 10�45
GG D 85 385 578 10,255 16 4.28 3 10�29 6.85 3 10�28
TA B 25 244 575 10,255 16 2.55 3 10�3 4.07 3 10�2
TA C 35 357 575 10,255 16 8.68 3 10�4 1.39 3 10�2
We show only statistically significant cases.DOI: 10.1371/journal.pgen.0020054.t002
PLoS Genetics | www.plosgenetics.org April 2006 | Volume 2 | Issue 4 | e540620
Promoter Properties

Figure 5. Sequence Logos
(A) Sequence logos for Inr in human (left) and mouse (right) obtained using [�5,þ5] segments relative to TSS locations. There is an evident bias in thenucleotide composition surrounding the TSS that effectively determines different Inr elements.(B) Sequence logos for segments [�35,þ20] relative to TSS locations. Strong similarity exists between human (left) and mouse (right) in TSS type A, whilethat similarity is considerably reduced for the other TSS types.DOI: 10.1371/journal.pgen.0020054.g005
PLoS Genetics | www.plosgenetics.org April 2006 | Volume 2 | Issue 4 | e540621
Promoter Properties

3.35-fold more transcripts having TSSs of type B, C, and D,respectively, than one would expect based on the proportionof transcripts in these groups in our reference mouse data.The enrichment in type C and D TSSs is statisticallysignificant (Bonferroni-corrected right-sided Fisher’s exacttest, p¼ 1.33 3 10�18 and p¼ 2.60 3 10�4, respectively). Basedon this, we conclude that the transcript group GO:0006955 ischaracterized by increased participation of transcripts fromTSS types that are AT-rich upstream or downstream. Weanalyzed in more detail the genomic organization of locicorresponding to genes from the most overrepresented TSStype (type C) for this GO. We found that TSSs of type C mapto 36 nonredundant genes, of which two are in bidirectionalpromoters (2/36), which means these are underrepresentedfor type C TSSs relative to the genome average. There are 23genes (64%) that are appearing in gene family clusters, that is,these genes are highly overrepresented for type C TSSsrelative to the genome average. Finally, genes with type CTSSs have small genomic span: 34 out of 36 are less than 25 kblong, which is again more than one would expect based on thegenome average. Most genes in the category GO:0006955 areshort (the majority are actually less than 10 kb), are clusteredwith other members of the same families, and are notbidirectionally transcribed. This analysis illustrates a specific
genomic organization of genes with TSSs of type C in this GOgroup. Thus, TSS properties may be associated with genomicorganization.In Table 5, one can see that GC-rich TSSs relate to genes
responsible for various binding and protein transportactivities. These functions usually occur in different regionsof the cell and are reflected in the diverse compartments thatare enriched for type A TSSs. AT-rich TSSs (types C and D),on the other hand, are enriched in processes relating todefense responses to the environment. TSSs of the membraneattack complex (GO:0005579) , defense response(GO:0006952), and immune response (GO:0006955) areenriched in type D TSSs, while the last two of these (defenseand immune response) and cytocine activity (GO:0005125)are enriched in type C TSSs. Globin group (GO:0001524) andhemoglobin complex (GO:0005833) are enriched in type BTSSs. These findings suggest a preference of differentfunctional transcript groups for specific TSS types.Similarly, for transcript groups based on eVOC terms, we
find that they prefer GC-rich or GC-poor transcriptioninitiation frameworks, depending on the eVOC category. Forexample, thymus-expressed transcripts (EVM:2270063 andEVM:2280063) (Table 6) seem to prefer either type A or DTSSs. The same is the case for transcripts classified according
Table 3. Basic Statistics on Relation of TATA Box Motifs, CGIs, and Four TSS Types for MM5 Transcripts
Category TSS Type
Type A Type B Type C Type D Overall
Number of promoters 34,245 1,440 1,943 1,528 39,156
CGI 27,026 (78.92) [1] 253 (17.57) [1] 363 (18.68) [1] 9 (0.59) [1] 27,651 (70.62) [1]
No CGI 7,219 (21.08) [2.74 3 10�41] 1,187 (82.43) [4.87 3 10�5] 1,580 (81.32) [9.58 3 10�2] 1,519 (99.41) [8.82 3 10�2] 11,505 (29.38) [6.26 3 10�59]
TATA 2,539 (7.41) [1] 188 (13.06) [1] 567 (29.18) [1] 434 (28.40) [1] 3,728 (9.52) [1]
TATA-less 31,706 (92.59) [1.63 3 10�3] 1,252 (86.94) [1.43 3 10�1] 1,376 (70.82) [1] 1,094 (71.60) [1] 35,428 (90.48) [2.02 3 10�1]
CGI þ TATA 1,613 (4.71) [1] 33 (2.29) [1] 58 (2.99) [1] 1 (0.07) [1] 1,705 (4.35) [1]
CGI þ TATA-less 25,413 (74.21) [1] 220 (15.28) [1] 305 (15.70) [1] 8 (0.52) [1] 25,946 (66.26) [1]
No CGI þ TATA 926 (2.70) [2.19 3 10�1] 155 (10.76) [1] 509 (26.20) [1] 433 (28.34) [1] 2,023 (5.17) [2.09 3 10�4]
No CGI þ TATA-less 6,293 (18.38) [3.72 3 10�41] 1,032 (71.67) [1.12 3 10�4] 1,071 (55.12) [1] 1,086 (71.07) [1] 9,482 (24.22) [2.11 3 10�52]
We present for each category (CGI, no CGI, etc.) the number of cases for each TSS type, the percent (in parentheses) of the total population in that TSS type, and the Bonferroni correctedp-value (in brackets) calculated from a right-sided Fisher’s exact test based on the hypergeometric distribution.DOI: 10.1371/journal.pgen.0020054.t003
Table 4. Basic Statistics on Relation of TATA Box Motifs, CGIs, and Four TSS Types for HS17 Transcripts
Category TSS Type
Type A Type B Type C Type D Overall
Number of promoters 9,269 244 357 385 10,255
CGI 7,887 (85.09) [2.74 3 10�41] 74 (30.33) [4.87 3 10�5] 86 (24.09) [9.58 3 10�2] 8 ( 2.08) [8.82 3 10�2] 8,055 (78.55) [6.26 3 10�59]
No CGI 1,382 (14.91) [1] 170 (69.67) [1] 271 (75.91) [1] 377 (97.92) [1] 2,200 (21.45) [1]
TATA 791 ( 8.53) [1.63 3 10�3] 45 (18.44) [1.43 3 10�1] 106 (29.69) [1] 101 (26.23) [1] 1,043 (10.17) [2.02 3 10�1]
TATA-less 8,478 (91.47) [1] 199 (81.56) [1] 251 (70.31) [1] 284 (73.77) [1] 9,212 (89.83) [1]
CGI þ TATA 574 ( 6.19) [7.00 3 10�8] 16 ( 6.56) [7.01 3 10�3] 22 ( 6.16) [2.99 3 10�2] 0 ( 0.00) [1] 612 ( 5.97) [1.05 3 10�10]
CGI þ TATA-less 7,313 (78.90) [2.62 3 10�20] 58 (23.77) [7.80 3 10�3] 64 (17.93) [1] 8 ( 2.08) [5.64 3 10�2] 7,443 (72.58) [4.31 3 10�34]
No CGI þ TATA 217 ( 2.34) [1] 29 (11.89) [1] 84 (23.53) [1] 101 (26.23) [1] 431 ( 4.20) [1]
No CGI þ TATA-less 1,165 (12.57) [1] 141 (57.79) [1] 187 (52.38) [1] 276 (71.69) [1] 1,769 (17.25) [1]
We present for each category (CGI, no CGI, etc.) the number of cases for each TSS type, the percent (in parentheses) of the total population in that TSS type, and the Bonferroni correctedp-value (in brackets) calculated from a right-sided Fisher’s exact test based on the hypergeometric distribution.DOI: 10.1371/journal.pgen.0020054.t004
PLoS Genetics | www.plosgenetics.org April 2006 | Volume 2 | Issue 4 | e540622
Promoter Properties
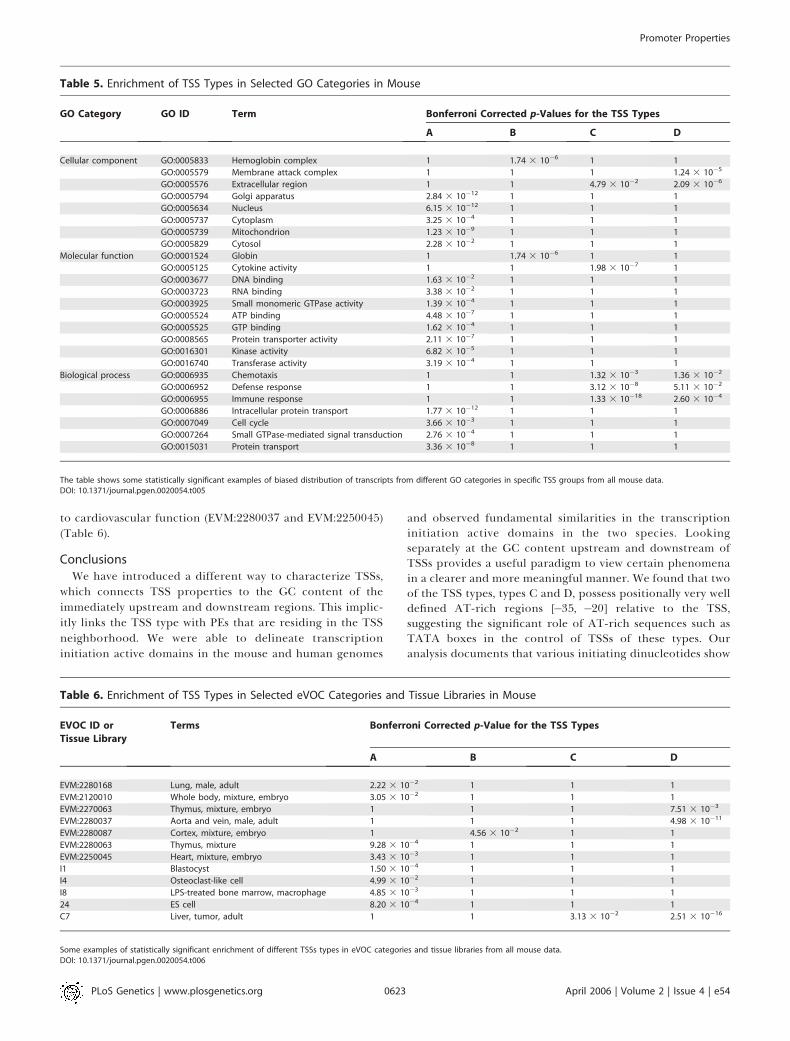
to cardiovascular function (EVM:2280037 and EVM:2250045)(Table 6).
ConclusionsWe have introduced a different way to characterize TSSs,
which connects TSS properties to the GC content of theimmediately upstream and downstream regions. This implic-itly links the TSS type with PEs that are residing in the TSSneighborhood. We were able to delineate transcriptioninitiation active domains in the mouse and human genomes
and observed fundamental similarities in the transcriptioninitiation active domains in the two species. Lookingseparately at the GC content upstream and downstream ofTSSs provides a useful paradigm to view certain phenomenain a clearer and more meaningful manner. We found that twoof the TSS types, types C and D, possess positionally very welldefined AT-rich regions [�35, �20] relative to the TSS,suggesting the significant role of AT-rich sequences such asTATA boxes in the control of TSSs of these types. Ouranalysis documents that various initiating dinucleotides show
Table 6. Enrichment of TSS Types in Selected eVOC Categories and Tissue Libraries in Mouse
EVOC ID or
Tissue Library
Terms Bonferroni Corrected p-Value for the TSS Types
A B C D
EVM:2280168 Lung, male, adult 2.22 3 10�2 1 1 1
EVM:2120010 Whole body, mixture, embryo 3.05 3 10�2 1 1 1
EVM:2270063 Thymus, mixture, embryo 1 1 1 7.51 3 10�3
EVM:2280037 Aorta and vein, male, adult 1 1 1 4.98 3 10�11
EVM:2280087 Cortex, mixture, embryo 1 4.56 3 10�2 1 1
EVM:2280063 Thymus, mixture 9.28 3 10�4 1 1 1
EVM:2250045 Heart, mixture, embryo 3.43 3 10�3 1 1 1
I1 Blastocyst 1.50 3 10�4 1 1 1
I4 Osteoclast-like cell 4.99 3 10�2 1 1 1
I8 LPS-treated bone marrow, macrophage 4.85 3 10�3 1 1 1
24 ES cell 8.20 3 10�4 1 1 1
C7 Liver, tumor, adult 1 1 3.13 3 10�2 2.51 3 10�16
Some examples of statistically significant enrichment of different TSSs types in eVOC categories and tissue libraries from all mouse data.DOI: 10.1371/journal.pgen.0020054.t006
Table 5. Enrichment of TSS Types in Selected GO Categories in Mouse
GO Category GO ID Term Bonferroni Corrected p-Values for the TSS Types
A B C D
Cellular component GO:0005833 Hemoglobin complex 1 1.74 3 10�6 1 1
GO:0005579 Membrane attack complex 1 1 1 1.24 3 10�5
GO:0005576 Extracellular region 1 1 4.79 3 10�2 2.09 3 10�6
GO:0005794 Golgi apparatus 2.84 3 10�12 1 1 1
GO:0005634 Nucleus 6.15 3 10�12 1 1 1
GO:0005737 Cytoplasm 3.25 3 10�4 1 1 1
GO:0005739 Mitochondrion 1.23 3 10�9 1 1 1
GO:0005829 Cytosol 2.28 3 10�2 1 1 1
Molecular function GO:0001524 Globin 1 1.74 3 10�6 1 1
GO:0005125 Cytokine activity 1 1 1.98 3 10�7 1
GO:0003677 DNA binding 1.63 3 10�2 1 1 1
GO:0003723 RNA binding 3.38 3 10�2 1 1 1
GO:0003925 Small monomeric GTPase activity 1.39 3 10�4 1 1 1
GO:0005524 ATP binding 4.48 3 10�7 1 1 1
GO:0005525 GTP binding 1.62 3 10�4 1 1 1
GO:0008565 Protein transporter activity 2.11 3 10�7 1 1 1
GO:0016301 Kinase activity 6.82 3 10�5 1 1 1
GO:0016740 Transferase activity 3.19 3 10�4 1 1 1
Biological process GO:0006935 Chemotaxis 1 1 1.32 3 10�3 1.36 3 10�2
GO:0006952 Defense response 1 1 3.12 3 10�8 5.11 3 10�2
GO:0006955 Immune response 1 1 1.33 3 10�18 2.60 3 10�4
GO:0006886 Intracellular protein transport 1.77 3 10�12 1 1 1
GO:0007049 Cell cycle 3.66 3 10�3 1 1 1
GO:0007264 Small GTPase-mediated signal transduction 2.76 3 10�4 1 1 1
GO:0015031 Protein transport 3.36 3 10�8 1 1 1
The table shows some statistically significant examples of biased distribution of transcripts from different GO categories in specific TSS groups from all mouse data.DOI: 10.1371/journal.pgen.0020054.t005
PLoS Genetics | www.plosgenetics.org April 2006 | Volume 2 | Issue 4 | e540623
Promoter Properties

very specific preferences for the TSS types we considered, arepresent in statistically significant proportions of the TSSs inour datasets, and are almost all different from the consensusdinucleotide. Very specific sets of initiating dinucleotides areassociated with different TSS types, and surrounding GCcontent is well correlated with the types of these dinucleo-tides. This suggests the potential presence of different Inrelements that may be characteristic for each of the TSS typesand associated with different nucleotide characteristics of thesurrounding domain.
We have shown that different TSS types associate withdifferent PEs, that regions upstream and downstream ofdifferent TSS types are characterized by different collectionsof PEs, and that the putative PE content (for the top 10% ofPEs) of the TSS surroundings generally differs for the TSStypes. All these findings suggest likely control of therespective transcripts by different collections of significantPEs residing upstream or downstream of the TSS. Our resultson TSS properties relative to CGIs, TATA boxes, and Inrelements in mouse and human suggest species-specificadaptation. Finally, we have shown a number of examplesof transcript groups obtained on the basis of differentontologies or tissue libraries that have statistically significantenrichment in at least one of the TSS types. This has provideda link between TSS characteristics and expression data.
We believe that the results of this analysis will help in betterunderstanding the general transcription regulation proper-ties of mammalian promoters, and prove useful for furtherdevelopment and enhancement of promoter and geneprediction tools.
Materials and Methods
TSSs. We constructed two highly accurate sets (one for mouse andone for human) of TSSs and of the promoter sequences covering thespan [�100,þ100] relative to these TSSs. These datasets are available athttp://www.sanbi.ac.za and were obtained as follows. If the first 59nucleotide of the CAGE tag or 59 ditag (http://fantom31p.gsc.riken.jp/cage_analysis/export) coincided with the first 59 nucleotide of thefull-length cDNA (http://fantom.gsc.riken.go.jp/download.html), theTSS determined by this tag was selected. Also, in cases when thiscondition did not hold, we selected TSSs based on the followingrequirements: the TSS is a representative TSS location from a tagcluster that has at least ten tags, the representative TSS is supported byat least six tags, and there is at least one other piece of transcriptionalevidence associated with this tag cluster (expressed sequence tag, full-length cDNA, or long SAGE; http://fantom.gsc.riken.go.jp/download.html). In this way, we compiled a mouse reference promoter set of39,156 promoters and a human reference promoter set of 10,255promoters. These two sets are used for all our analyses.
Randomly selected DNA sequences from mouse were used as thebackground set for analysis of TF binding sites in mouse promoters.These DNA sequences were 200 bp long and selected randomly fromall mouse chromosomes, with the number of sequences from eachchromosome proportional to the length of the chromosome. In totalwe selected 41,000 such random DNA sequences (Dataset S1).
TSS types. We determined the GC content of the [�100,�1] regionand the [þ1,þ100] region relative to TSS location for each individualTSS. The TSS is considered to be between positions �1 and þ1. Theupstream or downstream segment was defined as GC-rich if GþC .50% in the region. Otherwise, the region was defined as AT-rich.Four types of TSSs were defined based on the GC richness in theupstream and downstream segments as follows (Table 1): type A, GC-rich upstream and downstream (GC-GC); type B, GC-rich upstreamand AT-rich downstream (GC-AT); type C, AT-rich upstream and GC-rich downstream (AT-GC); and type D, AT-rich upstream anddownstream (AT-AT). Each TSS can be represented as a point inthe x–y plane, where x corresponds to the GC content upstream and ycorresponds to the GC content downstream of the considered TSS.For mouse and human these distributions are depicted in Figure 1A.
TF binding sites in promoters. We used all available matrix modelsof TFBSs contained in the TRANSFAC Professional (version 8.4)database [31] and mapped them to the extracted sequences. We usedminSUM profiles for the threshold of the matrix models since thesecontain the optimized threshold values for the core and matrix scores[32]. The thresholds in minSUM are based on optimization thatprovides the minimum sum of false positive and false negative TFBSpredictions. To determine the overrepresentation of TFBSs found inthe target set, we used the method of Bajic et al. [15]. All TFBSsmapped to target promoters were ranked based on their ORI asdefined by Bajic et al. [15]. For ORI¼ 1 or close to this value, there isno overrepresentation of the motif in the target promoter group. Wealso estimated the likelihood of observing these TFBSs in the targetset using the background random promoter set as a reference. Thenull hypothesis was that the proportion of sequences in the target setin which a particular PE was found was the same as that in thebackground set. The p-values were calculated using right-sidedFisher’s exact tests based on hypergeometric distribution. Theoriginal p-values were subjected to Bonferroni correction for multi-plicity testing. If the corrected p-value of the pattern was not greaterthan 0.05, we placed a plus sign after the ORI value in the providedtabular reports.
Most significant PEs. For each of the TSS types in mouse, weanalyzed the 150 top-ranked PEs (based on the values of ORI). Thisrepresents about 10%of all (1,428) PEs analyzed.We also required thatthe PEs have an ORI of at least 1.5 and that the PE be found in at least10% of the target sequences. Details are explained in Tables S1–S3.
TATA boxes. The TATA box model used was based on that ofBucher [22]. The threshold used was 0.75, while score was normalizedbetween zero and one (analogous to Bajic et al. [33]). A TATA box wasconsidered detected if the maximum value of the score in the [�50,�1] region was higher than the threshold. Only one TATA box wasassumed in the [�50, �1] region.
Figure 6. Distribution of TSSs for Transcripts Related to Immune
Response through GO:0006955
There are 1.58-, 4.85-, and 3.35-fold more transcripts having TSS types B,C, and D than one would expect based on the proportion of transcriptsin these groups in our reference mouse data. Enrichment is statisticallysignificant for types C and D based on Bonferroni corrected p-valuesobtained by the right-sided Fisher’s exact test (Table 5).DOI: 10.1371/journal.pgen.0020054.g006
PLoS Genetics | www.plosgenetics.org April 2006 | Volume 2 | Issue 4 | e540624
Promoter Properties

eVOC, GO, and tissue expression libraries. In order to assess thebiological significance of our TSS classification system, we assignedTSSs according to different GO and eVOC categories, as well as tissuelibraries in FANTOM3 collection (http://fantom.gsc.riken.go.jp/download.html). GO–FANTOM mapping data was downloaded fromthe RIKEN Web site (ftp://fantom.gsc.riken.jp/FANTOM3/annotation/fantomdb-3.0/anndata.txt.gz). The eVOC system consists of a set oforthogonal controlled vocabularies that unify gene expression databy mapping between the genome sequence and expression phenotypeinformation. The eVOC human anatomy ontology [13] and the newlydeveloped mouse adult and developmental ontologies (http://www.evocontology.org) have been mapped to the FANTOM3 librarydescriptions, providing a hierarchical representation of tissues, celltypes, and developmental stage information. This allows for astandardized analysis of gene expression and promoter profilesindependent of the original annotation vocabulary used in theoriginal dataset.
For the generation of the results presented in Table S4, we usedortholog gene groups between mouse and human as defined at ftp://ftp.ncbi.nih.gov/pub/HomoloGene. Table S5 for mouse data containsstatistics of all GO and tissue expression libraries from FANTOM3,complemented by the Bonferroni corrected p-value (right-sidedFisher’s exact test based on hypergeometric distribution) for the nullhypothesis that the proportion of TSSs of a specific type in theconsidered GO/tissue library is the same as what one can expect basedon the distribution of these TSSs in mouse.
Supporting Information
Dataset S1. Supplementary Nonpromoter Data
Found at DOI: 10.1371/journal.pgen.0020054.sd001 (2.5 MB ZIP).
Figure S1. Number of TSSs of the Four Types in Human and MouseGenomes under the Change of Parameters
Blue, green, red, and light blue correspond to TSSs of type A, B, C,and D, respectively. From graphs in the first row we observe thatwhen the length of the region considered changes, the numbers ofTSSs of the different types remain almost unchanged. We changedthe length of upstream and downstream regions from [�x,�1] and [þ1,þx], respectively, with values of x from 50 to 150. From graphs in thesecond row we observe that the numbers of TSSs within the fourtypes gradually change with the change of threshold for GC content.We changed this threshold from 40% to 60%.
Found at DOI: 10.1371/journal.pgen.0020054.sg001 (24 KB PDF).
Figure S2. Distributions of TFs Found to Be Common among the Top150 PEs in Comparisons of Different TSS Types
(A) Comparison of types A and B upstream regions.(B) Comparison of types B and D downstream regions.(C) Comparison of types A and C downstream regions.(D) Comparison of types C and D upstream regions.
Found at DOI: 10.1371/journal.pgen.0020054.sg002 (40 KB PDF).
Table S1. List of Top 150 PEs That Appear with a Frequency of 10%or Greater in Upstream and Downstream Regions of Different TSSCategories
Comparison is carried out against a background of random mousesequences. Ranking is based on ORI value. The higher the ORI, thehigher the rank. We present results for the four TSS types (A, B, C,and D). For each PE we give the strand where it is found (þ1 or �1),name of TFBS, ORI value, percentage of promoters in the target setthat contain the PE, percentage of sequences in the background setthat contain the PE, probability of finding the PE in the target set(given as one prediction per nucleotide), probability of finding the PEin the background set (given as one prediction per nucleotide), andBonferroni corrected p-value. A plus sign added after the ORI valueindicates that the PE is enriched in a statistically significant mannerat the level 0.05. Almost all top-ranked elements appear to bestatistically significantly enriched in the target sets.
Found at DOI: 10.1371/journal.pgen.0020054.st001 (329 KB PDF).
Table S2. Common and Specific TFBSs in the Four TSS Types
PEs are compared relative to the same GC richness and same location(upstream or downstream) in different TSS types. The signs plus orminus indicate whether the PE was found to be significantly enrichedin the considered region for the considered TSS type. For example,the first column (yellow), which shows comparison between the AT-rich downstream domains in TSS types B and D, contains a commonelement denoted as ‘‘þ � Ets.’’ This means that Ets was foundsignificantly enriched for the B type, but its enrichment was notsignificant for D type. When an element is unique for one or anothergroup, then it is associated only with one plus or minus sign.
Found at DOI: 10.1371/journal.pgen.0020054.st002 (53 KB PDF).
Table S3. List of Significant PEs Unique and Common for DifferentTSS Types in the Upstream and Downstream Segments
The yellow highlighted TFs are unique for the considered groupswhen compared with the same upstream or downstream segment ofanother TSS type with the same GC richness.
Found at DOI: 10.1371/journal.pgen.0020054.st003 (47 KB PDF).
Table S4. GO Categories That Preserve Enrichment in Specific TSSTypes between Human and Mouse
We considered only those TSSs whose generated transcripts belong tothe same homology group as defined on the NCBI Web site (ftp://ftp.ncbi.nih.gov/pub/HomoloGene). We only considered GO categoriesthat were supported by at least 60 TSSs and where the target TSS typewas supported by at least three TSSs.
Found at DOI: 10.1371/journal.pgen.0020054.st004 (96 KB PDF).
Table S5. All GO and Tissue-Specific Libraries with Distribution ofTSSs across the Four TSS Types in Mouse
The table presents the total number of TSSs associated with thecategory (GO or expression library), the number of TSSs of individualTSS type, the percentage of TSSs in that TSS type, enrichment ofTSSs in the TSS type relative to what can be expected based on thedistribution of all TSSs in mouse across all four TSS types, andBonferroni corrected p-values calculated based on right-sided Fish-er’s exact tests for the null hypothesis that the proportion of TSS typefound in the target group is the same as that of the general mousedistribution. For example, there are 253 transcripts associated withGO:0006955. Of these, 52 transcripts have a TSS of type C. For thenumber of transcripts in this GO category, one would expect only 11transcripts with TSSs of type C. Thus, in this GO category, we have4.85-fold enrichment of transcripts of this type (compared to what wewould expect based on the distribution of all transcripts across thefour TSS types). If in any of the GO/eVOC categories or tissuelibraries, at least one of the TSS groups of transcripts has enrichmentthat is 1.5-fold or greater than the expected value, we consider suchTSS type overrepresented.
Found at DOI: 10.1371/journal.pgen.0020054.st005 (2.9 MB PDF).
Acknowledgments
Author contributions. VBB, JK, PC, and YH conceived anddesigned the experiments. VBB, SLT, and CK performed theexperiments. VBB, SLT, AC, CS, LL, and OH analyzed the data.VBB, SLT, LY, OH, AK, WH, CK, JK, PC, and YH contributedreagents/materials/analysis tools. VBB, AC, CS, OH, and DAH wrotethe paper.
Funding. This study was supported by a research grant for theRIKEN Genome Exploration Research Project from the Ministry ofEducation, Culture, Sports, Science and Technology of Japan to YH, agrant of the Genome Network Project from the Ministry ofEducation, Culture, Sports, Science and Technology of Japan toYH., and a grant for the Strategic Programs for R&D of RIKEN to YH.
Competing interests. The authors have declared that no competinginterests exist. &
References
1. Suzuki Y, Yamashita R, Sugano S, Nakai K (2004) DBTSS, Database of
transcriptional start sites: Progress report 2004. Nucleic Acids Res 32: D78–
D81.
2. Suzuki Y, Yamashita R, Shirota M, Sakakibara Y, Chiba J, et al. (2004) Large-
scale collection and characterization of promoters of human and mousegenes. In Silico Biol 4: 0036.
3. Aerts S, Thijs G, Dabrowski M, Moreau Y, De Moor B (2004) Comprehensiveanalysis of the base composition around the transcription start site inmetazoan. BMC Genomics 5: 34.
4. Imanishi T, Itoh T, Suzuki Y, O’Donovan C, Fukuchi S, et al. (2004)
PLoS Genetics | www.plosgenetics.org April 2006 | Volume 2 | Issue 4 | e540625
Promoter Properties

Integrative annotation of 21,037 human genes validated by full-lengthcDNA clones. PLoS Biol 2: e162. DOI: 10.1371/journal.pbio.0020162
5. Carninci P, Kasukawa T, Katayama S, Gough J, Frith MC, et al. (2005) Thetranscriptional landscape of the mammalian genome. Science 309: 1559–1563.
6. Vinogradov AE (2005) Noncoding DNA, isochores and gene expression:Nucleosome formation potential. Nucleic Acids Res 33: 559–563.
7. Vinogradov AE (2003) Isochores and tissue-specificity. Nucleic Acids Res31: 5212–5220.
8. Vinogradov AE (2003) DNA helix: The importance of being GC-rich.Nucleic Acids Res 31: 1838–1844.
9. Levitsky VG, Podkolodnaya OA, Kolchanov NA, Podkolodny NL (2001)Nucleosome formation potential of eukaryotic DNA: Calculation andpromoters analysis. Bioinformatics 17: 998–1010.
10. Shiraki T, Kondo S, Katayama S, Waki K, Kasukawa T, et al. (2003) Capanalysis gene expression for high-throughput analysis of transcriptionalstarting point and identification of promoter usage. Proc Natl Acad Sci U SA 100: 15776–15781.
11. Ng P, Wei CL, Sung WK, Chiu KP, Lipovich L, et al. (2005) Geneidentification signature (GIS) analysis for transcriptome characterizationand genome annotation. Nat Methods 2: 105–111.
12. Ashburner M, Ball CA, Blake JA, Botstein D, Butler H, et al. (2000) GeneOntology: Tool for the unification of biology. The Gene OntologyConsortium. Nat Genet 25: 25–29.
13. Kelso J, Visagie J, Theiler G, Christoffels A, Bardien S, et al. (2003) eVOC: Acontrolled vocabulary for unifying gene expression data. Genome Res 13:1222–1230.
14. Kel-Margoulis OV, Tchekmenev D, Kel AE, Goessling E, Hornischer K, et al.(2003) Composition-sensitive analysis of the human genome for regulatorysignals. In Silico Biol 3: 0013.
15. Bajic VB, Choudhary V, Hock CK (2004) Content analysis of the corepromoter region of human genes. In Silico Biol 4: 109–125.
16. Kadonaga JT (2004) Regulation of RNA polymerase II transcription bysequence-specific DNA binding factors. Cell 116: 247–257.
17. Kim TH, Barrera LO, Zheng M, Qu C, Singer MA, et al. (2005) A high-resolution map of active promoters in the human genome. Nature 436:876–880.
18. Mueller CR, Maire P, Schibler U (1990) DBP, a liver-enriched transcrip-tional activator, is expressed late in ontogeny and its tissue specificity isdetermined posttranscriptionally. Cell 61: 279–291.
19. Shimizu H, Kang M, Iitsuka Y, Ichinose M, Tokuhisa T, et al. (2000)Identification of an optimal Ncx binding sequence required for transcrip-tional activation. FEBS Lett 475: 170–174.
20. Shirasawa S, Yunker AM, Roth KA, Brown GA, Horning S, et al. (1997) Enx(Hox11L1)-deficient mice develop myenteric neuronal hyperplasia andmegacolon. Nat Med 3: 646–650.
21. Hatano M, Aoki T, Dezawa M, Yusa S, Iitsuka Y, et al. (1997) A novelpathogenesis of megacolon in Ncx/Hox11L.1 deficient mice. J Clin Invest100: 795–801.
22. Bucher P (1990) Weight matrix descriptions of four eukaryotic RNApolymerase II promoter elements derived from 502 unrelated promotersequences. J Mol Biol 212: 563–578.
23. Burke TW, Kadonaga JT (1996) Drosophila TFIID binds to a conserveddownstream basal promoter element that is present in many TATA-box-deficient promoters. Genes Dev 10: 711–724.
24. Burke TW, Kadonaga JT (1997) The downstream core promoter element,DPE, is conserved from Drosophila to humans and is recognized by TAFII 60of Drosophila. Genes Dev 11: 3020–3031.
25. Kutach AK, Kadonaga JT (2000) The downstream promoter element DPEappears to be as widely used as the TATA box in Drosophila core promoters.Mol Cell Biol 20: 4754–4764.
26. Willy PJ, Kobayashi R, Kadonaga JT (2000) A basal transcription factor thatactivates or represses transcription. Science 290: 982–984.
27. Lagrange T, Kapanidis AN, Tang H, Reinberg D, Ebright RH (1998) Newcore promoter element in RNA polymerase II-dependent transcription:Sequence-specific DNA binding by transcription factor IIB. Genes Dev 12:34–44.
28. Lim CY, Santoso B, Boulay T, Dong E, Ohler U, et al. (2004) The MTE, a newcore promoter element for transcription by RNA polymerase II. Genes Dev18: 1606–1617.
29. Lewis BA, Kim TK, Orkin SH (2000) A downstream element in the humanbeta-globin promoter: Evidence of extended sequence-specific transcrip-tion factor IID contacts. Proc Natl Acad Sci U S A 97: 7172–7177.
30. Lee DH, Gershenzon N, Gupta M, Ioshikhes IP, Reinberg D, et al. (2005)Functional characterization of core promoter elements: The downstreamcore element is recognized by TAF1. Mol Cell Biol 25: 9674–9686.
31. Matys V, Fricke E, Geffers R, Gossling E, Haubrock M, et al. (2003)TRANSFAC: Transcriptional regulation, from patterns to profiles. NucleicAcids Res 31: 374–378.
32. Kel AE, Gossling E, Reuter I, Cheremushkin E, Kel-Margoulis OV, et al.(2003) MATCH: A tool for searching transcription factor binding sites inDNA sequences. Nucleic Acids Res 31: 3576–3579.
33. Bajic VB, Seah SH, Chong A, Krishnan SP, Koh JL, et al. (2003) Computermodel for recognition of functional transcription start sites in RNApolymerase II promoters of vertebrates. J Mol Graph Model 21: 323–332.
PLoS Genetics | www.plosgenetics.org April 2006 | Volume 2 | Issue 4 | e540626
Promoter Properties


![Transgenesis for pig models - KoreaMed · PDF filepromoters from mice or human, transgenic pig models were generated [24]. Subsequently, a specific tissue promoter for transgenic pigs](https://img.pdfslide.net/doc/110x75/5aa7bd047f8b9aee748c76f1/transgenesis-for-pig-models-koreamed-from-mice-or-human-transgenic-pig-models.jpg)

![D-site of albumin promoter binding protein (DBP) may ... · hematopoiesis (7days in mice and 21days in human)] reflect the involvement of circadian and/or metabolic regulatory mechanisms](https://img.pdfslide.net/doc/110x75/5f5f81faf676fc2bed2d35ca/d-site-of-albumin-promoter-binding-protein-dbp-may-hematopoiesis-7days-in.jpg)