Embed Size (px)
Citation preview
Setting quantitative targets in regional public health systems. Insights from Valencia and Tuscany
Regions.
Milena Vainieri*, Barbara Bini*, Gregorio Gomez Soriano** and Sabina Nuti*
* Laboratory of Management and Healthcare, Institute of Management, Scuola Superiore Sant’Anna, Pisa (Italy)
** Agencia Valenciana de Salud, Spain.
Abstract
Often inspired by NPM, scholars and organizations (Arah et al. 2006, Smith 2002, Hurst & Hughes 2001)
have advocated the introduction of performance measurement systems (PMS) in health care sector. Target
setting and evaluation are two phases of global performance management systems, but in the literature
few papers focus on how targets should be set and evaluated to be challenging. Starting from the principles
of the goal setting theory (Locke & Latham 1990) and benchmarking technique in health care, this paper
proposes an operational framework to assist policymakers and managers operating in a multiple actor
healthcare system, in both setting target and conducting a fair evaluation. The authors base the operational
framework for setting targets and their evaluation on the experience they conducted in Valencia and
Tuscany Regions. Information related to methods applied in Tuscany and Valencia were gathered both
from authors’ expertise and from the analyses of policy documents, public reports, official websites and
from the discussions with regional actors. Although Valencia and Tuscany Regions adopted different models
of governance (Valencia more oriented to competition while Tuscany more oriented to cooperation),
different level of application (Valencia assesses all professionals while Tuscany only health authorities Ceos)
and sometimes different processes (e.g. in the communication process), both of them seem to apply very
similar techniques to motivate employees during the goal setting and evaluating phases. In particular in
both the experiences, the prerequisites to set challenging targets are the selection of appropriate
indicators/goals and their comparison in benchmark. Therefore, the operational framework proposed
seems to be useful and adaptable to different contexts. Indeed, the method proposed for regional
administrations can be applied also at micro level. However it is necessary to have units that can be
compared and performance measurement system already in use. Further studies are needed to better
understand whether different application led to different results.
Keywords: Incentives, targets, health care sector, benchmarking
1. Background.
Often inspired by NPM, scholars and organizations (Arah et al. 2003; Smith 2002; Hurst & Jee-hughes 2001)
have advocated the introduction of performance measurement systems (PMS) in health care sector. Hence
explicit standards, measure of performance, emphasis on output control and private sector styles of
management practice have become a common refrain in public organizations. Target setting and evaluation
are two phases of global performance management systems, but literature in the health care sector has
mostly focused on one hand on papers providing conceptual frameworks (Arah et al. 2003, Veillard et al.
2005), case studies (Ballantine et al. 1998; Pink et al. 2001) discussing the process of application of PMS
(Abernethy & Brownell 1999; Nuti et al. 2012; van den Berg et al. 2014) and, on the other hand, on financial
incentives systems (see for instance (Appleby et al. 2012; Christianson et al. 2007)) and reward systems
(see for instance (Custers et al. 2008)) from institutional to individual level. There is an ongoing debate on
the results achieved through the incentive mechanisms ((Van Herck et al. 2010; Christianson et al. 2007;
Scott et al. 2011)) and in particular on how to set quantitative targets (Judge et al. 2005). To this extent,
some authors have tried to provide insights to policy makers and managers in designing incentive systems
in the healthcare sector. For instance, Glasziou and colleagues (Glasziou et al. 2012) drew down a check list
of 10 items like a sort of an ex-ante evaluation of the effectiveness of their system; other authors (Custers
et al. 2008) proposed a decisional framework in order to help decision makers to choose the appropriate
type of incentive (whether financial, such as bonus, or non-financial, such as training activities) in relation
with the values and goals of the health care system and the contextual factors that can influence the
effectiveness. Finally others (Van Herck et al. 2010) suggested six steps to be followed in designing pay for
performance (P4P) schemes: “(1) select and define P4P targets on the basis of baseline room for
improvement, (2) make use of process and (intermediary) outcome indicators as target measures, (3)
involve stakeholders and communicate information about the programs thoroughly and directly (4)
implement a uniform P4P design across payers, (5) focus on both quality improvement and achievement,
and (6) distribute incentives to the individual and/or team level”. Moreover both external variables (such as
uncertainty) and internal variables (such as employees’ motivation) may affect performance results, thus
policy makers have to consider both of them in setting appropriate targets but also in assessing results
obtained. To deal with the uncertainty and to set appropriate goals and fair evaluations, it’s necessary to
know the characteristics and the performance of the targeted organizations. To this aim, the benchmarking
techniques (Northcott & Llewellyn 2003) are more and more used to provide useful information to policy
makers. Furthermore the way in which the evaluation of the results is performed also affects the
willingness to commit to new challenges, which is a moderator of the relationship between goal setting and
performance results. Therefore, the objective of the study is to propose an operational framework to assist
policymakers and managers operating in a multiple actor healthcare system, in both setting target and
conducting a fair evaluation, starting from the principles of the goal setting theory and benchmarking
techniques that have been already applied with success by Valencia (Spain) and Tuscany (Italy) Regions. The
authors had an important and documented role in designing implementing the Performance Evaluation
Systems in Valencia (Gòmez 2008; Gòmez & Carrillo 2009; Gòmez 2011) and Tuscany (Nuti 2008; Nuti et al.
2012; Nuti et al. 2009) in collaboration with regional policy makers, managers and professionals. Therefore,
the information on the methods implemented in the two Regions are gathered both from the direct
authors’ experience, expertise and discussions with regional actors and from the analyses of regional policy
documents, public reports and official websites.
The paper is structured as follows: 1. A brief snapshot of the principles of the goal setting theory and
benchmarking technique, 2. The conceptual and technical framework to assist policymakers and managers
operating in a multiple actor systems, in both setting challenging target and assessing results; 3. The case
studies of Valencia in Spain and Tuscany in Italy and 4. The discussion.
1. A brief snapshot of the principles of the goal setting theory and benchmarking techniques
Goal setting theory is one of the mainstream motivational theories. The basic assumption of this inductive
theory developed by Locke and Latham at the end of 80s is that goals have pervasive influence on
employee behaviour and organizational performance. The major finding of the goal setting theory is that
individuals who are provided with specific, difficult but attainable goals perform better than those given
easy, nonspecific, or no goals at all (Lunenburg 2011).
In their last book on goal setting theory Locke and Latham (Locke & Latham 2013b) summed up the
characteristics of goals and factors which affect performance identifying directions for future research.
Goals should have two main attributes: content and intensity. The first one refers to the concept of what
has been sought and its specificity, while the second one refers to the effort needed to attain the goal.
Indeed if specific and challenging goals significantly increase performance the open question is “how
challenging is challenging?”. In laboratory experiments (largely applied in this field of studies) difficult goals
are usually set at the 90th percentile while in field experiments they are often set on the basis of the
perceived judgement of “difficult yet attainable” goal (Locke & Latham 2013a).
The achievement of the goal is moderated and mediated by other variables (Locke & Latham 1990). Some
of these variables refer to the psychological or individual sphere, such as the ability (people should know
and have the skill to obtain that performance) and the self-efficacy (the believed capacity to perform
certain level of task); other factors relate to the organizational or group sphere, such as the commitment by
supervisors and peers and the feedback. Feedback plays an important role because it provides information
to employees regarding their work (Flamholtz et al. 1985; Ouchi 1979; Murante et al. 2014), thus making
understandable if corrective or adaptive actions are needed (Ferreira & Otley 2009; Ouchi 1979; Ashford &
De Stobbeleir 2013), and in addition it also stimulates performers to set goals for themselves which acts as
a mediator of performance (Ashford & De Stobbeleir 2013). Finally there are other variables moderating
performance which refer to the characteristics of the goal content; the most important is the task
complexity. Indeed, for complex task, high specific goals can lead to tunnel vision so that in these cases do-
best goals could be preferred. Potentially research is needed for detecting single or jointly effects of
mediator and moderator variables on goal setting and performance. Moreover, there are unexplored issues
related to the organizational level, because most of the studies using goal setting theory is at individual
level or at least group level (Locke & Latham 2013b). Young & Smith (Young & Smith 2013) found that goal
setting theory at the macro-level is more related on operational content rather than on operational goals,
which are not measurable and that generally concern the communication of organizational values and
strategies. In reviewing studies at the macro level, these authors focused their attention on seven factors
that considered relevant for this level: 1. Multiple goals; 2. Time horizon; 3.Goal commitment; 4. Goal
conflict; 5. Strategy; 6. Environmental uncertainty and 7. Situationally specific goal context. They found
that, because of multiple goals, top managers have to carefully coordinate them in terms of time span,
priorities and proper communication (feedback) to reduce conflict and control uncertainty. In this
perspective it is useful taking inspiration (learning) by organizations of the same marketplace, thus
recurring to comparison of performance. To this extent, more and more governments applied
benchmarking techniques, which spread out rapidly in the public sector since 90s (Kouzmin et al. 1999), in
order to improve performance by learning from best practice experiences and institutions, both from the
same arena or across the boundaries for comparing processes. Trosa & Williams (Trosa & Williams 1996)
proposed a framework to describe the Oecd countries experiences with the benchmarking grouping
techniques into results and process benchmarking, as cited also in next studies (such as (Helgason 1997;
Bhutta & Huq 1999)). Results (or performance) benchmarking concerns mainly with the comparison of
data, highlighting gaps between institutions, whilst process benchmarking considers also how results have
been achieved, providing information on how gaps can be closed by activating learning from others’
practices. In this sense, results and process benchmarking are complementary. Furthermore, results
benchmarking is not only necessary to allow continuous improvement and re-organization (McNair &
Leibfried 1992; Trosa & Williams 1996; Bhutta & Huq 1999) but it can be used also for monitoring
performance and programme evaluation purposes (Helgason 1997). In particular the recourse to
benchmarking for evaluation purpose helps avoiding distortions caused by uncontrollable factors (Hansen
et al. 2003) and it appears to provide a greater degree of legitimacy for targets (Northcott & Llewellyn
2003).
In the healthcare sector the acknowledged importance of the use of benchmarking and the necessity to
consider multiple indicators has led to lots of studies adopting parametrical and non-parametrical
techniques to measure the global performance of health care systems, hospitals, primary care and other
specific services (Jacobs, Smith, et al. 2006; Hollingsworth 2003; Worthington 2004; OECD 2010).
However in order to make benchmarking effective for improving performance it is critical the selection
phase of the indicators and the choice of peer benchmarks (Trosa & Williams 1996; McNair & Leibfried
1992; Helgason 1997). Indeed the method to measure and compare performance should be rigorous and
clear in order to appear reliable for people assessed and to support the overall credibility of the
performance evaluation process.
With these premises, this paper aims to propose a quantitative method that will help to answer to the open
question “how challenging is challenging?” providing the setting targets and the performance evaluation
phases with a clear (hence more credible) process. The basic ingredient of this method already applied in
two European Regions, is benchmarking. Indeed the benchmarking technique represents a powerful tool
for Regional Health Systems which are characterized by multiplayers providing similar services and pursuing
the same mission and vision. Its potentiality are still underused by regional policy makers and managers in
setting targets and assessing performance. As previously mentioned the authors believed that
benchmarking can enable regional health managers to define how challenging is challenging, overcoming
some of the problems listed by Young & Smith (Young & Smith 2013) for the macro level.
Moreover, if set challenging targets and conducting fair evaluation leads to better performance than vague
definition, then this process, which is based on reducing the distance between best and worst performers,
will help Regions also to cope with the unwarranted variation. Hence, the proposed method can help
Regions to guarantee high-quality services (defined by the targets chosen), but also equity by reducing
unwarranted variations.
2. The technical framework for setting targets and assessing performance
The setting targets and performance evaluation are only two phases of the broader frameworks of
performance management, such as the high performance cycle of Locke and Latham (Locke & Latham
1990) or those described by management control scholars (see for instance (Ferreira & Otley 2009;
Flamholtz et al. 1985)). In general to obtain the expected results, institutions should set targets which are
coherent with their mission and vision, selecting the right key performance indicators, and then activating
operational mechanisms, such as feedback and reward system, to reinforce the message.
Although all phases deem attention, in this piece of work we focus only on two of them (target setting and
evaluation of results), reminding to other authors for the others ( in particular the setting target phase is
strictly linked to the selection of indicators and for this topic we remind to other studies, such as (Pencheon
2007; Gagliardi et al. 2005; Jacobs, Goddard, et al. 2006)).
The technical framework, based on benchmarking and information on past performance, proposes a
formula to calculate how to set challenging goals and fairly assess their achievement in a real life context of
organizations. The method proposes to follow simple rules rather than statistical methods (such as data
envelopment analysis) in order to ease the process and empower the communication and comprehension
of all stakeholders involved into. It can be split in the two phases: setting goals and assessing performance.
For both phases regional policy makers and manager have to identify the appropriate key performance
measures representing the goal and the group of peer units (units whit similar mission such as teaching
hospital or focused hospitals).
Method for setting challenging goals.
As it is well expressed in the Valencian Regional decree 38/2007, the basic principle of this phase is that all
goals must be expressed in terms of easily measurable indicators with an explicit and clear method of
calculation.
The above principle have been declined into other three directions:
Goals have to be coherent and aligned with the strategic objectives of the Region;
Goals have to be set considering the difference between the units (ie. Local Health Department or
professionals) and their starting point (baseline);
Goals have to be communicated in a clear and prompt way.
Hence the ingredients of the target phase are: the past performance measures of all units which represent
the baselines for improvement and the gold standards if it exists.
The idea is to set targets on the basis of the baseline for improvement, asking for an inverse effort related
to the goal standard or the best performer: greater improvement is required to the units with poor
performance whilst a lower improvement to those that already registered a good performance. This
method allows to set targets in a fair way, because units with the worst performance are not rewarded
more than those who perform already well.
This can be easily done executing, for each indicator, the following steps:
1. Order the comparable units on the basis of their baseline (past or actual performance).
2. Set the target to the best and the worst performers using judgment from policy makers. In doing
this they have to keep in mind to ask more effort to the worst performer than to the best
performer and the gold standard whether it exists.
3. Trace the line between the two set targets.
4. Execute the regression to set the targets to the other units.
5. Discuss the targets with the units.
Step 2 is a crucial phase because it determines the range of variability that Region considers acceptable.
Indeed it could sounds odd to accept a certain degree of unwarranted variation. The underpinning of this
choice is linked to the empirical evidence provided by the goal setting theory that challenging goals lead to
better performance. Although it is desirable that all units achieve the performance of the best practice or
the gold standard, assigning to every unit, for the same goal, the same expected target may be perceived as
unfair, thus reducing motivation to achieve it. Indeed, incremental goals can be more motivating than
radical changes, which can be perceived as stretch goals. Hence, the assumption is that the ex ante range
set, jointly with a fair evaluation, would lead to better performance and faster reduction of variability.
In particular the regional range of the minimum expected performance and maximum expected
performance has to be manually assigned considering the performance distribution. Are the best or the
worst performers outliers? If this is the case, then it’s better to shift to the previous or next unit. Has the
best performer already achieved or exceeded the gold standard? In this case it can be required just to hold
this position.
Once targets were defined with the above method they should be communicated and discussed with the
units which should receive them in a proper time frame. This phase should be made in order to make unit
(hence employees) involved into the process which is a moderator of performance.
Method for performance evaluation.
For the performance evaluation the basic elements to be taken into account are (Gòmez & Carrillo 2009):
The performance improvement (or worsening);
The degree of achievement of the set target;
The relative performance.
If the set target is reached than the achievement is 100% and no further evaluation has to be done.
If the set target is partially attained then, in order to give a fair evaluation, it is important to compare
performance with the other comparables and the baseline.
Indeed the relative performance and the baseline can help to understand if the set target was stretch or if
environmental factors occurred.
How to assess in a fair way target partially attained? It depends upon circumstances. It is possible to
identify 5 scenarios:
1. The performance of the unit worsened as well as all the other comparables;
2. The performance of the unit worsened and the relative performance is lower than the median;
3. The performance of the unit worsened but the relative performance is upper than the median;
4. The performance of the unit improved although it doesn’t achieved the set target and the relative
performance is lower than the median;
5. The performance of the unit improved and the relative performance is upper than the median.
In the first scenario it is clear that some external factor happened so that the set target was no more
attainable or the selected indicator was uncontrollable by units.
In the second scenario, performance evaluation is bad so that if monetary incentives are linked to this
evaluation no incentive has to be given.
In the third scenario, whilst the performance worsened, the unit is positioned better than the half of other
units. In this case, performance evaluation is not so bad so that regional policy makers could provide a
premium for the relative performance.
In the fourth and fifth scenario it is possible to apply the linear system suggested by Locke (Locke 2004). In
addiction for the fifth case, policy makers may acknowledge a bonus for the relative performance.
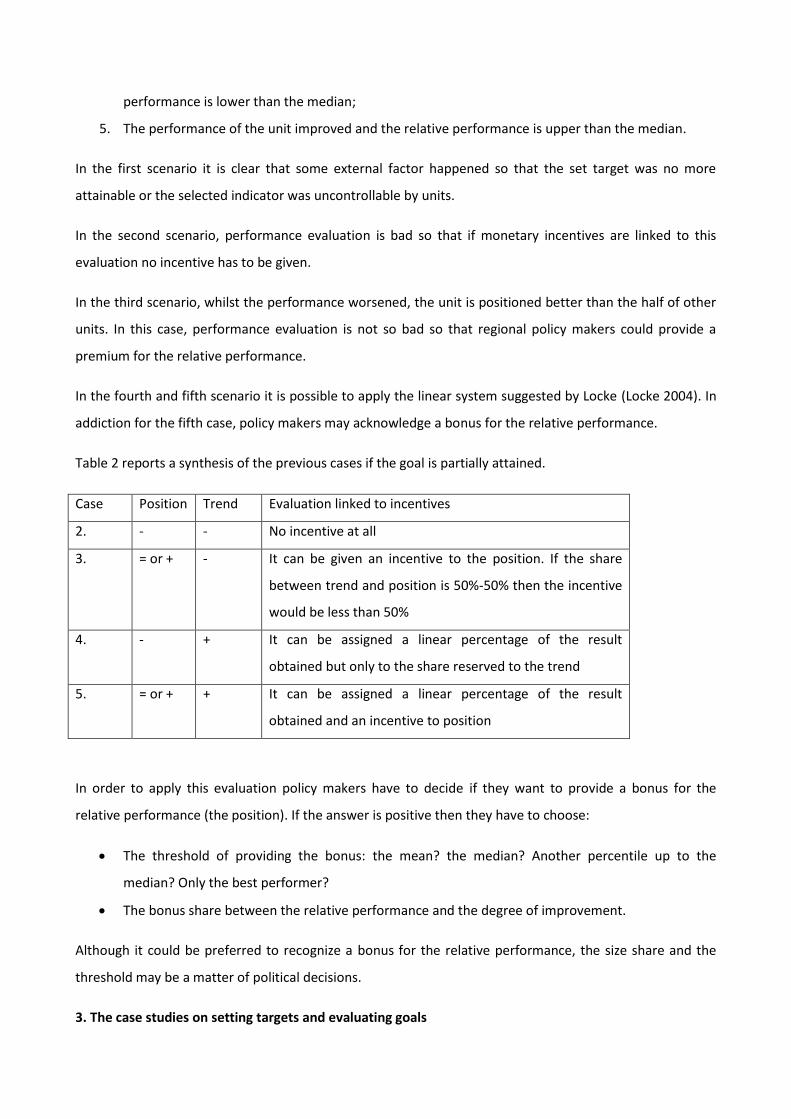
Table 2 reports a synthesis of the previous cases if the goal is partially attained.
Case Position Trend Evaluation linked to incentives
2. - - No incentive at all
3. = or + - It can be given an incentive to the position. If the share
between trend and position is 50%-50% then the incentive
would be less than 50%
4. - + It can be assigned a linear percentage of the result
obtained but only to the share reserved to the trend
5. = or + + It can be assigned a linear percentage of the result
obtained and an incentive to position
In order to apply this evaluation policy makers have to decide if they want to provide a bonus for the
relative performance (the position). If the answer is positive then they have to choose:
The threshold of providing the bonus: the mean? the median? Another percentile up to the
median? Only the best performer?
The bonus share between the relative performance and the degree of improvement.
Although it could be preferred to recognize a bonus for the relative performance, the size share and the
threshold may be a matter of political decisions.
3. The case studies on setting targets and evaluating goals
3.1 Valencia Region
The Spanish health system is universal coverage-wise funded from taxes and predominantly operates
within the public sector. Health competences were totally devolved to the regional level from the end of
2002 which led to 17 regional health ministries with primary jurisdiction over the organization and delivery
of health services within their territory. For some Regions, because of their self-governing tradition and
strong regional identity, the devolution process started before 2002 (García-Armesto et al. 2010). In fact,
since 1987 Valencia Region has fully autonomous power in managing and organizing health care. The
Agencia Valenciana de Salud is the public body responsible for providing healthcare services through its 24
Local Health Departments to its around 5 million of inhabitants. Local Health Department are
geographically based organizations responsible for the provision of primary health care services, acute and
community services .
Since the beginning of 2000, Valencia has introduced public-private joint ventures throughout the
administrative concessions to corporation or temporary union of enterprise for the provision of care (for
details see (García-Armesto et al. 2010; Trescoli Serrano et al. 2009; The NHS European Office 2011)). This
choice can be seen as one of the reform advocated by NPM to boost competition via quasi-market
mechanism. Agencia Valenciana strictly controls the whole system and, however, public providers are still
predominant: in Valencia in 2008 the percentage of publicly owned hospital beds is around 80% and the
percentage of population currently served by this model is around 16% (García-Armesto et al. 2010).
Since 2004 Valencia Region has adopted a performance management system based on the setting of
targets and their evaluation in the whole healthcare organization. The assessment of each organizational
level (represented by the health departments) and each employee is based on their contribution to the
achievement of the objectives identified in the multi-year Healthcare Strategic Plan (Plan Estratégico) which
is structured in the annual Management Agreement acts (Acuerdos de Gestion) of each health department.
The target setting and evaluation system is characterized by a clear articulation of the objectives along with
the organization and the employee. A pivotal role is played by Agencia Valenciana de Salud that is the
governmental authority in charge of the full processes of target setting and their assessment. Since 2005
this system is also aligned with the variable pay of all employees and since 2007 is linked with their
professional career (Decree 38/2007). The assessment of the objectives is based on the data collected in
the Regional information systems and it is carried out by Agencia Valenciana de Salud which evaluates their
achievement and the allocation of the incentives from the managerial level and to the individual
practitioner.
The objectives of the Strategic Plan are designed through the Balanced Scorecard methodology, by
identifying the causes and the effects between the monitored variable and the expected results. This is
essential to define the "weight" that each indicator will have in the final evaluation process which is
declined yearly in all health departments with the Acuerdos de Gestion (Gòmez 2008). Through the
Acuerdos de Gestion, the objectives and the indicators are weighed and declined in each health
department. The weight of an objective is between 0 and 100 and represents its relative importance
compared to other objectives. About 20% of the objectives of each health department relates to specific
initiatives for the area/ territory, while the remaining 80% regard the strategic objectives defined by the
Agencia Valenciana de Salud, although some of them can be articulated in different way among the health
departments.
Objectives are declined starting from the three domains: responsiveness, health care service provision and
financial sustainability.
Whereas for the first applications of this method most of the objectives referred to process indicators (such
as hospitalization rates, average length of stay, etc..), recently, given the importance of measuring the full
health care path and its impact on patients’ health status, also outcome and quality indicators have been
introduced.
The specificity of the methods followed by Valencia.
For each indicator the target is set considering its baseline and relative performance regards similar Local
Health Departments, following the path described in section 2. The Agencia Valenciana de Salud set the
target to the units usually by December of the year before. These targets can be adjusted, according to the
results values of the year before, by April or May, but generally there are not great changes.
The three components applied to the evaluation phase are those of the section 2 (Gòmez & Carrillo 2009):
1.the degree of achievement of the set target (linear component); 2. The performance improvement or
worsening (asymptotic component) and 3. the relative performance regards similar Local Health
Departments (exponential component).
The final evaluation of a unit is the result of the sum of the weights of the objectives multiplied by their
level of achievement.
The full achievement of the target value implies an achievement of the 100% of the related objectives,
whilst when the 100% of the target is not reached, a score between 0 and 100 for the percentage of
compliance is assigned. Intuitively, the calculation of the achievement is based on following reasoning: if
the unit does not reach the target then its evaluation (for each goal) is given taking into consideration the
improvement obtained with the respect of the previous year for the 50% of the final assessment and the
relative performance recognizing a 50% of achievement if the performance is up to the median
performance. The performance improvement compared to the previous year was corrected by a factor
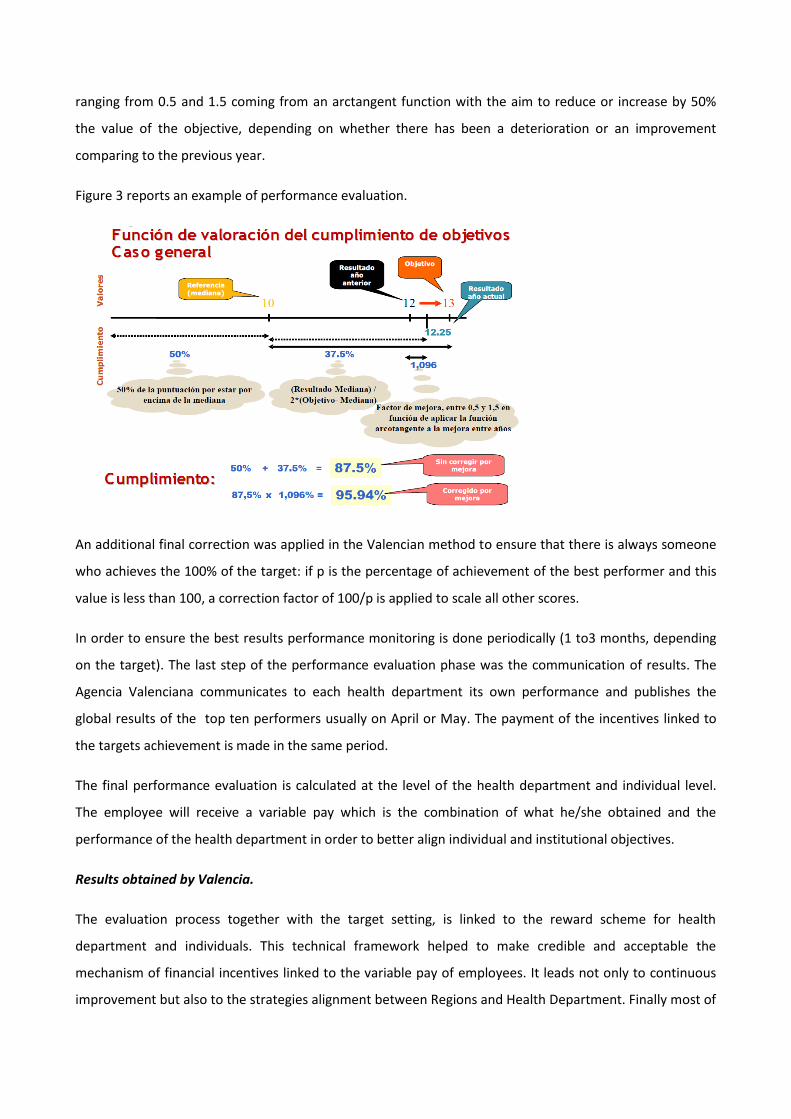
ranging from 0.5 and 1.5 coming from an arctangent function with the aim to reduce or increase by 50%
the value of the objective, depending on whether there has been a deterioration or an improvement
comparing to the previous year.
Figure 3 reports an example of performance evaluation.
An additional final correction was applied in the Valencian method to ensure that there is always someone
who achieves the 100% of the target: if p is the percentage of achievement of the best performer and this
value is less than 100, a correction factor of 100/p is applied to scale all other scores.
In order to ensure the best results performance monitoring is done periodically (1 to3 months, depending
on the target). The last step of the performance evaluation phase was the communication of results. The
Agencia Valenciana communicates to each health department its own performance and publishes the
global results of the top ten performers usually on April or May. The payment of the incentives linked to
the targets achievement is made in the same period.
The final performance evaluation is calculated at the level of the health department and individual level.
The employee will receive a variable pay which is the combination of what he/she obtained and the
performance of the health department in order to better align individual and institutional objectives.
Results obtained by Valencia.
The evaluation process together with the target setting, is linked to the reward scheme for health
department and individuals. This technical framework helped to make credible and acceptable the
mechanism of financial incentives linked to the variable pay of employees. It leads not only to continuous
improvement but also to the strategies alignment between Regions and Health Department. Finally most of
indicators report also a reduction of variability in the performance of health department (Gòmez 2011;
Gòmez 2008)
3.2 Tuscany Region
The Italian healthcare system ensures universal coverage and, after the devolution process of 90s, it
makes regions responsible for organising and delivering health services. Tuscany’s healthcare system covers
approximately 3.7 million inhabitants, delivers 95% of its services through public organisations, and spends
more than 6.6 million euro in health care services per year.
Since 2005, Tuscany’s health care system has adopted a Performance Evaluation System (PES) that
consists of more than 100 indicators grouped into six dimensions (Nuti et al. 2012; Nuti et al. 2009):
population health status; capacity to pursue regional strategies; clinical performance; patient satisfaction;
staff satisfaction; and efficiency and financial performance. The PES gives a performance overview of the 12
local health authorities and 5 teaching hospitals in the region through a benchmarking process. Indicators
for the PES were selected by Tuscany’s health authorities and regional administrative professionals by
investigating performance indicators in other countries (e.g., Ontario Health System, English NHS). In
general this system allows to show performance evaluation into five tiers: excellent, good, average, bad
and very bad performance. Since 2007 the system can be consulted via website by everyone. Since 2006
the Tuscany Region decided to attach the PES system to the CEO’s reward system. Until 2006 most of CEOs’
goals were qualitative and they were assessed following the “all or none” criterion. They were mainly based
(more than 50%) on financial performance and the average achievement was up to 90% with low
variability; after the integration with the PES more than 50% of the goals have been quantitative, the
weight of financial assessment goals was reduced and the degree of the global achievement of goals varied
between about 45% and 70% (Nuti 2008).
Every year the regional managers select the indicators that should be included into the reward system on
the basis of the strategic plan, the contextual environment and the list of indicators used at national level
to assess Regions. Usually goals are common across units however there are also specific indicators for
units because of their different mission (such as teaching hospitals) or because Region wants health
authority to focus its attention on particular topics (such as its weakens performance) or programs.
A pivotal role was played by Laboratorio Management e Sanità, Scuola Superiore Sant’Anna, a public
university that worked as an independent authority and which has been strongly supporting Tuscany
Region in both the setting target and performance evaluation phase.
Recently, after the introduction of the national outcome program (Programma Nazionale Esiti, PNE), some
indicators related also to the outcome (such as 30 days mortality rate for AMI) have been introduced as
composite indicator in the PES (see the Italian PES report of 2012 (Nuti & Marcacci 2013) for details).
The specificity of the methods followed by Tuscany.
Almost all quantitative indicators received a personalized target. Few exceptions are mainly linked to the
existence of a gold or national standard (like some indicators for immunization rate), where the regional
managers decided to set the gold standard also on the basis of the low variation in performance across the
units.
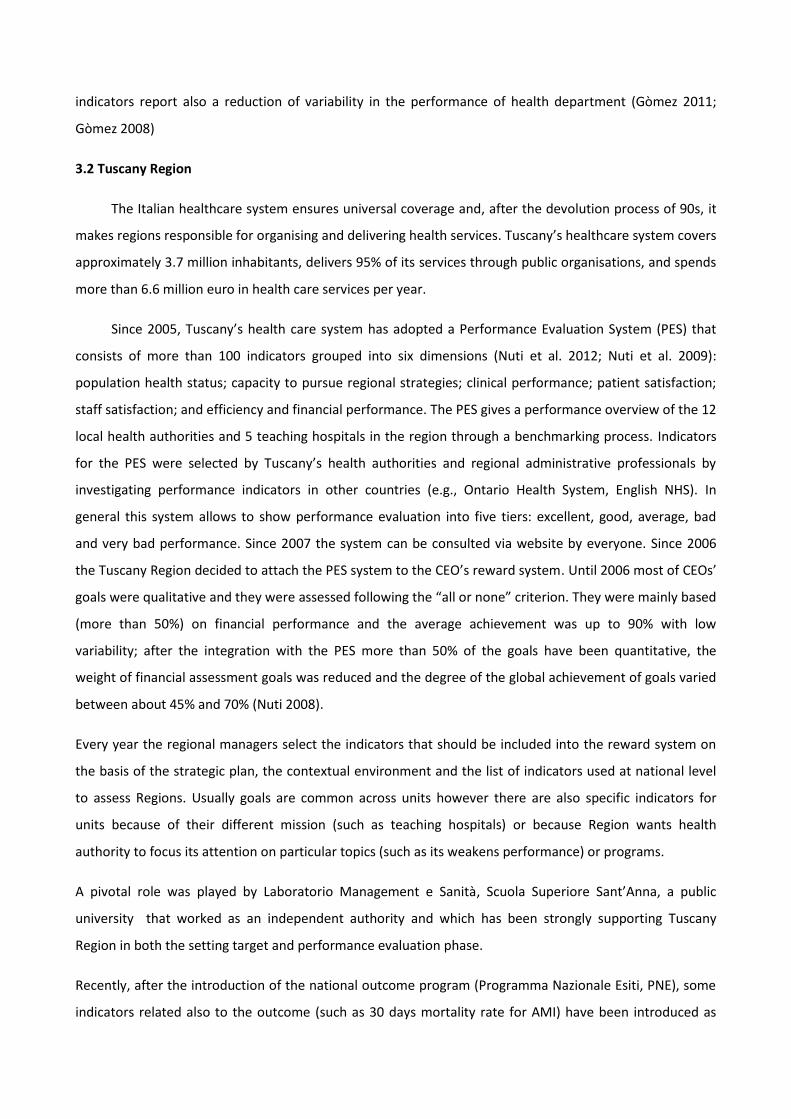
For the setting target phase Tuscany Region follows the technical framework of section 2. For each
indicator, the target is set considering its baseline and relative performance, thus requiring a greater
improvement to the units with poor performance whilst a lower improvement to those that already
registered a good performance ( see figure 4).
Figure 4: Past Perfromance (year 2007) and annual target (year 2008) for Tuscany Health Authorities
Since 2007, all indicators of PES, with the exception of health population status, have been included in the
reward systems for CEOs through a global indicator that evaluates the health authorities’ overall
performance. The overall performance is calculated as the percentage of good and excellent performance
indicators minus the bad and very bad performance indicators on the total. In addition to that, it has been
introduced also the percentage of indicators improved. These two indicators will sum up the relative
performance and the trend in one shot. The aim is to motivate health authorities to pay attention to all
indicators, in order to reduce synecdoche phenomena (see Bevan & Hood for details(Bevan & Hood n.d.))
where incentivized indicators eclipse those that are not.
The Tuscany Region and Laboratorio Management & Sanità communicate indicators and the target set to
the units explaining the criteria applied on December.
The criteria followed in the evaluation phase are those enunciated in the technical framework and are
reported in the appendix 2 of the regional act 1087/2009. In particular Tuscany Region, as well as Valencia,
has decided to assess goals, giving 50% of the attainment on the basis of relative performance and 50% on
the basis of the reached improvement. In addition, it recognizes to the best performers a small range of
variation (1%) of the improvement requested if target is not hit.
Once the assessment per each indicator and globally is done, it is communicated to the health care
authorities which have sometimes to prove if particular situation occurred to impede the goal attainment.
These situations are very rare and when occurred the CEO had to provide evidence on the obstacles met.
After this last step, results of the assessment are publicly disclosed through regional acts where it is
possible to access to the evaluation attained globally but also for every indicators.
Even though performance results are communicated every three months so that health care authorities can
re-orient their actions and the final results of quantitative indicators are showed on May of the year after,
because of the existence of qualitative indicators and the approval phase of the balance sheets which
determine the financial performance assessment, the final assessment (whole the process until the issue of
the act) registered, in the last years, a lag time of 2 years.
Results obtained by Tuscany.
The overall governance systems (PES monitoring, CEOs reward system, and other tools linked to PES ) led to
register very positive results both in terms of improvement and variation reduction (Nuti et al. 2012).
Throughout this integrated management systems the Region was able to improve its performance and align
strategies, objectives across the health care authorities.
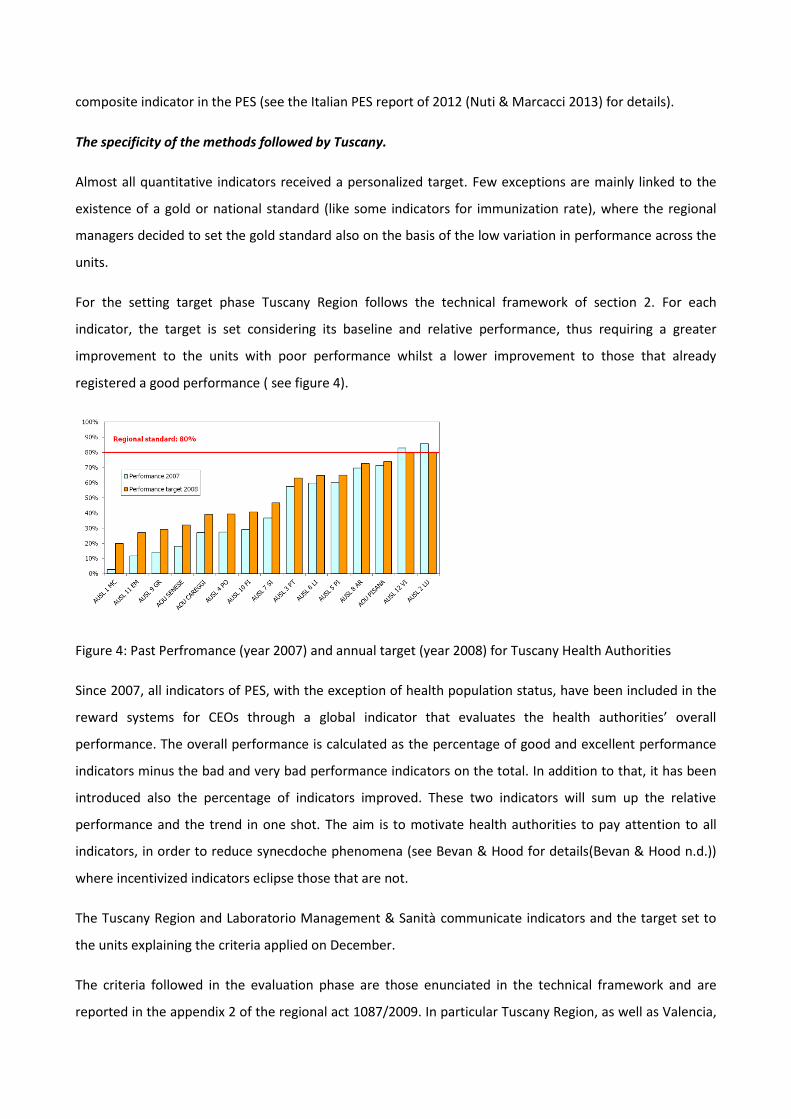
3.3 A comparative analysis of the two case studies
Both Valencia and Tuscany Region seem to apply the same method although some differences. Table 1
sums up the principal characteristics of the two systems.
Phase Criteria Tuscany Valencia
Target
setting
Past performance The target is set considering
past performance and the
relative performance asking
for more effort to units who
perform worse. In addiction
there are two indicators which
summed up the global relative
performance and the global
capacity to improve
performance
The target is set considering past
performance and the relative
performance asking for more
effort to units who perform
worse.
Relative
performance
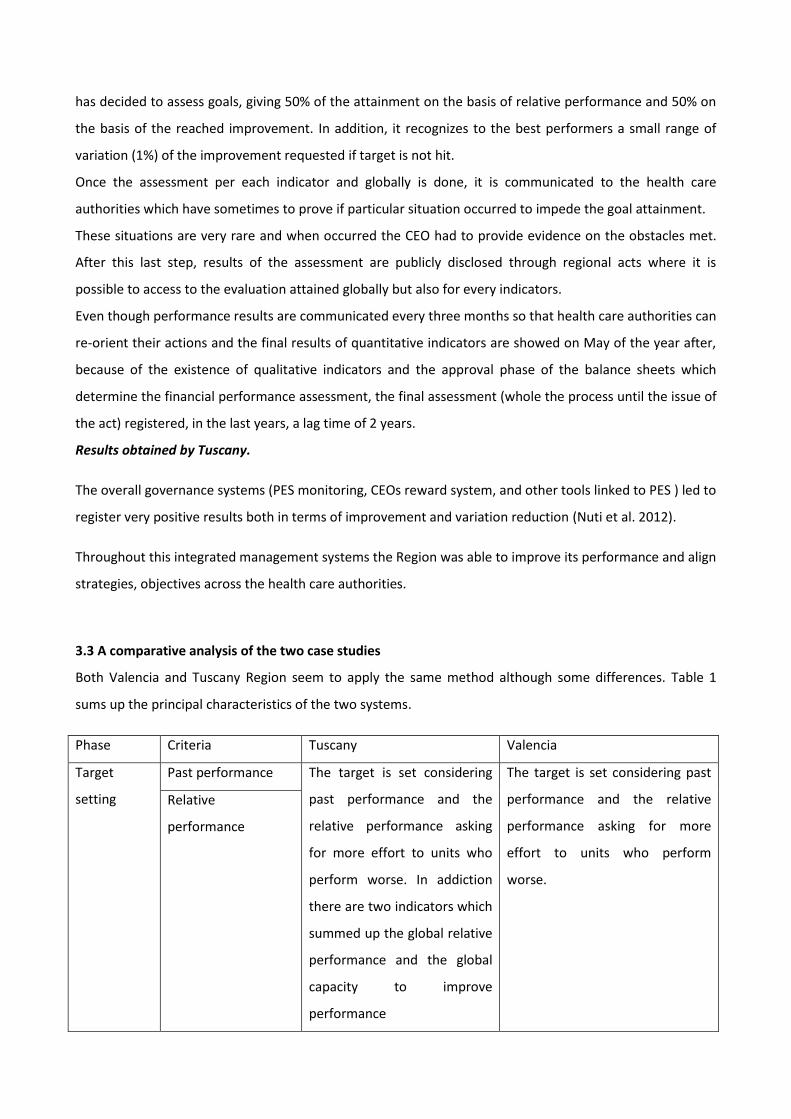
Communication By December targets are
discussed. Then targets were
issued in a regional act
including all information,
accessible via web from
everyone
By December targets are
discussed. Each health
department and professional is
aware of its own target. The
targets can be adjusted during the
year (usually on April or May), but
generally there are not great
changes.
Level of
implementation
(targets for whom?)
Chief Executive Officers of
Local Health Authorities and
Teaching Hospitals
Health departments and
professionals
Who is in charge of
the process
Tuscany Region supported by
Laboratorio Management &
Sanità (Independent body)
Agencia Valenciana de Salud
(Governmental body)
Evaluating
performance
Past performance It accounts for 50% It accounts for 50% plus the
correction with the arctangent
function
Relative
performance
It accounts for 50%.
Correction occurs in case of
“hold your performance” goal.
It accounts for 50% plus a
premium if it is the best
performer
Communication By May are presented the
results of the quantitative
indicators. Final evaluation
registered a lag time of 2
years. Once final assessment
occurred, after a discussion
phase, ranking and
assessment of each goal per
units are issued in a public act
open to citizens.
By May the results of the
quantitative indicators are
presented. Ranking and
assessment of each goal are
showed to each unit.
Only results of the top ten units
were publicly disclosed.
Level of
implementation
(who is assessed?)
Chief Executive Officers of
Local Health Authorities and
Teaching Hospitals
Health departments and
professionals
Who is in charge of
the process
Tuscany Region supported by
Laboratorio Management &
Agencia Valenciana de Salud
(Governmental body)
Sanità (Independent body)
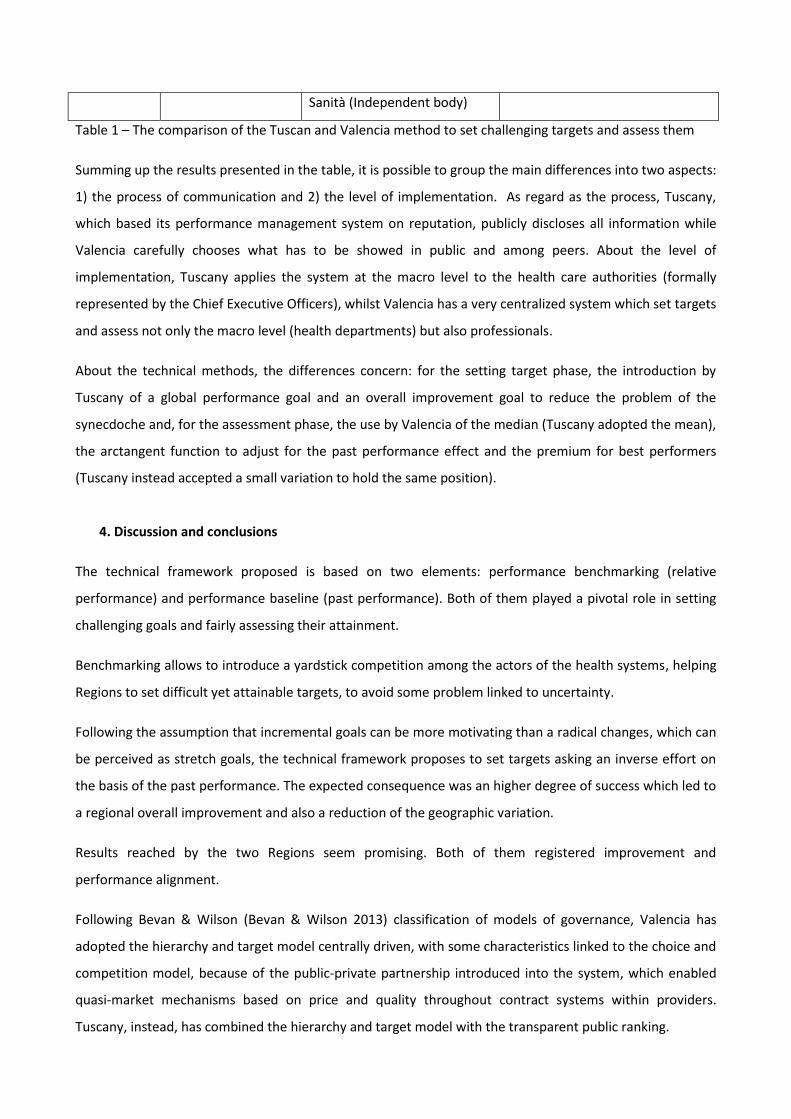
Table 1 – The comparison of the Tuscan and Valencia method to set challenging targets and assess them
Summing up the results presented in the table, it is possible to group the main differences into two aspects:
1) the process of communication and 2) the level of implementation. As regard as the process, Tuscany,
which based its performance management system on reputation, publicly discloses all information while
Valencia carefully chooses what has to be showed in public and among peers. About the level of
implementation, Tuscany applies the system at the macro level to the health care authorities (formally
represented by the Chief Executive Officers), whilst Valencia has a very centralized system which set targets
and assess not only the macro level (health departments) but also professionals.
About the technical methods, the differences concern: for the setting target phase, the introduction by
Tuscany of a global performance goal and an overall improvement goal to reduce the problem of the
synecdoche and, for the assessment phase, the use by Valencia of the median (Tuscany adopted the mean),
the arctangent function to adjust for the past performance effect and the premium for best performers
(Tuscany instead accepted a small variation to hold the same position).
4. Discussion and conclusions
The technical framework proposed is based on two elements: performance benchmarking (relative
performance) and performance baseline (past performance). Both of them played a pivotal role in setting
challenging goals and fairly assessing their attainment.
Benchmarking allows to introduce a yardstick competition among the actors of the health systems, helping
Regions to set difficult yet attainable targets, to avoid some problem linked to uncertainty.
Following the assumption that incremental goals can be more motivating than a radical changes, which can
be perceived as stretch goals, the technical framework proposes to set targets asking an inverse effort on
the basis of the past performance. The expected consequence was an higher degree of success which led to
a regional overall improvement and also a reduction of the geographic variation.
Results reached by the two Regions seem promising. Both of them registered improvement and
performance alignment.
Following Bevan & Wilson (Bevan & Wilson 2013) classification of models of governance, Valencia has
adopted the hierarchy and target model centrally driven, with some characteristics linked to the choice and
competition model, because of the public-private partnership introduced into the system, which enabled
quasi-market mechanisms based on price and quality throughout contract systems within providers.
Tuscany, instead, has combined the hierarchy and target model with the transparent public ranking.

Despite different models of governance, the technical steps adopted by the two Regions are very similar.
Both of them use past performance and relative performance to make challenging the goals and to assess
in a fair way their achievement. So that the operational framework proposed seems to be useful and
adapted to different context and can be also applied to individuals, as in the case of Valencia.
Hence the method, which is mainly proposed for the macro level to the regional administrations, can be
applied also at micro level, as long as units can be compared and there are performance measurement
system already in use. Indeed on one side some choices can be generalized, on the basis of the principles
sustained by the goal setting theory and benchmarking process, whilst on the other side other choices
strictly depend on the strategies Region decided to follow, such as the process of communication. Further
studies are needed to better understand whether different application led to different results.
References
Abernethy, M. a. & Brownell, P., 1999. The role of budgets in organizations facing strategic change: an exploratory study. Accounting, Organizations and Society, 24(3), pp.189–204. Available at: http://linkinghub.elsevier.com/retrieve/pii/S0361368298000592.
Appleby, J. et al., 2012. Payment by Results. How can payment systems help to deliver better care?, London.
Arah, O. a et al., 2003. Conceptual frameworks for health systems performance: a quest for effectiveness, quality, and improvement. International journal for quality in health care : journal of the International Society for Quality in Health Care / ISQua, 15(5), pp.377–98. Available at: http://www.ncbi.nlm.nih.gov/pubmed/14527982.
Ashford, S.J. & De Stobbeleir, K.E.M., 2013. Feedback, Goal setting and task performance revisited. In E. A. Locke & G. P. Latham, eds. New Developments in Gol Setting and Task Performance. New York and London: Routledege Taylor & Francis Group, pp. 51–64.
Ballantine, J., Brignall, S. & Modell, S., 1998. Performance measurement and management in public health services : a comparison of U . K . and Swedish practice. Management Accounting Research, 9(November 1997), pp.71–94.
Van den Berg, M.J. et al., 2014. The Dutch health care performance report : seven years of health care performance assessment in the Netherlands. Health Research Policy and Systems, 12(1), pp.1–7. Available at: Health Research Policy and Systems.
Bevan, G. & Hood, C., ARTICLES WHAT ’ S MEASURED IS WHAT MATTERS : TARGETS AND GAMING IN THE ENGLISH PUBLIC HEALTH CARE SYSTEM. , 84(3), pp.517–538.
Bevan, G. & Wilson, D., 2013. Does “ naming and shaming ” work for schools and hospitals ? Lessons from natural experiments following devolution in England and Wales. Public Money & Management, 33(4), pp.245–252.
Bhutta, K.S. & Huq, F., 1999. Benchmarking - best practices: an integrated approach. Benchmarking: An international journal, 6(3), p.254.
Christianson, J., Leatherman, S. & Sutherland, K., 2007. Financial incentives , healthcare providers and quality improvements A review of the evidence,
Custers, T. et al., 2008. Selecting effective incentive structures in health care : A decision framework to support health care purchasers in finding the right incentives to drive performance. , 14, pp.1–14.
Ferreira, A. & Otley, D., 2009. The design and use of performance management systems : An extended framework for analysis. Mana, 20, pp.263–282.
Flamholtz, E.G., Das, T.K. & Tsui, A.S., 1985. Toward an integrative framework of organizational control. Accounting, Organizations and Society, 10(1).
Gagliardi, A.R. et al., 2005. Development of ovarian cancer surgery quality indicators using a modified Delphi approach. Gynecologic Oncology, 97, pp.446–456.
García-Armesto, S. et al., 2010. Spain: Health system review. Health Systems in Transition, 12(4), pp.1–295.
Glasziou, P.P. et al., 2012. When financial incentives do more good than harm : a their premature or inappropriate implementation. BMJ, 5047(August), pp.1–5.
Gòmez, G., 2008. Il sistema di valutazione della performance della sanità nella Regione Valenciana. In S. Nuti, ed. La valutazione della performance in sanità. Bologna: Il Mulino.
Gòmez, G., 2011. Jornada de gestiòn en atenciòn primaria. Incentivaciòn. Available at: http://www.revistafml.es/upload/ficheros/noticias/201105/02ggomez.pdf.
Gòmez, G. & Carrillo, E., 2009. Evaluaciòn del cummplimiento de objetivos en los sistemas de incentivaciòn del desempeño, Barcelona.
Hansen, S.C., Otley, D.T. & Van der Stede, W.A., 2003. Practice Developments in Budgeting: An Overview and Research Perspective. Journal of Management Accounting Research, 15(1), pp.95–116.
Helgason, S., 1997. International Benchmarking Experiences from OECD Countries International Benchmarking, Copenhagen.
Van Herck, P. et al., 2010. Systematic review : Effects , design choices , and context of pay-for-performance in health care. BMC Health Services Research, 10(247).
Hollingsworth, B., 2003. Non-parametric and parametric applications measuring efficiency in health care. Health Care Management Science, 6, pp.203–218.
Hurst, J. & Jee-hughes, M., 2001. Performance Measurement and Performance Management in OECD Health Systems,
Jacobs, R., Goddard, M. & Smith, P.C., 2006. Public Services: are composite measures a robust reflection of performance in the public sector, York.
Jacobs, R., Smith, P.C. & Street, A., 2006. Measuring efficiency in health care, Cambridge University Press.
Judge, K. et al., 2005. Health Inequalities: a Challenge for Europe,
Kouzmin, A., Lo, E. & Korac-kakabadse, N., 1999. Benchmarking and performance measurement in public sectors. The international journal of public sector management, 12(2), pp.121–144.
Locke, E.A., 2004. Linking goals to monetary incentives. Academy of Management Executive, 18(4).
Locke, E.A. & Latham, G.P., 1990. A theory of goal setting and task performance, Englewood Cliffs, NJ: Prentice Hall.
Locke, E.A. & Latham, G.P., 2013a. Goal Setting Theory. The current state. In E. A. Locke & G. P. Latham, eds. New Developments in Gol Setting and Task Performance. New York and London: Routledege Taylor & Francis Group, pp. 623–630.
Locke, E.A. & Latham, G.P., 2013b. New Developments in Goal Setting and Task Performance E. A. Locke & G. P. Latham, eds., New York and London: Routledege Taylor & Francis Group.
Lunenburg, F.C., 2011. Goal-Setting Theory of Motivation. International Journal of Management, Business and Administration, 15(1), pp.1–6.
McNair, C.J. & Leibfried, K.H.J., 1992. Benchmarking. A tool for continuous improvement, New York and Toronto: John Wiley & Sons, Inc.
Murante, A.M. et al., 2014. Does feedback influence patient - professional communication? Empirical evidence from Italy. Health Policy, 116, pp.273–280.
Northcott, D. & Llewellyn, S., 2003. The “ladder of success” in healthcare: the UK national reference costing index. Management Accounting Research, 14(1), pp.51–66. Available at: http://linkinghub.elsevier.com/retrieve/pii/S104450050200032X [Accessed August 1, 2014].
Nuti, S., 2008. La valutazione della performance in sanità, Bologna: Il Mulino.
Nuti, S. et al., 2009. Performance assessment in the maternity pathway in Tuscany region. , pp.115–121.
Nuti, S. & Marcacci, L., 2013. Il sistema di valutazione della performance della sanità toscana - Report 2012, Pisa: ETS.
Nuti, S., Seghieri, C. & Vainieri, M., 2012. Assessing the effectiveness of a performance evaluation system in the public health care sector : some novel evidence from the Tuscany region experience. Journal of Management & Governance.
OECD, 2010. Health care systems: getting more value for money,
Ouchi, W.G., 1979. A conceptual framework for the design of organizational control mechanisms. Management Science, 25(9), pp.833–848.
Pencheon, D., 2007. The Good Indicators Guide : Understanding how to use and choose indicators, London.
Pink, G.H. et al., 2001. Creating a Balanced Scorecard for Hospital System. Health Care Finance, 2(3), pp.1–20.
Scott, A. et al., 2011. The effect of financial incentives on the quality of health care provided by primary care physicians. Cochrane Database of Systematic Reviews, (9).
Smith, P.C., 2002. Perfromance management in British Health Care: Will it deliver? Health Affairs, 21(3), pp.103–115.
The NHS European Office, 2011. The search for low-cost integrated healthcare. The Alzira model- from the region of Valencia, Brussels.
Trescoli Serrano, C., Marin Ferrer, M. & Torner de Rosa, A., 2009. The Alzira model: Hospital de la Ribera, Valencia, Spain. In B. Rechel et al., eds. Capital Investment. Case studies from Europe. The European Observatory on Health Systems and Policies.
Trosa, S. & Williams, S., 1996. Benchmargking in Public Sector Management,
Worthington, 2004. Frontier efficiency measurement in health care: a review of empirical techniques and selected applications. Medical Care Research Review, 61, pp.135–170.

Young, G. & Smith, K.G., 2013. Units, Divisions and Organizations. Macro-level Goal Setting. In E. A. Locke & G. P. Latham, eds. New Developments in Gol Setting and Task Performance. New York and London: Routledege Taylor & Francis Group, pp. 311–327.