Embed Size (px)
Citation preview

8/6/2019 MILLIPLEX MAP Inflammation and Immunology
http://slidepdf.com/reader/full/milliplex-map-inflammation-and-immunology 1/42
Data SheetProduct Selection Guide
MILLIPLEX® map Inflammation and ImmunologyLuminex® and xMAP® Technology
www.millipore.com/milliplex_infammation
INFLAMMATION
IFNg
TNF
IL-6
Broadest Selection of
Inflammation/Immunology
Analytes Available in a
Single Panel
VEGF

8/6/2019 MILLIPLEX MAP Inflammation and Immunology
http://slidepdf.com/reader/full/milliplex-map-inflammation-and-immunology 2/424
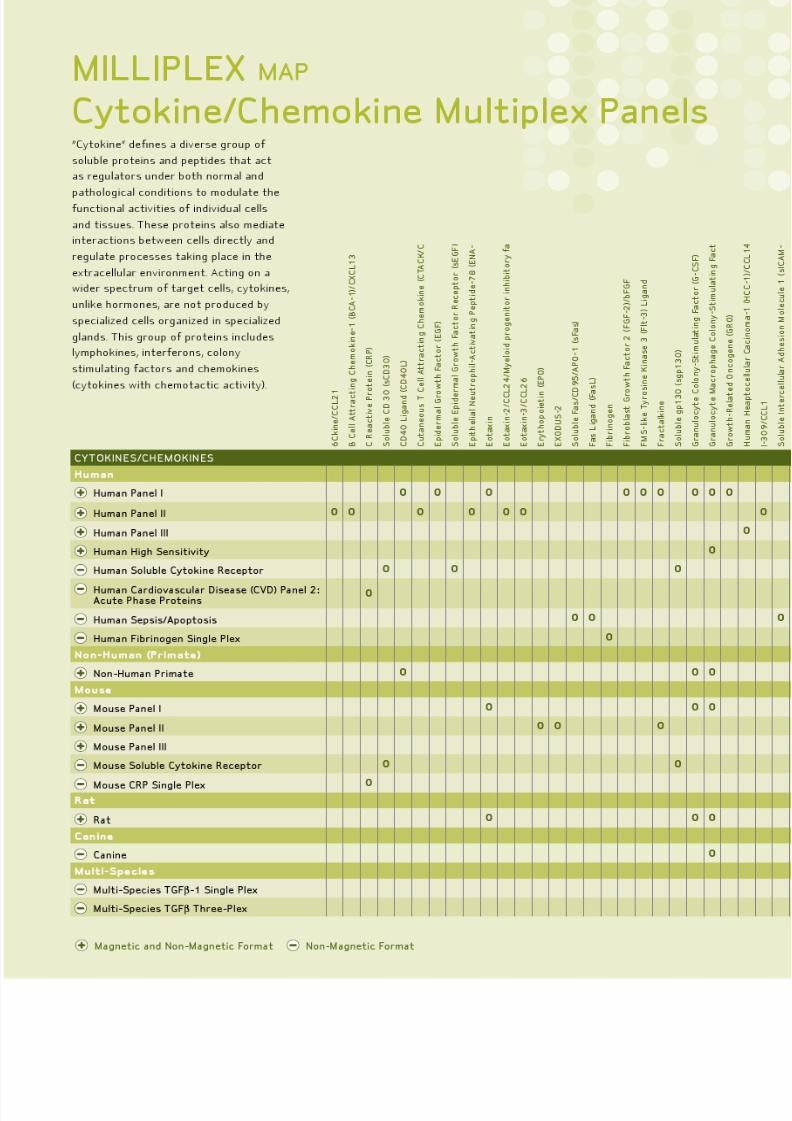
MILLIPLEX map
Inflammation and Immunology
The immune system is an organized
complex network of biological structures
and processes that protect against
disease. For example, cytokines and
chemokines, proteins of the inammatory
process, mediate interactions between
cells directly, regulating target immune
cell responses. These responses result in
inammation in which the immune system
attempts to eradicate foreign antigens and
begin the healing process. Consequently,
the inammatory process plays a key
protective role in immunity.
Based on the Luminex xMAP platform,
Millipore offers the broadest selection of
inammation and immunology biomarkers
available in a single panel for a variety of
human and animal models.
MILLIPLEX map Magnetic andNon-magnetic Bead FormatMillipore is in the process of converting our
MILLIPLEX multiplex portfolio from a non-magnetic
to a magnetic bead format. Advantages of the
magnetic-bead format include:
o Fewer issues with clogged wells and
leaky plateso Walk-away washing capabilities
o High throughput capability
o Flexible—can be washed automatically with
a magnetic bead washer or manually with a
handheld magnetic bead washer or with
lter plates.
MILLIPLEX map multiplex panels enable you to
investigate the modulation and expression of
dozens of analytes simultaneously, giving you
the advantage of speed and sensitivity, whichcan dramatically improve productivity.
Inflammation/Immunology research plays a
signicant role in achieving a deeper understanding
of disease states such as:
o Chronic Inammatory Disease
o Autoimmune Disease
o Allergic Disorders
o Metabolic Diseases
o Cardiovascular Disease
o Cancer

8/6/2019 MILLIPLEX MAP Inflammation and Immunology
http://slidepdf.com/reader/full/milliplex-map-inflammation-and-immunology 3/42
8/6/2019 MILLIPLEX MAP Inflammation and Immunology
http://slidepdf.com/reader/full/milliplex-map-inflammation-and-immunology 4/42

8/6/2019 MILLIPLEX MAP Inflammation and Immunology
http://slidepdf.com/reader/full/milliplex-map-inflammation-and-immunology 5/42
8/6/2019 MILLIPLEX MAP Inflammation and Immunology
http://slidepdf.com/reader/full/milliplex-map-inflammation-and-immunology 6/42

8/6/2019 MILLIPLEX MAP Inflammation and Immunology
http://slidepdf.com/reader/full/milliplex-map-inflammation-and-immunology 7/425

8/6/2019 MILLIPLEX MAP Inflammation and Immunology
http://slidepdf.com/reader/full/milliplex-map-inflammation-and-immunology 8/426
Human Cytokine/Chemokine 39-Plex Magnetic BeadStandard Curves in Matrix
100,000
1,000
100
10
0 1 0 1 0 0
1 , 0 0
0
1 0 , 0 0 0
M e d i a n
F l u
o r e s c e n c e
I n t e n s i t y ( M F I )
Concentration (pg/mL)1 0 0 ,
0 0 0
10,000
1
IL-1ra IL-2 IL-3 IL-4 TNFα VEGF
IL-5 IL-6 IL-7 IL-8 IL-15 IP-10
IL-9 IL-10 IL-12(p40) IL-12(p70) MCP-3 MIP-1β
EGF Eotaxin FGF-2 FIt-3L IL-13 IL-17A sCD40L
Fractakine G-CSF GM-CSF GRO MCP-1 MDC TNFβ
IFNα2 IFNγ IL-1α IL-1β MIP-1α sIL-2Rα TGFα
0
1
10
100
1,000
10,000
100,000
E G F
E o
t a x i n
F
G F - 2
F
I t - 3 L
F r a c t a
l k i n e
G
- C S F
G M
- C S F
G R O
I F N α 2
I F N γ
I L - 1 α
I L - 1 β
I
L - 1 r a
I L - 2
I L - 3
I L - 4
I L - 5
I L - 6
I L - 7
I L - 8
I L - 9
I L - 1 0
I L - 1
2 p 4 0
I L - 1
2 p 7 0
I L - 1 3
I L - 1 5
I L - 1 7
I P - 1 0
M
C P - 1
M
C P - 3
M
D C
M
I P - 1 α
M
I P - 1 β
s C
D 4 0 L
s I L
- 2 R α
T G F α
T N F α
T N F β
V E G F
P D G
F - A A
P D G F - A
B / B B
R A
N T E S
C o n c e n t r a t i o n ( p g / m L )
Normal
Sepsis
Cytokine and Chemokine Concentrations in Normal and Septic Human
Serum Samples
The MILLIPLEX map Cytokine/Chemokine 42-Premixed Panel was used to determine cytokine and chemokineconcentrations (pg/mL) in serum samples of both normal (n=20) and sepsis (n=10) patients. The results of the assay
are shown below.
Human Cytokine/Chemokine 3-Plex Magnetic Bead
Standard Curves in Assay Buffer100,000
10,000
1,000
100
10
1
0 1 0 1 0 0
1 , 0 0
0
1 0 , 0 0 0
M e d i a n
F l u o r
e s c e n c e
I n t e n s i t y
( M F I )
Concentration (pg/mL)1 0 0 , 0 0
0
PDGF-AA PDGF-AB RANTES
Standard Curve Ranges
3.2 to 10,000 pg/mL for all analytes
Specicity
Cross-reactivity between the antibodies and any of the
other analytes in this panel is nondetectable or negligible.
Assay Specications
• This kit may be used for the analysis of all or any
combination of the above cytokines and chemokines in
tissue/cell lysate and culture supernatant samples.
PERFORMANCE SPECIFICATIONS
• This kit may also be used in serum, plasma, other body
fluids, and tissue/cell extract or culture samples for the
analysis of all or any combination of the above
cytokines and chemokines except RANTES, PDGF-AA,
and PDGF-AB/BB because of high concentrations of the
three analytes in the blood.
• Serum or plasma samples should be diluted 1:100 when
the kit is used for analyzing RANTES, PDGF-AA, and
PDGF-AB/BB.
Human Cytokine/Chemokine Panel I Magnetic and Non-Magnetic Bead Format

8/6/2019 MILLIPLEX MAP Inflammation and Immunology
http://slidepdf.com/reader/full/milliplex-map-inflammation-and-immunology 9/42 7
AnalyteSensitivity*
+2SD(pg/mL)
Precision
Accuracy(%)Intra-Assay
(%CV)Inter-Assay
(%CV)
sCD40L 9.9 4 19 95
EGF 4.0 13 15 100
Eotaxin 2.0 4 10 107
FGF-2 11.8 2 5 99
Flt-3 Ligand 7.0 2 7 98
Fractalkine 37.7 5 9 87
G-CSF 2.3 12 16 100
GM-CSF 8.0 5 7 98
GRO 14.1 2 9 98
IFN2 2.8 8 10 94
IFNg 1.1 12 5 98
IL-1 2.6 5 12 95
IL-1b 1.3 9 9 97
IL-1ra 2.4 7 7 97
IL-2 1.2 5 6 96
sIL-2R 20.5 2 8 95
IL-3 0.9 12 13 96
IL-4 1.4 5 6 95
IL-5 0.9 6 9 97
IL-6 1.3 7 10 94
IL-7 1.6 6 7 93
IL-8 0.6 5 7 99IL-9 2.0 2 8 99
IL-10 3.0 5 16 97
IL-12 (p40) 4.8 5 12 93
IL-12 (p70) 1.6 4 8 96
IL-13 1.0 6 6 95
IL-15 1.1 6 8 92
IL-17A 1.1 5 9 99
IP-10 2.9 5 7 94
MCP-1 2.3 8 8 101
MCP-3 6.4 2 6 97
MDC 7.1 2 7 102
MIP-1 2..5 8 17 105
MIP-1b 3.0 6 7 92
PDGF-AA 0.7 4 17 98
PDGF-AB/BB 2.7 2 12 102
RANTES 0.5 8 15 87
TGF 1.2 4 10 92
TNF 0.7 6 9 97
TNFb 1.2 10 12 97
VEGF 15.0 10 7 88
*See Protocol for the most recently updated values.
Human Cytokine/Chemokine Magnetic Bead Panel I

8/6/2019 MILLIPLEX MAP Inflammation and Immunology
http://slidepdf.com/reader/full/milliplex-map-inflammation-and-immunology 10/428
Specicity
Cross-reactivity between the antibodies and any
of the other analytes in this panel is
nondetectable or negligible.
Assay Specications
• This kit may be used for the analysis of all or any
combination of the above cytokines and chemokines
in serum, plasma and tissue/cell culture supernatant
samples.
• This is an overnight or two-hour incubation assay;
however, for best results an overnight incubation is
recommended.
• This assay requires 25 μL of plasma or serum, or
25 μL cell culture supernatant (users need to
determine appropriate dilutions.)
PERFORMANCE SPECIFICATIONS
Cytokine Concentration (pg/mL) in Normal vs. Septic Human Serum
The MILLIPLEX map Human Cytokine/Chemokine Panel lI was used to compare cytokine and
chemokine concentrations (pg/mL) in serum from normal and septic patients. The graphs
below illustrate these results.
0
1,000
50 0
1,500
2,000
2,500
3,000
3,500
E N A - 7 8
S D F - 1 α
+ β
I L - 1 6
M I P
- 1 d
6 C k
i n e
E O T A X I N - 2
E O T A X I N - 3
I L - 2 3
T
P O
C o n c e n t r a t i o n ( p g / m L )
Analytes
Human Cytokine/Chemokine Panel II
Normal vs. Sepsis Sample
Normal (n=27)
Sepsis (n=12)
0
10 0
50
15 0
20 0
25 0
30 0
35 0
40 0
M
C P - 2
M
C P - 4
B C A - 1
I - 3
0 9
T A
R C
C T A
C K
L I F
T R
A I L
S C F
T S L P
I L - 2 0
I L - 2 1
I L - 2 8 a
I L - 3 3
C o n c e n t r a t i o n ( p g / m L )
Analytes
Human Cytokine/Chemokine Panel II
Normal vs. Sepsis Sample
Normal (n=27)
Sepsis (n=12)
Human Cytokine/Chemokine Panel II Magnetic and Non-Magnetic Bead Format

8/6/2019 MILLIPLEX MAP Inflammation and Immunology
http://slidepdf.com/reader/full/milliplex-map-inflammation-and-immunology 11/42 9
AnalyteStandard Curve
Range(pg/mL)
Sensitivity *+2SD
(pg/mL)
Precision
Accuracy(%)Intra-
Assay(%CV)
Inter-Assay(%CV)
6Ckine 19.5 – 20,000 45.4 9 14 93
BCA-1 1.0 – 1,000 1.3 5 6 101
CTACK 4.9 – 5,000 1.8 8 9 99
ENA-78 19.5 – 20,000 7.2 4 6 108
Eotaxin-2 9.8 – 10,000 4.4 5 8 100
Eotaxin-3 48.8 – 50,000 8.7 8 15 104
I-309 2.0 – 2,000 1.4 7 11 103
IL-16 9.8 – 10,000 9.1 4 17 97
IL-20 48.8 – 50,000 53.3 5 8 99
IL-21 19.5 – 20,000 6.8 6 13 100
IL-23 48.8 – 50,000 31.5 5 8 100
IL-28A 9.8 – 10,000 7.9 4 10 99
IL-33 19.5 – 20,000 6.2 5 7 104
LIF 19.5 – 20,000 5.8 6 12 102
MCP-2 4.9 – 5,000 2.2 5 7 106
MCP-4 9.8 – 10,000 3.4 4 6 105
MIP-1d 48.8 – 50,000 10.5 5 12 94
SCF 9.8 – 10,000 5.6 7 12 99
SDF-1+b 97.7 – 100,000 55.8 11 9 81
TARC 1.0 – 1,000 0.4 6 10 101
TPO 48.8 – 50,000 37.9 9 10 100
TRAIL 9.8 – 10,000 3.5 5 10 103
TSLP 9.8 – 10,000 3.1 7 14 110
*See Protocol for the most recently updated values.
Human Cytokine/Chemokine Magnetic Bead Panel II
Magnetic Bead Standard Curve in Matrix
100,000
10,000
1,000
100
1
10
0 1 0
0
1 , 0 0
0
1 0 , 0 0 0
1 0 0 , 0 0
0
M e d i a n F l u o r e s c e
n c e I n t e n s i t y ( M F I )
Concentration (pg/mL)
1 0 1
Eotaxin-2
Eotaxin-3
LIF
TPO
SCF
TSLP
IL-33
IL-20
IL-21
IL-23
IL-28A
TRAIL
CTACK
SDF
ENA-78
MIP-1d
MCP-2
BCA-1
MCP-4
I-309
IL-16
TARC
6CKine
Human Cytokine/Chemokine Magnetic Bead Panel II

8/6/2019 MILLIPLEX MAP Inflammation and Immunology
http://slidepdf.com/reader/full/milliplex-map-inflammation-and-immunology 12/420
Specicity
Cross-reactivity between the antibodies and any of
the other analytes in this panel is nondetectable or
negligible.
Assay Specications
• This kit may be used for the analysis of all or any
combination of the above cytokines and
chemokines in tissue/cell lysate and culture
supernatant samples.
• This kit can also be used in serum or plasma
samples for the analysis of all or any combination
of the above cytokines and chemokines with the
exception of NAP2/CXCL7 and HCC-1/CCL14 due to
high concentrations of these two analytes in blood.
Serum or plasma samples should be diluted 1:100
when this kit is used for analyzing NAP2/CXCL7 and
HCC-1/CCL14a.
• This is an overnight or two-hour incubation assay;
however, for best results an overnight incubation is
recommended.
• This assay requires 25 μL of neat or diluted plasma
or serum, or 25 μL cell culture supernatant.
PERFORMANCE SPECIFICATIONS
Cytokine Concentration (pg/mL) in Normal vs. Septic Human Serum
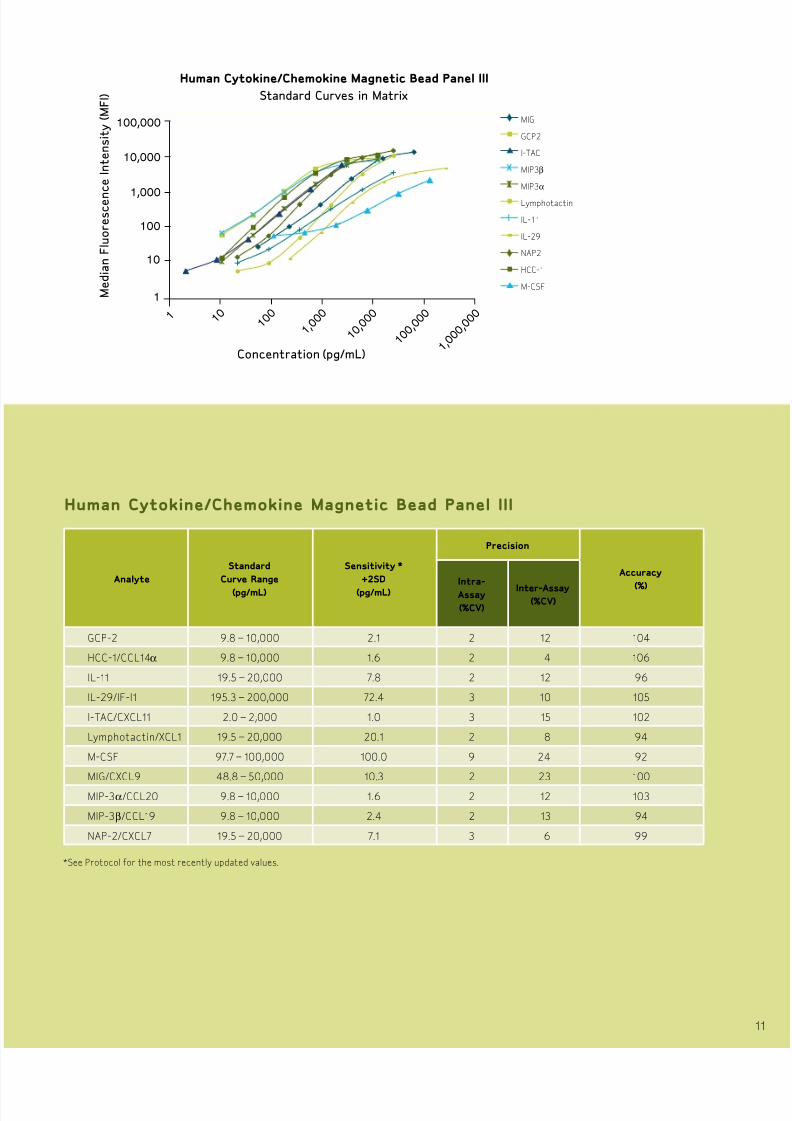
The MILLIPLEX map Human Cytokine/Chemokine Panel lII was used to compare cytokine and chemokine
concentrations (pg/mL) in serum from normal and septic patients. The graphs below illustrate
these results.
0
2,000
1,000
3,000
4,000
5,000
6,000
7,000
M
- C S F
M I G
G C P 2
I T A C
M I P 3 β
M I P 3 α
L y m
p h o t a c t i n
I L - 1 1
I L - 2 9
C o n c e n t r a t i o n ( p g / m L )
Analytes
Human Cytokine/Chemokine Panel III
Normal vs. Sepsis Sample
Normal (n=27)
Sepsis (n=12)
0
10 0
20 0
30 0
40 0
50 0
60 0
70 0
N A P 2 H C C 1
C o n c e n t r a t i o n ( p g / m L x 1 0 0 0 )
Analytes
Human Cytokine/Chemokine Panel III
Normal vs. Sepsis Sample
Normal (n=27)
Sepsis (n=12)
Human Cytokine/Chemokine Panel III Magnetic and Non-Magnetic Bead Format
Human Cytokine/Chemokine Panel III Magnetic and Non-Magnetic Bead Format
8/6/2019 MILLIPLEX MAP Inflammation and Immunology
http://slidepdf.com/reader/full/milliplex-map-inflammation-and-immunology 13/42 11
Analyte
Standard
Curve Range
(pg/mL)
Sensitivity *
+2SD
(pg/mL)
Precision
Accuracy
(%)
Intra-
Assay
(%CV)
Inter-Assay(%CV)
GCP-2 9.8 – 10,000 2.1 2 12 104
HCC-1/CCL14 9.8 – 10,000 1.6 2 4 106
IL-11 19.5 – 20,000 7.8 2 12 96
IL-29/IF-l1 195.3 – 200,000 72.4 3 10 105
I-TAC/CXCL11 2.0 – 2,000 1.0 3 15 102
Lymphotactin/XCL1 19.5 – 20,000 20.1 2 8 94
M-CSF 97.7 – 100,000 100.0 9 24 92
MIG/CXCL9 48.8 – 50,000 10.3 2 23 100
MIP-3/CCL20 9.8 – 10,000 1.6 2 12 103
MIP-3b/CCL19 9.8 – 10,000 2.4 2 13 94
NAP-2/CXCL7 19.5 – 20,000 7.1 3 6 99
*See Protocol for the most recently updated values.
Human Cytokine/Chemokine Magnetic Bead Panel III
MIG
GCP2
I-TAC
MIP3β
MIP3α
Lymphotactin
IL-11
IL-29
NAP2
HCC-1
M-CSF
Human Cytokine/Chemokine Magnetic Bead Panel III
Standard Curves in Matrix
100,000
10,000
1,000
100
1
10
1 1 0
0
1 , 0 0
0
1 0 , 0 0 0
1 0 0 ,
0 0 0
M e d i a n F l u o r e s c e n
c e I n t e n s i t y ( M F I )
Concentration (pg/mL)
1 0
1 , 0 0
0 , 0 0
0

8/6/2019 MILLIPLEX MAP Inflammation and Immunology
http://slidepdf.com/reader/full/milliplex-map-inflammation-and-immunology 14/422
Low levels of inammation are involved in many
clinical and sub-clinical disease states, such as
cardiovascular disease, diabetes, and cancer.
Measuring sub-picogram levels of cytokines is critical
for understanding the pathogenesis of these diseases.
Combining the advantages of the Luminex xMAP
technology, MILLIPLEX map High Sensitivity Human
Cytokine Multiplex Panel offers high sensitivities,
broad dynamic range and robust assay performance
(accuracy, precision, reproducibility) for the
measurement of most common cytokines in human
serum, plasma and cell/tissue culture samples.
High Sensitivity Human Cytokine Magnetic Bead Panel
Standard Curve in Serum Matrix
100,000
10,000
1,000
100
1
10
0. 0 1
1. 0 0
1 0. 0 0
1 0 0
1 , 0 0
0
M e d i a n F l u o r e s c e n c e I n t e n s i t y ( M F I )
Concentration (pg/mL)
0. 1 0
1 0 , 0 0 0
IL-10
IL-12P70
GM-CSF
IFN-γ
IL-13
IL-1β
IL-2
IL-4
IL-5
IL-6
IL-7
IL-8
TNFα
Standard Curve Ranges
0.13 to 2,000 pg/mL for all analytes
Specicity
Cross-reactivity between the antibodies and any of the
other analytes in this panel is nondetectable or negligible.
Assay Specications
• This kit may be used for the analysis of all or any
combination of the following cytokines in serum,
plasma, other body fluids, and cell/tissue extract
or culture samples.
• This is an overnight assay requiring 50 μL sample size.
PERFORMANCE SPECIFICATIONS
Human High Sensitivity Cytokine/Chemokine Panel Magnetic and Non-Magnetic Bead Format
AnalyteSensitivity *
+2SD Overnight(pg/mL)
Precision Overnight
Accuracy(%)Intra-Assay
(%CV)Inter-Assay
(%CV)
GM-CSF 0.24 12 13 95.3
IFNg 0.26 11 10 91
IL-1b 0.08 9 10 96
IL-2 0.35 9 9 89
IL-4 1.01 11 16 99
IL-5 0.07 14 16 104
IL-6 0.64 12 10 91
IL-7 0.49 11 16 97
IL-8 0.09 8 9 93
IL-10 0.65 10 15 99
IL-12 (p70) 0.49 10 17 92
IL-13 0.34 12 13 99
TNF 0.11 11 10 96
*See Protocol for the most recently updated values.
Human Cytokine/Chemokine Magnetic Bead Panel III

8/6/2019 MILLIPLEX MAP Inflammation and Immunology
http://slidepdf.com/reader/full/milliplex-map-inflammation-and-immunology 15/42 13
IL-6IL-8
MCP-1IL-1ra
MIP-1αsCD40L TNFα
0 h
1 h
3 h
6 h
0
1000
2000
3000
4000
5000
6000
7000
8000
C o n c e n t r a t i o n ( p g / m l )
0 h
1 h
3 h
6 h
IL-2IL-1β IL-10
GM-CSF IL-4IL-13
0.0
1.0
2.0
3.0
4.0
5.0
6.0
7.0
C o n c e n t r a t i o n ( p g / m l )
G-CSFIL-12
MIP-1β IL-18IFN-γ
0
50
100
150
200
250
300
350
400
450
500
C o n c e n t r a t i o n ( p g / m l )
0 h
1 h
3 h
6 h
0 h
1 h
3 h
6 h
VEGFTGFα
IL-5IL-15
IL-17
0.0
5.0
10.0
15.0
20.0
25.0
C
o n c e n t r a t i o n ( p g / m l )
Detection o Cytokines in Serum Samples rom Rhesus MonkeyChallenged with a Single Does o LPS or 0, 1, 3, & 6 Hours
The MILLIPLEX MAP Non-Human Primate Cytokine/Chemokine Panel was used to determine the
concentration (pg/mL) of 23 analytes in PBMC and serum samples from multiple non-human primate
species including Baboon, Cynomolgus, African Green and Rhesus. Cytokines in serum samples of normal
and LPS-challenged primates and in PBMC cultures stimulated with LPS showed expected biological change.
The graph below is an example of these results, showing the concentration of cytokines in serum samples
from Rhesus Monkeys after being challenged with a single dose of LPS at 0, 1, 3, and 6 hour time points.
Non-Human Primate Cytokine/Chemokine PanelMagnetic and Non-Magnetic Bead Format

8/6/2019 MILLIPLEX MAP Inflammation and Immunology
http://slidepdf.com/reader/full/milliplex-map-inflammation-and-immunology 16/424
Detection o LPS or PHA Responses in PBMC rom Multiple Non-Human
Primate Species
This study was done in collaboration with Dr. Luis D. Giavedoni at the Southwest Foundation for Biomedical Research. Tested
samples are from PHA/LPS stimulated PBMC from two individual animals of each species.
Cytokine Chimpanzee Baboon Rhesus Cynomolgus Pig-TailArican
GreenMarmoset
sCD40 Ligand +++ +++ +++ +++ +++ +++ —
G-CSF +++ +++ +++ +++ +++ ++ —
GM-CSF +++ +++ +++ +++ +++ +++ —
IFNg +++ +++ +++ +++ +++ +++ —
IL-1b +++ +++ +++ +++ +++ +/– +++
IL-1ra +++ +++ +++ +++ +++ +++ +/–
IL-2 +++ +++ +++ +++ +++ +++ NA
IL-4 +++ +++ +++ +++ +++ +++ —
IL-5 +++ +++ +++ +++ +++ +++ —
IL-6 +++ +++ +++ +++ +++ +++ —
IL-8 +++ +++ +++ +++ +++ +++ —
NEW IL-10 +++ NA +++ +++ NA NA NA
IL-12/23
(p40)+++ ++ +++ ++ ++ ++ —
IL-13 +++ +++ +++ +++ +++ +++ —
IL-15 +++ +++ +++ +++ +++ +++ —
IL-17 +++ +++ +++ +++ +++ +++ +++
IL-18 +++ +++ +++ +++ +++ +++ —
MCP-1 +++ +++ +++ +++ +++ +++ —
MIP-1a +++ +++ +++ +++ +++ +++ —
MIP-1a +++ +++ +++ +++ +++ ++ +++
TGF a NA — +++ +++ NA +++ NA
TNF a +++ +++ +++ +++ +++ +++ —
RANTES1 +++ +++ +++ +++ NA +++ NA
VEGF +++ +++ +++ +++ +++ +++ +++
Degree of cross-reactivity in LPS-
or PHA-stimulated PBMC cultures.
+++ Strong cross-reactivity
++ Mild cross-reactivity
+ Weak cross-reactivity
— No detectable response
NA No data available
1RANTES was analyzed using human RANTES reagents from the MILLIPLEX
map Human Cytokine/Chemokine Panel (Catalogue No. MPXHCYT0-60K).
RANTES measurement in serum or plasma requires a dilution.

8/6/2019 MILLIPLEX MAP Inflammation and Immunology
http://slidepdf.com/reader/full/milliplex-map-inflammation-and-immunology 17/42 15
Analyte
Sensitivity *
+2SD Overnight
(pg/mL)
Precision Overnight
Accuracy
(%)Intra-Assay
(%CV)
Inter-Assay
(%CV)
sCD40 Ligand 2.1 5 12 90
G-CSF 2.1 18 12 93
GM-CSF 1.8 4 11 99
IFNg 1.6 6 12 92
IL-1b 1.2 5 10 91
IL-1ra 2.4 5 13 90
IL-2 2.1 5 15 90
IL-4 3.1 4 14 94
IL-5 1.5 5 11 96
IL-6 1.6 5 10 87
IL-8 1.1 7 9 89
IL-10 6.4 5 15 101
IL-12/23 (p40) 1.5 13 12 95
IL-13 5.8 5 11 90
IL-15 0.5 5 11 93
IL-17 13 8 10 93
IL-18 6.1 10 10 91
MCP-1 6.1 4 12 90
MIP-1 4.9 4 8 89
MIP-1b 7 7 11 90
TGF 1.1 7 14 98
TNF 1.6 15 15 96
VEGF 13.6 6 14 70
MILLIPLEX MAP
Non-Human Primate Cytokine/Chemokine Panel
Standard Curves100,000
10,000
1,000
100
1
10
0 1 0 1 0 0
1 , 0 0
0
1 0 , 0 0 0
M e d i a n
F l u o r e s c e n c e I n t
e n s i t y ( M F I )
Concentration (pg/mL)
1
IL-1ra IL-12/23 (p40) MIP-1α
G-CSF IL-4 IL-13 sCD40L
GM-CSF IL-5 IL-15 TGFα
IFN γ IL-6 IL-17 TNFα
IL-2 IL-8 MCP-1 VEGF
IL-1β IL-10 MIP-1β IL-18
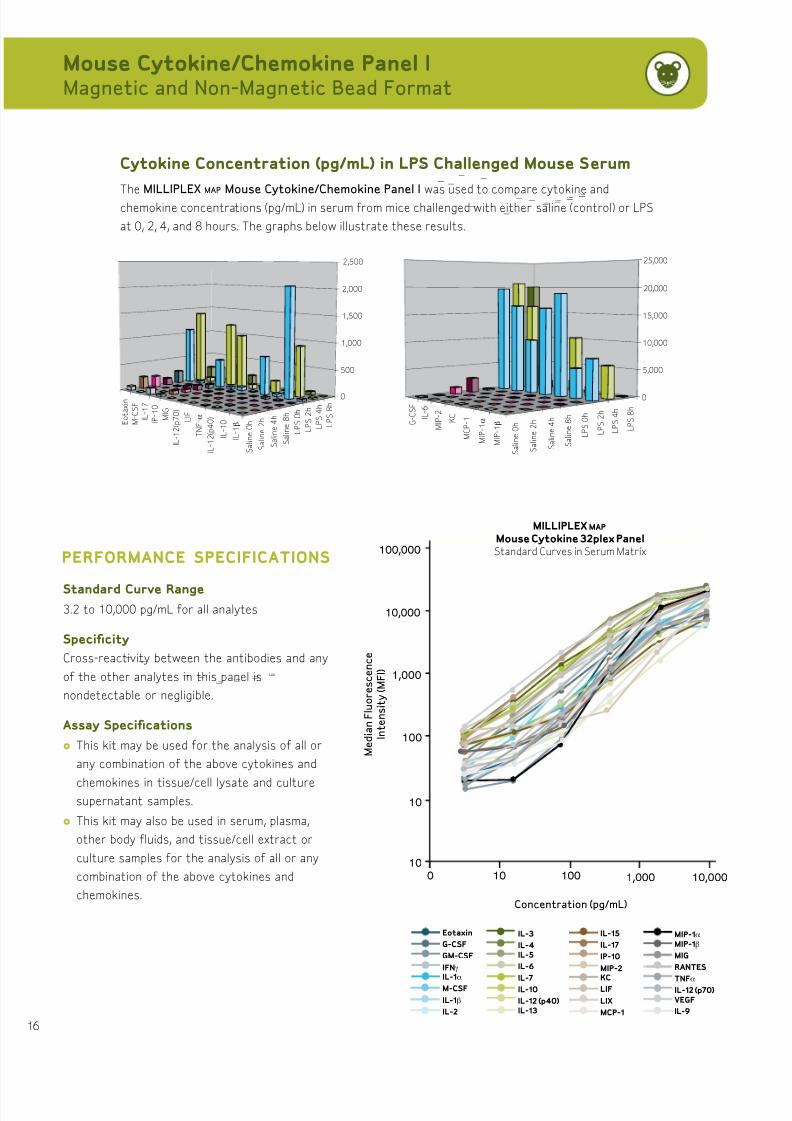
Standard Curve Range
0.6 to 10,000 pg/mL for all analytes
Specicity
Cross-reactivity between the antibodies and
any of the other analytes in this panel is
nondetectable or negligible.
Assay Specications
• This kit may be used for the analysis of all
or any combination of the following
cytokines in serum, plasma, other body
fluids, and cell/tissue extract or culture
samples.
• This assay can be run using either an
overnight or a 3-hour incubation.
PERFORMANCE SPECIFICATIONS
*See Protocol for the most recently updated values.
Non-Human Primate Cytokine/Chemokine Panel
Magnetic Bead Format
8/6/2019 MILLIPLEX MAP Inflammation and Immunology
http://slidepdf.com/reader/full/milliplex-map-inflammation-and-immunology 18/42

8/6/2019 MILLIPLEX MAP Inflammation and Immunology
http://slidepdf.com/reader/full/milliplex-map-inflammation-and-immunology 19/42 17
Analyte
Sensitivity* +2SD Precision
Accuracy(%)Overnight
Protocol(pg/mL)
Short Protocol(pg/mL)
Intra-Assay(%CV)
Inter-Assay(%CV)
Eotaxin ** 4.4 5.5 101.1 7.4 101.1
G-CSF 0.9 2.8 8.4 8.0 100.1
GM-CSF 5.6 9.5 8.0 5.4 99.2
IFNg 0.9 2.3 5.9 7.1 99.1
IL-1 5.1 5.7 7.3 6.2 93.4
IL-1b 2.0 2.7 8.1 7.0 101.4
IL-2 0.8 0.8 5.6 4.2 100.3
IL-3 ** 0.7 1.8 9.1 5.4 100.3
IL-4 0.4 0.5 8.1 8.5 100.6
IL-5 0.7 1.2 9.7 4.7 100.3
IL-6 1.8 3.4 10.4 7.9 100.4
IL-7 0.9 2.9 8.8 6.9 100.1
IL-9 6.0 11.5 8.0 7.1 100.5
IL-10 3.3 8 7 10.1 100.4
IL-12 (p40) 4.9 10.2 8.7 9 102.5
IL-12 (p70) 4.1 5.7 7.6 5.5 100.4
IL-13 6.3 10.8 11.9 10.9 100.1
IL-15 6.5 9.8 9.4 11.9 103.8
IL-17A ** 0.5 0.8 7.5 6.3 99.6
IP-10 0.6 1.1 10 10.3 103.2
KC 1.4 1.8 9.9 10.9 100.5
LIF ** 0.8 1.9 9.2 7.6 100.2
LIX ** 7.6 11.2 5.2 5.9 100.5
MCP-1 5.3 9.1 5.8 4.4 101.7
M-CSF ** 1.1 1.8 11.3 11.5 100.4
MIG ** 1 1.9 10.3 20.4 100.8
MIP-1 8.7 29.5 7 8.4 100.4
MIP-1b 10.1 14.8 5 6.3 103
MIP-2 63.6 54.9 21.3 21.2 123.2
RANTES 2.5 1.9 10.3 13 100.5
TNF 1 1.4 16.3 11.8 105.1
VEGF ** 0.3 0.4 7.9 12.1 100.1
*See Protocol for the most recently updated values. ** Coming Soon in magnetic bead format.
Mouse Cytokine/Chemokine Non-Magnetic Panel I

8/6/2019 MILLIPLEX MAP Inflammation and Immunology
http://slidepdf.com/reader/full/milliplex-map-inflammation-and-immunology 20/428
Cytokine Concentration (pg/mL) in LPS Challenged Mouse Serum
The MILLIPLEX map Mouse Cytokine /Chemokine Panel II was used to compare cytokine and
chemokine concentrations (pg/mL) in serum from mice challenged with either saline (control) or LPS.
The graph below illustrates these results.
Specicity
Cross-reactivity between the antibodies and any
of the other analytes in this panel is non-
detectable or negligible.
Assay Specications
• This kit may be used for the analysis of all or
any combination of the above cytokines and
chemokines in serum, plasma and tissue/cell
culture supernatant samples.
• This is an overnight or two-hour incubation
assay; however, for best results an overnight
incubation is recommended.
• This assay requires 25 μL of plasma or serum,
or 25 μL cell culture supernatant (users need
to determine appropriate dilutions).
PERFORMANCE SPECIFICATIONS
MILLIPLEX MAP
Mouse Cytokine Panel IIStandard Curve in Serum Matrix
100,000
10,000
1,000
10
100
1
1 0 0
1 , 0 0 0
1 0 , 0 0 0
1 0 0 , 0
0 0
M e d i a n
F l u o r e s c e n c e I n t e n s i t y ( M F I )
Concentration (pg/mL)
1 0
EPO
Exodus-2
MCP-5
MIP-3α
TARC
MIP-3β
IL-16
Fractalkine
IL-21
IL-22
IL-25
IL-28B
0
500
1,000
1,500
2,000
2,500
E P O
E x o
d u s -
2
M
C P
- 5
M
I P -
3 β
T A R C
M
I P 3 α
F r a c
t a
k i
n e
I L
- 2 1
I L -
2 2
I L -
2 5
I L -
2 8 B
C o n c e n t r a t i o n ( p g / m L )
Analytes
Cytokine Concentrations in
Saline vs. LPS Challenged Mouse Serum
Saline Challenged
LPS Challenged
Mouse Cytokine/Chemokine Panel II Magnetic and Non-Magnetic Bead Format

8/6/2019 MILLIPLEX MAP Inflammation and Immunology
http://slidepdf.com/reader/full/milliplex-map-inflammation-and-immunology 21/42 19
Mouse Cytokine/Chemokine Magnetic Bead Panel II
Analyte
Sensitivity *
+2SD Overnight(pg/mL)
Precision
Accuracy
(%)Intra-Assay(%CV)
Inter-Assay(%CV)
EPO 22 3 11 100
Exodus-2 14 4 6 95
Fractalkine 120 3 14 100
IL-16 30 2 8 94
IL-21 15 4 10 101
IL-22 2 2 10 104
IL-25 350 4 7 108
IL-28B 17 2 7 96
MCP-5 2 3 6 100
MIP-3 9 1 7 98
MIP-3b 20 1 10 98
TARC 3 2 10 100
*See Protocol for the most recently updated values.

8/6/2019 MILLIPLEX MAP Inflammation and Immunology
http://slidepdf.com/reader/full/milliplex-map-inflammation-and-immunology 22/420
Specicity
Cross-reactivity between the antibodies and any
of the other analytes in this panel is non-
detectable or negligible.
Assay Specications
• This kit may be used for the analysis of all or
any combination of the above cytokines and
chemokines in serum, plasma and tissue/cell
culture supernatant samples.
• This is an overnight or two-hour incubation
assay; however, for best results an overnight
incubation is recommended.
• This assay requires 25 μL of plasma or serum,
or 25 μL cell culture supernatant (users need to
determine appropriate dilutions).
PERFORMANCE SPECIFICATIONSMILLIPLEX MAP
Mouse Cytokine Panel III
Standard Curve in Serum Matrix
100,000
10,000
1,000
10
100
1 1 0
0
1 , 0 0
0
1 0 , 0 0 0
1 0 0 , 0 0
0
M e d i a n F l u o r e s c e n c e I n t e n s i t y ( M F I )
Concentration (pg/mL)
1 0
MDC
IL-23
IL-27
TIMP-1
IL-20
IL-33
AnalyteStandard
Curve Range(pg/mL)
Sensitivity* +2SD Precision
Accuracy(%)Overnight
Protocol(pg/mL)
ShortProtocol(pg/mL)
Intra-Assay(%CV)
Inter-Assay(%CV)
IL-20 16 – 50,000 46.0 116.0 10.7 12.6 106.5
IL-23 32 – 100,000 21.6 32.0 8.1 10.6 100.4
IL-27 32 – 100,000 80.4 95.5 10.5 13.2 98.8
IL-33 32 – 100,000 5.8 6.5 10.7 12.6 103.1
MDC 3.2 – 10,000 0.5 0.5 7.7 15.6 97.3
TIMP-1 3.2 – 10,000 2.7 3.8 5.3 16.3 101.0
*See Protocol for the most recently updated values.
Mouse Cytokine/Chemokine Panel III Non-Magnetic Bead Format
8/6/2019 MILLIPLEX MAP Inflammation and Immunology
http://slidepdf.com/reader/full/milliplex-map-inflammation-and-immunology 23/42 21
AnalyteSensitivity *
+2SD(pg/mL)
Precision
Accuracy(%)Intra-
Assay(%CV)
Inter-Assay(%CV)
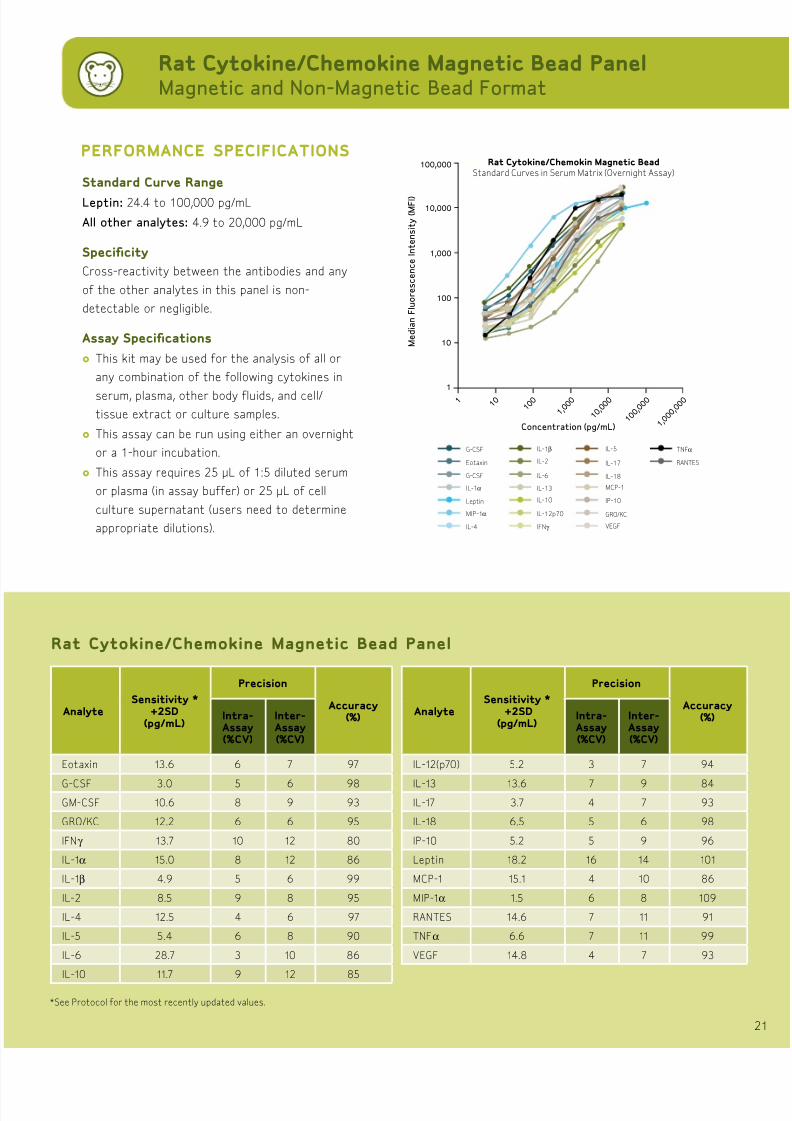
Eotaxin 13.6 6 7 97
G-CSF 3.0 5 6 98GM-CSF 10.6 8 9 93
GRO/KC 12.2 6 6 95
IFNg 13.7 10 12 80
IL-1 15.0 8 12 86
IL-1b 4.9 5 6 99
IL-2 8.5 9 8 95
IL-4 12.5 4 6 97
IL-5 5.4 6 8 90
IL-6 28.7 3 10 86
IL-10 11.7 9 12 85
AnalyteSensitivity *
+2SD(pg/mL)
Precision
Accuracy(%)Intra-
Assay(%CV)
Inter-Assay(%CV)
IL-12(p70) 5.2 3 7 94
IL-13 13.6 7 9 84IL-17 3.7 4 7 93
IL-18 6.5 5 6 98
IP-10 5.2 5 9 96
Leptin 18.2 16 14 101
MCP-1 15.1 4 10 86
MIP-1 1.5 6 8 109
RANTES 14.6 7 11 91
TNF 6.6 7 11 99
VEGF 14.8 4 7 93
*See Protocol for the most recently updated values.
Rat Cytokine/Chemokine Magnetic Bead Panel
100,000
10,000
1,000
100
1
10
1 1 0 1 0 0
1 , 0 0
0
M e d i a n F l u o r e s c e n c e I n t e n s i t y ( M F I )
Concentration (pg/mL)
1 0 , 0 0 0
1 0 0 , 0 0
0
1 , 0 0
0 , 0 0
0
G-CSF
Eotaxin
G-CSF
IL-1α
Leptin
MIP-1α
IL-4
IL-1β
IL-2
IL-6
IL-13
IL-10
IL-12p70
IFNγ
IL-5
IL-17
IL-18
MCP-1
IP-10
GRO/KC
VEGF
TNFα
RANTES
Rat Cytokine/Chemokin Magnetic Bead
Standard Curves in Serum Matrix (Overnight Assay)Standard Curve Range
Leptin: 24.4 to 100,000 pg/mL
All other analytes: 4.9 to 20,000 pg/mL
Specicity
Cross-reactivity between the antibodies and any
of the other analytes in this panel is non-
detectable or negligible.
Assay Specications
• This kit may be used for the analysis of all or
any combination of the following cytokines in
serum, plasma, other body fluids, and cell/
tissue extract or culture samples.
• This assay can be run using either an overnight
or a 1-hour incubation.
• This assay requires 25 μL of 1:5 diluted serum
or plasma (in assay buffer) or 25 μL of cell
culture supernatant (users need to determine
appropriate dilutions).
PERFORMANCE SPECIFICATIONS
Rat Cytokine/Chemokine Magnetic Bead Panel Magnetic and Non-Magnetic Bead Format

8/6/2019 MILLIPLEX MAP Inflammation and Immunology
http://slidepdf.com/reader/full/milliplex-map-inflammation-and-immunology 24/422
Standard Curve Range
3.2 to 50,000 pg/mL for all analytes
Specicity
Cross-reactivity between the antibodies and any
of the other analytes in this panel is
nondetectable or negligible.
Assay Specications
• This kit may be used for the analysis of all or
any combination of the following cytokines in
serum, plasma, other body fluids, and cell/tissue
extract or culture samples.
• This assay can be run using either an overnight
or a 2-hour incubation.
• This assay requires 25 μL of 1:3 diluted serum
or plasma (in assay buffer) or 25 μL of cell
culture supernatant (users need to determine
appropriate dilutions).
PERFORMANCE SPECIFICATIONS
Analyte
Sensitivity* +2SD Precision Accuracy
OvernightProtocol(pg/mL)
ShortProtocol(pg/mL)
Intra-Assay(%CV)
Inter-Assay(%CV)
Serum Matrix(%)
TissueCulture (%)
GM-CSF 14.4 17.6 8.9 13.6 103.9 101.0
INFg 4.4 1.7 8.0 17.6 149.6 98.0
IP-10 2.4 0.7 14.2 14.5 101.6 113.5
IL-2 6.4 7.3 9.1 17.2 115.6 106.0
IL-4 28.8 66.6 11.6 19.2 109.0 108.1
IL-6 12.1 19.3 3.9 15.8 102.4 104.2
IL-7 4.6 5.9 6.2 10.3 102.9 100.1
IL-8 20.3 35.7 15.6 15.2 82.2 114.3
IL-10 1.6 23.0 5.9 16.3 99.0 103.5
IL-15 14.8 14.4 8.3 15.9 112.4 112.8
IL-18 4.6 10.9 6.0 12.5 102.6 103.5
KC-like 1.6 0.8 11.5 18.4 100.3 98.0
MCP-1 8.6 9.5 13.8 19.1 93.6 98.0
TNF 0.4 0.4 13.2 20.0 103.2 102.3
GM-CSF
IFNγ
KC
IP-10
IL-2
IL-4
IL-6
IL-7
IL-10
IL-15
IL-18
MCP-1
TNFα
IL-8
M F I ( A l l a n a l y t e s e x c e p t I L - 8 )
M F I ( I L - 8 )
Concentration (pg/mL)
MILLIPLEX MAP
Canine 14-Plex Panel
Standard Curves in Serum Matrix
100,000
10,000
1,000
100
1 1.000
10,000
100,000
10
1 1 0 1 0 0
1 , 0 0
0
1 0 , 0 0 0
1 0 0 , 0 0
0
*See Protocol for the most recently updated values.
Canine Cytokine/Chemokine Panel Non-Magnetic Bead Format

8/6/2019 MILLIPLEX MAP Inflammation and Immunology
http://slidepdf.com/reader/full/milliplex-map-inflammation-and-immunology 25/42 23
MILLIPLEX MAP Transorming Growth Factor Beta
The transforming growth factor beta (TGFb) system, a superfamily of cytokines
as well as signaling pathways, is highly conserved throughout the animal kingdom.
TGFb functions in angiogenesis, wound healing and embryonic development. In
addition this family plays a critical role in immunity, heart disease, and cancer.
In its normal state TGFb is one of the few classes of proteins able to inhibit
cell growth by halting mitosis at the G1 state, inducing cell differentiation or
apoptosis. However, oncogenic mutations in the TGFb pathway cause tumor-cell
resistance to the effects of normally functioning TGFb , resulting in proliferation
without regulation. Initial research suggests that VE-cadherin may enhance
the mutated TGFb signaling pathway, while other research indicates that DNA
methylation plays a role in pathway mutation.
Secreted TGFb cytokine exists in three isoforms: TGFb1, TGFb2 and TGFb3.
Secreted by most immune cells, TGFb1 plays a critical role in controlling the
immune system, acting on cells differently depending on cell type as well as
stage of differentiation. TGFb2, also known as glioblastoma-derived T-cell
suppressor factor (G-TSF), plays a role in embryonic development and has the
ability to suppress the effects of interleukin-dependent T-cell tumors. TGFb3
regulates cellular adhesion molecules and extracellular matrix formation, as well
as lung and palate development. TGFb3 deciency during mammalian development
results in the cleft palate deformity. In addition TGFb3 controls wound healing by
regulating epidermal and dermal cell movement in injured skin.
TGFb’s involvement in basic biological processes and the opposing roles that both
the normal and mutated proteins play in tumor cell proliferation emphasize the
importance of this cytokine in a variety of research areas. Based on the Luminex
xMAP platform, our MILLIPLEX MAP Multi-Species TGFb1 Single Plex and
TGFb 3-Plex kits have been optimized for performance and ease of use.

8/6/2019 MILLIPLEX MAP Inflammation and Immunology
http://slidepdf.com/reader/full/milliplex-map-inflammation-and-immunology 26/424
Specicity
This kit, which contains human TGFb1, may be
used to detect TGFb1 in human, rat, mouse,
cynomolgous monkey, horse, rabbit, dog, cat,
guinea pig, pig and hamster. However, the
amount of species cross-reactivity has not
been determined.
Assay Specications
• Because platelet granules containing TGFb1,
which is released upon platelet activation,
collecting platelet-poor plasma samples is
recommended.
• TGFb is secreted in a latent or inactive form;
therefore, serum, plasma and serum-
containing culture samples require acid
treatment before testing to remove the
latency-associated peptide (LAP), releasing
biologically active mature TGFb.
• A 1:30 sample dilution is required for serum
and plasma.
• This is an overnight assay requiring 25 μL
of sample.
PERFORMANCE SPECIFICATIONS
MILLIPLEX MAP TGFβ1 Single Plex
Standard Curve100,000
10,000
1,000
100
10
1
0 1 0 1 0 0
1 , 0 0 0
1 0 , 0 0 0
M e d i a n F l u o r e s c e n c e
I n t e n s i t y ( M F I )
Concentration (pg/mL)
AnalyteStandard Curve Range
(pg/mL)
Sensitivity*+2SD
(pg/mL)
PrecisionAccuracy
(%)Intra-Assay(%CV)
Inter-Assay(%CV)
TGFb1 9.8 - 10,000 10 6 10 91
*See Protocol for the most recently updated values.
TGFb1 Single Plex Non-Magnetic Bead Format
8/6/2019 MILLIPLEX MAP Inflammation and Immunology
http://slidepdf.com/reader/full/milliplex-map-inflammation-and-immunology 27/42 25
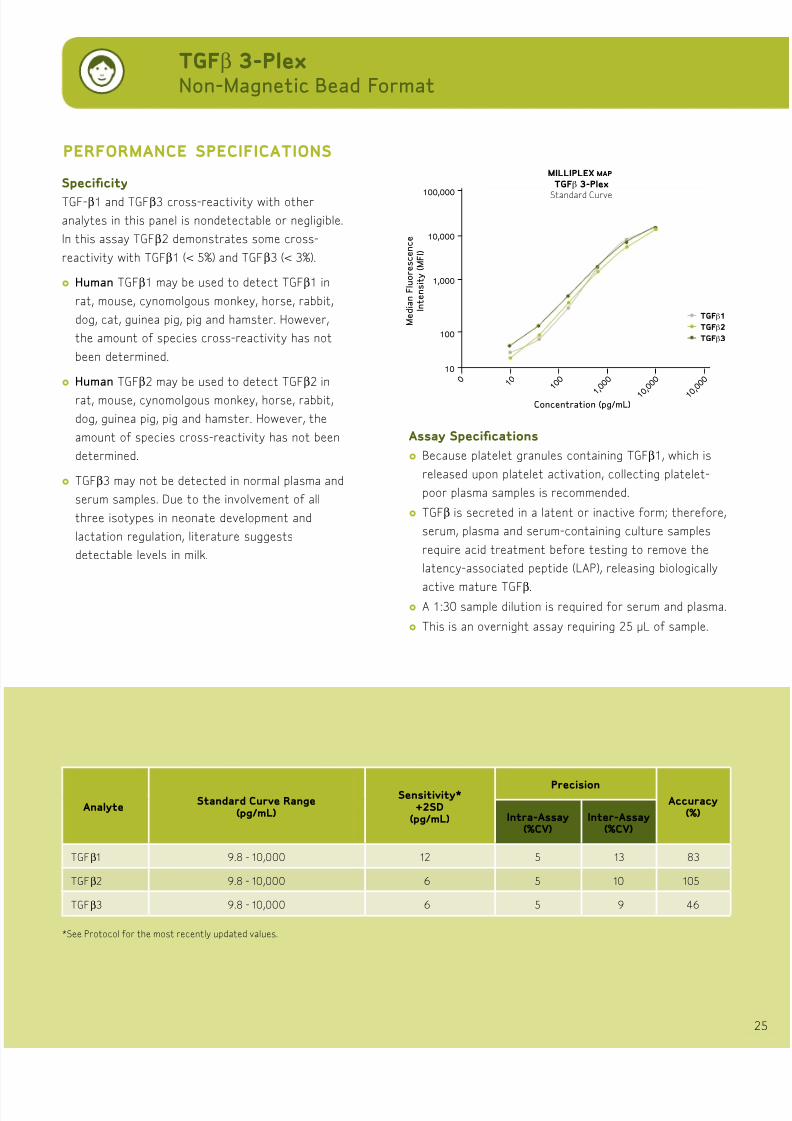
Specicity
TGF-b1 and TGFb3 cross-reactivity with other
analytes in this panel is nondetectable or negligible.
In this assay TGFb2 demonstrates some cross-
reactivity with TGFb1 (< 5%) and TGFb3 (< 3%).
• Human TGFb1 may be used to detect TGFb1 in
rat, mouse, cynomolgous monkey, horse, rabbit,
dog, cat, guinea pig, pig and hamster. However,
the amount of species cross-reactivity has not
been determined.
• Human TGFb2 may be used to detect TGFb2 in
rat, mouse, cynomolgous monkey, horse, rabbit,
dog, guinea pig, pig and hamster. However, the
amount of species cross-reactivity has not been
determined.
• TGFb3 may not be detected in normal plasma and
serum samples. Due to the involvement of all
three isotypes in neonate development and
lactation regulation, literature suggests
detectable levels in milk.
Assay Specications
• Because platelet granules containing TGFb1, which is
released upon platelet activation, collecting platelet-
poor plasma samples is recommended.
• TGFb is secreted in a latent or inactive form; therefore,
serum, plasma and serum-containing culture samples
require acid treatment before testing to remove the
latency-associated peptide (LAP), releasing biologically
active mature TGFb.• A 1:30 sample dilution is required for serum and plasma.
• This is an overnight assay requiring 25 μL of sample.
PERFORMANCE SPECIFICATIONSMILLIPLEX MAP
TGFβ 3-Plex
Standard Curve100,000
10,000
1,000
100
10
0 1 0 1 0 0
1 , 0 0 0
1 0 , 0 0 0
M e d i a n
F l u o r e s c e n c e
I n t e n s i t y ( M F I )
Concentration (pg/mL) 1 0
, 0 0 0
TGFβ1
TGFβ2
TGFβ3
AnalyteStandard Curve Range
(pg/mL)
Sensitivity*+2SD
(pg/mL)
PrecisionAccuracy
(%)Intra-Assay(%CV)
Inter-Assay(%CV)
TGFb1 9.8 - 10,000 12 5 13 83
TGFb2 9.8 - 10,000 6 5 10 105
TGFb3 9.8 - 10,000 6 5 9 46
*See Protocol for the most recently updated values.
TGFb 3-PlexNon-Magnetic Bead Format

8/6/2019 MILLIPLEX MAP Inflammation and Immunology
http://slidepdf.com/reader/full/milliplex-map-inflammation-and-immunology 28/426
MILLIPLEX map Soluble Cytokine Receptors
Like cytokines, soluble cytokine receptors are involved in regulating
inammatory responses and modulating immune events. This has stimulated
signicant research interest in their potential role as biomarkers for various
diseases and for immunotherapeutic agents. Many of these soluble cytokine
receptors have the ability to inhibit the binding and biological activity of their
cytokine ligands, making them very specic cytokine antagonists.
Millipore is the rst to release multiplex panels for the study of soluble cytokine
receptors. This section includes specications for the following panels.
AVAILABLE ANALYTES
THESE ANALTES ARE ALSO KNON AS:
• Soluble CD30 (sCD30, sTNFRSF8)
• Soluble Epidermal Growth Factor Receptor (sEGFR)
• Soluble gp130 (sgp130)
• Soluble Interleukin-1 Receptor Type I (sIL-1RI, sCD121a)
• Soluble Interleukin-1 Receptor Type II (sIL-1RII, sCD121b)
• Soluble Interleukin-2 Receptor (sIL-2Ra, CD25)
• Soluble Interleukin-4 Receptor (sIL-4R, CD124)
• Soluble Interleukin-6 Receptor (sIL-6R, CD126)
• Soluble Receptor for Advanced Glycation Endproducts (sRAGE)
• Soluble Tumor Necrosis Factor Receptor I (sTNFRI, TNFRSF1A)
• Soluble Tumor Necrosis Factor Receptor II (sTNFRII, TNFRSF1B)
• Soluble Vascular Endothelial Growth Factor Receptor 1 (sVEGF-R1, sFlt-1)
• Soluble Vascular Endothelial Growth Factor Receptor 2 (sVEGF-R2, sFlk-1, sKDR)
• Soluble Vascular Endothelial Growth Factor Receptor 3 (sVEGF-R3, sFlt-4)

8/6/2019 MILLIPLEX MAP Inflammation and Immunology
http://slidepdf.com/reader/full/milliplex-map-inflammation-and-immunology 29/42 27
Analyte
Sensitivity* +2SD Precision
Accuracy(%)Overnight
Protocol(pg/mL)
Short Protocol(pg/mL)
Intra-Assay(%CV)
Inter-Assay(%CV)
sCD30 17.9 31.5 4.5 6.8 137.4
sEGFR 191.4 294.3 7.8 12.7 103.1
sgp130 7.2 18.8 4.3 7.5 102.0
sIL-1RI 4.0 7.9 5.1 8.2 117.5
sIL-1RII 45.9 69.9 4.0 6.3 114.7
sIL-2R 15.0 26.1 3.8 6.5 113.3
sIL-4R 16.9 20.2 4.3 7.1 96.9
sIL-6R 3.6 5.8 5.6 8.2 110.3
sRAGE 4.7 7.8 5.2 8.5 120.3
sTNFRI 9.6 25.0 4.1 6.6 116.0
sTNFRII 16.9 23.4 3.7 5.8 114.1
sVEGF-R1 164.5 209.9 6.5 15.8 108.1
sVEGF-R2 497.8 642.8 9.0 14.6 99.8sVEGF-R3 706.9 672.0 7.1 13.3 103.8
Human Soluble Cytokine Receptor PanelNon-Magnetic Bead Format
sCD30
sEGFR
sgp130
sIL-1RI
sIL-1RII
sIL-2Rα
sIL-4R
sIL-6R
sRAGE
sTNFRI
sTNFRII
sVEGF-R1
sVEGF-R2
sVEGF-R3
MILLIPLEX MAP
Human Soluble Cytokine Receptor Multiplex Panel
Standard Curve in Serum Matrix100,000
10,000
1,000
100
10
1 0
1 , 0 0
0
1 0 , 0 0 0
1 0 0 , 0 0
0
1 , 0 0
0 , 0 0
0
M e d i
a n
F l u o r e s c e n c e I n t e n s i t y ( M F I )
Concentration (pg/mL)
1 0 0
PERFORMANCE SPECIFICATIONS
Standard Curve Range
sIL-4R, sIL-6R, sRAGE, sTNFRI, sTNFRII:
12 to 50,000 pg/mL
sCD30, sgp130, sIL-1RI, sIL-2R :
24 to 100,000 pg/mL
sEGFR, sIL-1RII, ssVEGF-R1, sVEGF-R2, sVEGF-R3:
122 to 500,000 pg/mL
Specicity
Cross-reactivity between the antibodies and any
of the other analytes in this panel is nondetectable
or negligible.
Assay Conditions
• This kit may be used for the analysis of all or any
combination of the following cytokines in serum,
plasma, other body fluids, and cell/tissue extract or
culture samples.
• This assay can be run using either an overnight or
a 2-hour incubation period.
• This assay requires 25 μL of 1:5 diluted serum
or plasma (in assay buffer) or 25 μL of cell culture
supernatant (users need to determineappropriate dilutions).
*See Protocol for the most recently updated values.

8/6/2019 MILLIPLEX MAP Inflammation and Immunology
http://slidepdf.com/reader/full/milliplex-map-inflammation-and-immunology 30/428
PERFORMANCE SPECIFICATIONS
100,000
10,000
1,000
100
0
0 1 0 1 0 0
1 , 0 0
0
1 0 , 0 0 0
1 0 0 ,
0 0 0
Concentration (pg/mL)
M e d i a n F l u o r e s c e
n c e
I n t e n s i t y ( M F
I )
sCD30
sgp130
sIL-1RI
sIL-1RII
sIL-2Rα
sIL-4RsIL-6R
sRAGE
sTNFRI
sTNFRII
sVEGF-R1
sVEGF-R2
sVEGF-R3
MILLIPLEX MAP Mouse Soluble Cytokine
Receptor Multiplex Panel
Standard Curve in Serum Matrix
Analyte
Sensitivity* +2SD Precision
Recovery(%)Overnight
Protocol(pg/mL)
Short Protocol(pg/mL)
Intra-Assay(%CV)
Inter-Assay(%CV)
sCD30 6.0 9.3 7.8 9.6 94.2
sgp130 36.0 84.0 6.1 6.9 82.2
sIL-1RI 1.0 2.7 6.6 5.2 92.7
sIL-1RII 4.0 10.6 7.3 7.5 100.4
sIL-2R 2.0 5.7 6.7 7.2 95.1
sIL-4R 2.0 2.6 7.7 7.0 99.6
sIL-6R 8.0 23.7 7.3 7.6 104.8
sRAGE 23.0 23.7 6.3 7.3 77.9
sTNFRI 6.7 21.9 5.6 7.6 103.1
sTNFRII 3.0 4.7 5.4 6.2 95.9
sVEGF-R1 18.0 76.2 8.2 8.9 175.6
sVEGF-R2 11.0 32.6 6.8 7.8 103.2
sVEGF-R2 15.0 41.5 7.4 9.0 100.8
Standard Curve Range
sTNFRI: 4.9 to 20,000 pg/mLsIL-1RI, sIL-1RII, sIL-2Ra, sIL-4R,
sTNFRII, sCD30, sgp130, sIL-6R, sRAGE,
sVEGF-R1: 12.2 to 50,000 pg/mL,
sVEGF-R2, sVEGF-R3: 24.4 to 100,000 pg/mL
Specicity
Cross-reactivity between the antibodies and any of
the other analytes in this panel is nondetectable
or negligible.
Assay Specications• The multiplex kit may be used for the analysis of
all or any combination of the following cytokines in
serum, plasma, other body fluids, and cell/tissue
extract or culture samples.
• The single plex kit may be used for the analysis of
sEGFR in serum, plasma, other body fluids, and
cell/tissue extract or culture samples.
• Both the multiplex and single plex assays can be
run using either an overnight or a 2-hour
incubation period.
• The multiplex assay requires 25 μL of 1:5 diluted
serum or plasma (in assay buffer) or 25 μL of cell
culture supernatant. (Users need to determine
appropriate dilutions).• The single plex assay requires 25 μL of 1:10,000
diluted serum or plasma (in assay buffer) or 25 μL of
cell culture supernatant. (Users need to determine
appropriate dilutions).
*See Protocol for the most recently updated values.
Mouse Soluble Cytokine Receptor Multiplex PanelNon-Magnetic Bead Format

8/6/2019 MILLIPLEX MAP Inflammation and Immunology
http://slidepdf.com/reader/full/milliplex-map-inflammation-and-immunology 31/42 29
SEPSIS
Human Sepsis 1
M I F
P A I - 1
( t o t a l )
s F a s
s F a s L
s I C A M - 1
s V C A M - 1
MILLIPLEX MAP Sepsis and Apoptosis Panels
Sepsis or SIRS (systemic inammatory response syndrome) results
from infection, whether bacterial, viral, fungal or parasitic. Accordingto the CDC, sepsis is the second leading cause of death in non-
coronary ICU patients in the U.S. This hyper-reaction to infection
interrupts homeostasis through an uncontrolled inammatory
response, including glucocorticoids and catecholamines, mediators
of the humoral immune response, as well as pro-inammatory
cytokines such as IL-1 , IL-6 and TNF. Severe sepsis occurs when
hypotension or hypoperfusion to one or more organs leads to organ
dysfunction, which, in turn, can cause septic shock, multiple organ
dysfunction syndrome (MODS) and death.
Apoptosis plays a critical role in the development of severe sepsis
and MODS. Studies involving critically ill patients have demonstrated
that increased apoptosis of lymphoid organs and other organ tissues
contributes to immune suppression, the body’s failure to respond
to an antigen and organ dysfunction. The same pro-inammatory
cytokines and humoral mediators also contribute to the development
of acquired immune defects. During sepsis, lymphocyte apoptosis can
be initiated by the release of glucocorticoids and “death” cytokines
such as TNF and Fas ligand. Understanding this has caused a shift in
interest toward therapies aimed at inhibiting apoptosis and reversing
immune suppression.
Millipore provides important tools to better understand the role of
cytokine biomarkers involved in sepsis and in the apoptotic pathway.
Based on the Luminex xMAP platform, the MILLIPLEX MAP Human
Sepsis Panel 1 assists you in your research to nd an effective
treatment for SIRS.

8/6/2019 MILLIPLEX MAP Inflammation and Immunology
http://slidepdf.com/reader/full/milliplex-map-inflammation-and-immunology 32/420
PERFORMANCE SPECIFICATIONS
Specicity
Cross-reactivity between the antibodies and any
of the other analytes in this panel is non-
detectable or negligible.
Assay Specications
• This kit may be used for the analysis of all or
any combination of the analytes in this panel
in serum, plasma, other body fluids, and cell/
tissue extract or culture samples.
• A 1:10 dilution is required for serum and
plasma samples.
• This is an overnight assay requiring 25 μL
sample size.
AnalyteStandard Curve Range
(pg/mL)
Sensitivity*+2SD
(pg/mL)
Precision
Accuracy(%)Intra-
Assay(%CV)
Inter-Assay(%CV)
sFas 12 – 50,000 7.0 3.5 9.3 71
sFasL 12 – 50,000 7.0 9.5 14.2 89
sICAM-1 61 – 250,000 30.0 5.5 8l7.0 87
MIF 12 – 50,000 10.0 7.0 6.4 79
PAI-1 (total) 12 – 50,000 3.1 4.5 11.1 89
sVCAM-1 61 – 250,000 33.0 4.0 12.0 98
*See Protocol for the most recently updated values.
MILLIPLEX MAP
Human Sepsis Panel 1Standard Curves100,000
10,000
1,000
100
10
1
0 1 0 1 0 0
1 , 0 0
0
1 0 , 0 0 0
M e d i a n F l u o r e s c e n c e
I n t e n s i t y ( M F I )
Concentration (pg/mL)
1 0 0 , 0 0
0
1 , 0 0
0 , 0 0
0
sFasL
sFas
MIF
tPAI-1
sVCAM-1
sICAM-1
Human Sepsis Panel 1

8/6/2019 MILLIPLEX MAP Inflammation and Immunology
http://slidepdf.com/reader/full/milliplex-map-inflammation-and-immunology 33/42 31
MILLIPLEX MAP Isotyping Panels
Produced by plasma cells and lymphocytes, immunoglobulins
(antibodies) are critically involved in immune response,
attaching to antigens and playing a role in their destruction.Immunoglobulins (Ig) can be classied by isotype, classes that
differ in function and antigen response due to structure
variability. Five major isotypes have been identied in placental
mammals: IgM, IgG, IgA, IgE and IgD (B-cell receptor)—all found
in normal individuals. Immunoglobulin-deciency disorders, such
as autoimmune disease, some GI conditions and malignancies,
are characterized by specic isotype deciencies or varying
concentrations of one or more isotypes. Disease states can
range from the absence of one isotype class or subclass to atotal deciency of immunoglobulin classes. In addition, isotyping
applications include analyzing hybridomas during antibody
generation and vaccine development.
Millipore recognizes the need to provide you with the ability to
quantitate immunoglobulin classes and subclasses simultaneously.
Therefore, our non-magnetic bead MILLIPLEX MAP Mouse Isotyping
Kits, and magnetic bead format MILLIPLEX MAP Human Isotyping
Kits, have been designed to enable you to measure both classes
and subclasses accurately—all in one well.
In addition you can design a magnetic bead kit that ts your
needs. The xMAP multiplex technology is ideal for measuring
levels of these isotypes, not only decreasing the number of
assays as well as the amount of sample required, but also greatly
reducing the possible inaccuracies that result from performing
multiple assays.
AVAILABLE ANALYTES
Human Single Plex
Single PlexMouse
I g G
1
I g G
2
I g G
2 A
I g G
2 B
I g G
3
I g G
4
I g A
I g M
I g E

8/6/2019 MILLIPLEX MAP Inflammation and Immunology
http://slidepdf.com/reader/full/milliplex-map-inflammation-and-immunology 34/42

8/6/2019 MILLIPLEX MAP Inflammation and Immunology
http://slidepdf.com/reader/full/milliplex-map-inflammation-and-immunology 35/42 33
AnalyteStandard Curve Range
(ng/mL)Sensitivity*
(ng/mL)
Precision
Accuracy(%)Intra-
Assay(%CV)
Intra-Assay(%CV)
IgG1
2 – 1,500 0.7 4 18 96
IgG2a 3 – 2,000 0.4 6 14 98IgG
2b1 – 900 0.6 4 20 85
IgG3
2 – 1,500 0.8 4 15 76
IgA 5 – 3,000 1.1 15 21 100
IgM 2 – 1,500 0.5 4 17 98
IgE (single plex) 5 - 3,000 1.3 4 13 108
Mouse Isotyping PanelNon-Magnetic Bead Format
PERFORMANCE SPECIFICATIONS
Specicity
Cross-reactivity between the antibodies and any
of the other analytes in this panel is non-
detectable or negligible.
Assay Specications
• This is a 45-minute assay requiring 50 μL
sample size.
• Sample dilution is required for serum, plasma,
and cell culture supernatant.
IgG2b
IgG1
IgG3
IgG2a
IgG2b
IgA
MILLIPLEX MAP
Mouse Immunoglobin IsotypingStandard Curves100,000
10,000
1,000
1
10
1 1 0
0
1 , 0 0
0
1 0 , 0 0 0
M e d i a n F l u o r e s c e n c e I n t e n s i t y ( M F I )
Concentration (ng/mL)
1 0
100
*See Protocol for the most recently updated values.

8/6/2019 MILLIPLEX MAP Inflammation and Immunology
http://slidepdf.com/reader/full/milliplex-map-inflammation-and-immunology 36/424
MILLIPLEX MAP Cytokines and Inlammation/
Immunology Cell Signaling
Pathways
Cytokines—part of the complex system of communication often called signal
transduction—induce and regulate inammation and immunity, as well as
hematopoiesis by binding to specic cell membrane receptors. The cytokine
“signal” is then passed along cell signaling pathways via second messengers,
which are often tyrosine kinases. A terminal signaling event, such as a
transcription factor, is phosphorylated, resulting in the activation of gene
expression that alters the cell’s activity, which includes the differentiation /
proliferation of immune cells, as well as the secretion of effector molecules,
including other cytokines.
Millipore’s broad cell signaling portfolio provides you with options:
• Choose a premixed, analytically validated panel, or
• Design your own kit by choosing MAPmate single plexes
Based on the Luminex xMAP platform MILLIPLEX MAP Cell Signaling offers you
the ability to investigate simultaneously the expression of intracellular total or
phosphorylated protein for the study of inammation / immunology pathways.
Human T Cell Receptor – 7-Plex
(Catalogue No. 48-690)
MILLIPLEX MAP T Cell Receptor Kit is a 7-plex assay that
examines seven phosphorylated proteins involved in
immune response, tumor development and inflamation.
Human MAP Kinase – 10-Plex
(Catalogue No. 48-660)
The complex MAP Kinase pathway connects intracellular
responses to the binding of growth factors via cell
surface receptors. The MILLIPLEX MAP Human MAP Kinase
Kit is a 10-plex assay that examines ten phosphorylated
proteins involved in normal mitosis and tumor
development.
Analyte Phosphorylated
ATF2 (Thr69/71)
ERK/MAP Kinase 1/2 (Thr185/Tyr187)
HSP27 (Ser78)
JNK (Thr183/Tyr185)
cJun (Ser73)
MEK1 (Ser221)
MSK1 (Ser212)
p38 (Thr180/Tyr182)
p53 (Ser15)STAT1 (Tyr707)
Analyte Phosphorylated
CD3e (pan Tyr)CREB (Ser133)
Erk/MAPK 1/2 (Thr185/Tyr187)
LAT (pan Tyr)
Lck (pan Tyr)
Syk (pan Tyr)
ZAP-70 (pan Tyr)
CELL SIGNALING KITS

8/6/2019 MILLIPLEX MAP Inflammation and Immunology
http://slidepdf.com/reader/full/milliplex-map-inflammation-and-immunology 37/42 35
Catalogue
No.MAPmate
Bead
Region
Assay
Buer
1 2
46-604 Active Caspase 3 6 l l
46-656 Cleaved PARP (Asp214) 60 l l
46-601 Phospho Akt/PKB (Ser473),Assay Buffer 1
38 l 6
46-677Phospho Akt/PKB (Ser473),
Assay Buffer 262 6 l
46-645Phospho Akt/PKB (Thr308),
Assay Buffer 138 l 6
46-676Phospho Akt/PKB (Thr308),
Assay Buffer 262 6 l
46-658 Phospho ATF2 (Thr69/71) 39 l l
46-694 Phospho Bad (Ser112) 59 l •
46-660 Phospho Bcl-2 (Ser70) 31 l l
46-622 Phospho c-Jun (Ser73) 52 l •
46-619 Phospho c-Kit (Tyr) 8 l l
46-651 Phospho c-Met/HGFR (Tyr) 46 l l
46-631 Phospho CREB (Ser133) 37 l l
46-603 Phospho EGFR (Tyr) 34 l l
46-649 Phospho ErbB2/Her2 (Tyr) 29 l •
46-602Phospho ERK 1/2
(Thr185/Tyr187)9 6 l
46-690 Phospho GSK3b (Ser9) 49 l •
46-692 Phospho Histone H2A.X (Ser139) 43 l •
46-607 Phospho HSP27 (Ser78) 50 l l
46-647 Phospho IGF1R (Tyr) 48 l l
46-643 Phospho Ik B (Ser32) 33 • l
46-688 Phospho IR (Tyr1162/1163) 65 l l
46-627 Phospho IRS1 (Tyr) 36 l l
46-613Phospho JNK/SAPK1 (Thr183/
Tyr185)16 6 l
46-616 Phospho Lck (Tyr) 20 • l
46-670 Phospho MEK1 (Ser222) 45 • l
46-672Phospho MKK6
(Ser207/Thr211)66 • l
46-674 Phospho MSK1 (Ser212) 75 6 l
46-686 Phospho mTOR (Ser2448) 79 l l
46-610Phospho p38/SAPK (Thr180/Tyr182)
54 6 l
46-663 Phospho p53 (Ser15) 53 • l
46-664 Phospho p53 (Ser46) 53 • l
46-629 Phospho p70S6 Kinase (Thr412) 19 6 l
46-615 Phospho PDGF Receptorb (Tyr) 32 • l
46-614 Phospho PDGF Receptor (Tyr) 21 • l
46-681 Phospho PRAS40 (Thr246) 55 l 6
46-679 Phospho PTEN (Ser380) 63 • l
46-611 Phospho Rsk1 (Ser380) 42 l •
Catalogue
No.MAPmate
Bead
Region
Assay
Buer
1 2
46-655 Phospho STAT1 (Tyr701) 24 • l
46-635 Phospho STAT2 (Tyr690) 67 l l
46-624 Phospho STAT3 (Ser727) 14 l •
46-623 Phospho STAT3 (Tyr705) 14 l •
46-641Phospho STAT5A/B
(Tyr694/Tyr699)35 • l
46-633 Phospho STAT6 (Tyr641) 10 l l
46-661 Phospho ZAP-70 (Tyr) 51 • l
46-675Total Akt/PKB,
Assay Buffer 262 l •
46-605 Total Akt/PKB, Assay Buffer 1 38 l 6
46-657 Total Akt/PKB, Assay Buffer 2 62 6 l
46-695 Total Bad 59 l l
46-659 Total Bcl-2 31 l l
46-620 Total c-Kit 8 l l
46-650 Total c-Met/HGFR 46 l l
46-632 Total CREB 37 l l
46-606 Total EGF Receptor 34 l l
46-648 Total ErbB2/Her2 29 l l
46-609 Total ERK 1/2 9 6 l
46-689 Total GSK3b 49 l •
46-665 Total HIF1 69 l l
46-608 Total HSP27 50 • l
46-667 Total Human GAPDH 15 6 l
46-646 Total IGF1R 48 l l
46-644 Total Ik Ba 33 • l
46-687 Total IR 65 l l
46-628 Total IRS1 36 l l
46-618 Total JNK 16 6 l
46-617 Total Lck 20 • l
46-669 Total MEK1 45 l l
46-671 Total MKK6 66 6 l
46-673 Total MSK1 75 6 l
46-685 Total mTOR 79 l l
46-621 Total p21 28 l •
46-612 Total p38 54 6 l
46-662 Total p53 53 6 l
46-630 Total p70 S6 Kinase 19 l l
46-680 Total PRAS40 55 l 6
46-678 Total PTEN 63 • l
46-654 Total STAT1 24 • l
46-634 Total STAT2 67 l l
46-625 Total STAT3 14 l •
BUFFER SELECTION AND ASSA CONTROL TABLE
lRecommended • Acceptable 6Not Recommended*Required when using MAP mates.

8/6/2019 MILLIPLEX MAP Inflammation and Immunology
http://slidepdf.com/reader/full/milliplex-map-inflammation-and-immunology 38/426
Luminex 200™ SystemMILLIPLEX Analyzer The Luminex 200 System is a
compact lab analysis system that integrates
lasers, optics, fluidics, a controller, advanced
digital signal processing, an XY Platform, the
newest version analysis software, and a PC with
monitor. Specifically designed to enhance the
use of xMAP technology, this system enables
simultaneous assays of up to 100 analytes per
well of a microtiter plate. Key features include:
flexible data analysis package, user friendly
functions, flexible assay design features, bar
code reader for enhanced efficiency and multiple
formats for generating data reports.
Luminex FLEXMAP 3D™ SystemThe FLEXMAP 3D system combines differentially
dyed fluorescent microsphere sets with an
innovative instrument design that can
accommodate measuring the concentrations of
up to 500 unique analytes within a single sample
rapidly and precisely. Features—such as
automated probe height adjustment, simplified
routine maintenance operations and an intuitive
software interface—make FLEXMAP 3D a flexible
and easy-to-use multiplexing platform capable
of performing a variety of protein and nucleic
acid applications.
As a Luminex partner, Millipore is a distributor of Luminex instruments, accessories
and software. We were there at the beginning to help validate Luminex as a standard
of multiplexing, and our ongoing dedication and experience in this technology enable
you to gain more information faster, without compromising reliability. Visit our
website for more information on the following technology.
Instrumentation & Sotware
MAGPIX® SystemCombined with our MILLIPLEX MAG magnetic bead-based
multi-analyte panels, analysis software, and technical
support, the new Luminex MAGPIX system provides a
complete solution for rapid, accurate biomarker quantitation
in a variety of sample matrices. This affordable system
can perform up to 50 tests simultaneously in a single
reaction volume, greatly reducing sample input, reagents
and labor while improving productivity. The MAGPIX
system features an innovative design based on CCD imaging
technology that allows for a more compact, robust system.
In addition it is easy to operate and maintain with
streamlined start-up and shutdown protocols and
minimal maintenance requirements.
8/6/2019 MILLIPLEX MAP Inflammation and Immunology
http://slidepdf.com/reader/full/milliplex-map-inflammation-and-immunology 39/42 37
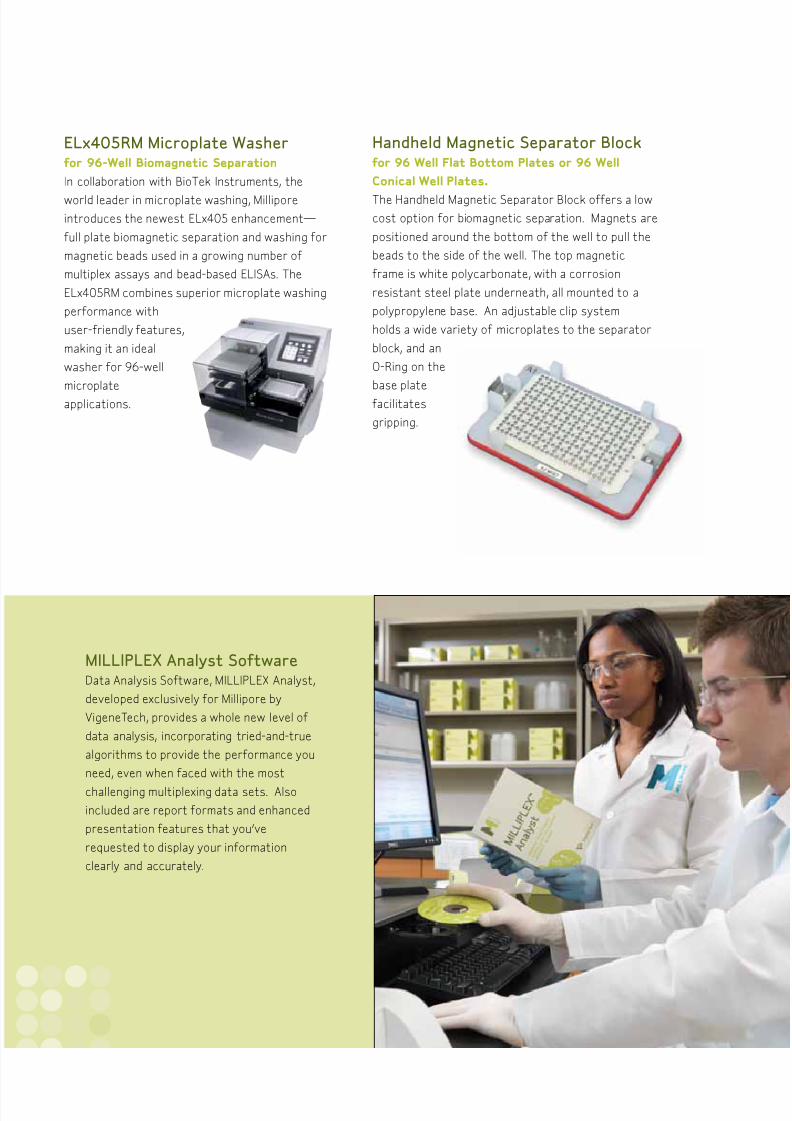
MILLIPLEX Analyst SoftwareData Analysis Software, MILLIPLEX Analyst,
developed exclusively for Millipore by
VigeneTech, provides a whole new level of
data analysis, incorporating tried-and-true
algorithms to provide the performance you
need, even when faced with the most
challenging multiplexing data sets. Also
included are report formats and enhanced
presentation features that you’ve
requested to display your information
clearly and accurately.
Handheld Magnetic Separator Blockor 96 ell Flat Bottom Plates or 96 ell
Conical ell Plates.
The Handheld Magnetic Separator Block offers a low
cost option for biomagnetic separation. Magnets are
positioned around the bottom of the well to pull the
beads to the side of the well. The top magnetic
frame is white polycarbonate, with a corrosion
resistant steel plate underneath, all mounted to a
polypropylene base. An adjustable clip system
holds a wide variety of microplates to the separator
block, and an
O-Ring on the
base plate
facilitates
gripping.
ELx405RM Microplate Washeror 96-ell Biomagnetic Separation
In collaboration with BioTek Instruments, the
world leader in microplate washing, Millipore
introduces the newest ELx405 enhancement—
full plate biomagnetic separation and washing for
magnetic beads used in a growing number of
multiplex assays and bead-based ELISAs. The
ELx405RM combines superior microplate washing
performance with
user-friendly features,
making it an ideal
washer for 96-well
microplate
applications.

8/6/2019 MILLIPLEX MAP Inflammation and Immunology
http://slidepdf.com/reader/full/milliplex-map-inflammation-and-immunology 40/428
DescriptionMagnetic
Catalogue No.
Non-Magnetic
Catalogue No.
Human Cytokine Human Cytokine/Chemokine Panel I HCYTOMAG-60K MPXHCYTO-60K
Human Cytokine/Chemokine Panel I Pre-mixed 14-Plex Kit MPXHCYTO60KPMX14
Human Cytokine/Chemokine Panel I Pre-mixed 26-Plex Kit MPXHCYTO60KPMX26
Human Cytokine/Chemokine Panel I Pre-mixed 29-Plex Kit HCYTOMAG-PX29
Human Cytokine/Chemokine Panel I Pre-mixed 39-Plex Kit HCYTOMAG-60K-PX39 MPXHCYTO60KPMX39
Human Cytokine/Chemokine Panel I Pre-mixed 42-Plex Kit
(Tissue Culture Only)HCYTOMAG-60K-PX42 MPXHCYTO60KPMX42
Human Cytokine/Chemokine Panel II HCYP2MAG-62K MPXHCYP2-62K
Human Cytokine/Chemokine Panel II Pre-Mixed 23-Plex Kit HCYTOMAG-62K-PX23 MPXHCYP2PMX23
Human Cytokine/Chemokine Panel III MCYP3MAG-74K MPXHCYP3-63K
Human Cytokine/Chemokine Panel III Pre-Mixed 9-Plex Kit HCYTOMAG-63K-PX9 MPXHCYP3-PMX9
Human High
SensitivityHuman High Sensitivity Cytokine/Chemokine Panel HSCYTMAG-60SK HSCYTO-60SK
Human High Sensitivity Cytokine/Chemokine Pre-mixed 13-Plex HSCYTO-60SPMX13
Human Soluble Human Soluble Cytokine Receptor Panel HSCR-32K
Human Soluble Cytokine Receptor Pre-mixed 14-Plex Kit HSCR-32K-PMX14
Human Other Human Isotyping Panel HGAMMAG-301K HGAM-301
Human Sepsis Panel 1 HGAMMAG-303E HSEP-63K
Non-Human Primate
CytokineNon-Human Primate Cytokine/Chemokine Panel PRCYTOMAG-40K MPXPRCYTO-40K
Non-Human Primate Cytokine/Chemokine Panel Pre-mixed 23-Plex Kit PCYTMG-40K-PX23 MPXPRCYTO40KPX23
Mouse Cytokine Mouse Cytokine/Chemokine Panel I MCYTOMAG-70K MPXMCYTO-70K
Mouse Cytokine/Chemokine Panel I Pre-mixed 13-Plex Kit MPXMCYTO70KPMX13
Mouse Cytokine/Chemokine Panel I Pre-mixed 22-Plex Kit MPXMCYTO70KPMX22
Mouse Cytokine/Chemokine Panel I Pre-mixed 25-Plex Kit MCYTOMAG-70K-PMX25
Mouse Cytokine/Chemokine Panel I Pre-mixed 32-Plex Kit MPXMCYTO70KPMX32
Mouse Cytokine/Chemokine Panel II MCYP2MAG-73K MPXMCYP2-73K
Mouse Cytokine/Chemokine Panel II Pre-Mixed 12-Plex Kit MCP2MG-73K-PM12 MPXMCYP2PMX12
Mouse Cytokine/Chemokine Panel III MPXMCYP3-74K
Mouse Cytokine/Chemokine Panel III Pre-Mixed 6-Plex Kit MPXMCYP3PMX6
Mouse Soluble Mouse Soluble Cytokine Receptor Panel MSCR-42K
Mouse Soluble Cytokine Receptor Pre-mixed 13 Plex Kit MSCR-42K-PMX
Mouse Isotyping Panel MGAM-300
Mouse Ige Single Plex MGAM-302E
Rat Cytokine Rat Cytokine/Chemokine Panel RCYTOMAG-80K RCYTO-80K
Rat Cytokine/Chemokine Pre-mixed 13-Plex Kit RCYTO-80K-PMX13
Rat Cytokine/Chemokine Pre-mixed 23-Plex Kit RCYTMAG-60K-PMX23 RCYTO-80K-PMX23 .
Canine Cytokine Canine Cytokine/Chemokine Panel CCYTO-90K
Multi-Species TGFb1 Single Plex TGFB1-64K-01
TGFb3-Plex TGFB-64K-03
ORDERING INFORMATION
8/6/2019 MILLIPLEX MAP Inflammation and Immunology
http://slidepdf.com/reader/full/milliplex-map-inflammation-and-immunology 41/42 39
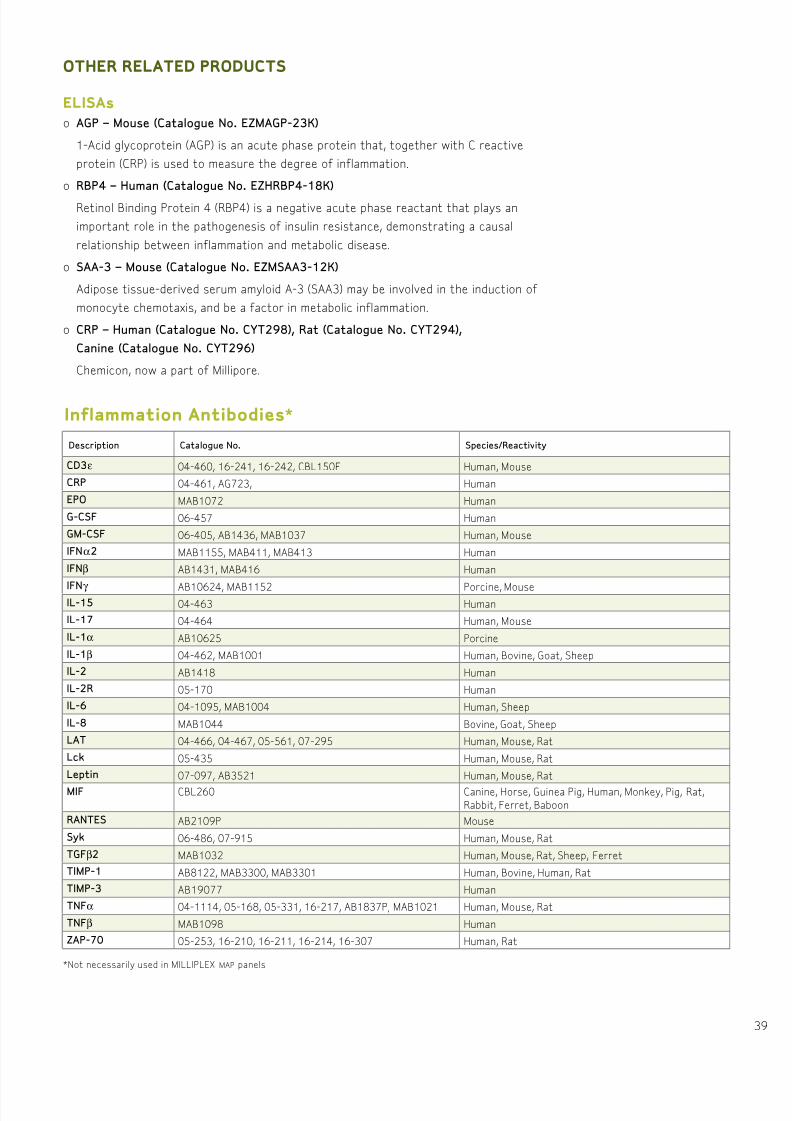
OTHER RELATED PRODUCTS
ELISAs
o AGP – Mouse (Catalogue No. EZMAGP-23K)
1-Acid glycoprotein (AGP) is an acute phase protein that, together with C reactive
protein (CRP) is used to measure the degree of inflammation.
o RBP4 – Human (Catalogue No. EZHRBP4-18K)
Retinol Binding Protein 4 (RBP4) is a negative acute phase reactant that plays an
important role in the pathogenesis of insulin resistance, demonstrating a causal
relationship between inflammation and metabolic disease.
o SAA-3 – Mouse (Catalogue No. EZMSAA3-12K)
Adipose tissue-derived serum amyloid A-3 (SAA3) may be involved in the induction of
monocyte chemotaxis, and be a factor in metabolic inflammation.
o CRP – Human (Catalogue No. CYT298), Rat (Catalogue No. CYT294),
Canine (Catalogue No. CYT296)
Chemicon, now a part of Millipore.
Description Catalogue No. Species/Reactivity
CD3e 04-460, 16-241, 16-242, CBL150F Human, Mouse
CRP 04-461, AG723, Human
EPO MAB1072 Human
G-CSF 06-457 Human
GM-CSF 06-405, AB1436, MAB1037 Human, Mouse
IFN2 MAB1155, MAB411, MAB413 Human
IFNb AB1431, MAB416 Human
IFNg AB10624, MAB1152 Porcine, MouseIL-15 04-463 Human
IL-17 04-464 Human, Mouse
IL-1 AB10625 Porcine
IL-1b 04-462, MAB1001 Human, Bovine, Goat, Sheep
IL-2 AB1418 Human
IL-2R 05-170 Human
IL-6 04-1095, MAB1004 Human, Sheep
IL-8 MAB1044 Bovine, Goat, Sheep
LAT 04-466, 04-467, 05-561, 07-295 Human, Mouse, Rat
Lck 05-435 Human, Mouse, Rat
Leptin 07-097, AB3521 Human, Mouse, Rat
MIF CBL260 Canine, Horse, Guinea Pig, Human, Monkey, Pig, Rat,
Rabbit, Ferret, Baboon
RANTES AB2109P Mouse
Syk 06-486, 07-915 Human, Mouse, Rat
TGFb2 MAB1032 Human, Mouse, Rat, Sheep, Ferret
TIMP-1 AB8122, MAB3300, MAB3301 Human, Bovine, Human, Rat
TIMP-3 AB19077 Human
TNF 04-1114, 05-168, 05-331, 16-217, AB1837P, MAB1021 Human, Mouse, Rat
TNFb MAB1098 Human
ZAP-70 05-253, 16-210, 16-211, 16-214, 16-307 Human, Rat
Inlammation Antibodies*
*Not necessarily used in MILLIPLEX MAP panels

8/6/2019 MILLIPLEX MAP Inflammation and Immunology
http://slidepdf.com/reader/full/milliplex-map-inflammation-and-immunology 42/42
www.millipore.com/oces
TO PLACE AN ORDER ORRECEIVE TECHNICAL ASSISTANCE
In the U.S. and Canada, call toll-free 1 800-Millipore (1-800-645-5476)
In Europe, please call Customer Service:
France: 0825.045.645
Spain: 901.516.645 Option 1
Germany: 01805.045.645
Italy: 848.845.645
English UK: 0870.900.46.45
For other countries across Europe and the world,
please visit www.millipore.com/offices.
For Technical Service, please visit www.millipore.com/techservice.