Embed Size (px)
Citation preview

GMO North America | Europe | Asia-Pacific
Presentation
Proprietary information – not for distribution beyond intended recipient.
Milwaukee County Employees’ Retirement System
February 10, 2010
Tom RosalankoCarolyn Van Putten

1GMOCVP_Milwaukee Cnty_2-10
Proprietary information – not for distribution. Copyright © 2010 by GMO LLC. All rights reserved.
Agenda
Overview of GMO
International Equity Strategies Review
Performance Update and Market Outlook
Appendix

2GMOCVP_Milwaukee Cnty_2-10
Proprietary information – not for distribution. Copyright © 2010 by GMO LLC. All rights reserved.
GMO’s Edge: We blend proven traditional judgments with innovative quantitative methods, to find undervalued securities and markets.
Success Factors: Discipline, value orientation, investment research, risk control, size limitation.Motivation/Focus: Private partnership founded in 1977; investment management is our only business.
Stability: GMO has a low turnover of investment professionals.Current Scale: $107 billion of assets under management:
Equities: $95 billion ($64 billion non-U.S.)Fixed Income: $12 billion Absolute Return*: $8 billionAsset Allocation*: $33 billion
More than 100 investment professionals and over 500 employees worldwide.
As of 12/31/09
San Francisco
BostonLondon Zurich
Singapore
* Asset allocation and absolute return assets are accounted for within underlying strategies and should not be double-counted.
SydneyRotorua
Represents assets from both GIPS and non-GIPS compliant firms. There are two GIPS compliant firms. The first is Grantham, Mayo, Van Otterloo & Co. LLC (“GMO”), an independent investment adviser registered under Investment Advisers Act of 1940. GMO’s accounts are managed by investment management offices in Boston, MA and Berkeley, CA. GMO has total assets of $97,456,127,388. The second firm is defined as GMO UK Limited. GMO UK was established to manage mandates primarily for UK and other European clients. GMO UK is authorized and regulated by the Financial Services Authority in the United Kingdom. GMO UK firm assets are $3,637,997,238.
Montevideo
GMO Overview

3GMOCVP_Milwaukee Cnty_2-10
Proprietary information – not for distribution. Copyright © 2010 by GMO LLC. All rights reserved.
Note: Clients listed here were chosen as generally representative of the types of clients that comprise GMO’s primary client base (Pension Funds, Educational Endowments, Foundations and International Organizations) and were not chosen based on performance-related criteria. It is not known whether the listed clients approve or disapprove of GMO or the advisory services provided.
Representative ClientsInternational OrganizationsWorld Bank
EndowmentsAppalachian Mountain Club University of MichiganBabson College Middlebury CollegeBaylor College of Medicine Mills CollegeBaylor University UNC at Chapel HillBerklee College of Music Northwestern UniversityBoston College Norwich UniversityBoston University Phillips Exeter AcademyCarnegie Institute Pomona CollegeCarnegie Institution of Washington Princeton UniversityChristian Theological Seminary University of RochesterCollege of William and Mary Santa Clara UniversityColumbia University Southern Methodist UniversityDartmouth College Spelman CollegeUniversity of Delaware Stanford UniversityDuke University Swarthmore CollegeDwight Hall at Yale Vanderbilt UniversityThe George Washington University Vassar CollegeUniversity of Hartford University of VirginiaJuilliard School Wellesley CollegeKansas University Woods Hole OceanographicLawrenceville School Yale UniversityLehigh University
Public Funds Sub-AdvisoryCalPERS AXAState of Connecticut John HancockCity of Fairfax, VA Marks & SpencerIllinois Teachers' Retirement SystemMass PRIMMilwaukee County Empl. Ret. System State of Wisconsin Investment BoardCity of RichmondSan Francisco City & CountyVirginia Retirement SystemWashington State Investment Board
Pension FundsAndersen Corporation MerckAPL Limited MilliporeBAE Systems National Bank of CanadaBASF Corporation USA National Geographic SocietyThe Boeing Company NCR - ScotlandCargill NiSourceCentrica NRECAContiGroup JC PenneyCorning PepsiCoDominion Resources Philips Electronics North AmericaDow Chemical PME (Bedrijfstakpensioenfonds Metalektro)Electronic Data Systems Praxair, Inc.FMC Corporation Rolls-RoyceJohn Hancock Sidley & AustinHarbor Capital SprintHerman Miller SunSuperJohn Laing VerizonLockheed Martin Whirlpool
Foundations and Cultural InstitutionsAbell Foundation Kresge FoundationAfrica-America Institute MacArthur FoundationBoston Foundation Mayo FoundationCalifornia Academy of Sciences Metropolitan Museum of ArtEdna McConnell Clark Foundation Metropolitan OperaThe Cleveland Foundation Meyer FoundationColonial Williamsburg Foundation Moore FoundationCommonwealth Fund Polk Bros FoundationNathan Cummings Foundation Regenstrief FoundationGeraldine R. Dodge Foundation Rochester General Hospital FoundationDoris Duke Charitable Foundation Surdna Foundation Father Flanagan's Foundation Toledo Museum of ArtFetzer Institute Trustees of ReservationsGuggenheim Foundation United Negro College FundHewlett Foundation Wallace FoundationHilton Foundation Wenner-Gren FoundationInwood House World Wildlife Fund
As of 2/9/10

4GMOCVP_Milwaukee Cnty_2-10
Proprietary information – not for distribution. Copyright © 2010 by GMO LLC. All rights reserved.
Absolute Return Long/Short
Aggressive Long/Short
Tactical Opportunities
Pan-European Long/Short
Emerging Country Debt Long/Short1
Currency Hedge1
Fixed Income Hedge1
Emerging Currency Hedge1
Mean Reversion1
Global Tactical1
Short Term Market Opportunities
Completion
Multi-Strategy1
(combination of strategies above)
Alpha Only
Tax-Managed Absolute Return1
U.S. EquitiesU.S. Core
Tobacco-Free Core
U.S. Intrinsic Value
Quality
U.S. Growth
U.S. Small/Mid Cap Value
U.S. Small/Mid Cap Growth
Real Estate Investment Trusts
Tax-Managed U.S. Equities
Australian EquitiesAustralian Equities
Australian Small Companies
Australian Market Neutral
Australian Long/Short Equity
UK EquitiesUK Value
UK Core
UK Income
International EquitiesForeign (Int’l Active Strategy)
Foreign Small Companies (Int’l Active Strategy)
International Intrinsic Value
International Growth Equity
International Core Equity
Currency Hedged International Equity
Japan Equity1
Europe ex-UK
International Small Companies
Tax-ManagedInternational Equities
Flexible Equities
Emerging Equities
Emerging Markets
Emerging Countries
Emerging Illiquid
Global EquitiesGlobal Active1
(Int’l Active Strategy)
Global Equity
World ex-UK
World ex-Australia
Fixed IncomeCore Plus Bond
Inflation Indexed Plus Bond
Short-Duration Investment
U.S. Treasury
International Bond
Currency HedgedInternational Bond
Global Bond
Emerging Country Debt
Emerging Country Local Debt Investment1
Asset Allocation Bond
Alternative AssetsForestry
Alternative Asset Opportunity
Special Situations
OpenCapacity ConstrainedClosed
Current Status:
GMO Investment Strategies
Asset Allocation
U.S. Equity Allocation International Developed Equity Allocation
International All Country Equity Allocation
Global Developed Equity Allocation
Global All Country Equity Allocation
Global Balanced Allocationvs. benchmark of
65% stocks, 35% bondsTax-Managed
Global Balanced1
Real Return Global Balanced Asset Allocation1
vs. benchmark of 60% stocks, 20% bonds, 20% cash
Global Allocation Absolute Return
vs. target of +5% real return per year
GMO Real Return Asset Allocation Fund
1 Privately offered and available only to qualified purchasers. Call GMO for further information.
Note: Does not include all GMO products. As of 2/4/10

5GMOCVP_Milwaukee Cnty_2-10
Proprietary information – not for distribution. Copyright © 2010 by GMO LLC. All rights reserved.
Source: GMO As of 12/31/09
Note: Numbers in parentheses = Years at GMO
GMO Quantitative EquityInvestment team
Chuck Taylor (19)
Tara Oliver (14)
Ty Cobb (13)
Leanne Kunz (11)
Mark Ingham (11)
Seth Glattstein (9)
Donna Murphy (8)
Anthony King (8)
John Breedis (8)
Joe Stein, Jr. (7)
Portfolio Management & Research
Portfolio Trading
Sam Wilderman (14)Co-Head
U.S.Anthony Hene (15)
GlobalTom Hancock (14)
Co-Head
International
Lead Portfolio Managers
Chuck Joyce (12)
Quality
Tom Rosalanko (5)
Naser Bashir (5)
Lucas White (4)
Neil Constable (4)
David Cowan (4)
Sam Klar (4)
Tom Bok (3)
Martin Tarlie (3)
Kenvor Cothey (3)
Hassan Chowdrhy (3)
Paul Wang (2)
Eric Liu (2)
Justin Ashmall (1)
Jeffrey Leong (1)
Robert Park (1)
Prasun Agarwal (1)
Chris Fortson (<1)
Doug Francis (<1)
John Mann, Head (14)
Malica Aronowitz (18)
Brian Smith (13)
Julie Coady (12)
Chris Cullinan (11)
Jason Johnson (11)
Chris Snow (8)
Amit Tamba (8)
Mike Murphy (7)
Ryan Rouillard (6)

6GMOCVP_Milwaukee Cnty_2-10
Proprietary information – not for distribution. Copyright © 2010 by GMO LLC. All rights reserved.
Fundamental Value Matters
Quality Is Worth a Premium
Momentum Complements Value
Quantitative, Not Quant
International EquityInvestment philosophy and approach
7GMOCVP_Milwaukee Cnty_2-10
Proprietary information – not for distribution. Copyright © 2010 by GMO LLC. All rights reserved.
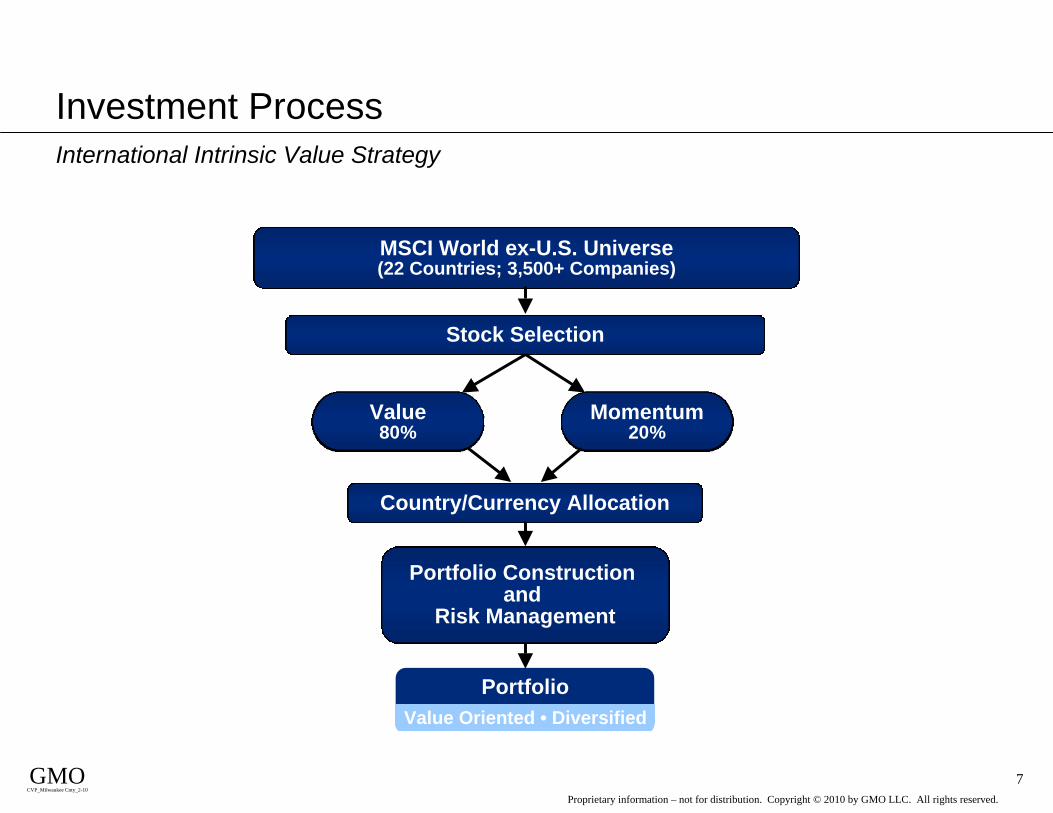
Portfolio Construction and
Risk Management
MSCI World ex-U.S. Universe(22 Countries; 3,500+ Companies)
PortfolioValue Oriented • Diversified
Country/Currency Allocation
Stock Selection
Value 80%
Momentum 20%
Investment ProcessInternational Intrinsic Value Strategy

8GMOCVP_Milwaukee Cnty_2-10
Proprietary information – not for distribution. Copyright © 2010 by GMO LLC. All rights reserved.
High QualityNestleTotalRocheNovartisGlaxoSmithKlineAstrazenecaBritish American TobaccoBG GroupTescoSanofi-AventisDiageoUnileverSAPResearch in MotionDanone
Source: GMO As of 12/31/09
Great “franchises” all possess these
characteristics.
High profitability
Stable profitability
Low leverage
What Is a Quality Company?Large cap examples
The securities identified above represent a selection of securities identified by the GMO quantitative model. These specific securities are selected for presentation by GMO based on their underlying characteristics and are not selected on the basis of their investment performance. These securities are not necessarily representative of the securities purchased, sold or recommended for advisory clients, and it should not be assumed that the investment in the securities identified will be profitable.
9GMOCVP_Milwaukee Cnty_2-10
Proprietary information – not for distribution. Copyright © 2010 by GMO LLC. All rights reserved.
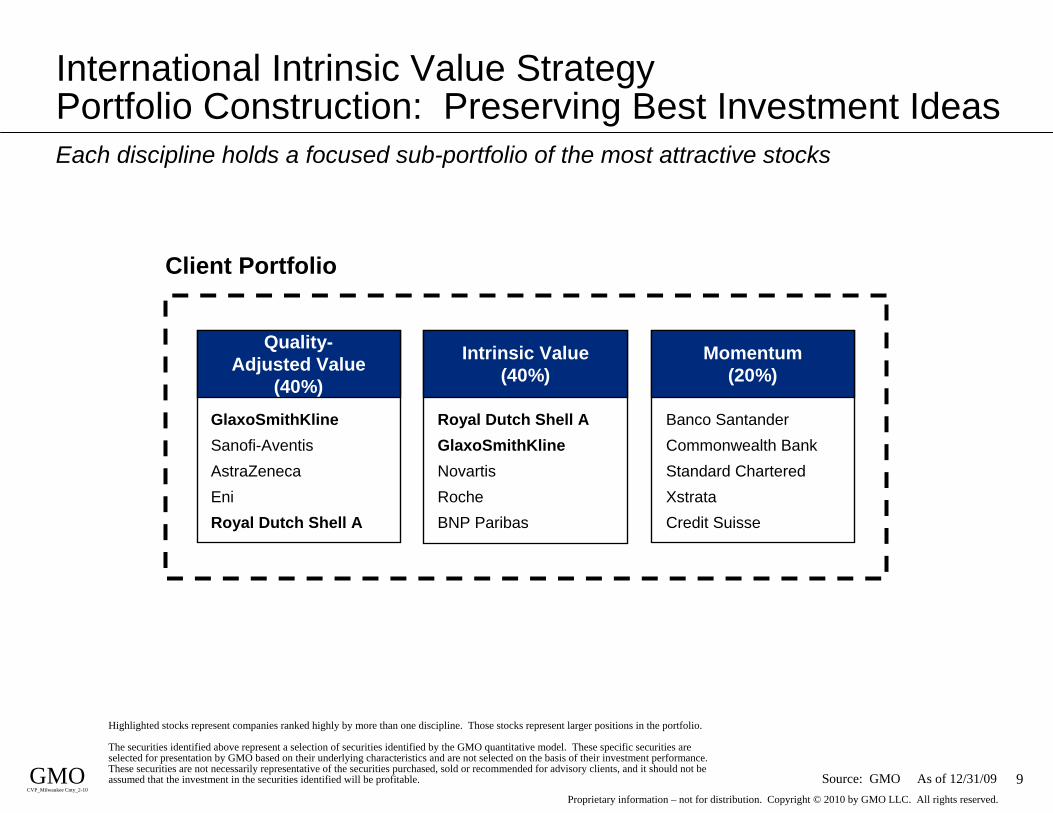
Client Portfolio
Quality-Adjusted Value
(40%)
Momentum(20%)
Intrinsic Value(40%)
Banco SantanderCommonwealth Bank Standard CharteredXstrata Credit Suisse
GlaxoSmithKlineSanofi-AventisAstraZenecaEniRoyal Dutch Shell A
Royal Dutch Shell AGlaxoSmithKlineNovartisRocheBNP Paribas
International Intrinsic Value Strategy Portfolio Construction: Preserving Best Investment IdeasEach discipline holds a focused sub-portfolio of the most attractive stocks
Highlighted stocks represent companies ranked highly by more than one discipline. Those stocks represent larger positions in the portfolio.
The securities identified above represent a selection of securities identified by the GMO quantitative model. These specific securities are selected for presentation by GMO based on their underlying characteristics and are not selected on the basis of their investment performance. These securities are not necessarily representative of the securities purchased, sold or recommended for advisory clients, and it should not be assumed that the investment in the securities identified will be profitable. Source: GMO As of 12/31/09

10GMOCVP_Milwaukee Cnty_2-10
Proprietary information – not for distribution. Copyright © 2010 by GMO LLC. All rights reserved.
0%
50%
100%
150%
200%
250%
300%
80 82 84 86 88 90 92 94 96 98 00 02 04 06 08
Cum
ulat
ive
Out
perf
orm
ance
Dec -
Value
Momentum (within value)
Blended (80/20)
Source: GMO As of 12/31/09
Return Tracking ErrorValue: 5.1% 5.4%Momentum 3.4% 5.9%Blended (80/20): 4.8% 4.5%
Blending Value and Momentum Has Lowered Benchmark Risk

11GMOCVP_Milwaukee Cnty_2-10
Proprietary information – not for distribution. Copyright © 2010 by GMO LLC. All rights reserved.
International Intrinsic Value StrategyTop 15 holdings as of December 31, 2009
The above information is based on a representative account selected because it has the least number of restrictions and best represents the implementation of the strategy. The information above is supplemental to the GIPS® compliant presentation that was made available on GMO’s website in April of 2009.
% ofCountry Sector Equity
GlaxoSmithKline PLC United Kingdom Health Care 3.3 %
Royal Dutch Shell PLC United Kingdom Energy 2.7Sanofi-Aventis S.A. France Health Care 2.6Novartis AG Switzerland Health Care 2.3AstraZeneca PLC United Kingdom Health Care 2.2ENI S.p.A. Italy Energy 1.9Banco Santander S.A. Spain Financials 1.8BNP Paribas S.A. France Financials 1.7Barclays PLC United Kingdom Financials 1.6Nissan Motor Co. Ltd. Japan Consumer Discretionary 1.4Unicredito Italiano Spa Ord Italy Financials 1.3ING Groep N.V. Netherlands Financials 1.2Vodafone Group PLC United Kingdom Telecommunication Services 1.2Roche Holding AG Switzerland Health Care 1.1Societe Generale S.A. (France) France Financials 1.1
Total 27.4 %

12GMOCVP_Milwaukee Cnty_2-10
Proprietary information – not for distribution. Copyright © 2010 by GMO LLC. All rights reserved.
2.9%
3.3%
0.1%
0.4%
0.6%
2.1%
24.6%
9.0%
0.8%
1.6%
0.9%
5.1%
0.6%
1.5%
0.4%
2.4%
11.2%
21.4%
0.6%
3.9%
5.2%
0.5%
1.1%
0% 10% 20% 30%
Cash + Unrealized G/L
United Kingdom
Switzerland
Sweden
Spain
Singapore
Portugal
Norway
New Zealand
Netherlands
Japan
Italy
Ireland
Hong Kong
Greece
Germany
France
Finland
Denmark
Canada
Belgium
Austria
Australia
0.0%
21.6%
11.9%
3.8%
0.0%
8.5%
0.0%
21.1%
3.9%
41.2%
0.0%
8.7%
1.5%
11.0%
3.8%
24.2%
33.2%
1.3%
3.5%
20.7%
33.4%
4.4%
20.6%
21.4%
0% 10% 20% 30% 40% 50%
United States
UK
Other Europe
Other Asia
Japan
Euro
Canada
Australia/NewZealand
Country Allocation Currency Allocation
International Intrinsic Value StrategyCountries and currencies as of December 31, 2009
The above information is based on a representative account selected because it has the least number of restrictions and best represents the implementation of the strategy. The information above is supplemental to the GIPS® compliant presentation that was made available on GMO’s website in April of 2009.
International Intrinsic Value StrategyMSCI EAFE Value IndexMSCI EAFE Index

13GMOCVP_Milwaukee Cnty_2-10
Proprietary information – not for distribution. Copyright © 2010 by GMO LLC. All rights reserved.
27.8
15.013.5
21.5 21.2
28.9
35.1
10.113.213.7
11.115.4
26.530.1
16.9
0
10
20
30
40
Large Cap($56.6 & Above)
Med/Large Cap($21.4B -$56.6B)
Med Cap($9.5B -$21.4B)
Med/Small Cap($4.2 - $9.5B)
Small Cap($4.2B &Below)
Perc
enta
ge
7.6%
10.5%
13.1%
4.2%
5.3%
8.2%
4.3%
8.3%
13.9%
25.3%
9.9%
6.9%
5.8%
5.9%
8.4%
25.5%
9.6%
10.1%
10.4%
4.7%
11.2%
8.4%
7.5%
2.6%
35.6%
3.4%
5.4%
9.2%
5.1%
13.8%
0% 10% 20% 30% 40%
Utilities
Telecom.Services
Materials
InformationTechnology
Industrials
Health Care
Financials
Energy
ConsumerStaples
ConsumerDiscretionary
International Intrinsic Value StrategyPortfolio characteristics as of December 31, 2009
Cap Size Allocation
Valuation MeasuresSector AllocationGMO
International Intrinsic Value
MSCI EAFEValue
MSCI EAFE
Price/Earnings - Hist 1 Yr Wtd Median 16.5 x 15.9 x 17.7 xPrice/Cash Flow - Hist 1 Yr Wtd Median 9.2 x 7.7 x 10.3 xPrice/Book - Hist 1 Yr Wtd Avg 1.4 x 1.2 x 1.5 xReturn on Equity - Hist 1 Yr Med 8.8 % 7.7 % 9.1 %Market Cap - Weighted Median $Bil $21.4 $34.8 $28.3Dividend Yield - Hist 1 Yr Wtd Avg 3.1 % 3.9 % 3.0 %
The above information is based on a representative account selected because it has the least number of restrictions and best represents the implementation of the strategy. The information above is supplemental to the GIPS® compliant presentation that was made available on GMO’s website in April of 2009.
International Intrinsic Value StrategyMSCI EAFE Value IndexMSCI EAFE Index

14GMOCVP_Milwaukee Cnty_2-10
Proprietary information – not for distribution. Copyright © 2010 by GMO LLC. All rights reserved.
Portfolio Construction and
Risk Management
3,000+ Smaller* CompaniesOutside the U.S. Stock Market
PortfolioValue Oriented • Diversified
Country/Currency Allocation
Stock Selection
Value70%
Momentum30%
* Includes 15% smallest non-US companies by market cap by region and includes emerging markets.
Investment ProcessInternational Small Companies Strategy

15GMOCVP_Milwaukee Cnty_2-10
Proprietary information – not for distribution. Copyright © 2010 by GMO LLC. All rights reserved.
Momentum- Adjusted Value
(35%)BolidenSignet JewelersInchcape Swiss Life HoldingDCC
Quality- Adjusted Value
(35%)LagardereHome Retail GroupSignet JewelersPeugeotBarratt Developments
Momentum(30%)
AixtronBolidenInfineon TechnologiesInchcapeYit Oy
International Small Companies Portfolio Construction: Preserving Best Investment IdeasEach discipline holds a focused sub-portfolio of the most attractive stocks
Client Portfolio
Highlighted stocks represent companies ranked highly by more than one discipline. Those stocks represent larger positions in the portfolio.
The securities identified above represent a selection of securities identified by the GMO quantitative model. These specific securities are selected for presentation by GMO based on their underlying characteristics and are not selected on the basis of their investment performance. These securities are not necessarily representative of the securities purchased, sold or recommended for advisory clients, and it should not be assumed that the investment in the securities identified will be profitable. Source: GMO As of 12/31/09

16GMOCVP_Milwaukee Cnty_2-10
Proprietary information – not for distribution. Copyright © 2010 by GMO LLC. All rights reserved.
Source: GMO Data range: 1/1/09 – 12/31/09
How Have the Stock Selection Disciplines Fared?International Small Companies Strategy
-30
-20
-10
0
10
20
30
40
1/09 3/09 5/09 7/09 9/09 11/09 1/10
Ret
urn
vs. M
SCI E
AFE
Sm
all C
ap (%
)
Quality Adjusted Value Intrinsic Value/Momentum Adjusted Value Momentum

17GMOCVP_Milwaukee Cnty_2-10
Proprietary information – not for distribution. Copyright © 2010 by GMO LLC. All rights reserved.
0.0%
20.8%
4.9%
9.4%
19.8%
7.1%
29.3%
24.1%
13.3%
25.4%
0.0%
26.2%
4.2%
2.4%
12.5%
0.6%
0% 10% 20% 30% 40%
United States
UK
Other Europe
Other Asia
Japan
Euro
Canada
Australia/NZ
0.0%
5.8%
0.2%
0.4%
1.3%
3.2%
7.7%
4.3%
2.0%
0.7%
6.6%
4.0%
0.4%
0.6%
1.9%
1.4%
3.2%
3.8%
2.1%
0.1%
29.4%
1.1%
19.7%
0% 5% 10% 15% 20% 25% 30% 35%
Cash
United Kingdom
Switzerland
Sweden
Spain
Singapore
Portugal
Norway
New Zealand
Netherlands
Japan
Italy
Ireland
Hong Kong
Greece
Germany
France
Finland
Denmark
Canada
Belgium
Austria
Australia
Country Allocation Currency Allocation
International Small Companies StrategyCountries and currencies as of December 31, 2009
The above information is based on a representative account selected because it has the least number of restrictions and best represents the implementation of the strategy. The information above is supplemental to the GIPS® compliant presentation that was made available on GMO’s website in April of 2009.
International Small CompaniesMSCI EAFE Small Cap

18GMOCVP_Milwaukee Cnty_2-10
Proprietary information – not for distribution. Copyright © 2010 by GMO LLC. All rights reserved.
0.3%
22.9%
3.1%
6.1%
25.3%
8.7%
9.3%
6.1%
17.6%
19.3%
5.1%
1.9%
0.7%
4.4%
0.5%
11.6%
9.2%
16.7%
6.9%
24.4%
0% 10% 20% 30%
Utilities
TelecommunicationServices
Materials
InformationTechnology
Industrials
Health Care
Financials
Energy
Consumer Staples
ConsumerDiscretionary
Cap Size Allocation
Valuation MeasuresSector Allocation
International Small Companies StrategyPortfolio characteristics as of December 31, 2009
International Small CompaniesMSCI EAFE Small Cap
Source: GICS Sector Report and GMOThe above information is based on a representative account selected because it has the least number of restrictions and best represents the implementation of the strategy. The information above is supplemental to the GIPS® compliant presentation that was made available on GMO’s website in April of 2009.
Price/Earnings - Hist 1 Yr Wtd Median 20.2 x 22.2 x
Price/Cash Flow - Hist 1 Yr Wtd Median 9.1 x 11.4 x
Price/Book - Hist 1 Yr Wtd Avg 1.2 x 1.3 x
Return on Equity - Hist 1 Yr Med 6.5 % 6.7 %
Market Cap - Weighted Median $Bil $1.1 $0.9
Dividend Yield - Hist 1 Yr Wtd Avg 2.4 % 2.3 %
GMOInternational
Small CompaniesMSCI EAFE Small Cap
0.7%0.0%
99.3%
0.0%0.0%
100.0%
0.0%0.0%0.0% 0.0%0%
25%
50%
75%
100%
Large Cap($56.6 &Above)
Med/Large Cap($21.4B -$56.6B)
Med Cap($9.5B -$21.4B)
Med/Small Cap($4.2 - $9.5B)
Small Cap($4.2B &Below)

19GMOCVP_Milwaukee Cnty_2-10
Proprietary information – not for distribution. Copyright © 2010 by GMO LLC. All rights reserved.
Milwaukee County Employees Retirement SystemPerformance net of fees and expenses in USDPeriods ending December 31, 2009
Month Quarter YTD Year Year Year Inception * (000)1 3 5 Since Market Value
Annualized
International Intrinsic Value (04/13/1995)
0.74 -0.64 18.64 18.64 -7.20 2.74 7.05 114,205 % % % % % % %
MSCI EAFE Value 0.89 0.28 34.23 34.23 -7.35 3.36 6.28
Value Added -0.15 -0.92 -15.59 -15.59 0.15 -0.62 0.77
MSCI EAFE 1.44 2.18 31.78 31.78 -6.04 3.54 4.72
Value Added -0.70 -2.82 -13.14 -13.14 -1.16 -0.80 2.33
International Small Companies (06/02/2009)
1.36 -2.17 15.81 N/A N/A N/A 15.81 58,097
MSCI EAFE Small Cap + 0.75 -1.03 18.81 N/A N/A N/A 18.81
Value Added 0.61 -1.14 -3.00 N/A N/A N/A -3.00
MSCI EAFE 1.44 2.18 17.41 N/A N/A N/A 17.41
Value Added -0.08 -4.35 -1.60 N/A N/A N/A -1.60
* Periods of less than a year are not annualized Note: The MSCI EAFE Small Cap + Index is comprised of S&P Developed ex-U.S. Small Cap Index from 6/30/1989 to 5/30/2008 and MSCI EAFE Small Cap Index thereafter.

20GMOCVP_Milwaukee Cnty_2-10
Proprietary information – not for distribution. Copyright © 2010 by GMO LLC. All rights reserved.
-20
-15
-10
-5
0
5
10
15
1/09 3/09 5/09 7/09 9/09 11/09 1/10
Ret
urn
vs. M
SCI E
AFE
Inde
x (%
) .
Quality Adjusted ValueIntrinsic ValueMomentum within Value
Source: GMO Data range: 1/1/09 – 12/31/09
How Have the Stock Selection Disciplines Fared?International Intrinsic Value Strategy

21GMOCVP_Milwaukee Cnty_2-10
Proprietary information – not for distribution. Copyright © 2010 by GMO LLC. All rights reserved.
HelpedSelection within Consumer DiscretionaryExposure to Canada- Stock Selection, Currency, and Country Allocation
HurtFocus on high quality companies (overweight Healthcare, underweight Financials, Materials)Country allocation – overweight Japan, underweight Australia and SpainCurrency allocation - Japanese yen vs. British pound and Australian dollarSelection within Consumer Staples
Best 5 Stock Positions
Overweight Nissan Motor
Overweight Bank of Montreal
Overweight BNP Paribas
Overweight Honda Motor
Overweight National Bank of Canada
Worst 5 Stock Positions
Overweight Seven and I Holdings
Underweight BHP Billiton
Overweight Novartis
Overweight GlaxoSmithKline
Underweight Rio Tinto
International Intrinsic Value StrategyWhat helped? / What hurt? Year-to-date to December 31, 2009 vs. MSCI EAFE

Appendix

23GMOCVP_Milwaukee Cnty_2-10
Proprietary information – not for distribution. Copyright © 2010 by GMO LLC. All rights reserved.
Valuation of High Quality Stocks
Soruce: GMO As of 12/31/09
0.0
0.5
1.0
1.5
2.0
2.5
3.0
3.5
81 83 85 87 89 91 93 95 97 99 01 03 05 07 09
Pric
e/B
ook
vs. G
loba
l Uni
vers
e
Nov -
U.S.
Europe

24GMOCVP_Milwaukee Cnty_2-10
Proprietary information – not for distribution. Copyright © 2010 by GMO LLC. All rights reserved.
Quality Stocks Maintain an Advantage in Profitability
Soruce: GMO As of 12/31/09
U.S.
0%
5%
10%
15%
20%
25%
30%
81 85 89 93 97 01 05 09
12-M
onth
Ahe
ad R
etur
n on
Equ
ity
Jan -
Europe ex-UK
-5%
0%
5%
10%
15%
20%
25%
81 85 89 93 97 01 05 09
12-M
onth
Ahe
ad R
etur
n on
Equ
ity
Jan -
Japan
-15%
-10%
-5%
0%
5%
10%
15%
81 85 89 93 97 01 05 09
12-M
onth
Ahe
ad R
etur
n on
Equ
ity
Jan -
UK
0%
5%
10%
15%
20%
25%
30%
81 85 89 93 97 01 05 09
12-M
onth
Ahe
ad R
etur
n on
Equ
ity
Jan -
High Quality (lagged 12 months)Low Quality (lagged 12 months)
25GMOCVP_Milwaukee Cnty_2-10
Proprietary information – not for distribution. Copyright © 2010 by GMO LLC. All rights reserved.
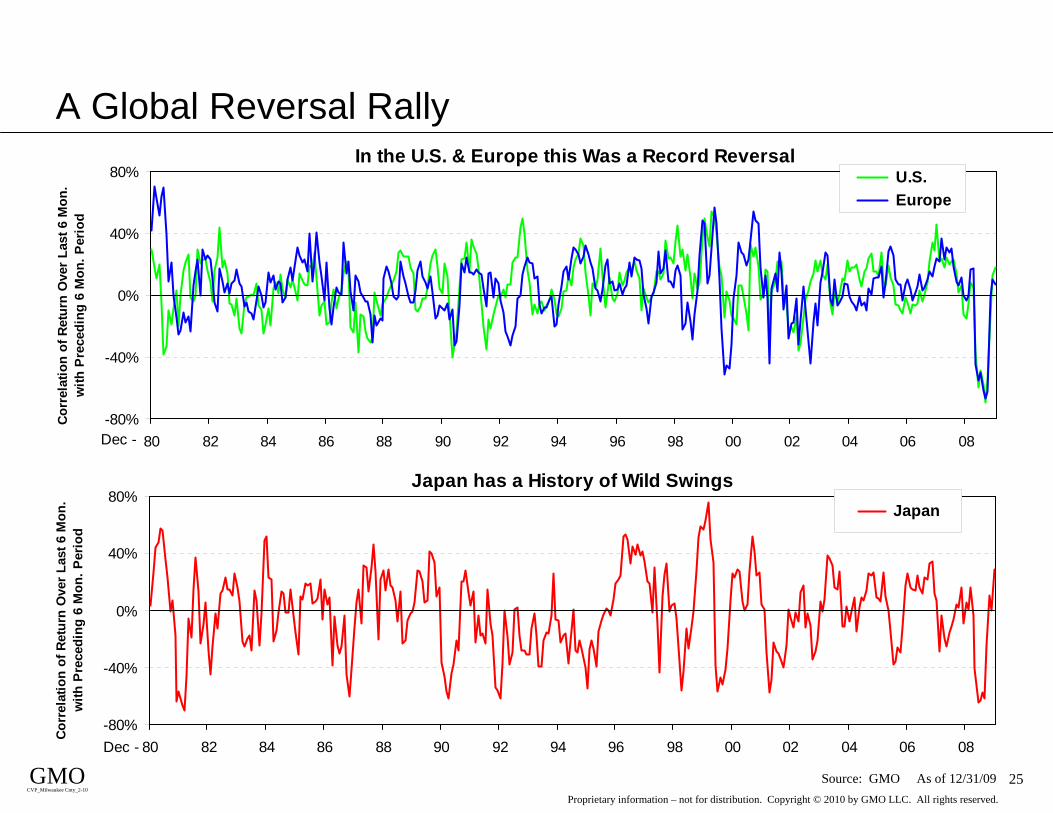
In the U.S. & Europe this Was a Record Reversal
-80%
-40%
0%
40%
80%
80 82 84 86 88 90 92 94 96 98 00 02 04 06 08
Cor
rela
tion
of R
etur
n O
ver
Last
6 M
on.
with
Pre
cedi
ng 6
Mon
. Per
iod
U.S. Europe
Dec -
Japan has a History of Wild Swings
-80%
-40%
0%
40%
80%
80 82 84 86 88 90 92 94 96 98 00 02 04 06 08
Corr
elat
ion
of R
etur
n O
ver
Last
6 M
on.
with
Pre
cedi
ng 6
Mon
. Per
iod
Japan
Dec -
Source: GMO As of 12/31/09
A Global Reversal Rally

26GMOCVP_Milwaukee Cnty_2-10
Proprietary information – not for distribution. Copyright © 2010 by GMO LLC. All rights reserved.
1.3%0.5%
6.8%
4.7% 4.6%3.9%
1.1%2.1%
0.8%-0.6%
6.0%
1.8%1.8%
1.8%
2.3% 2.3% 3.7%
0.9%
0.9%
2.9%
0.9%
1.5%
0.3% 1.4%
-2%
0%
2%
4%
6%
8%
10%
12%
U.S.equities
(large cap)
U.S.equities
(small cap)
U.S. HighQuality
Int'l.equities
(large cap)
Int'l.equities
(small cap)
Equities(emerging)
U.S. Bonds(gov't.)
Int'l. Bonds(gov't.)
Bonds(emerging)
Bonds(inflationindexed)
U.S.treasury
(30 days to2 yrs.)
ManagedTimber
Ann
ual R
eal R
etur
n O
ver
7 Y
ears
2.3%
8.6%
7.0% 6.9%
2.0%1.2%
5.0%
1.7%0.8%
7.5%7.6%
3.1%
Estimated Range of 7-Year Annualized Returns
*The chart represents real return forecasts1 for several asset classes and an estimate of value expected to be added from active management. These forecasts are forward- looking statements based upon the reasonable beliefs of GMO and are not a guarantee of future performance. Actual results may differ materially from the forecasts above.
Stocks Bonds Other
- Real Return (Asset Class Index)- Expected Value Added
3 3
1 Long-term inflation assumption: 2.5% per year.2 Alpha transported from management of global equities.
3 Return forecasts for international equities are ex-Japan.4 Alpha transported from management of global bonds.
±6.5 ±7.0 ±6.0 ±7.0 ±10.5 ±4.0 ±4.0 ±8.5 ±1.5 ±1.5 ±5.5±6.5
Source: GMO
6.5 % Long-term Historical U.S. Equity Return
GMO 7-Year Asset Class Return Forecasts*As of December 31, 2009
2
44

27GMOCVP_Milwaukee Cnty_2-10
Proprietary information – not for distribution. Copyright © 2010 by GMO LLC. All rights reserved.
2.2%
0.5%
6.8%
-2.3%
1.3%
4.3% 4.9% 5.2%4.0%1.8%
1.8%
1.8%
1.8%
1.8%1.8%
1.8%
2.3%2.3%
2.3%2.3%
2.3%
2.3%3.7%
0.0%
1.3%0.5%
-0.8%
4.7% 4.6%3.9%
0.2%
-4%
-2%
0%
2%
4%
6%
8%
10%
12%
S&P 500 US LargeGrow th
US LargeValue
US HighQuality
US LowQuality
US Small US SmallGrow th
US SmallValue
EAFE IntlGrow th
IntlValue
IntlSmall
Intl SmallGrow th
Intl SmallValue
REITs Emerging
Annu
al R
eal R
etur
n O
ver 7
Yea
rs
2.3%3.1%
7.0%6.6%
7.2%
4.0%
2.3%
8.6%
1.8%
-0.6%
6.9%7.5%
6.3%
3.1%
7.6%
U.S. Large U.S. Small Int'l. Large2 Int'l. Small2 REITS Emerging
- Real Return (Asset Class Index)- Expected Value Added
1 Real returns — long-term inflation assumption: 2.5%2 Return forecasts for international equities are ex-Japan.Note: The chart represents real return forecasts1 for several asset classes and an estimate of value expected to be added from active management. These forecasts are forward-looking statements based upon the reasonable beliefs of GMO and are not a guarantee of future performance. Actual results may differ materially from the forecasts above. Source: GMO
GMO 7-Year Global Equity Forecasts1
Value and growth within large and small stocks, and REITs, as of December 31, 2009

28GMOCVP_Milwaukee Cnty_2-10
Proprietary information – not for distribution. Copyright © 2010 by GMO LLC. All rights reserved.
Price vs. Peers GMO Quality-Adjusted Fair Price vs. Peers
Potential Opportunity
Novo Nordisk 63% 71% 5% Fair Value
GlaxoSmithKline -18% 70% 108% Cheap
Diageo 7% 53% 43% Cheap
BG Group 54% 39% -10% Expensive
ArcelorMittal -16% -17% -1% Fair Value
Sony 16% -42% -50% Expensive
UBS -11% -52% -46% Expensive
Nippon Oil -64% -35% 79% Cheap
Source: GMO As of 12/31/09
HighQuality
LowQuality
Price to:- Earnings historical- Earnings forecast- Cash flow- Book value- Sales- Dividends
GMO Quality means:
- Higher profitability - Stable profitability- Low debt
For example: Novo Nordisk 1.71/1.63 = 1.05 (+5%)
GMO Value Discipline Favors Higher Quality CompaniesQuality-adjusted value discipline
The securities identified above represent a selection of securities identified by GMO quantitative measures. These specific securities are selected for presentation by GMO based on their underlying characteristics and are not selected on the basis of their investment performance. These securities are not necessarily representative of the securities purchased, sold or recommended for advisory clients, and it should not be assumed that the investment in the securities identified will be profitable.

29GMOCVP_Milwaukee Cnty_2-10
Proprietary information – not for distribution. Copyright © 2010 by GMO LLC. All rights reserved.
Source: GMO As of 12/31/09
The securities identified above represent a selection of securities identified by GMO quantitative measures. These specific securities are selected for presentation by GMO based on their underlying characteristics and are not selected on the basis of their investment performance. These securities are not necessarily representative of the securities purchased, sold or recommended for advisory clients, and it should not be assumed that the investment in the securities identified will be profitable.
Example: Roche relative to universe
Opportunity =Intrinsic
Value
Price
Value
Sales
Price
Growth
Future Sales
Sales
Profitability
Future Earnings
Future Sales
Payout & Discounting
Intrinsic Value
Future Earnings= × × ×
GMO Intrinsic Value Approach Looks to the FutureMean reversion drives the prediction
Roche – Intrinsic Value Decomposition
24%23%20%
-68%
163%
-100%
-50%
0%
50%
100%
150%
200%
RelativeValue
RelativeGrowth
RelativeProfitability
Payout &Discounting
RelativeOpportunity

30GMOCVP_Milwaukee Cnty_2-10
Proprietary information – not for distribution. Copyright © 2010 by GMO LLC. All rights reserved.
Momentum captures trends that may persist
Momentum predictsfuture earnings growth
Stocks ranked highest on momentum have the strongest earnings growth in the next year.
-20%-15%-10%-5%0%5%
10%15%20%25%30%
1 2 3 4 5 6 7 8 9 10
Stocks Grouped byGMO Momentum Score
Nex
t Yea
r's E
arni
ngs
Gro
wth
Lowest
MomentumHighest
Momentum
Note: Based on aggregate back-tested data from 1980-2009Source: GMO As of 12/31/09 Source: MSCI As of 6/30/08
0%
50%
100%
150%
200%
250%
300%
350%
80 82 84 86 88 90 92 94 96 98 00 02 04 06
Cum
ulat
ive
Per
form
ance
Rel
ativ
e to
MS
CI W
orld
Inde
x
Dec-
Japan+165% in 6 yrs
Emerging Markets+300% in 7 yrs Technology
+220% in 5 yrs
Mining+300% in 8 yrs
Momentum Identifies Companies with Improving Fundamentals

31GMOCVP_Milwaukee Cnty_2-10
Proprietary information – not for distribution. Copyright © 2010 by GMO LLC. All rights reserved.
Source: GMO As of 12/31/09
Market Cheap Markets
Competitive Position
(cheap currency)Rebound Potential (market and GDP reversal) Momentum
Overall Assessment
Australia -- -- -- -- Austria + + + Belgium + + Canada --- - -- Denmark -- -- -- Finland -- - France + + Germany - Hong Kong -- ++ Ireland +++ - ++ --- ++ Italy ++ -- +++ - ++ Japan ++ ++ -- + Netherlands New Zealand - ++ - Norway - + - Singapore + +++ -- ++ ++ Spain - - -- ++ - Portugal + -- + Sweden ++ + Switzerland - - - -- United Kingdom ++ + + United States -- ++ -
Assessment
Countries Still MatterTilt stock selection to the best countries and currencies

32GMOCVP_Milwaukee Cnty_2-10
Proprietary information – not for distribution. Copyright © 2010 by GMO LLC. All rights reserved.
Thomas Hancock Dr. Hancock is co-head of the GMO quantitative equity team and lead manager for international quantitative portfolios. Prior to joining GMO in 1995, he was a research scientist at Siemens and a software engineer at IBM. Dr. Hancock holds a Ph.D. in Computer Science from Harvard University and B.S. and M.S. degrees from Rensselaer Polytechnic Institute.
Sam Wilderman Mr. Wilderman is co-head of the GMO quantitative equity team and lead manager for U.S. quantitative portfolios. Previously at GMO, he was responsible for research and portfolio management for the GMO Emerging Markets Strategies. He joined GMO in 1996 following the completion of his B.A. in Economics from Yale University. Mr. Wilderman is a CFA charterholder.
Anthony Hene Mr. Hene is the lead manager for global quantitative portfolios. He joined GMO in 1995 and has been based in our London office. Mr. Hene has an MSc in Biochemistry from the University of Oxford and holds the CFA designation.
Chuck Joyce Mr. Joyce is the lead manager for quality quantitative portfolios. Prior to joining GMO in 1998, he worked for IBM and the U.S. Semiconductor Consortium, Sematech. Mr. Joyce earned his B.S. from Cornell University and his M.B.A. in Finance from the MIT Sloan School of Management.
Capsule Biographies: Quantitative Equity

33GMOCVP_Milwaukee Cnty_2-10
Proprietary information – not for distribution. Copyright © 2010 by GMO LLC. All rights reserved.
Prasun Agarwal Mr. Agarwal is a research analyst for GMO’s quantitative equity team. Prior to joining GMO in 2009, Mr. Agarwal was a quantitative trading researcher for Numeric Investors, LLC. Previously, he was a senior consultant for CBIZ Valuation Group, Incorporated. He earned his M.B.A. in Finance and Accounting from Southern Methodist University and his B.Tech. in Mechanical Engineering from The Indian Institute of Technology.
Justin Ashmall Dr. Ashmall is an analyst within GMO’s quantitative equity team based in GMO’s London office. Prior to joining GMO in 2008, he worked in Morgan Stanley’s Equity Trading Lab, focusing on high-frequency algorithmic trading and order execution. Previously, Dr. Ashmall was a postdoctoral research associate at the Center for Space Research at the Massachusetts Institute of Technology. Dr. Ashmall earned his B.S. in Physics and his PhD in Space Physics from Imperial College in London.
Naser Bashir Mr. Bashir is an analyst for the quantitative equity team based in GMO’s London office. Mr. Bashir, who joined GMO in 2005, holds a BSc and MSc in Economics from the London School of Economics & Political Science. He also holds an MSc in Computer Science from Birkbeck, University of London and he is a CFA charterholder.
Tomas Bok Dr. Bok is an analyst within GMO’s quantitative equity team, specializing in designing and implementing trading systems. Prior to joining GMO in 2007, he previously worked at Lehman Brothers as senior vice president of equity quantitative analytics, heading their U.S. algorithmic trading product and at Investment Technology Group (ITG) where he led the structured trading strategies group and designed and managed the firm’s algorithmic trading products. Dr. Bok holds a B.A. in Quantitative Economics from Stanford University and a Ph.D. in Economics from Harvard University.
John Breedis Dr. Breedis is engaged in portfolio management for quantitative equity portfolios. Prior to joining GMO in 2002, Dr. Breedis worked as a senior development engineer for AMP, Incorporated/Tyco Electronics. He earned his B.S. from Lehigh University and his M.S. and Ph.D. from Pennsylvania State University, each in Materials Science and Engineering.
Hassan Chowdhry Mr. Chowdhry is an analyst within GMO’s quantitative equity team. Prior to joining GMO in 2007, his previous positions as an analyst include Batterymarch Financial Management and Putnam Lovell NBF. Mr. Chowdhry earned his B.S. in Economics his and B.A.S in Systems Engineering from the University of Pennsylvania, his M.P.A. from Harvard and his M.B.A. from MIT.
Ty Cobb Mr. Cobb is a member of the quantitative equity team, focusing on fundamental research and portfolio management. Prior to joining GMO in 1997, he worked at Brown Brothers Harriman as an administrative officer in the global custody and account services department. Mr. Cobb received a B.A. in Economics/Russian Language from Bucknell University and his M.S. in Finance from Suffolk University. He is a CFA charterholder.
Neil Constable Dr. Constable is engaged in portfolio management for quantitative equity portfolios. Prior to joining GMO in 2006, he was a quantitative researcher for State Street Global Markets and a post-doctoral fellow at MIT. Dr. Constable earned his B.S. in Physics from the University of Calgary and his Ph.D. in Physics from McGill University.
Kenvor Cothey Mr. Cothey is an analyst within GMO’s quantitative equity team. Prior to joining GMO in 2007, he worked at Morgan Stanley, London as a technical quantitative analyst. Previously, he worked for Dow Jones, London, as a lead developer. Mr. Cothey earned his M.Sc. in Computation and his M.Phys. in Physics from Balliol College, Oxford University.
David Cowan Dr. Cowan is an analyst within GMO’s quantitative equity team. Prior to joining GMO in 2006, he worked as a financial analyst and software developer for Nantahala Capital Management. Dr. Cowan earned his B.A. in Mathematics and Religion from Williams College, and his M.A. in Humanities from the University of Chicago. Additionally, Dr. Cowan received his Ph.D. in Mathematics from Tufts University.
Capsule Biographies: Quantitative Equity

34GMOCVP_Milwaukee Cnty_2-10
Proprietary information – not for distribution. Copyright © 2010 by GMO LLC. All rights reserved.
Chris Fortson Mr. Fortson is an analyst within GMO’s quantitative equity team. Prior to joining GMO in 2009, he was an associate for Sankaty Advisors. Previously, he was also an analyst at Sankaty Advisors. Mr. Fortson earned his B.A. in Economics and Mathematics from Yale University.
Doug Francis Mr. Francis is a portfolio manager within GMO’s quantitative equity team. Prior to joining GMO in 2009, he was a managing director for LK Capital Management LP. Previously, he was also a managing director for Tisbury Capital Management LP. Mr. Francis earned his B.A. in Economics from Trinity College and his M.B.A. from Boston University.
Seth Glattstein Mr. Glattstein is an analyst within GMO’s quantitative equity team. Prior to joining GMO in 2001, he worked for Wellington Investment Management where he was involved in product development. Previously he was a lead software engineer for Project Software and Development, Inc. Mr. Glattstein earned his B.S. in Computer Engineering from Case Western Reserve University.
Mark Ingham Mr. Ingham is a portfolio manager for GMO London. Previously, he was responsible for portfolio management and investment research for the GMO emerging market equities products. Prior to this, he was engaged in portfolio management and research for the GMO global equity products. Before joining GMO in 2000, he was an investment consultancy analyst with William M. Mercer in London. Mr. Ingham earned his Masters in Mathematics from Oxford University. He is a CFA charterholder.
Anthony King Mr. King is an analyst within GMO’s quantitative equity team. Prior to joining GMO in 2002, he worked as an internet consultant for Winmill Software. Mr. King earned his B.S. in Management Science and Information Systems from Pennsylvania State University and his M.S. in Computer Science from Boston University.
Samuel Klar Mr. Klar is an analyst within GMO’s quantitative equity team. Prior to joining full-time in 2006, he held a co-op position at GMO with the Emerging Markets group. Mr. Klar earned his B.S. in Finance from Northeastern University.
Leanne Kunz Ms. Kunz is an analyst within GMO’s quantitative equity team. Prior to joining the quantitative equity team, Ms. Kunz worked as an analyst supporting GMO’s performance measurement effort. She joined GMO in 1999. Ms. Kunz earned her B.S. in Finance from Northeastern University.
Jeffrey Leong Mr. Leong is an analyst within GMO’s quantitative equity team. Prior to joining GMO in 2009, Mr. Leong was a developer for AQR Capital Management. Previously, he was a developer at Morgan Stanley. Mr. Leong earned his B.S. in Computer Science from Columbia University.
Anthony Leung Mr. Leung works on a part-time basis with the global equities team at GMO in London whilst he completes his PhD in Theoretical Condensed Matter Physics at the University of Cambridge. Prior to joining GMO in 2008, Mr. Leung previously worked for UBS in London and Hong Kong within the Equities Information Technology department.
Eric Liu Mr. Liu is an analyst within GMO’s quantitative equity team focusing on fundamental research. Prior to joining GMO in 2008, he worked as an analyst at Sankaty Advisors. Mr. Liu earned his B.A. in Economics from Yale University.
Donna Murphy Ms. Murphy is engaged in portfolio management and product management of GMO’s quantitative equities. Prior to joining GMO in 2002, she was a partner and co-head of product management for INVESCO within its structured products group. Previously, Ms. Murphy held senior positions with Nicholas Applegate, UBS and the DAIS Group/Templeton. She earned her B.A. in Chemistry and Biology from Elon College and her M.B.A. from the University of North Carolina.
Capsule Biographies: Quantitative Equity

35GMOCVP_Milwaukee Cnty_2-10
Proprietary information – not for distribution. Copyright © 2010 by GMO LLC. All rights reserved.
Tara Oliver Ms. Oliver is engaged in portfolio management for quantitative equity portfolios. Prior to joining GMO in 1996, she was an associate in the investment company practice at Coopers & Lybrand Consulting. Ms. Oliver earned her A.B. from Duke University and an M.B.A. from the Amos Tuck School of Business Administration at Dartmouth College. She is a CFA charterholder.
Robert Park Mr. Park is a fundamental analyst within GMO’s quantitative equity team. Prior to joining GMO in 2009, Mr. Park was an equity analyst for MFS Investment Management. Previously, he was the vice president and equity analyst for Pioneer Investment Management. Mr. Park earned his B.A. in History from Brown University and his M.B.A. in Business Administration from The University of Chicago.
Tom Rosalanko Mr. Rosalanko is a product manager focusing on GMO’s international quantitative equities. Prior to joining GMO in 2005, he worked at Putnam Investments as a managing director and institutional portfolio manager. Previously, he worked at SEI Corporation and Brown Brothers Harriman. Mr. Rosalanko earned his B.S. in Civil Engineering from MIT and his M.B.A. from The Wharton School, and is a CFA charterholder.
Joseph Stein Mr. Stein is an analyst within GMO’s quantitative equity team. Prior to joining GMO in 2003, he worked at Putnam Investments as an assistant vice president in financial engineering. Previously, Mr. Stein was a systems analyst in fixed income derivative research at Lehman Brothers. He earned his B.A. in Chemistry and Environmental Science from Wesleyan University and Masters Degree in Operations Research from Cornell University. Currently Mr. Stein is an MBA candidate at the Wharton School of Business at the University of Pennsylvania.
Martin Tarlie Dr. Tarlie is an analyst within GMO’s quantitative equity team. Prior to joining GMO in 2007, Dr. Tarlie previously worked as an analyst for Breakwater Trading and at Marlin Capital Corporation as the director of research. Dr. Tarlie earned his B.S. in Physics and Mathematics from the University of Michigan, his M.S. and Ph.D. in Physics from the University of Illinois at Urbana- Champaign, and his M.B.A. from the University of Chicago Graduate School of Business. He is a CFA charterholder.
Charles Taylor Mr. Taylor is engaged in portfolio management for quantitative equity portfolios. Prior to joining GMO in 1991, he was a geophysicist with the U.S. Air Force. Mr. Taylor earned his B.A. in Geology from New England College and his M.S. in Geophysics from Boston College.
Paul Wang Mr. Wang is an analyst within GMO’s quantitative equity team. Prior to joining GMO in 2008, he worked at The MathWorks Inc., most recently as a financial products software developer. Mr. Wang earned his B.S. in Biomedical Engineering from Boston University.
Lucas White Mr. White is engaged in portfolio management for quantitative equity portfolios. Prior to joining GMO in 2006, he worked as a programmer and analyst for Standish Mellon Asset management. Previously, he worked as a programmer and analyst for Massachusetts Financial Services. Mr. White earned his B.A. in Economics and Psychology from Duke University. He is a CFA charterholder.
Capsule Biographies: Quantitative Equity

36GMOCVP_Milwaukee Cnty_2-10
Proprietary information – not for distribution. Copyright © 2010 by GMO LLC. All rights reserved.
John Mann Mr. Mann leads GMO’s quantitative equity trading group. Prior to joining GMO in 1996, he was a senior fund accountant at State Street Bank & Trust Co. Mr. Mann earned his B.A. in Finance from the University of Massachusetts at Amherst and his Masters in Finance from Suffolk University.
Malica Aronowitz Ms. Aronowitz is engaged in the construction of computer-based portfolio management tools for quantitative equity research. Prior to joining GMO in 1992, she worked at the Draper Laboratories, affiliated with Massachusetts Institute of Technology, as a software engineer. Ms. Aronowitz earned a B.A. in Computer Science from Boston University.
Julie Coady Ms. Coady is a member of GMO’s quantitative team. Prior to joining GMO in 1998, she worked as a senior fund accountant at State Street Bank & Trust Co. Ms. Coady earned her B.S. in Business Administration from the University of Massachusetts at Lowell.
Christopher Cullinan Mr. Cullinan is a trader in GMO’s quantitative equity trading group. Prior to joining GMO in 1999, he was a senior account specialist with State Street Corporation. Mr. Cullinan earned his B.A. in Business Management from the University of Massachusetts at Lowell.
Jason Johnson Mr. Johnson works as a trader in GMO’s quantitative equity trading group. Prior to joining GMO in 1999, he was a trust reporting and testing coordinator at Scudder Kemper Investments. Mr. Johnson earned his B.A. in History from St. Lawrence University.
Michael Murphy Mr. Murphy is a member of the quantitative equity trading group, focusing on programming. Prior to joining GMO in 2003, he was a software engineer at Northrop Grumman Information Technology. Mr. Murphy earned his B.A. in Mathematics from Boston College.
Erik Norton Mr. Norton is a senior derivatives trader in GMO’s quantitative equity trading group, primarily focused on trades for the Asset Allocation team. Positions held prior to joining GMO in 2008 include head trader for Tisbury Capital Management’s North American team and head trader for Sowood Capital Management’s event and catalyst-driven equities team. Mr. Norton earned his B.S. in Mathematics from MIT.
Ryan Rouillard Mr. Rouillard works in GMO’s global quantitative trading group. Prior to joining GMO in 2004, he worked at Brown Brothers Harriman & Co., most recently as an operations supervisor in corporate actions. Mr. Rouillard earned his B.A. in Finance from the University of Massachusetts at Amherst.
Brian Smith Mr. Smith is a trader in GMO’s quantitative equity trading group. Prior to joining GMO in 1997, he was a fund accountant with First Data Corp. Mr. Smith earned his undergraduate degree from Western New England College.
Christopher Snow Mr. Snow works in GMO’s global quantitative trading group. Previously, he was a member of GMO’s shareholder services group. Prior to joining GMO in 2002, Mr. Snow worked as a client support administrator in the financial advisor division for Putnam Investments. Mr. Snow earned his B.A. in Political Science from Bates College.
Amit Tamba Mr. Tamba is a systems analyst within GMO’s quantitative equity team. Previously at GMO, Mr. Tamba was a member of GMO’s information technologies group. Prior to joining GMO full time in 2001, he was an intern with GMO’s information technologies group. Mr. Tamba earned his B.S. in Computer Engineering from Wentworth Institute of Technology.
Capsule Biographies: Quantitative Equity

37GMOCVP_Milwaukee Cnty_2-10
Proprietary information – not for distribution. Copyright © 2010 by GMO LLC. All rights reserved.
Description of Principal RisksThe following chart identifies the Principal Risks associated with each Strategy. Risks not marked for any particular Strategy may, however, still apply to some extent to that Strategy at various times.
U.S
. Cor
e
Qua
lity
U.S
. Int
rinsi
c Va
lue
U.S
. Gro
wth
U.S
. Sm
all/M
id C
ap V
alue
U.S
. Sm
all/M
id C
ap G
row
th
Rea
l Est
ate
Tax-
Man
aged
U.S
. Equ
ities
Inte
rnat
iona
l Cor
e Eq
uity
Inte
rnat
iona
l Int
rinsi
c Va
lue
Inte
rnat
iona
l Gro
wth
Inte
rnat
iona
l Sm
all C
ompa
nies
Cur
renc
y H
edge
d In
tern
atio
nal E
quity
Tax-
Man
aged
Inte
rnat
iona
l Equ
ities
Glo
bal E
quity
Market Risk - Equity Securities Risk
Market Risk - Value Securities Risk
Market Risk - Grow th Securities Risk
Liquidity Risk
Smaller Company Risk
Derivatives Risk
Foreign Investment Risk
Currency Risk
Focused Investment Risk
Real Estate Risk
Credit & Counterparty Risk
Market Disruption & Geopolitical Risk
U.S. Strategies Int'l./Global Strategies

40 Rowes Wharf Boston, Massachusetts 02110
(617) 330-7500 | www.gmo.com
GMONorth America | Europe | Asia-Pacific