Embed Size (px)
Citation preview
U.S. Department of EducationNCES 2009-021
Mini-Digest of Education Statistics 2008
Suggested Citation:
Snyder, T. D. (2009). Mini-Digest of Education Statistics, 2008 (NCES 2009-021). National Center for Education Statistics, Institute of Education Sciences, U.S. Department of Education. Washington, DC.
U.S. Department of EducationNCES 2009-021
Mini-Digest of Education Statistics 2008
March 2009
Thomas D. SnyderNational Center for Education Statistics
U.S. Department of Education Arne Duncan, Secretary
Institute of Education Sciences Sue Betka, Acting Director
National Center for Education Statistics Stuart Kerachsky, Acting Commissioner
The National Center for Education Statistics (NCES) is the primary federal entity for collecting, analyzing, and reporting data related to education in the United States and other nations. It fulfills a congressional mandate to collect, collate, analyze, and report full and complete statistics on the condition of education in the United States; conduct and publish reports and specialized analyses of the meaning and significance of such statistics; assist state and local education agencies in improving their statistical systems; and review and report on education activities in foreign countries.
National Center for Education StatisticsInstitute of Education SciencesU.S. Department of Education1990 K Street NWWashington, DC 20006-5651
March 2009
The NCES World Wide Web Home Page address is http://nces.ed.gov.
iii
ContentsPage
Foreword .................................................................vOverview ................................................................viThe Structure of American Education ................... vii
Enrollment ......................................................1Elementary and Secondary Schools ..................... 2
Public Schools ................................................................ 2Private Schools ............................................................... 3Projections ..................................................................... 4Prekindergarten and Kindergarten Enrollment ............... 5Enrollment Rates ........................................................... 6Enrollment, by Race and Ethnicity ................................ 7Enrollment in Programs for Children With Disabilities . 8
Degree-Granting Institutions .................................. 9College Enrollment ........................................................ 9Enrollment by Level and Attendance ............................ 10Enrollment Rates of 18- to 24-Year-Olds ..................... 11Enrollment by Sex and Age .......................................... 12Enrollment by Race and Ethnicity ............................... 13Graduate School Enrollment ........................................ 14First-Professional Enrollment ....................................... 15
Teachers, Faculty, and Staff .........................17Elementary and Secondary Schools ....................18
Number of Teachers ..................................................... 18Teachers’ Salaries .......................................................... 20Teacher Characteristics, Public Schools ........................ 21Teacher Characteristics, Private Schools ....................... 22
iv
PageDegree-Granting Institutions .................................23
College Staff.................................................................. 23Faculty Salaries for Males and Females .......................... 24Faculty Salaries for Public and Private Institutions ........ 25
Educational Outcomes ................................27Reading Performance ................................................... 28Mathematics Performance ............................................ 29Science Performance .................................................... 30High School Coursetaking Patterns ............................... 31Graduates ...................................................................... 33Dropouts ..................................................................... 35College Degrees ............................................................ 36Educational Attainment ................................................ 39
Finance ........................................................41Total Expenditures ................................................42Public Elementary and Secondary Schools ..........44
Revenues ...................................................................... 44Expenditures ................................................................ 46
Degree-Granting Institutions .................................47Revenues for Public Institutions ................................... 47Revenues for Private (not-for-profit) Institutions .......... 48Revenues for Private (for-profit) Institutions ................. 49Expenditures of Public Institutions ............................... 50Expenditures of Private (not-for-profit) Institutions ..... 51Expenditures of Private (for-profit) Institutions ............. 52College Costs ............................................................... 53Financial Aid for Students ............................................ 54Federal Funding ........................................................... 56
Source Information ................................................58NCES Website Tools ...............................................64
v
ForewordWelcome to the 14th edition of the Mini-Digest of Education Statistics. The primary purpose of this publication is to provide a pocket-sized compilation of statistical information covering the broad field of American education from prekindergarten through graduate school. The statistical highlights provide a quantitative description of the current American education scene.
The Mini-Digest is designed as an easy reference for materials found in much greater detail in the Digest of Education Statistics, 2008.
These volumes include selections of data from many government sources, especially drawing on results of surveys and activities carried out by the National Center for Education Statistics (NCES). They include information on the number of schools and colleges, teachers, enrollments, and graduates, in addition to educational outcomes, finances, and federal funds for education. Unless otherwise stated, all data are extracted from the Digest of Education Statistics, 2008. Unless indicated as a projection or estimate, all data presented in this report are actual. Information on statistical procedures, definitions, and survey sources appears in the introduction and appendixes A and B of the Digest of Education Statistics, 2008.
vi
OverviewIn the fall of 2008, about 83.9 million people in the United States were either enrolled or employed in public and private schools and colleges (Digest of Education Statistics, 2008, table 1). Included in this total were 74.1 million students enrolled in American schools and colleges.1 About 4.6 million people were employed as elementary and secondary school teachers or as college faculty and teaching assistants. Other professional, administrative, and support staff of educational institutions totaled 5.2 million. In a nation with a population of about 304 million in 2008, more than 1 out of every 4 people participated in formal education (Digest of Education Statistics, 2008, table 15).
1 Tables in this report on elementary and secondary schools do not include data on homeschooled children. In 2007, there were 1.5 million home-schooled children (1.5 Million Homeschooled Students in the United States in 2007, NCES 2009-030).
For more information on education statistics, please go to: http://nces.ed.gov. For further detail on the tools available through the National Center for Education Statistics (NCES) website, go to page 64 of this publication.
vii
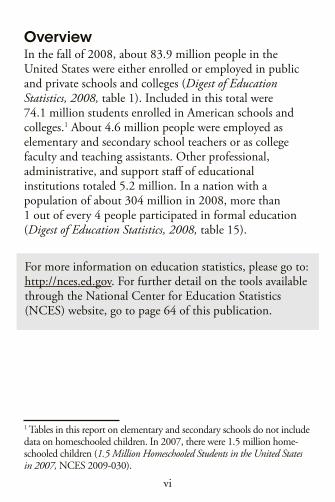
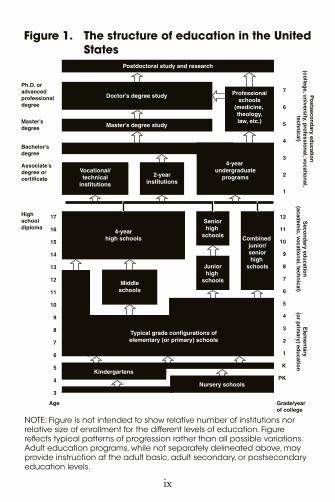
The Structure of American EducationFigure 1 shows the structure of education in the United States: the three levels of education—elementary, secondary, and postsecondary—and the approximate age range of people at the elementary and secondary levels. Students ordinarily spend from 6 to 8 years in the elementary grades, which may be preceded by 1 to 3 years in early childhood programs and kindergarten. The elementary program is frequently followed by a middle school or junior high school program, which generally lasts 2 or 3 years. Students then may finish their compulsory schooling at the secondary or high school level, which may last from 3 to 6 years depending on the structure within their school district. Students normally complete the entire program through grade 12 by age 18.
High school completers who decide to continue their education may enter a technical or vocational institution, a 2-year college, a 4-year college, or a university. A 2-year college normally offers the first 2 years of a standard 4-year college curriculum and a selection of terminal vocational programs.
Academic courses completed at a 2-year college are usually transferable for credit at a 4-year college or university. A technical or vocational institution offers postsecondary technical training leading to a specific career.
The term “degree-granting institutions” used in this report refers to colleges and universities that offer associate’s
viii
or higher degrees and whose students are eligible to participate in Title IV federal financial aid programs.
An associate’s degree requires the equivalent of at least 2 years of full-time college-level work, and a bachelor’s degree normally can be earned in 4 years. At least 1 year beyond the bachelor’s is necessary for a master’s degree, while a doctor’s degree usually requires a minimum of 3 or 4 years beyond the bachelor’s.
Professional schools differ widely in admissions requirements and in program length. Medical students, for example, generally complete a 4-year program of premedical studies at a college or university before they can enter the 4-year program at a medical school. Law programs normally require 3 years of coursework beyond the bachelor’s degree level.
Other types of educational opportunities for adults are offered by community organizations, libraries, religious institutions, and businesses.
ix
Postdoctoral study and research
Doctor’s degree study Professionalschools
(medicine, theology,law, etc.)
4-year undergraduate
programsVocational/technical
institutions
2-yearinstitutions
Combined junior/seniorhigh
schools
Seniorhigh
schools4-year
high schools
Juniorhigh
schools
Master’s degree study
Typical grade configurations ofelementary (or primary) schools
Middleschools
Kindergartens
Nursery schools
Ph.D. or advancedprofessionaldegree
Master’sdegree
Bachelor’sdegree
Associate’s degree or certificate
Po
stsecon
dary ed
ucatio
n(co
llege, u
niversity, p
rofessio
nal, vo
cation
al,tech
nical)
High school diploma
Seco
nd
ary edu
cation
(academ
ic, vocatio
nal, tech
nical)
Elem
entary
(or p
rimary) ed
ucatio
n
Age Grade/yearof college
17
16
15
14
13
12
11
10
9
8
7
6
5
4
3
12
11
10
9
8
7
6
5
4
3
2
1
K
PK
7
6
5
4
3
2
1
NOTE: Figure is not intended to show relative number of institutions nor relative size of enrollment for the different levels of education. Figure reflects typical patterns of progression rather than all possible variations. Adult education programs, while not separately delineated above, may provide instruction at the adult basic, adult secondary, or postsecondary education levels.
Figure 1. The structure of education in the United States


1
Enrollment
2
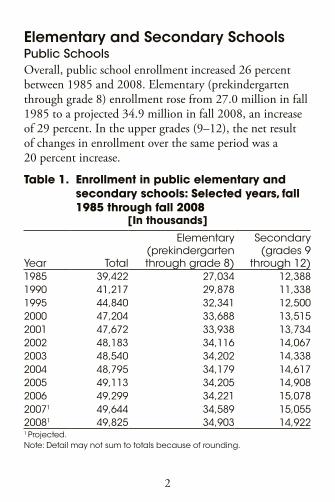
Elementary and Secondary Schools Public Schools Overall, public school enrollment increased 26 percent between 1985 and 2008. Elementary (prekindergarten through grade 8) enrollment rose from 27.0 million in fall 1985 to a projected 34.9 million in fall 2008, an increase of 29 percent. In the upper grades (9–12), the net result of changes in enrollment over the same period was a 20 percent increase.
Table 1. Enrollment in public elementary and secondary schools: Selected years, fall 1985 through fall 2008
[In thousands]
Year Total
Elementary (prekindergarten through grade 8)
Secondary (grades 9
through 12)1985 39,422 27,034 12,3881990 41,217 29,878 11,3381995 44,840 32,341 12,5002000 47,204 33,688 13,5152001 47,672 33,938 13,7342002 48,183 34,116 14,0672003 48,540 34,202 14,3382004 48,795 34,179 14,6172005 49,113 34,205 14,9082006 49,299 34,221 15,07820071 49,644 34,589 15,05520081 49,825 34,903 14,9221 Projected.Note: Detail may not sum to totals because of rounding.
3
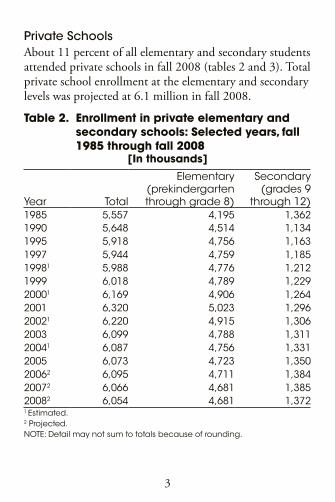
Private Schools About 11 percent of all elementary and secondary students attended private schools in fall 2008 (tables 2 and 3). Total private school enrollment at the elementary and secondary levels was projected at 6.1 million in fall 2008.
Table 2. Enrollment in private elementary and secondary schools: Selected years, fall 1985 through fall 2008
[In thousands]
Year Total
Elementary (prekindergarten through grade 8)
Secondary (grades 9
through 12)1985 5,557 4,195 1,3621990 5,648 4,514 1,1341995 5,918 4,756 1,1631997 5,944 4,759 1,18519981 5,988 4,776 1,2121999 6,018 4,789 1,22920001 6,169 4,906 1,2642001 6,320 5,023 1,29620021 6,220 4,915 1,3062003 6,099 4,788 1,31120041 6,087 4,756 1,3312005 6,073 4,723 1,35020062 6,095 4,711 1,38420072 6,066 4,681 1,38520082 6,054 4,681 1,3721 Estimated.2 Projected.NOTE: Detail may not sum to totals because of rounding.
4
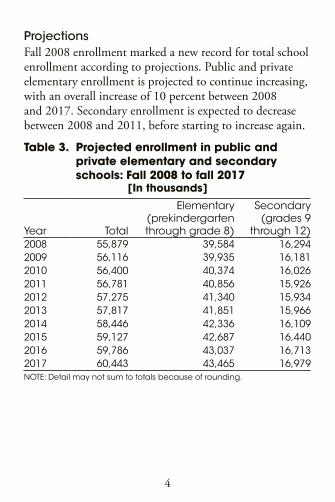
Projections Fall 2008 enrollment marked a new record for total school enrollment according to projections. Public and private elementary enrollment is projected to continue increasing, with an overall increase of 10 percent between 2008 and 2017. Secondary enrollment is expected to decrease between 2008 and 2011, before starting to increase again.
Table 3. Projected enrollment in public and private elementary and secondary schools: Fall 2008 to fall 2017
[In thousands]
Year Total
Elementary (prekindergarten through grade 8)
Secondary (grades 9
through 12)2008 55,879 39,584 16,2942009 56,116 39,935 16,1812010 56,400 40,374 16,0262011 56,781 40,856 15,9262012 57,275 41,340 15,9342013 57,817 41,851 15,9662014 58,446 42,336 16,1092015 59,127 42,687 16,4402016 59,786 43,037 16,7132017 60,443 43,465 16,979NOTE: Detail may not sum to totals because of rounding.
5
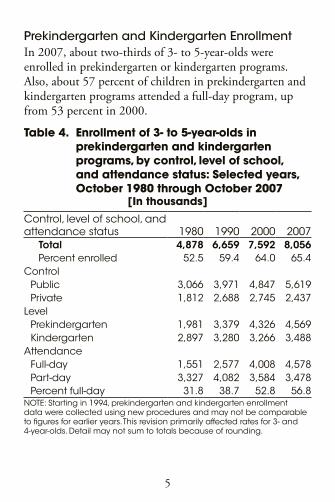
Prekindergarten and Kindergarten Enrollment In 2007, about two-thirds of 3- to 5-year-olds were enrolled in prekindergarten or kindergarten programs. Also, about 57 percent of children in prekindergarten and kindergarten programs attended a full-day program, up from 53 percent in 2000.
Table 4. Enrollment of 3- to 5-year-olds in prekindergarten and kindergarten programs, by control, level of school, and attendance status: Selected years, October 1980 through October 2007
[In thousands]
Control, level of school, and attendance status 1980 1990 2000 2007
Total 4,878 6,659 7,592 8,056Percent enrolled 52.5 59.4 64.0 65.4
ControlPublic 3,066 3,971 4,847 5,619Private 1,812 2,688 2,745 2,437
LevelPrekindergarten 1,981 3,379 4,326 4,569Kindergarten 2,897 3,280 3,266 3,488
AttendanceFull-day 1,551 2,577 4,008 4,578Part-day 3,327 4,082 3,584 3,478Percent full-day 31.8 38.7 52.8 56.8
NOTE: Starting in 1994, prekindergarten and kindergarten enrollment data were collected using new procedures and may not be comparable to figures for earlier years. This revision primarily affected rates for 3- and 4-year-olds. Detail may not sum to totals because of rounding.
6
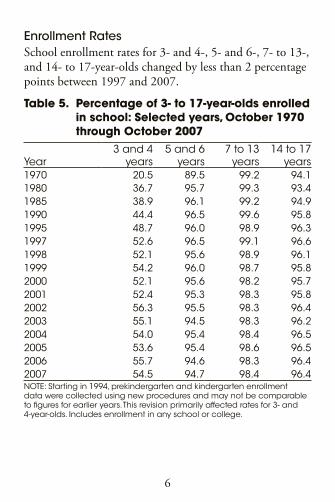
Enrollment Rates School enrollment rates for 3- and 4-, 5- and 6-, 7- to 13-, and 14- to 17-year-olds changed by less than 2 percentage points between 1997 and 2007.
Table 5. Percentage of 3- to 17-year-olds enrolled in school: Selected years, October 1970 through October 2007
Year3 and 4
years5 and 6
years7 to 13
years14 to 17
years1970 20.5 89.5 99.2 94.11980 36.7 95.7 99.3 93.41985 38.9 96.1 99.2 94.91990 44.4 96.5 99.6 95.81995 48.7 96.0 98.9 96.31997 52.6 96.5 99.1 96.61998 52.1 95.6 98.9 96.11999 54.2 96.0 98.7 95.82000 52.1 95.6 98.2 95.72001 52.4 95.3 98.3 95.82002 56.3 95.5 98.3 96.42003 55.1 94.5 98.3 96.22004 54.0 95.4 98.4 96.52005 53.6 95.4 98.6 96.52006 55.7 94.6 98.3 96.42007 54.5 94.7 98.4 96.4NOTE: Starting in 1994, prekindergarten and kindergarten enrollment data were collected using new procedures and may not be comparable to figures for earlier years. This revision primarily affected rates for 3- and 4-year-olds. Includes enrollment in any school or college.
7
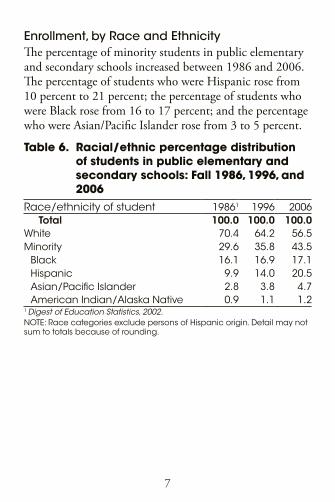
Enrollment, by Race and Ethnicity The percentage of minority students in public elementary and secondary schools increased between 1986 and 2006. The percentage of students who were Hispanic rose from 10 percent to 21 percent; the percentage of students who were Black rose from 16 to 17 percent; and the percentage who were Asian/Pacific Islander rose from 3 to 5 percent.
Table 6. Racial/ethnic percentage distribution of students in public elementary and secondary schools: Fall 1986, 1996, and 2006
Race/ethnicity of student 19861 1996 2006Total 100.0 100.0 100.0
White 70.4 64.2 56.5Minority 29.6 35.8 43.5
Black 16.1 16.9 17.1Hispanic 9.9 14.0 20.5Asian/Pacific Islander 2.8 3.8 4.7American Indian/Alaska Native 0.9 1.1 1.2
1 Digest of Education Statistics, 2002.NOTE: Race categories exclude persons of Hispanic origin. Detail may not sum to totals because of rounding.
8
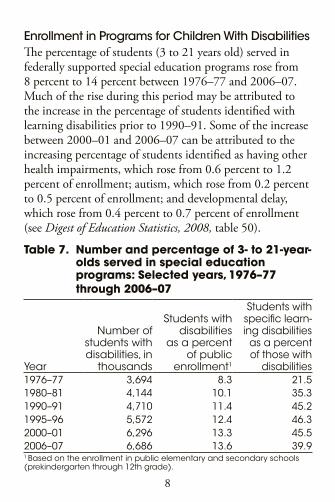
Enrollment in Programs for Children With DisabilitiesThe percentage of students (3 to 21 years old) served in federally supported special education programs rose from 8 percent to 14 percent between 1976–77 and 2006–07. Much of the rise during this period may be attributed to the increase in the percentage of students identified with learning disabilities prior to 1990–91. Some of the increase between 2000–01 and 2006–07 can be attributed to the increasing percentage of students identified as having other health impairments, which rose from 0.6 percent to 1.2 percent of enrollment; autism, which rose from 0.2 percent to 0.5 percent of enrollment; and developmental delay, which rose from 0.4 percent to 0.7 percent of enrollment (see Digest of Education Statistics, 2008, table 50).
Table 7. Number and percentage of 3- to 21-year-olds served in special education programs: Selected years, 1976–77 through 2006–07
Year
Number of students with disabilities, in
thousands
Students with disabilities
as a percent of public
enrollment1
Students with specific learn-ing disabilities
as a percent of those with
disabilities1976–77 3,694 8.3 21.51980–81 4,144 10.1 35.31990–91 4,710 11.4 45.21995–96 5,572 12.4 46.32000–01 6,296 13.3 45.52006–07 6,686 13.6 39.91 Based on the enrollment in public elementary and secondary schools (prekindergarten through 12th grade).
9
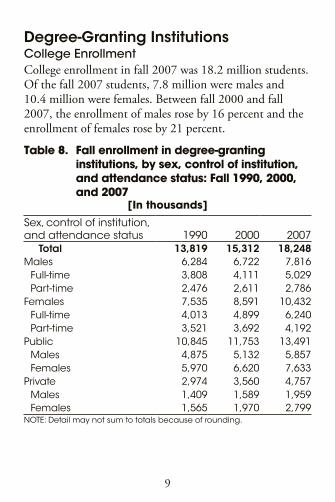
Degree-Granting InstitutionsCollege Enrollment College enrollment in fall 2007 was 18.2 million students. Of the fall 2007 students, 7.8 million were males and 10.4 million were females. Between fall 2000 and fall 2007, the enrollment of males rose by 16 percent and the enrollment of females rose by 21 percent.
Table 8. Fall enrollment in degree-granting institutions, by sex, control of institution, and attendance status: Fall 1990, 2000, and 2007
[In thousands]
Sex, control of institution, and attendance status 1990 2000 2007
Total 13,819 15,312 18,248Males 6,284 6,722 7,816
Full-time 3,808 4,111 5,029Part-time 2,476 2,611 2,786
Females 7,535 8,591 10,432Full-time 4,013 4,899 6,240Part-time 3,521 3,692 4,192
Public 10,845 11,753 13,491Males 4,875 5,132 5,857Females 5,970 6,620 7,633
Private 2,974 3,560 4,757Males 1,409 1,589 1,959Females 1,565 1,970 2,799
NOTE: Detail may not sum to totals because of rounding.
10
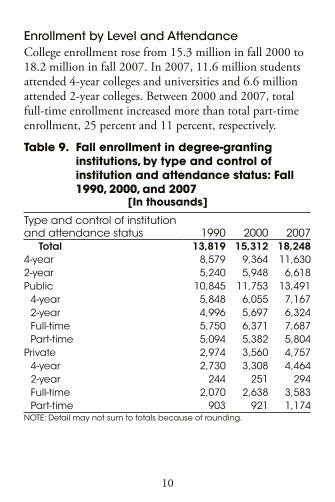
Enrollment by Level and AttendanceCollege enrollment rose from 15.3 million in fall 2000 to 18.2 million in fall 2007. In 2007, 11.6 million students attended 4-year colleges and universities and 6.6 million attended 2-year colleges. Between 2000 and 2007, total full-time enrollment increased more than total part-time enrollment, 25 percent and 11 percent, respectively.
Table 9. Fall enrollment in degree-granting institutions, by type and control of institution and attendance status: Fall 1990, 2000, and 2007
[In thousands]
Type and control of institution and attendance status 1990 2000 2007
Total 13,819 15,312 18,2484-year 8,579 9,364 11,6302-year 5,240 5,948 6,618Public 10,845 11,753 13,491
4-year 5,848 6,055 7,1672-year 4,996 5,697 6,324Full-time 5,750 6,371 7,687Part-time 5,094 5,382 5,804
Private 2,974 3,560 4,7574-year 2,730 3,308 4,4642-year 244 251 294Full-time 2,070 2,638 3,583Part-time 903 921 1,174
NOTE: Detail may not sum to totals because of rounding.
11
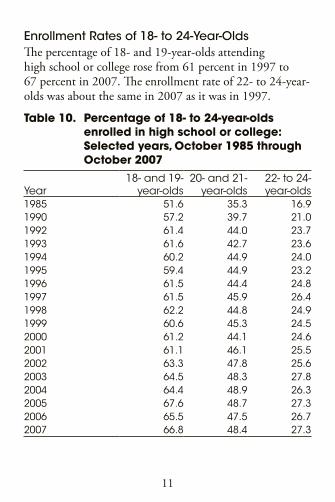
Enrollment Rates of 18- to 24-Year-Olds The percentage of 18- and 19-year-olds attending high school or college rose from 61 percent in 1997 to 67 percent in 2007. The enrollment rate of 22- to 24-year-olds was about the same in 2007 as it was in 1997.
Table 10. Percentage of 18- to 24-year-olds enrolled in high school or college: Selected years, October 1985 through October 2007
Year18- and 19-
year-olds 20- and 21-
year-olds22- to 24- year-olds
1985 51.6 35.3 16.91990 57.2 39.7 21.01992 61.4 44.0 23.71993 61.6 42.7 23.61994 60.2 44.9 24.01995 59.4 44.9 23.21996 61.5 44.4 24.81997 61.5 45.9 26.41998 62.2 44.8 24.91999 60.6 45.3 24.52000 61.2 44.1 24.62001 61.1 46.1 25.52002 63.3 47.8 25.62003 64.5 48.3 27.82004 64.4 48.9 26.32005 67.6 48.7 27.32006 65.5 47.5 26.72007 66.8 48.4 27.3
12
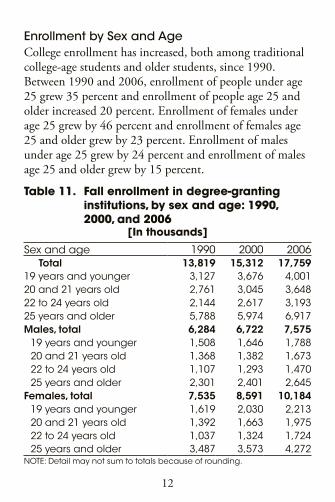
Enrollment by Sex and AgeCollege enrollment has increased, both among traditional college-age students and older students, since 1990. Between 1990 and 2006, enrollment of people under age 25 grew 35 percent and enrollment of people age 25 and older increased 20 percent. Enrollment of females under age 25 grew by 46 percent and enrollment of females age 25 and older grew by 23 percent. Enrollment of males under age 25 grew by 24 percent and enrollment of males age 25 and older grew by 15 percent.
Table 11. Fall enrollment in degree-granting institutions, by sex and age: 1990, 2000, and 2006
[In thousands]
Sex and age 1990 2000 2006Total 13,819 15,312 17,759
19 years and younger 3,127 3,676 4,00120 and 21 years old 2,761 3,045 3,64822 to 24 years old 2,144 2,617 3,19325 years and older 5,788 5,974 6,917Males, total 6,284 6,722 7,575
19 years and younger 1,508 1,646 1,78820 and 21 years old 1,368 1,382 1,67322 to 24 years old 1,107 1,293 1,47025 years and older 2,301 2,401 2,645
Females, total 7,535 8,591 10,18419 years and younger 1,619 2,030 2,21320 and 21 years old 1,392 1,663 1,97522 to 24 years old 1,037 1,324 1,72425 years and older 3,487 3,573 4,272
NOTE: Detail may not sum to totals because of rounding.
13
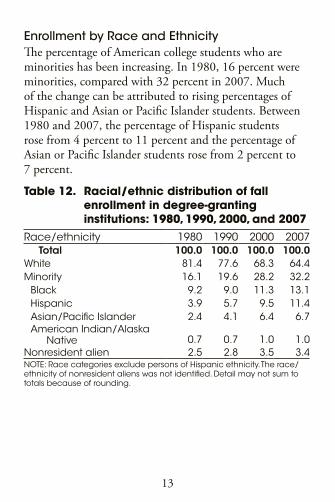
Enrollment by Race and Ethnicity The percentage of American college students who are minorities has been increasing. In 1980, 16 percent were minorities, compared with 32 percent in 2007. Much of the change can be attributed to rising percentages of Hispanic and Asian or Pacific Islander students. Between 1980 and 2007, the percentage of Hispanic students rose from 4 percent to 11 percent and the percentage of Asian or Pacific Islander students rose from 2 percent to 7 percent.
Table 12. Racial/ethnic distribution of fall enrollment in degree-granting institutions: 1980, 1990, 2000, and 2007
Race/ethnicity 1980 1990 2000 2007Total 100.0 100.0 100.0 100.0
White 81.4 77.6 68.3 64.4Minority 16.1 19.6 28.2 32.2
Black 9.2 9.0 11.3 13.1Hispanic 3.9 5.7 9.5 11.4Asian/Pacific Islander 2.4 4.1 6.4 6.7American Indian/Alaska
Native 0.7 0.7 1.0 1.0Nonresident alien 2.5 2.8 3.5 3.4NOTE: Race categories exclude persons of Hispanic ethnicity. The race/ethnicity of nonresident aliens was not identified. Detail may not sum to totals because of rounding.
14
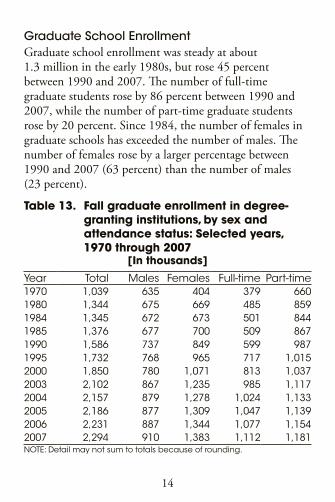
Graduate School Enrollment Graduate school enrollment was steady at about 1.3 million in the early 1980s, but rose 45 percent between 1990 and 2007. The number of full-time graduate students rose by 86 percent between 1990 and 2007, while the number of part-time graduate students rose by 20 percent. Since 1984, the number of females in graduate schools has exceeded the number of males. The number of females rose by a larger percentage between 1990 and 2007 (63 percent) than the number of males (23 percent).
Table 13. Fall graduate enrollment in degree-granting institutions, by sex and attendance status: Selected years, 1970 through 2007
[In thousands]
Year Total Males Females Full-time Part-time1970 1,039 635 404 379 6601980 1,344 675 669 485 8591984 1,345 672 673 501 8441985 1,376 677 700 509 8671990 1,586 737 849 599 9871995 1,732 768 965 717 1,0152000 1,850 780 1,071 813 1,0372003 2,102 867 1,235 985 1,1172004 2,157 879 1,278 1,024 1,1332005 2,186 877 1,309 1,047 1,1392006 2,231 887 1,344 1,077 1,1542007 2,294 910 1,383 1,112 1,181NOTE: Detail may not sum to totals because of rounding.
15
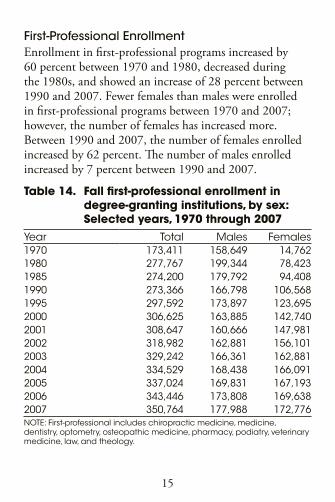
First-Professional Enrollment Enrollment in first-professional programs increased by 60 percent between 1970 and 1980, decreased during the 1980s, and showed an increase of 28 percent between 1990 and 2007. Fewer females than males were enrolled in first-professional programs between 1970 and 2007; however, the number of females has increased more. Between 1990 and 2007, the number of females enrolled increased by 62 percent. The number of males enrolled increased by 7 percent between 1990 and 2007.
Table 14. Fall first-professional enrollment in degree-granting institutions, by sex: Selected years, 1970 through 2007
Year Total Males Females1970 173,411 158,649 14,7621980 277,767 199,344 78,4231985 274,200 179,792 94,4081990 273,366 166,798 106,5681995 297,592 173,897 123,6952000 306,625 163,885 142,7402001 308,647 160,666 147,9812002 318,982 162,881 156,1012003 329,242 166,361 162,8812004 334,529 168,438 166,0912005 337,024 169,831 167,1932006 343,446 173,808 169,6382007 350,764 177,988 172,776NOTE: First-professional includes chiropractic medicine, medicine, dentistry, optometry, osteopathic medicine, pharmacy, podiatry, veterinary medicine, law, and theology.


17
Teachers, Faculty, and Staff
18
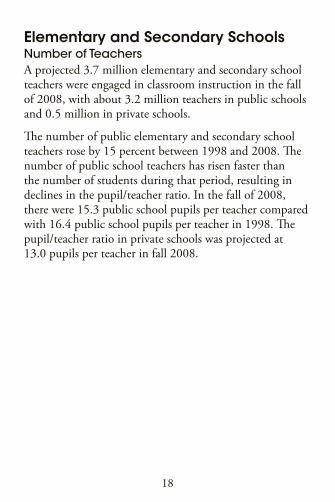
Elementary and Secondary SchoolsNumber of Teachers A projected 3.7 million elementary and secondary school teachers were engaged in classroom instruction in the fall of 2008, with about 3.2 million teachers in public schools and 0.5 million in private schools.
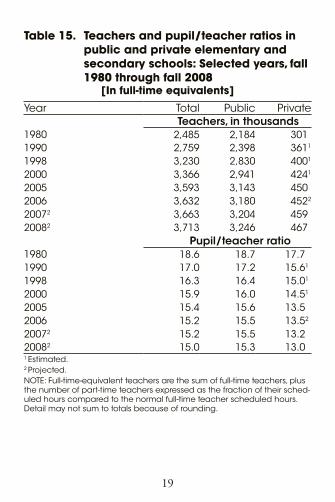
The number of public elementary and secondary school teachers rose by 15 percent between 1998 and 2008. The number of public school teachers has risen faster than the number of students during that period, resulting in declines in the pupil/teacher ratio. In the fall of 2008, there were 15.3 public school pupils per teacher compared with 16.4 public school pupils per teacher in 1998. The pupil/teacher ratio in private schools was projected at 13.0 pupils per teacher in fall 2008.
19
Table 15. Teachers and pupil/teacher ratios in public and private elementary and secondary schools: Selected years, fall 1980 through fall 2008
[In full-time equivalents]
Year Total Public Private Teachers, in thousands
1980 2,485 2,184 3011
1990 2,759 2,398 3611
1998 3,230 2,830 4001
2000 3,366 2,941 4241
2005 3,593 3,143 4501
2006 3,632 3,180 4522
20072 3,663 3,204 4591
20082 3,713 3,246 4671
Pupil/teacher ratio1980 18.6 18.7 17.71 1990 17.0 17.2 15.61
1998 16.3 16.4 15.01
2000 15.9 16.0 14.51
2005 15.4 15.6 13.512006 15.2 15.5 13.52
20072 15.2 15.5 13.2120082 15.0 15.3 13.011 Estimated.2 Projected.NOTE: Full-time-equivalent teachers are the sum of full-time teachers, plus the number of part-time teachers expressed as the fraction of their sched-uled hours compared to the normal full-time teacher scheduled hours. Detail may not sum to totals because of rounding.
20
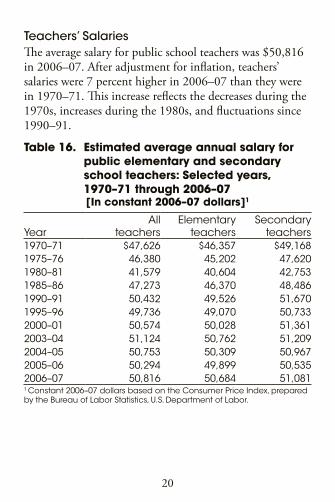
Teachers’ Salaries The average salary for public school teachers was $50,816 in 2006–07. After adjustment for inflation, teachers’ salaries were 7 percent higher in 2006–07 than they were in 1970–71. This increase reflects the decreases during the 1970s, increases during the 1980s, and fluctuations since 1990–91.
Table 16. Estimated average annual salary for public elementary and secondary school teachers: Selected years, 1970–71 through 2006–07[In constant 2006–07 dollars]1
Year All teachers
Elementary teachers
Secondary teachers
1970–71 $47,626 $46,357 $49,1681975–76 46,380 45,202 47,6201980–81 41,579 40,604 42,7531985–86 47,273 46,370 48,4861990–91 50,432 49,526 51,6701995–96 49,736 49,070 50,7332000–01 50,574 50,028 51,3612003–04 51,124 50,762 51,2092004–05 50,753 50,309 50,9672005–06 50,294 49,899 50,5352006–07 50,816 50,684 51,0811 Constant 2006–07 dollars based on the Consumer Price Index, prepared by the Bureau of Labor Statistics, U.S. Department of Labor.
21
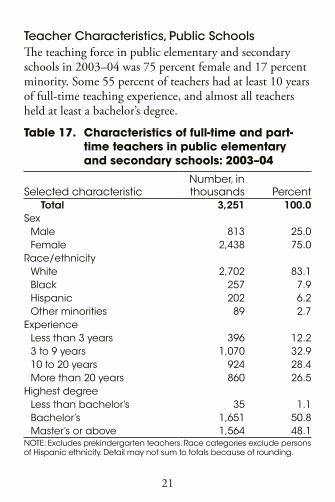
Teacher Characteristics, Public Schools The teaching force in public elementary and secondary schools in 2003–04 was 75 percent female and 17 percent minority. Some 55 percent of teachers had at least 10 years of full-time teaching experience, and almost all teachers held at least a bachelor’s degree.
Table 17. Characteristics of full-time and part-time teachers in public elementary and secondary schools: 2003–04
Selected characteristicNumber, in thousands Percent
Total 3,251 100.0Sex
Male 813 25.0Female 2,438 75.0
Race/ethnicityWhite 2,702 83.1Black 257 7.9Hispanic 202 6.2Other minorities 89 2.7
ExperienceLess than 3 years 396 12.23 to 9 years 1,070 32.910 to 20 years 924 28.4More than 20 years 860 26.5
Highest degreeLess than bachelor’s 35 1.1Bachelor’s 1,651 50.8Master’s or above 1,564 48.1
NOTE: Excludes prekindergarten teachers. Race categories exclude persons of Hispanic ethnicity. Detail may not sum to totals because of rounding.
22
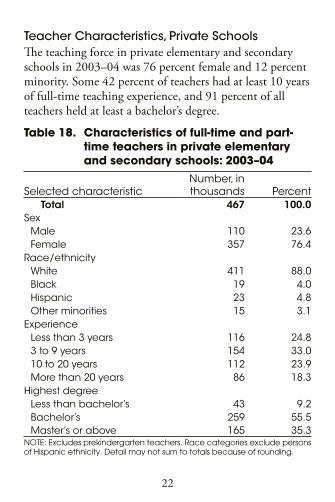
Teacher Characteristics, Private SchoolsThe teaching force in private elementary and secondary schools in 2003–04 was 76 percent female and 12 percent minority. Some 42 percent of teachers had at least 10 years of full-time teaching experience, and 91 percent of all teachers held at least a bachelor’s degree.
Table 18. Characteristics of full-time and part-time teachers in private elementary and secondary schools: 2003–04
Selected characteristicNumber, in thousands Percent
Total 467 100.0Sex
Male 110 23.6Female 357 76.4
Race/ethnicityWhite 411 88.0Black 19 4.0Hispanic 23 4.8Other minorities 15 3.1
ExperienceLess than 3 years 116 24.83 to 9 years 154 33.010 to 20 years 112 23.9More than 20 years 86 18.3
Highest degreeLess than bachelor’s 43 9.2Bachelor’s 259 55.5Master’s or above 165 35.3
NOTE: Excludes prekindergarten teachers. Race categories exclude persons of Hispanic ethnicity. Detail may not sum to totals because of rounding.
23
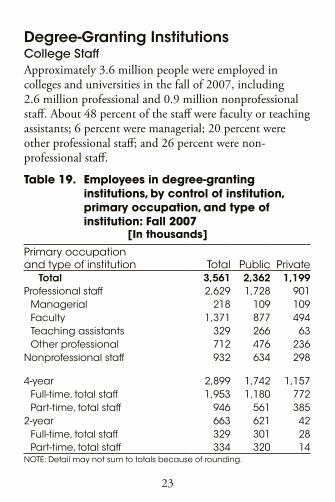
Degree-Granting InstitutionsCollege StaffApproximately 3.6 million people were employed in colleges and universities in the fall of 2007, including 2.6 million professional and 0.9 million nonprofessional staff. About 48 percent of the staff were faculty or teaching assistants; 6 percent were managerial; 20 percent were other professional staff; and 26 percent were non- professional staff.
Table 19. Employees in degree-granting institutions, by control of institution, primary occupation, and type of institution: Fall 2007
[In thousands]
Primary occupation and type of institution Total Public Private
Total 3,561 2,362 1,199Professional staff 2,629 1,728 901
Managerial 218 109 109Faculty 1,371 877 494Teaching assistants 329 266 63Other professional 712 476 236
Nonprofessional staff 932 634 298
4-year 2,899 1,742 1,157Full-time, total staff 1,953 1,180 772Part-time, total staff 946 561 385
2-year 663 621 42Full-time, total staff 329 301 28Part-time, total staff 334 320 14
NOTE: Detail may not sum to totals because of rounding.
24
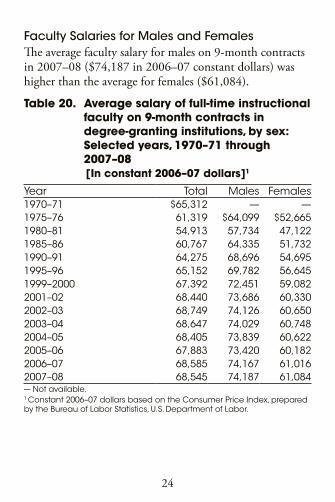
Faculty Salaries for Males and FemalesThe average faculty salary for males on 9-month contracts in 2007–08 ($74,187 in 2006–07 constant dollars) was higher than the average for females ($61,084).
Table 20. Average salary of full-time instructional faculty on 9-month contracts in degree-granting institutions, by sex: Selected years, 1970–71 through 2007–08 [In constant 2006–07 dollars]1
Year Total Males Females1970–71 $65,312 — —1975–76 61,319 $64,099 $52,6651980–81 54,913 57,734 47,1221985–86 60,767 64,335 51,7321990–91 64,275 68,696 54,6951995–96 65,152 69,782 56,6451999–2000 67,392 72,451 59,0822001–02 68,440 73,686 60,3302002–03 68,749 74,126 60,6502003–04 68,647 74,029 60,7482004–05 68,405 73,839 60,6222005–06 67,883 73,420 60,1822006–07 68,585 74,167 61,0162007–08 68,545 74,187 61,084--- Not available.1 Constant 2006–07 dollars based on the Consumer Price Index, prepared by the Bureau of Labor Statistics, U.S. Department of Labor.
25
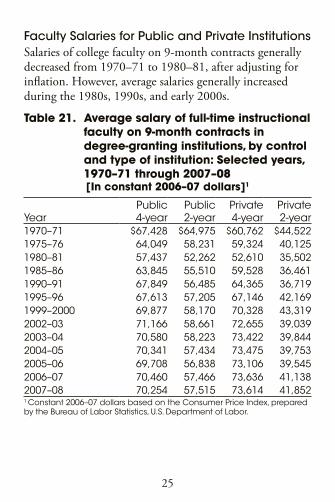
Faculty Salaries for Public and Private InstitutionsSalaries of college faculty on 9-month contracts generally decreased from 1970–71 to 1980–81, after adjusting for inflation. However, average salaries generally increased during the 1980s, 1990s, and early 2000s.
Table 21. Average salary of full-time instructional faculty on 9-month contracts in degree-granting institutions, by control and type of institution: Selected years, 1970–71 through 2007–08[In constant 2006–07 dollars]1
YearPublic 4-year
Public 2-year
Private 4-year
Private 2-year
1970–71 $67,428 $64,975 $60,762 $44,5221975–76 64,049 58,231 59,324 40,1251980–81 57,437 52,262 52,610 35,5021985–86 63,845 55,510 59,528 36,4611990–91 67,849 56,485 64,365 36,7191995–96 67,613 57,205 67,146 42,1691999–2000 69,877 58,170 70,328 43,3192002–03 71,166 58,661 72,655 39,0392003–04 70,580 58,223 73,422 39,8442004–05 70,341 57,434 73,475 39,7532005–06 69,708 56,838 73,106 39,5452006–07 70,460 57,466 73,636 41,1382007–08 70,254 57,515 73,614 41,8521 Constant 2006–07 dollars based on the Consumer Price Index, prepared by the Bureau of Labor Statistics, U.S. Department of Labor.

27
Educational Outcomes
28
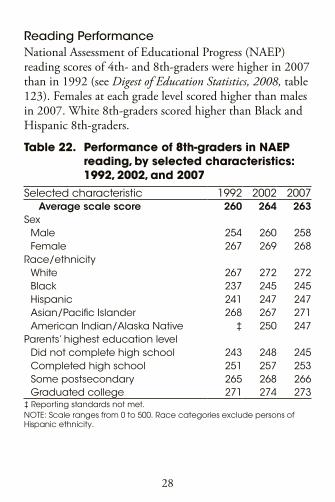
Reading Performance National Assessment of Educational Progress (NAEP) reading scores of 4th- and 8th-graders were higher in 2007 than in 1992 (see Digest of Education Statistics, 2008, table 123). Females at each grade level scored higher than males in 2007. White 8th-graders scored higher than Black and Hispanic 8th-graders.
Table 22. Performance of 8th-graders in NAEP reading, by selected characteristics: 1992, 2002, and 2007
Selected characteristic 1992 2002 2007Average scale score 260 264 263
SexMale 254 260 258Female 267 269 268
Race/ethnicityWhite 267 272 272Black 237 245 245Hispanic 241 247 247Asian/Pacific Islander 268 267 271American Indian/Alaska Native ‡ 250 247
Parents’ highest education levelDid not complete high school 243 248 245Completed high school 251 257 253Some postsecondary 265 268 266Graduated college 271 274 273
‡ Reporting standards not met. NOTE: Scale ranges from 0 to 500. Race categories exclude persons of Hispanic ethnicity.
29
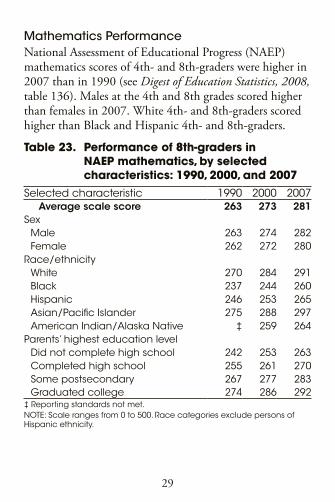
Mathematics Performance National Assessment of Educational Progress (NAEP) mathematics scores of 4th- and 8th-graders were higher in 2007 than in 1990 (see Digest of Education Statistics, 2008, table 136). Males at the 4th and 8th grades scored higher than females in 2007. White 4th- and 8th-graders scored higher than Black and Hispanic 4th- and 8th-graders.
Table 23. Performance of 8th-graders in NAEP mathematics, by selected characteristics: 1990, 2000, and 2007
Selected characteristic 1990 2000 2007Average scale score 263 273 281
SexMale 263 274 282Female 262 272 280
Race/ethnicityWhite 270 284 291Black 237 244 260Hispanic 246 253 265Asian/Pacific Islander 275 288 297American Indian/Alaska Native ‡ 259 264
Parents’ highest education levelDid not complete high school 242 253 263Completed high school 255 261 270Some postsecondary 267 277 283Graduated college 274 286 292
‡ Reporting standards not met. NOTE: Scale ranges from 0 to 500. Race categories exclude persons of Hispanic ethnicity.
30
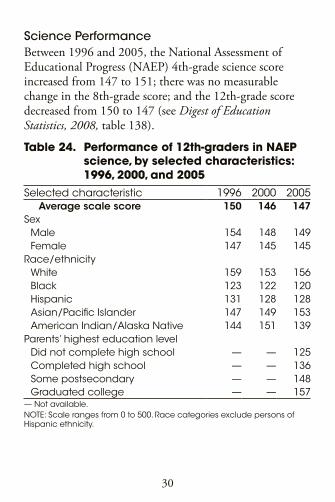
Science Performance Between 1996 and 2005, the National Assessment of Educational Progress (NAEP) 4th-grade science score increased from 147 to 151; there was no measurable change in the 8th-grade score; and the 12th-grade score decreased from 150 to 147 (see Digest of Education Statistics, 2008, table 138).
Table 24. Performance of 12th-graders in NAEP science, by selected characteristics: 1996, 2000, and 2005
Selected characteristic 1996 2000 2005Average scale score 150 146 147
SexMale 154 148 149Female 147 145 145
Race/ethnicityWhite 159 153 156Black 123 122 120Hispanic 131 128 128Asian/Pacific Islander 147 149 153American Indian/Alaska Native 144 151 139
Parents’ highest education level Did not complete high school — — 125Completed high school — — 136Some postsecondary — — 148Graduated college — — 157
— Not available.NOTE: Scale ranges from 0 to 500. Race categories exclude persons of Hispanic ethnicity.
31
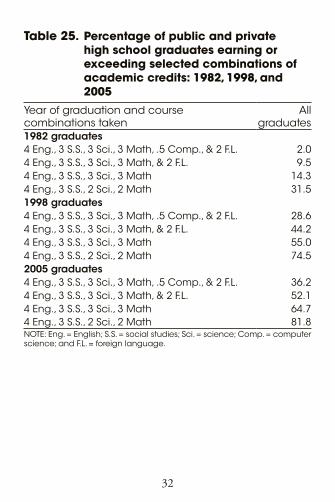
High School Coursetaking PatternsIn 1983, the National Commission on Excellence in Education recommended that all students take 4 years of English; 3 years each of mathematics, science, and social studies; and half a year of computer science. For those going on to college, 2 years of foreign language study was additionally recommended.
The average number of science and mathematics credits earned by high school graduates increased between 1982 and 2005. The mean number of mathematics credits (Carnegie units) earned in high school rose from 2.6 in 1982 to 3.7 in 2005, and the number of science credits rose from 2.2 to 3.3 (see Digest of Education Statistics, 2008, table 147). The average number of English credits increased from 3.9 in 1982 to 4.4 in 2005, and the number of social science credits increased from 3.2 to 4.0 during the same period. The Carnegie unit is a standard of measurement that represents one credit for the completion of a 1-year course.
The percentage of graduates who met or exceeded the college preparatory program recommended by the National Commission on Excellence in Education (excluding computer science) rose from 10 percent in 1982 to 52 percent in 2005.
32
Table 25. Percentage of public and private high school graduates earning or exceeding selected combinations of academic credits: 1982, 1998, and 2005
Year of graduation and course combinations taken
All graduates
1982 graduates4 Eng., 3 S.S., 3 Sci., 3 Math, .5 Comp., & 2 F.L. 2.04 Eng., 3 S.S., 3 Sci., 3 Math, & 2 F.L. 9.54 Eng., 3 S.S., 3 Sci., 3 Math 14.34 Eng., 3 S.S., 2 Sci., 2 Math 31.51998 graduates4 Eng., 3 S.S., 3 Sci., 3 Math, .5 Comp., & 2 F.L. 28.64 Eng., 3 S.S., 3 Sci., 3 Math, & 2 F.L. 44.24 Eng., 3 S.S., 3 Sci., 3 Math 55.04 Eng., 3 S.S., 2 Sci., 2 Math 74.52005 graduates4 Eng., 3 S.S., 3 Sci., 3 Math, .5 Comp., & 2 F.L. 36.24 Eng., 3 S.S., 3 Sci., 3 Math, & 2 F.L. 52.14 Eng., 3 S.S., 3 Sci., 3 Math 64.74 Eng., 3 S.S., 2 Sci., 2 Math 81.8NOTE: Eng. = English; S.S. = social studies; Sci. = science; Comp. = computer science; and F.L. = foreign language.
33
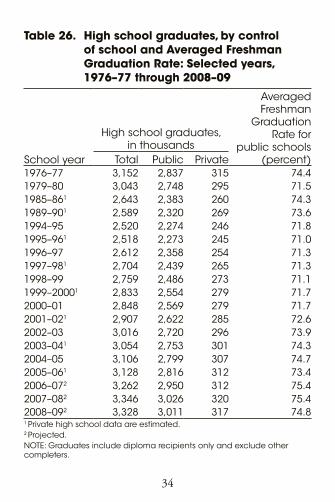
GraduatesAbout 3.3 million high school students are expected to graduate during the 2008–09 school year, including 3.0 million public school graduates and 0.3 million private school graduates. The 2008–09 projection of high school graduates is lower than the record-high projection for 2007–08, but exceeds the high point during the baby boom era in 1976–77, when 3.2 million students earned diplomas.
The Averaged Freshman Graduation Rate is an estimate of the percentage of the incoming freshman class who graduate 4 years later. In 2005–06, the Averaged Freshman Graduation Rate was 73 percent for public schools. The 2005–06 Averaged Freshman Graduation Rate was higher than in 1995–96 (71 percent), but lower than the rate in 1985–86 (74 percent).
34
Table 26. High school graduates, by control of school and Averaged Freshman Graduation Rate: Selected years, 1976–77 through 2008–09
School year
High school graduates, in thousands
Averaged Freshman
Graduation Rate for
public schools (percent)Total Public Private
1976–77 3,152 2,837 315 74.41979–80 3,043 2,748 295 71.51985–861 2,643 2,383 260 74.31989–901 2,589 2,320 269 73.61994–95 2,520 2,274 246 71.81995–961 2,518 2,273 245 71.01996–97 2,612 2,358 254 71.31997–981 2,704 2,439 265 71.31998–99 2,759 2,486 273 71.11999–20001 2,833 2,554 279 71.72000–01 2,848 2,569 279 71.72001–021 2,907 2,622 285 72.62002–03 3,016 2,720 296 73.92003–041 3,054 2,753 301 74.32004–05 3,106 2,799 307 74.72005–061 3,128 2,816 312 73.42006–072 3,262 2,950 312 75.42007–082 3,346 3,026 320 75.42008–092 3,328 3,011 317 74.81 Private high school data are estimated.2 Projected.NOTE: Graduates include diploma recipients only and exclude other completers.
35
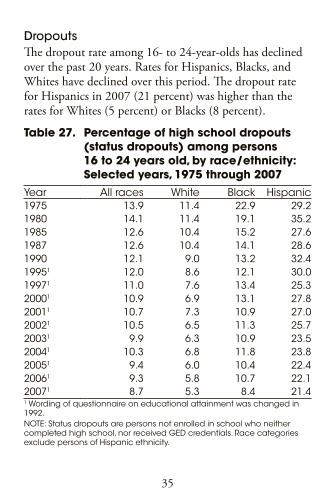
Dropouts The dropout rate among 16- to 24-year-olds has declined over the past 20 years. Rates for Hispanics, Blacks, and Whites have declined over this period. The dropout rate for Hispanics in 2007 (21 percent) was higher than the rates for Whites (5 percent) or Blacks (8 percent).
Table 27. Percentage of high school dropouts (status dropouts) among persons 16 to 24 years old, by race/ethnicity: Selected years, 1975 through 2007
Year All races White Black Hispanic1975 13.9 11.4 22.9 29.21980 14.1 11.4 19.1 35.21985 12.6 10.4 15.2 27.61987 12.6 10.4 14.1 28.61990 12.1 9.0 13.2 32.419951 12.0 8.6 12.1 30.019971 11.0 7.6 13.4 25.320001 10.9 6.9 13.1 27.820011 10.7 7.3 10.9 27.020021 10.5 6.5 11.3 25.720031 9.9 6.3 10.9 23.520041 10.3 6.8 11.8 23.820051 9.4 6.0 10.4 22.420061 9.3 5.8 10.7 22.120071 8.7 5.3 8.4 21.41 Wording of questionnaire on educational attainment was changed in 1992.NOTE: Status dropouts are persons not enrolled in school who neither completed high school, nor received GED credentials. Race categories exclude persons of Hispanic ethnicity.
36
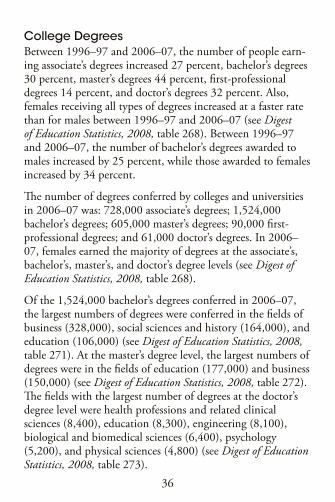
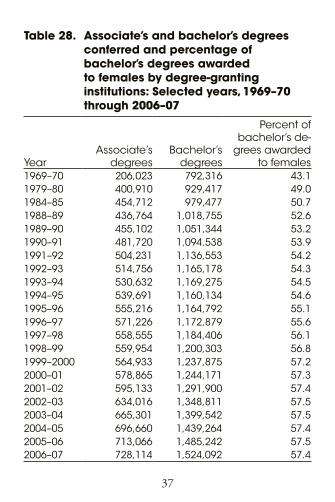
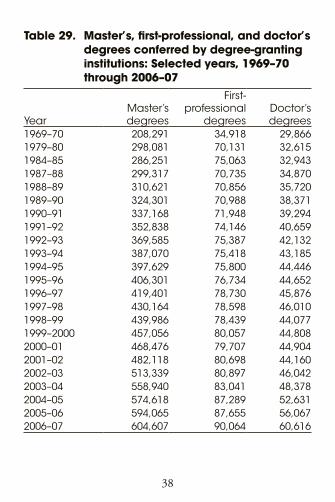
College DegreesBetween 1996–97 and 2006–07, the number of people earn-ing associate’s degrees increased 27 percent, bachelor’s degrees 30 percent, master’s degrees 44 percent, first-professional degrees 14 percent, and doctor’s degrees 32 percent. Also, females receiving all types of degrees increased at a faster rate than for males between 1996–97 and 2006–07 (see Digest of Education Statistics, 2008, table 268). Between 1996–97 and 2006–07, the number of bachelor’s degrees awarded to males increased by 25 percent, while those awarded to females increased by 34 percent.
The number of degrees conferred by colleges and universities in 2006–07 was: 728,000 associate’s degrees; 1,524,000 bachelor’s degrees; 605,000 master’s degrees; 90,000 first-professional degrees; and 61,000 doctor’s degrees. In 2006–07, females earned the majority of degrees at the associate’s, bachelor’s, master’s, and doctor’s degree levels (see Digest of Education Statistics, 2008, table 268).
Of the 1,524,000 bachelor’s degrees conferred in 2006–07, the largest numbers of degrees were conferred in the fields of business (328,000), social sciences and history (164,000), and education (106,000) (see Digest of Education Statistics, 2008, table 271). At the master’s degree level, the largest numbers of degrees were in the fields of education (177,000) and business (150,000) (see Digest of Education Statistics, 2008, table 272). The fields with the largest number of degrees at the doctor’s degree level were health professions and related clinical sciences (8,400), education (8,300), engineering (8,100), biological and biomedical sciences (6,400), psychology (5,200), and physical sciences (4,800) (see Digest of Education Statistics, 2008, table 273).
37
Table 28. Associate’s and bachelor’s degrees conferred and percentage of bachelor’s degrees awarded to females by degree-granting institutions: Selected years, 1969–70 through 2006–07
YearAssociate’s
degreesBachelor’s
degrees
Percent of bachelor’s de-
grees awarded to females
1969–70 206,023 792,316 43.11979–80 400,910 929,417 49.01984–85 454,712 979,477 50.71988–89 436,764 1,018,755 52.61989–90 455,102 1,051,344 53.21990–91 481,720 1,094,538 53.91991–92 504,231 1,136,553 54.21992–93 514,756 1,165,178 54.31993–94 530,632 1,169,275 54.51994–95 539,691 1,160,134 54.61995–96 555,216 1,164,792 55.11996–97 571,226 1,172,879 55.61997–98 558,555 1,184,406 56.11998–99 559,954 1,200,303 56.81999–2000 564,933 1,237,875 57.22000–01 578,865 1,244,171 57.32001–02 595,133 1,291,900 57.42002–03 634,016 1,348,811 57.52003–04 665,301 1,399,542 57.52004–05 696,660 1,439,264 57.42005–06 713,066 1,485,242 57.52006–07 728,114 1,524,092 57.4
38
Table 29. Master’s, first-professional, and doctor’s degrees conferred by degree-granting institutions: Selected years, 1969–70 through 2006–07
YearMaster’s degrees
First- professional
degrees Doctor’s degrees
1969–70 208,291 34,918 29,8661979–80 298,081 70,131 32,6151984–85 286,251 75,063 32,9431987–88 299,317 70,735 34,8701988–89 310,621 70,856 35,7201989–90 324,301 70,988 38,3711990–91 337,168 71,948 39,2941991–92 352,838 74,146 40,6591992–93 369,585 75,387 42,1321993–94 387,070 75,418 43,1851994–95 397,629 75,800 44,4461995–96 406,301 76,734 44,6521996–97 419,401 78,730 45,8761997–98 430,164 78,598 46,0101998–99 439,986 78,439 44,0771999–2000 457,056 80,057 44,8082000–01 468,476 79,707 44,9042001–02 482,118 80,698 44,1602002–03 513,339 80,897 46,0422003–04 558,940 83,041 48,3782004–05 574,618 87,289 52,6312005–06 594,065 87,655 56,0672006–07 604,607 90,064 60,616
39
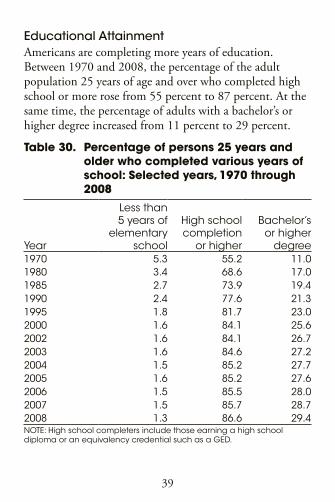
Educational AttainmentAmericans are completing more years of education. Between 1970 and 2008, the percentage of the adult population 25 years of age and over who completed high school or more rose from 55 percent to 87 percent. At the same time, the percentage of adults with a bachelor’s or higher degree increased from 11 percent to 29 percent.
Table 30. Percentage of persons 25 years and older who completed various years of school: Selected years, 1970 through 2008
Year
Less than 5 years of
elementary school
High school completion
or higher
Bachelor’s or higher
degree1970 5.3 55.2 11.01980 3.4 68.6 17.01985 2.7 73.9 19.41990 2.4 77.6 21.31995 1.8 81.7 23.02000 1.6 84.1 25.62002 1.6 84.1 26.72003 1.6 84.6 27.22004 1.5 85.2 27.72005 1.6 85.2 27.62006 1.5 85.5 28.02007 1.5 85.7 28.72008 1.3 86.6 29.4NOTE: High school completers include those earning a high school diploma or an equivalency credential such as a GED.


41
Finance
42
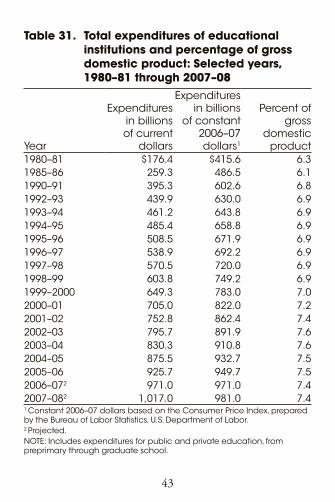
Total Expenditures Expenditures for public and private education, from preprimary through graduate school, are projected at $1,017 billion for 2007–08. The expenditures of elementary and secondary schools are expected to total $631 billion for 2007–08, while colleges and universities will spend about $386 billion (see Digest of Education Statistics, 2008, table 26). After adjustment for inflation, total expenditures for all educational institutions rose by an estimated 36 percent between 1997–98 and 2007–08. Expenditures for elementary and secondary schools rose by an estimated 33 percent during this period, while total expenditures for colleges and universities rose by 41 percent.
The total expenditures for education are estimated to amount to about 7.4 percent of the gross domestic product in 2007–08.
43
Table 31. Total expenditures of educational institutions and percentage of gross domestic product: Selected years, 1980–81 through 2007–08
Year
Expenditures in billions of current
dollars
Expenditures in billions
of constant 2006–07 dollars1
Percent of gross
domestic product
1980–81 $176.4 $415.6 6.31985–86 259.3 486.5 6.11990–91 395.3 602.6 6.81992–93 439.9 630.0 6.91993–94 461.2 643.8 6.91994–95 485.4 658.8 6.91995–96 508.5 671.9 6.91996–97 538.9 692.2 6.91997–98 570.5 720.0 6.91998–99 603.8 749.2 6.91999–2000 649.3 783.0 7.02000–01 705.0 822.0 7.22001–02 752.8 862.4 7.42002–03 795.7 891.9 7.62003–04 830.3 910.8 7.62004–05 875.5 932.7 7.52005–06 925.7 949.7 7.52006–072 971.0 971.0 7.42007–082 1,017.0 981.0 7.41 Constant 2006–07 dollars based on the Consumer Price Index, prepared by the Bureau of Labor Statistics, U.S. Department of Labor.2 Projected.NOTE: Includes expenditures for public and private education, from preprimary through graduate school.
44
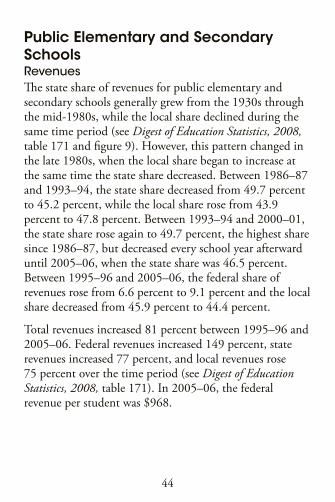
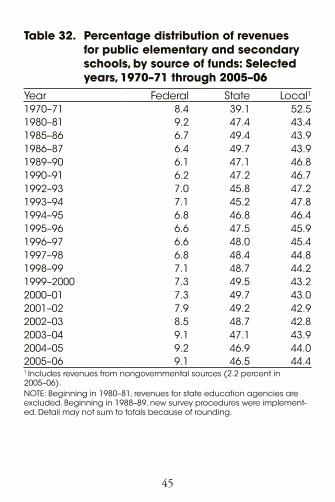
Public Elementary and Secondary SchoolsRevenues The state share of revenues for public elementary and secondary schools generally grew from the 1930s through the mid-1980s, while the local share declined during the same time period (see Digest of Education Statistics, 2008, table 171 and figure 9). However, this pattern changed in the late 1980s, when the local share began to increase at the same time the state share decreased. Between 1986–87 and 1993–94, the state share decreased from 49.7 percent to 45.2 percent, while the local share rose from 43.9 percent to 47.8 percent. Between 1993–94 and 2000–01, the state share rose again to 49.7 percent, the highest share since 1986–87, but decreased every school year afterward until 2005–06, when the state share was 46.5 percent. Between 1995–96 and 2005–06, the federal share of revenues rose from 6.6 percent to 9.1 percent and the local share decreased from 45.9 percent to 44.4 percent.
Total revenues increased 81 percent between 1995–96 and 2005–06. Federal revenues increased 149 percent, state revenues increased 77 percent, and local revenues rose 75 percent over the time period (see Digest of Education Statistics, 2008, table 171). In 2005–06, the federal revenue per student was $968.
45
Table 32. Percentage distribution of revenues for public elementary and secondary schools, by source of funds: Selected years, 1970–71 through 2005–06
Year Federal State Local1
1970–71 8.4 39.1 52.51980–81 9.2 47.4 43.41985–86 6.7 49.4 43.91986–87 6.4 49.7 43.91989–90 6.1 47.1 46.81990–91 6.2 47.2 46.71992–93 7.0 45.8 47.21993–94 7.1 45.2 47.81994–95 6.8 46.8 46.41995–96 6.6 47.5 45.91996–97 6.6 48.0 45.41997–98 6.8 48.4 44.81998–99 7.1 48.7 44.21999–2000 7.3 49.5 43.22000–01 7.3 49.7 43.02001–02 7.9 49.2 42.92002–03 8.5 48.7 42.82003–04 9.1 47.1 43.92004–05 9.2 46.9 44.02005–06 9.1 46.5 44.41 Includes revenues from nongovernmental sources (2.2 percent in 2005–06). NOTE: Beginning in 1980–81, revenues for state education agencies are excluded. Beginning in 1988–89, new survey procedures were implement-ed. Detail may not sum to totals because of rounding.
46
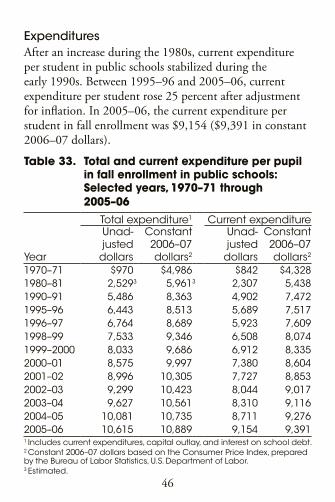
Expenditures After an increase during the 1980s, current expenditure per student in public schools stabilized during the early 1990s. Between 1995–96 and 2005–06, current expenditure per student rose 25 percent after adjustment for inflation. In 2005–06, the current expenditure per student in fall enrollment was $9,154 ($9,391 in constant 2006–07 dollars).
Table 33. Total and current expenditure per pupil in fall enrollment in public schools: Selected years, 1970–71 through 2005–06
Year
Total expenditure1 Current expenditureUnad-justed dollars
Constant 2006–07 dollars2
Unad- justed dollars
Constant 2006–07 dollars2
1970–71 $970 $4,986 $842 $4,3281980–81 2,5293 5,9613 2,307 5,4381990–91 5,486 8,363 4,902 7,4721995–96 6,443 8,513 5,689 7,5171996–97 6,764 8,689 5,923 7,6091998–99 7,533 9,346 6,508 8,0741999–2000 8,033 9,686 6,912 8,3352000–01 8,575 9,997 7,380 8,6042001–02 8,996 10,305 7,727 8,8532002–03 9,299 10,423 8,044 9,0172003–04 9,627 10,561 8,310 9,1162004–05 10,081 10,735 8,711 9,2762005–06 10,615 10,889 9,154 9,3911 Includes current expenditures, capital outlay, and interest on school debt. 2 Constant 2006–07 dollars based on the Consumer Price Index, prepared by the Bureau of Labor Statistics, U.S. Department of Labor.3 Estimated.
47
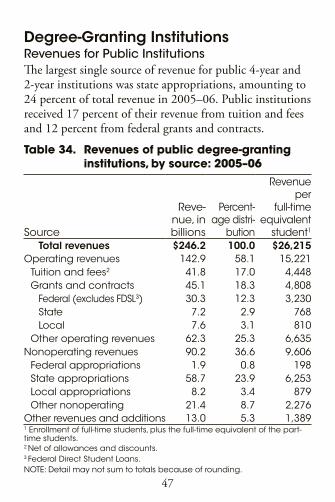
Degree-Granting InstitutionsRevenues for Public Institutions The largest single source of revenue for public 4-year and 2-year institutions was state appropriations, amounting to 24 percent of total revenue in 2005–06. Public institutions received 17 percent of their revenue from tuition and fees and 12 percent from federal grants and contracts.
Table 34. Revenues of public degree-granting institutions, by source: 2005–06
Source
Reve-nue, in billions
Percent-age distri-
bution
Revenue per
full-time equivalent
student1
Total revenues $246.2 100.0 $26,215Operating revenues 142.9 58.1 15,221
Tuition and fees2 41.8 17.0 4,448Grants and contracts 45.1 18.3 4,808
Federal (excludes FDSL3) 30.3 12.3 3,230State 7.2 2.9 768Local 7.6 3.1 810
Other operating revenues 62.3 25.3 6,635Nonoperating revenues 90.2 36.6 9,606
Federal appropriations 1.9 0.8 198State appropriations 58.7 23.9 6,253Local appropriations 8.2 3.4 879Other nonoperating 21.4 8.7 2,276
Other revenues and additions 13.0 5.3 1,3891 Enrollment of full-time students, plus the full-time equivalent of the part-time students. 2 Net of allowances and discounts.3 Federal Direct Student Loans.NOTE: Detail may not sum to totals because of rounding.
48
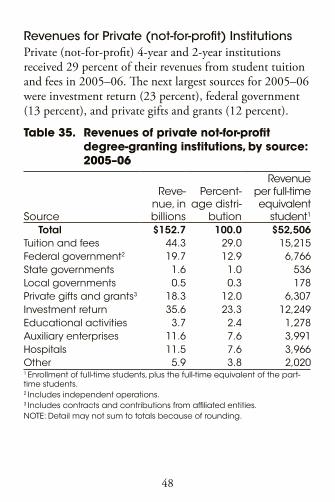
Revenues for Private (not-for-profit) Institutions Private (not-for-profit) 4-year and 2-year institutions received 29 percent of their revenues from student tuition and fees in 2005–06. The next largest sources for 2005–06 were investment return (23 percent), federal government (13 percent), and private gifts and grants (12 percent).
Table 35. Revenues of private not-for-profit degree-granting institutions, by source: 2005–06
Source
Reve-nue, in billions
Percent-age distri-
bution
Revenue per full-time equivalent
student1
Total $152.7 100.0 $52,506Tuition and fees 44.3 29.0 15,215Federal government2 19.7 12.9 6,766State governments 1.6 1.0 536Local governments 0.5 0.3 178Private gifts and grants3 18.3 12.0 6,307Investment return 35.6 23.3 12,249Educational activities 3.7 2.4 1,278Auxiliary enterprises 11.6 7.6 3,991Hospitals 11.5 7.6 3,966Other 5.9 3.8 2,0201 Enrollment of full-time students, plus the full-time equivalent of the part-time students.2 Includes independent operations.3 Includes contracts and contributions from affiliated entities.NOTE: Detail may not sum to totals because of rounding.
49
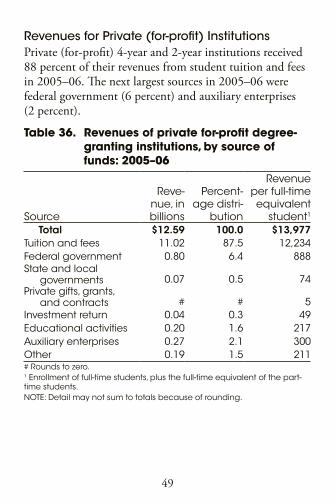
Revenues for Private (for-profit) InstitutionsPrivate (for-profit) 4-year and 2-year institutions received 88 percent of their revenues from student tuition and fees in 2005–06. The next largest sources in 2005–06 were federal government (6 percent) and auxiliary enterprises (2 percent).
Table 36. Revenues of private for-profit degree-granting institutions, by source of funds: 2005–06
Source
Reve-nue, in billions
Percent-age distri-
bution
Revenue per full-time equivalent
student1
Total $12.59 100.0 $13,977Tuition and fees 11.02 87.5 12,234Federal government 0.80 6.4 888State and local
governments 0.07 0.5 74Private gifts, grants,
and contracts # # 5Investment return 0.04 0.3 49Educational activities 0.20 1.6 217Auxiliary enterprises 0.27 2.1 300Other 0.19 1.5 211# Rounds to zero.1 Enrollment of full-time students, plus the full-time equivalent of the part-time students.NOTE: Detail may not sum to totals because of rounding.
50
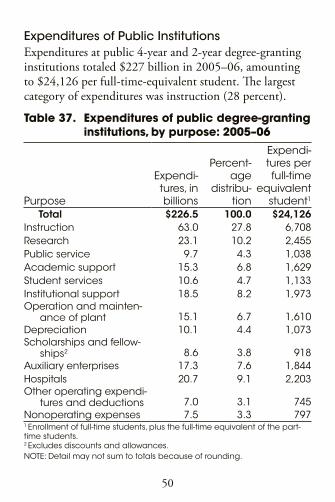
Expenditures of Public InstitutionsExpenditures at public 4-year and 2-year degree-granting institutions totaled $227 billion in 2005–06, amounting to $24,126 per full-time-equivalent student. The largest category of expenditures was instruction (28 percent).
Table 37. Expenditures of public degree-granting institutions, by purpose: 2005–06
Purpose
Expendi-tures, in billions
Percent-age
distribu-tion
Expendi-tures per full-time
equivalent student1
Total $226.5 100.0 $24,126Instruction 63.0 27.8 6,708Research 23.1 10.2 2,455Public service 9.7 4.3 1,038Academic support 15.3 6.8 1,629Student services 10.6 4.7 1,133Institutional support 18.5 8.2 1,973Operation and mainten-
ance of plant 15.1 6.7 1,610Depreciation 10.1 4.4 1,073Scholarships and fellow-
ships2 8.6 3.8 918Auxiliary enterprises 17.3 7.6 1,844Hospitals 20.7 9.1 2,203Other operating expendi-
tures and deductions 7.0 3.1 745Nonoperating expenses 7.5 3.3 7971 Enrollment of full-time students, plus the full-time equivalent of the part-time students. 2 Excludes discounts and allowances.NOTE: Detail may not sum to totals because of rounding.
51
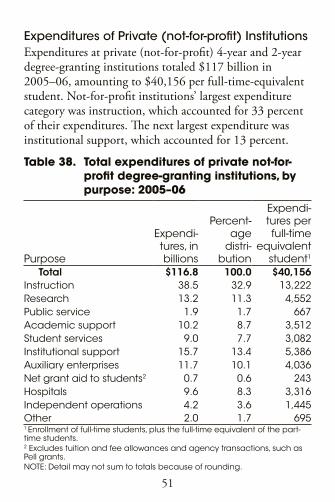
Expenditures of Private (not-for-profit) Institutions Expenditures at private (not-for-profit) 4-year and 2-year degree-granting institutions totaled $117 billion in 2005–06, amounting to $40,156 per full-time-equivalent student. Not-for-profit institutions’ largest expenditure category was instruction, which accounted for 33 percent of their expenditures. The next largest expenditure was institutional support, which accounted for 13 percent.
Table 38. Total expenditures of private not-for-profit degree-granting institutions, by purpose: 2005–06
Purpose
Expendi-tures, in billions
Percent-age
distri- bution
Expendi-tures per full-time
equivalent student1
Total $116.8 100.0 $40,156Instruction 38.5 32.9 13,222Research 13.2 11.3 4,552Public service 1.9 1.7 667Academic support 10.2 8.7 3,512Student services 9.0 7.7 3,082Institutional support 15.7 13.4 5,386Auxiliary enterprises 11.7 10.1 4,036Net grant aid to students2 0.7 0.6 243Hospitals 9.6 8.3 3,316Independent operations 4.2 3.6 1,445Other 2.0 1.7 6951 Enrollment of full-time students, plus the full-time equivalent of the part-time students.2 Excludes tuition and fee allowances and agency transactions, such as Pell grants.NOTE: Detail may not sum to totals because of rounding.
52
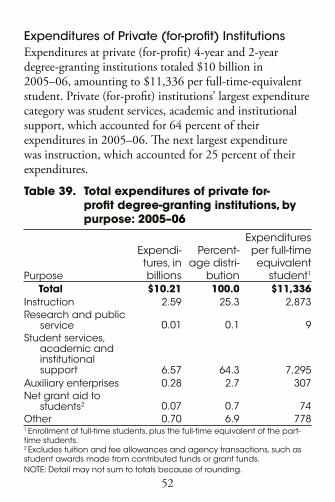
Expenditures of Private (for-profit) InstitutionsExpenditures at private (for-profit) 4-year and 2-year degree-granting institutions totaled $10 billion in 2005–06, amounting to $11,336 per full-time-equivalent student. Private (for-profit) institutions’ largest expenditure category was student services, academic and institutional support, which accounted for 64 percent of their expenditures in 2005–06. The next largest expenditure was instruction, which accounted for 25 percent of their expenditures.
Table 39. Total expenditures of private for-profit degree-granting institutions, by purpose: 2005–06
Purpose
Expendi- tures, in billions
Percent- age distri-
bution
Expenditures per full-time equivalent
student1
Total $10.21 100.0 $11,336Instruction 2.59 25.3 2,873Research and public
service 0.01 0.1 9Student services,
academic and institutional support 6.57 64.3 7,295
Auxiliary enterprises 0.28 2.7 307Net grant aid to
students2 0.07 0.7 74Other 0.70 6.9 7781 Enrollment of full-time students, plus the full-time equivalent of the part-time students. 2 Excludes tuition and fee allowances and agency transactions, such as student awards made from contributed funds or grant funds.NOTE: Detail may not sum to totals because of rounding.
53
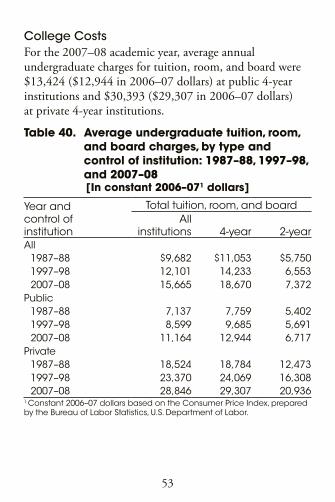
College Costs For the 2007–08 academic year, average annual undergraduate charges for tuition, room, and board were $13,424 ($12,944 in 2006–07 dollars) at public 4-year institutions and $30,393 ($29,307 in 2006–07 dollars) at private 4-year institutions.
Table 40. Average undergraduate tuition, room, and board charges, by type and control of institution: 1987–88, 1997–98, and 2007–08[In constant 2006–071 dollars]
Year and control of institution
Total tuition, room, and boardAll
institutions 4-year 2-yearAll
1987–88 $9,682 $11,053 $5,7501997–98 12,101 14,233 6,5532007–08 15,665 18,670 7,372
Public1987–88 7,137 7,759 5,4021997–98 8,599 9,685 5,6912007–08 11,164 12,944 6,717
Private1987–88 18,524 18,784 12,4731997–98 23,370 24,069 16,3082007–08 28,846 29,307 20,936
1 Constant 2006–07 dollars based on the Consumer Price Index, prepared by the Bureau of Labor Statistics, U.S. Department of Labor.
54
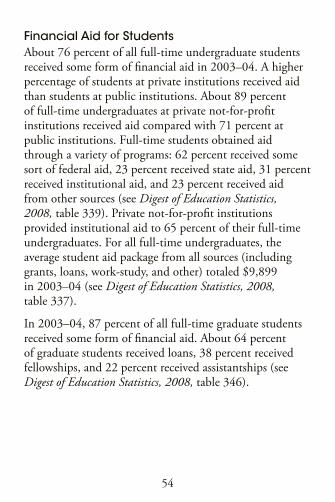
Financial Aid for Students About 76 percent of all full-time undergraduate students received some form of financial aid in 2003–04. A higher percentage of students at private institutions received aid than students at public institutions. About 89 percent of full-time undergraduates at private not-for-profit institutions received aid compared with 71 percent at public institutions. Full-time students obtained aid through a variety of programs: 62 percent received some sort of federal aid, 23 percent received state aid, 31 percent received institutional aid, and 23 percent received aid from other sources (see Digest of Education Statistics, 2008, table 339). Private not-for-profit institutions provided institutional aid to 65 percent of their full-time undergraduates. For all full-time undergraduates, the average student aid package from all sources (including grants, loans, work-study, and other) totaled $9,899 in 2003–04 (see Digest of Education Statistics, 2008, table 337).
In 2003–04, 87 percent of all full-time graduate students received some form of financial aid. About 64 percent of graduate students received loans, 38 percent received fellowships, and 22 percent received assistantships (see Digest of Education Statistics, 2008, table 346).
55
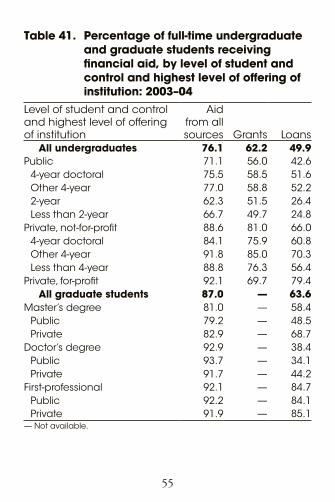
Table 41. Percentage of full-time undergraduate and graduate students receiving financial aid, by level of student and control and highest level of offering of institution: 2003–04
Level of student and control and highest level of offering of institution
Aid from all sources Grants Loans
All undergraduates 76.1 62.2 49.9Public 71.1 56.0 42.6
4-year doctoral 75.5 58.5 51.6Other 4-year 77.0 58.8 52.22-year 62.3 51.5 26.4Less than 2-year 66.7 49.7 24.8
Private, not-for-profit 88.6 81.0 66.04-year doctoral 84.1 75.9 60.8Other 4-year 91.8 85.0 70.3Less than 4-year 88.8 76.3 56.4
Private, for-profit 92.1 69.7 79.4All graduate students 87.0 — 63.6
Master’s degree 81.0 — 58.4Public 79.2 — 48.5Private 82.9 — 68.7
Doctor’s degree 92.9 — 38.4Public 93.7 — 34.1Private 91.7 — 44.2
First-professional 92.1 — 84.7Public 92.2 — 84.1Private 91.9 — 85.1
— Not available.
56
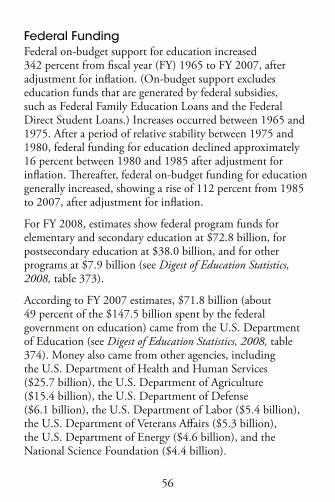
Federal Funding Federal on-budget support for education increased 342 percent from fiscal year (FY) 1965 to FY 2007, after adjustment for inflation. (On-budget support excludes education funds that are generated by federal subsidies, such as Federal Family Education Loans and the Federal Direct Student Loans.) Increases occurred between 1965 and 1975. After a period of relative stability between 1975 and 1980, federal funding for education declined approximately 16 percent between 1980 and 1985 after adjustment for inflation. Thereafter, federal on-budget funding for education generally increased, showing a rise of 112 percent from 1985 to 2007, after adjustment for inflation.
For FY 2008, estimates show federal program funds for elementary and secondary education at $72.8 billion, for postsecondary education at $38.0 billion, and for other programs at $7.9 billion (see Digest of Education Statistics, 2008, table 373).
According to FY 2007 estimates, $71.8 billion (about 49 percent of the $147.5 billion spent by the federal government on education) came from the U.S. Department of Education (see Digest of Education Statistics, 2008, table 374). Money also came from other agencies, including the U.S. Department of Health and Human Services ($25.7 billion), the U.S. Department of Agriculture ($15.4 billion), the U.S. Department of Defense ($6.1 billion), the U.S. Department of Labor ($5.4 billion), the U.S. Department of Veterans Affairs ($5.3 billion), the U.S. Department of Energy ($4.6 billion), and the National Science Foundation ($4.4 billion).
57
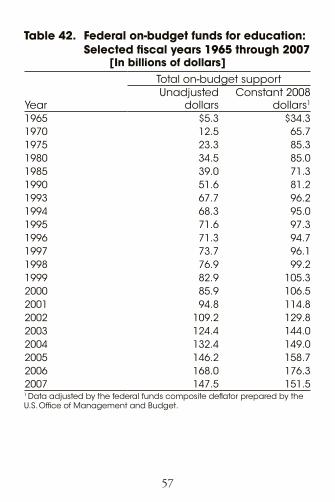
Table 42. Federal on-budget funds for education: Selected fiscal years 1965 through 2007
[In billions of dollars]
Year
Total on-budget supportUnadjusted
dollarsConstant 2008
dollars1
1965 $5.3 $34.31970 12.5 65.71975 23.3 85.31980 34.5 85.01985 39.0 71.31990 51.6 81.21993 67.7 96.21994 68.3 95.01995 71.6 97.31996 71.3 94.71997 73.7 96.11998 76.9 99.21999 82.9 105.32000 85.9 106.52001 94.8 114.82002 109.2 129.82003 124.4 144.02004 132.4 149.02005 146.2 158.72006 168.0 176.32007 147.5 151.51 Data adjusted by the federal funds composite deflator prepared by the U.S. Office of Management and Budget.
58
Source InformationThe following reports and surveys from the National Center for Education Statistics, Institute of Education Sciences, U.S. Department of Education (except where noted otherwise) were used as sources for this document.
Table 1: Digest of Education Statistics, 2008 (table 3), Common Core of Data (CCD), “State Nonfiscal Survey of Public Elementary and Secondary Education,” 1985–86 through 2006–07; Projections of Education Statistics to 2017.
Table 2: Digest of Education Statistics, 2008 (table 3), Private School Universe Survey (PSS), 1989–90 through 2005–06; Projections of Education Statistics to 2017.
Table 3: Digest of Education Statistics, 2008 (table 3), Projections of Education Statistics to 2017.
Table 4: Digest of Education Statistics, 2008 (table 43), U.S. Department of Commerce, Census Bureau, Current Population Survey (CPS), October 1980 through October 2007.
Table 5: Digest of Education Statistics, 2008 (table 7), U.S. Department of Commerce, Census Bureau, Current Population Survey (CPS), October 1970 through October 2007.
Table 6: Digest of Education Statistics, 2002 (table 42), U.S. Department of Education, Office for Civil Rights, 1986 State Summaries of Elementary and Secondary School Civil Rights Survey. Digest of Education Statistics, 2008 (table 41), Common Core of Data (CCD), “State Nonfiscal Survey of Public Elementary/Secondary Education,” 1995–96 and 2006–07.
Table 7: Digest of Education Statistics, 2008 (table 50), Statistics of Public Elementary and Secondary School Systems, 1976–77 and 1980–81; Common Core of Data (CCD), “State Nonfiscal Survey of Public Elementary/Secondary Education,” 1990–91 through 2006–07;
59
and Projections of Education Statistics to 2017. U.S. Department of Education, Office of Special Education and Rehabilitative Services, Annual Report to Congress on the Implementation of The Individuals with Disabilities Education Act, selected years, 1977 through 1996; and Individuals with Disabilities Education Act (IDEA) data base, retrieved on August 1, 2008, from http://www. ideadata.org/partBdata.asp.
Table 8: Digest of Education Statistics, 2008 (tables 193 and 196), 1990, 2000, and 2007 Integrated Postsecondary Education Data System (IPEDS),“Fall Enrollment Survey” (IPEDS-EF:90), and Spring 2001 and Spring 2008.
Table 9: Digest of Education Statistics, 2008 (tables 193 and 196), 1990, 2000, and 2007 Integrated Postsecondary Education Data System (IPEDS), ”Fall Enrollment Survey” (IPEDS-EF:90), and Spring 2001 and Spring 2008.
Table 10: Digest of Education Statistics, 2008 (table 7), U.S. Department of Commerce, Census Bureau, Current Population Survey (CPS), October 1985 through October 2007.
Table 11: Digest of Education Statistics, 2008 (table 190), 1990, 2000, and 2006 Integrated Postsecondary Education Data System (IPEDS), “Fall Enrollment Survey” (IPEDS-EF:90), Spring 2001 and Spring 2007; and Projections of Education Statistics to 2017. U.S. Department of Commerce, Census Bureau, Current Population Survey (CPS), October, 1990, 2000, and 2006.
Table 12: Digest of Education Statistics, 2008 (table 226), Higher Education General Information Survey (HEGIS), “Fall Enrollment in Colleges and Universities” survey, 1980; 1990, 2000, and 2007 Integrated Postsecondary Education Data System (IPEDS), “Fall Enrollment Survey” (IPEDS-EF:90), Spring 2001 and Spring 2008.
Table 13: Digest of Education Statistics, 2008 (table 206), Higher Education General Information Survey (HEGIS), “Fall Enrollment in Colleges and Universities” surveys, 1970 through 1985; 1990 through 2007 Integrated Postsecondary Education Data System (IPEDS), “Fall
60
Enrollment Survey” (IPEDS-EF:90–99), and Spring 2001 through Spring 2008.
Table 14: Digest of Education Statistics, 2008 (table 207), Higher Education General Information Survey (HEGIS), “Fall Enrollment in Colleges and Universities” surveys, 1970 through 1985; 1990 through 2007 Integrated Postsecondary Education Data System (IPEDS), “Fall Enrollment Survey” (IPEDS-EF:90–99), and Spring 2001 through Spring 2008.
Table 15: Digest of Education Statistics, 2008 (table 64), Statistics of Public Elementary and Secondary Day Schools, 1980–81; Common Core of Data (CCD), “State Nonfiscal Survey of Public Elementary/Secondary Education,” 1990–91 through 2006–07; Private School Universe Survey (PSS), 1989–90 through 2005–06; Projections of Education Statistics to 2017; and unpublished data.
Table 16: Digest of Education Statistics, 2008 (table 78), National Education Association, Estimates of School Statistics, 1970–71 through 2006–07; and unpublished tabulations.
Table 17: Digest of Education Statistics, 2008 (table 68), Schools and Staffing Survey (SASS), “Public Teacher Questionnaire,” 2003–04.
Table 18: Digest of Education Statistics, 2008 (table 68), Schools and Staffing Survey (SASS), “Private Teacher Questionnaire,” 2003–04.
Table 19: Digest of Education Statistics, 2008 (table 245), 2007 Integrated Postsecondary Education Data System (IPEDS), Winter 2007–08.
Tables 20 and 21: Digest of Education Statistics, 2008 (table 257), Higher Education General Information Survey (HEGIS), “Faculty Salaries, Tenure, and Fringe Benefits” surveys, 1970–71 through 1985–86; and 1990–91 through 2007–08 Integrated Postsecondary Education Data System (IPEDS),“Salaries, Tenure, and Fringe Benefits of
61
Full-Time Instructional Faculty Survey” (IPEDS-SA:90–99), and Winter 2001–02 through Winter 2007–08.
Table 22: Digest of Education Statistics, 2008 (table 123), National Assessment of Educational Progress (NAEP), 1992, 2002, and 2007 Reading Assessments, retrieved June 16, 2008, from the NAEP Data Explorer (http://nces.ed.gov/nationsreportcard/nde/).
Table 23: Digest of Education Statistics, 2008 (table 136), National Assessment of Educational Progress (NAEP), 1990, 2000, and 2007 Mathematics Assessments, retrieved June 16, 2008, from the NAEP Data Explorer (http://nces.ed.gov/nationsreportcard/nde/).
Table 24: Digest of Education Statistics, 2008 (table 138), National Assessment of Educational Progress (NAEP), 1996, 2000, and 2005 Science Assessments, retrieved November 2006, from the NAEP Data Explorer (http://nces.ed.gov/nationsreportcard/nde/).
Table 25: Digest of Education Statistics, 2008 (table 151), High School and Beyond Longitudinal Study of 1980 Sophomores (HS&B-So:80/82),“High School Transcript Study”; and 1998 and 2005 High School Transcript Study (HSTS).
Table 26: Digest of Education Statistics, 2008 (table 104), Statistics of Public Elementary and Secondary School Systems, 1976–77 and 1979–80; Statistics of Nonpublic Elementary and Secondary Schools, 1976 through 1980; Common Core of Data (CCD), “State Nonfiscal Survey of Public Elementary/Secondary Education,” 1984–85 through 2006–07; Private School Universe Survey (PSS), 1989 through 2005; and Projections of Education Statistics to 2017.
Table 27: Digest of Education Statistics, 2008 (table 109), U.S. Department of Commerce, Census Bureau, Current Population Survey (CPS), October 1975 through October 2007.
Tables 28 and 29: Digest of Education Statistics, 2008 (table 268), Higher Education General Information Survey
62
(HEGIS), “Degrees and other Formal Awards Conferred” surveys, 1969–70 through 1985–86; and 1986–87 through 2006–07 Integrated Postsecondary Education Data System (IPEDS), “Completions Survey” (IPEDS-C:87–99), and Fall 2000 through Fall 2007.
Table 30: Digest of Education Statistics, 2008 (table 8), U.S. Department of Commerce, Census Bureau, Current Population Reports, Series P-20, Current Population Survey (CPS), March 1970 through March 2008.
Table 31: Digest of Education Statistics, 2008 (tables 25 and 26), Revenues and Expenditures for Public Elementary and Secondary Education, 1980–81 and 1985–86; Common Core of Data (CCD), “National Public Education Financial Survey,” 1990–91 through 2005–06; Higher Education General Information Survey (HEGIS), Financial Statistics of Institutions of Higher Education, 1980–81 and 1985–86; 1990–91 through 2005–06 Integrated Postsecondary Education Data System (IPEDS), “Finance Survey” (IPEDS-F:FY91–99), and Spring 2002 through Spring 2006. U.S. Department of Commerce, Bureau of Economic Analysis, unpublished data.
Tables 32 and 33: Digest of Education Statistics, 2008 (tables 171 and 181), Revenues and Expenditures for Public Elementary and Secondary Education, 1970–71 through 1985–86; Common Core of Data (CCD), “National Public Education Financial Survey,” 1986–87 through 2005–06.
Table 34: Digest of Education Statistics, 2008 (table 350), 2005–06 Integrated Postsecondary Education Data System (IPEDS), Spring 2006 and Spring 2007.
Table 35: Digest of Education Statistics, 2008 (table 353), 2005–06 Integrated Postsecondary Education Data System (IPEDS), Spring 2006 and Spring 2007.
Table 36: Digest of Education Statistics, 2008 (table 356), 2005–06 Integrated Postsecondary Education Data System (IPEDS), Spring 2006 and Spring 2007.
63
Table 37: Digest of Education Statistics, 2008 (table 362), 2005–06 Integrated Postsecondary Education Data System (IPEDS), Spring 2006 and Spring 2007.
Table 38: Digest of Education Statistics, 2008 (table 364), 2005–06 Integrated Postsecondary Education Data System (IPEDS), Spring 2006 and Spring 2007.
Table 39: Digest of Education Statistics, 2008 (table 366), 2005–06 Integrated Postsecondary Education Data System (IPEDS), Spring 2006 and Spring 2007.
Table 40: Digest of Education Statistics, 2008 (table 331), Higher Education General Information Survey (HEGIS), “Institutional Characteristics of Colleges and Universities” survey, 1987–88; “Fall Enrollment in Institutions of Higher Education” survey, 1987; and 1997–98 and 2007–08 Integrated Postsecondary Education Data System (IPEDS), “Fall Enrollment Survey” (IPEDS-EF:97), “Institutional Characteristics Survey” (IPEDS-C:96), Spring 2007, and Fall 2007. U.S. Department of Labor, Bureau of Labor Statistics, Consumer Price Index.
Table 41: Digest of Education Statistics, 2008 (tables 340 and 346), 2003–04 National Postsecondary Student Aid Study (NPSAS:04).
Table 42: Digest of Education Statistics, 2008 (table 373), U.S. Department of Education, Budget Service, unpublished tabulations. U.S. Department of Education, National Center for Education Statistics, unpublished tabulations. U.S. Office of Management and Budget, Budget of the U.S. Government, Appendix, fiscal years 1967 through 2009. National Science Foundation, Federal Funds for Research and Development, fiscal years 1967 through 2007.
64
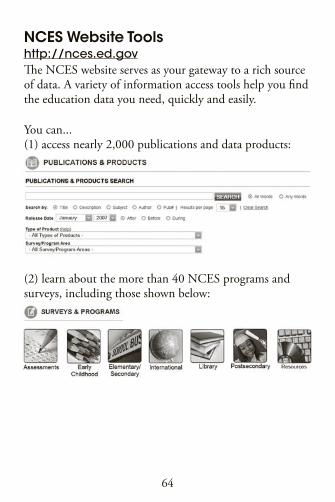
NCES Website Toolshttp://nces.ed.govThe NCES website serves as your gateway to a rich source of data. A variety of information access tools help you find the education data you need, quickly and easily.
You can...(1) access nearly 2,000 publications and data products:
(2) learn about the more than 40 NCES programs and surveys, including those shown below:
65
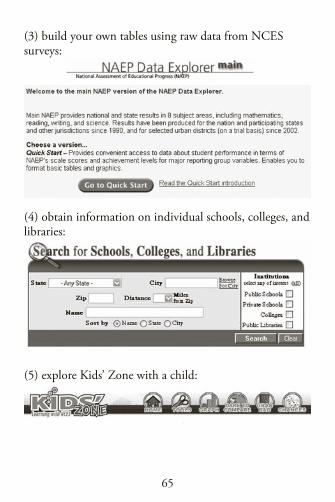
(3) build your own tables using raw data from NCES surveys:
(4) obtain information on individual schools, colleges, and libraries:
(5) explore Kids’ Zone with a child: