Embed Size (px)
Citation preview
MIT Sloan School of Management
MIT Sloan Working Paper 4568-06January 2006
Improving Product Development Processes to Manage Development Risk
Darian W. Unger and Steven D. Eppinger
© by Darian W. Unger and Steven D. EppingerAll rights reserved. Short sections of text, not to exceed two paragraphs, may be quoted without
explicit permission, provided that full credit including © notice is given to the source.
This paper also can be downloaded without charge from the Social Science Research Network Electronic Paper Collection:
http://ssrn.com/abstract=876618
Improving Product Development Processes to Manage Development Risk
Darian W. Unger and Steven D. Eppinger
Abstract
To create new products, firms employ a product development process (PDP) to generate new product concepts, to translate the best of these concepts into quality products, and to manage the risks inherent in bringing such new products to the market. A well-designed PDP is necessary to reduce development time, create better products, increase market share, and generate profit.
This paper investigates the relationship between product development risk and PDP management and seeks to help companies improve their processes. We begin by discussing product development risks and describing a spectrum of different PDPs. We compare the traditional, rigid, staged PDP with the alternative, flexible, spiral PDP and other variants. We then propose several iteration- and review-based metrics by which PDPs can be effectively identified and compared.
Data from ten company case studies exemplify a wide variety of actual PDPs, demonstrate the utility of iteration and review metrics in distinguishing PDPs, and illustrate how different processes manage different risks. Case study findings indicate that software companies face rapidly changing markets, generally perform quick iterations and tests, and are likely to employ flexible PDPs. In contrast, manufacturing companies that face greater integration difficulties and technical risks are likely to employ more rigid PDPs. We find that a company’s risk profile is instrumental in determining the applicability of different PDPs. We employ the case study lessons to propose a method for improved PDP design based on risk management. To demonstrate the method, it is applied to redesign one company’s PDP.
We conclude that PDPs vary more than previously documented; that the proposed metrics are useful in distinguishing PDPs; and that companies facing different risk scenarios can effectively tailor their PDP designs to suit their own unique circumstances.
Index terms: Product development strategy, product development process, research and development management,
innovation management
1. Introduction
Successful product development is critical to industrial performance. Rapid and innovative
product development (PD) can provide critical competitive advantages to firms (Jachimowicz, 2000;
Ulrich and Eppinger, 2004). Despite the importance of PD, companies currently have difficulty
designing or choosing from an extensive array of PD processes. If companies design their processes
poorly, they may endanger the success of their products, their competitiveness, and possibly their
survival. There are currently no established criteria for comparing, selecting, or designing PD
processes; nor is any single process ideal for all circumstances and companies.
This article explains a variety of product development processes (PDPs) and aims to help
companies better design their own PDPs. A review of literature reveals that current categorizations
of PDPs are insufficient for effective management comparison or application. Using a combination
of existing literature and case study research, we propose that two risk management activities –
development iterations and reviews – can be used as metrics to describe and compare different
PDPs. We then use the case studies to examine the variation among PDPs and to demonstrate the
utility of the proposed metrics. Finally, we use the lessons of the case studies to suggest a
framework for improved PDP design based on systematic iterations and reviews.
2. Background and literature review
Prior literature and existing practice in product development management provides useful
background for this study. This review examines PDP characteristics and explains different PDPs.
2.1 Product development process steps and risks
PDPs are not uniform, but they often use similar actions to manage development risks. Prevailing
literature and industry practices present PDPs that involve a common series of actions, steps or
stages. Most companies follow at least some form of the following steps: product planning, project
planning, concept creation, system-level design, detailed design, testing/prototyping, and release.
The purpose of PDPs that include these steps is to provide a structure for managing the many
uncertainties and risks that companies face. Segmenting the process into smaller actions is one way
of controlling risks.
Risk management is a fundamental PD concern because risk, defined as exposure to danger or
loss, is prevalent in all development projects. Balancing risks and potential rewards is an enduring
theme of engineering and program management (Ansel and Wharton, 1992; Foster and Kaplan,
2001; MacCrimmon and Wehrung, 1986). The risks of PD can lead to several forms of development
failure: a slow or late product may miss a market opportunity and incur too many development costs;
a technically challenging product might be impossible to design, may lack the expected features, or
be of poor quality; and a product with misguided specifications may not fulfill customer needs and
therefore completely miss a market niche.
Existing literature suggests several ways of categorizing PD risks. This research uses a
traditional categorization of risk by source of uncertainty underlying the risk. A successful PD
process should be able to manage or mitigate the following four major types of risk:
Technical risk - Uncertainty regarding whether a new product is technologically feasible and
whether it will perform as expected, given clear and valid product specifications.
Market risk - Uncertainty regarding whether a new product accurately addresses changing
customer needs and whether the product is well positioned relative to competition.
Unlike the technical difficulty of building “to a specification,” market risk concerns
whether an achievable specification brings the wrong product to market.
2
Schedule risk - Uncertainty regarding whether a new product can be developed in the time
available.
Financial risk - Uncertainty regarding whether a new product can be developed on budget and
whether the project will pay back the investment. These four general types of risk are neither comprehensive nor entirely independent of each other.
Many other factors may also present uncertainty, but they can be subsumed by the larger risks
detailed above. For example, quality assurance or integration risk may be considered technical risk.
The risks are also occasionally interdependent and overlapping. For example, “scope creep,” a
common problem involving feature addition during development, frequently occurs in an attempt to
address market risk, but tends to increase technical, schedule, and budget risks. It is therefore
impossible to completely separate the types of risks faced in PD, although the categorizations are
useful in planning PDPs.
Prior research explores the roles, categorizations, and management of risk. De Meyer and others
organize risk by type and warn of the need to observe these risks carefully in order to improve
project and development management (DeMeyer, et. al., 2002; Hartmann and Myers, 2001). More
general risk literature stresses the importance of maximizing expected values and introduces
traditional risk management methods such as hedging, decision analysis, and parallel development
(Ansell and Wharton, 1992; De Neufville, 1990).
In a new perspective on risk management for PD, we consider how the PDP itself actually
addresses risk through product development iterations, integrations, and reviews. Iterations often
address market risk while reviews often address technical risk. Planned iterations – often in the form
of early prototypes, simulations, or analytical models –provide feedback for improved design. As
later sections show, the cost, time, and fidelity or quality of integrations vary widely across
industries. For example, some hardware-based prototypes are difficult or expensive to build because
they require tooling, construction, and complex electro-mechanical integrations. In contrast,
computer-based, soft prototypes may be easier to build and integrate, but may not provide as much
quality feedback if the computer models do not capture key real-world aspects of the product. PD
managers must weigh the benefits and costs of system integrations to ensure that they reduce more
risks than they create; early integrations or prototypes are not always practical or possible.
However, information gained from system integrations, tests, and feedback generally improves the
evolving product. Similarly, performance validations and testing are critical to reducing companies’
3
technical risks (Boehm, 1988; Otto and Wood, 2001; Cooper, 2001). Both integrations and
validations manage risk, although the risks they manage are often different.
2.2 The spectrum of PDPs
Product development literature provides many examples of how companies manage development
risks. This section presents and describes two common PDPs that constitute the two ends of a
spectrum of PDPs. At one end of the spectrum is the staged process, the traditional and dominant
PDP in American industry. The spiral process, at the other end, is a more flexible process that
incorporates cross-phase iteration and is commonly used in the software industry.
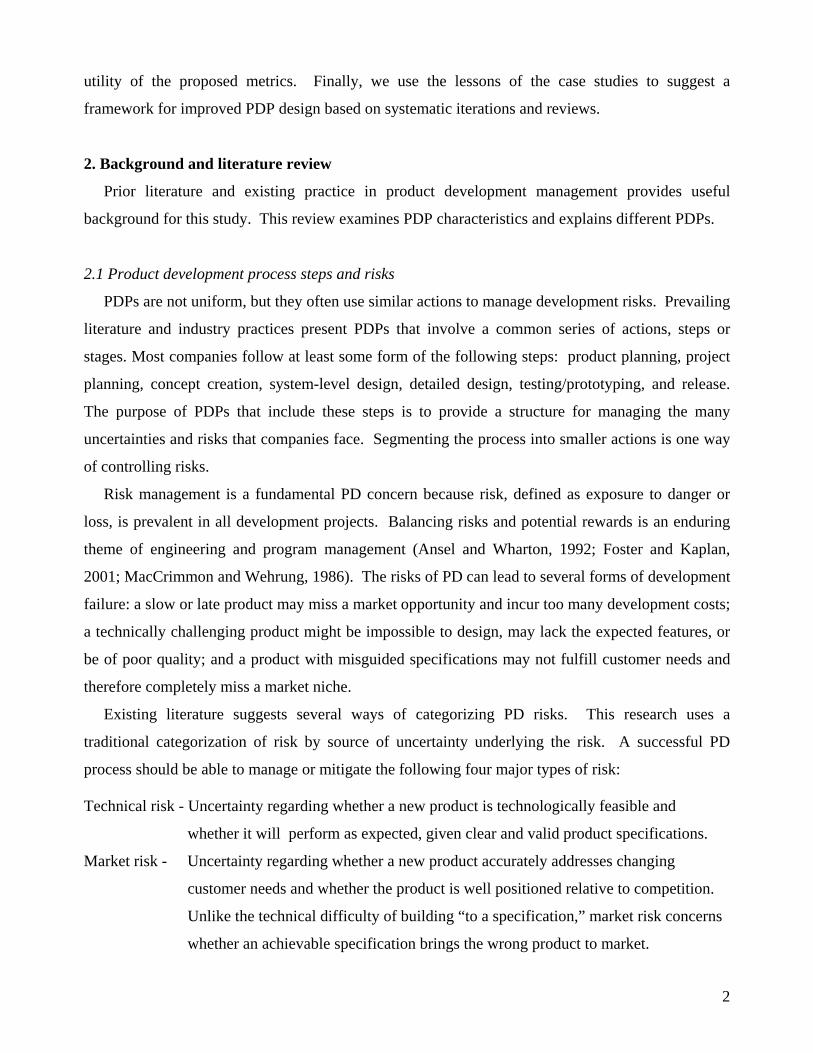
The most widely used type of product development process, and the standard for comparison in
this research, is the traditional staged process shown in Figure 1 (Cooper, 2001; McConnell, 1996;
Smith and Reinertsen, 1992; Ulrich and Eppinger, 2004). This process, also called waterfall, stage
gate, phase gate, toll gate, checkpoint, life cycle, or structured PD by various authors and
practitioners, has been dominant in US industry for almost 30 years.
Release
Planning
ConceptDesign
System-LevelDesign
DetailedDesign
Integration &Test
Reviews
Cross-PhaseIterations
(unplanned)
Figure 1: The traditional, staged product development process
The ideal staged process proceeds in distinct stages, or phases, from product planning to product
release. The intermediate phases include concept design and specification analysis, system-level
design, detailed design, and testing or prototyping. At the end of each phase is a review, or gate, to
evaluate whether the previous phase was successfully completed. If the project is reviewed
positively, work proceeds to the next phase. If not, then the project iterates within that phase until it
can successfully pass the review or the project may be terminated.
4
In Figure 1, the reverse arrows, or cross-phase iterations, indicate that it is possible to revisit
earlier phases, but such iterations are difficult and costly. These major unplanned iterations are
generally avoided whenever possible. Instead, most iterations occur within stages; the resulting
narrowness of iteration has both advantages and disadvantages.
One major advantage of staged processes is the controlled structure that they impose on
development by reaching sharp product definitions and specifications early in PD. Technical risk is
reduced because narrow iterations and reviews freeze specifications early. Rigid specifications help
design teams by giving them clear goals towards which to work. The stable product definition also
helps to avoid errors because midstream corrections are infrequent. Furthermore, the inherent clarity
of the process allows early forecasting and minimal planning overhead.
Staged processes perform well in cases when product cycles have stable product definitions and
when the product uses well understood technologies (as in the case of upgrades or maintenance
improvements to existing product). In these cases, staged processes help to find errors in the early
stages of a project, when costs of changes are low. Staged processes also work well for projects that
are dominated by quality requirements rather than cost or schedule requirements. In these cases,
where quality and error-avoidance are high priorities, the most attractive path is a direct one with
early specification freeze and no subsequent changes that increase the likelihood of mistakes.
Inflexibility is the main disadvantage of narrow iterations constrained within phases. Because
they do not cross phase boundaries, narrow iterations cannot incorporate feedback from later phases.
It is difficult to fully specify requirements in the beginning of a project, especially in a dynamic
market. Poor or misleading specifications can lead to great market risk. Failure may result if early
specs and assumptions are proven wrong by subsequent market research, detailed design, or
prototyping. The staged process does not handle these midstream changes well and can be ill-suited
for projects in which requirements are poorly understood in the beginning.
Staged processes sometimes poorly suit companies when time-to-market is more important than
extra functionality or total quality. Staged processes mandate potentially burdensome
documentation and may also have difficulty incorporating cross-phase activities that do not fit neatly
into individual process stages. Finally, staged processes sometimes have difficulty handling parallel
tasks within stages. As a result, the length of each stage may be constrained by the slowest activity
within the stage, thus lengthening the development process (Smith and Reinertsen, 1992).
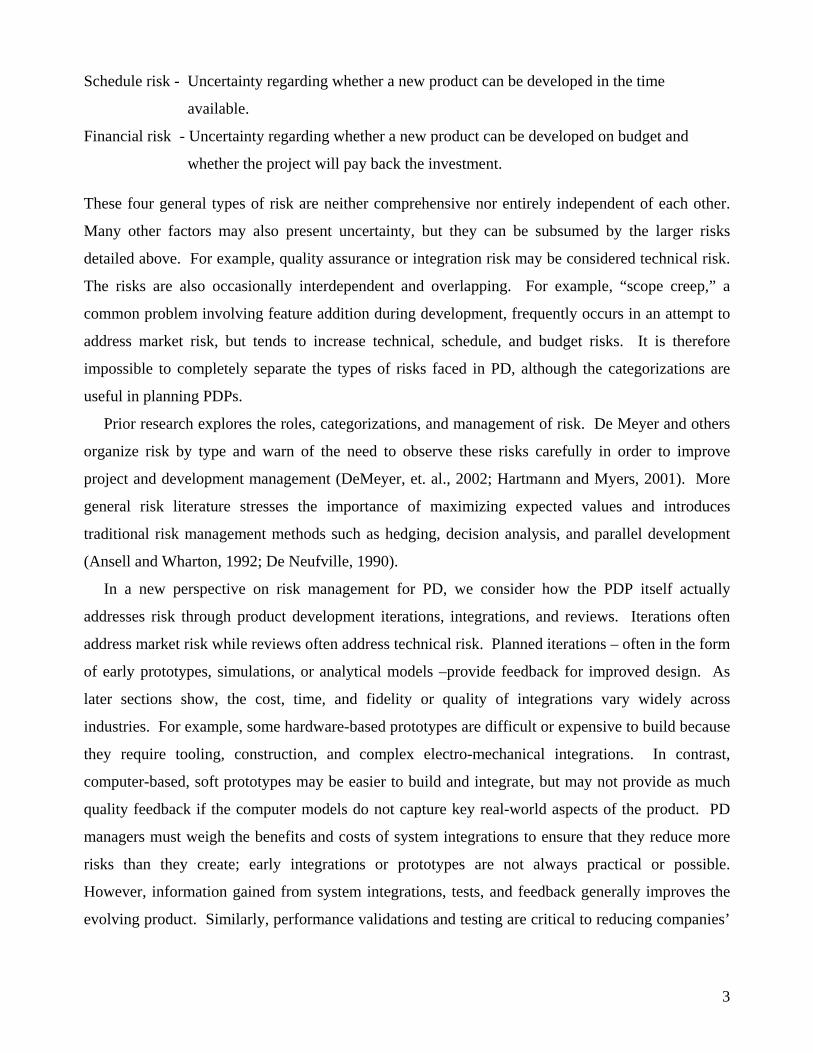
The spiral PDP differs from the staged process because of its emphasis on flexibility and
comprehensive iteration. Unlike the staged processes, the spiral process includes a series of planned
5
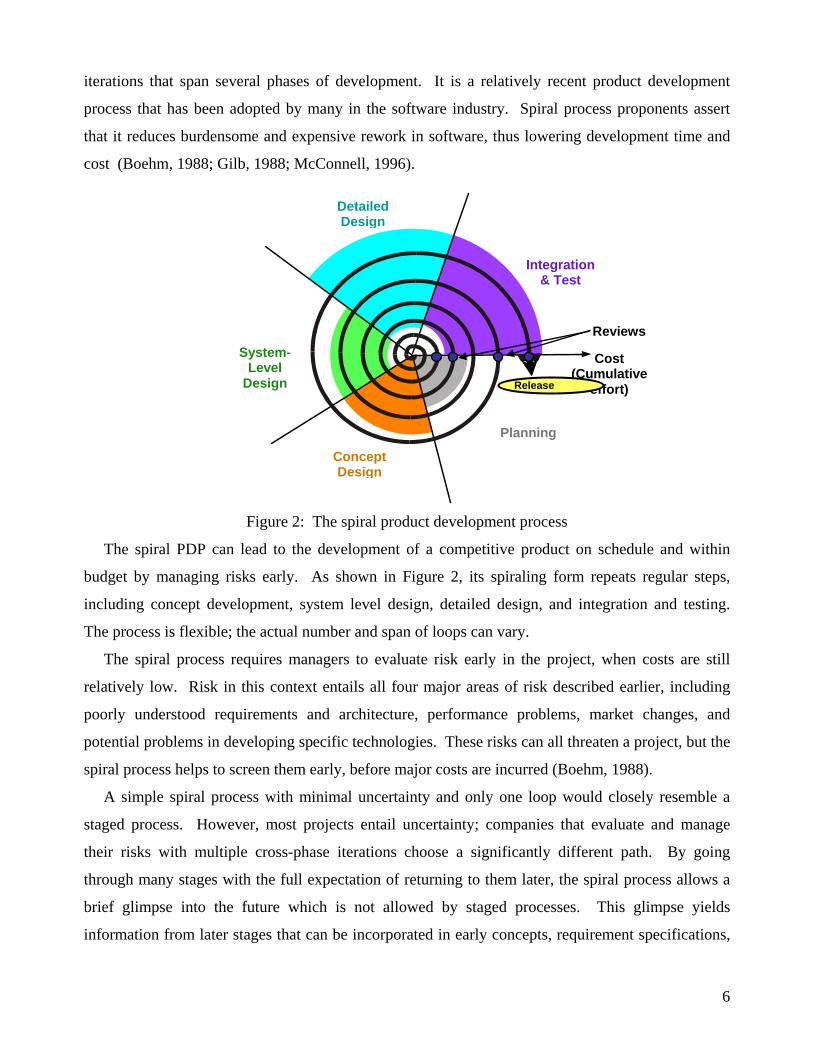
iterations that span several phases of development. It is a relatively recent product development
process that has been adopted by many in the software industry. Spiral process proponents assert
that it reduces burdensome and expensive rework in software, thus lowering development time and
cost (Boehm, 1988; Gilb, 1988; McConnell, 1996).
System-Level
Design
Figure 2: Th
The spiral PDP can lead to the de
budget by managing risks early. As
including concept development, syste
The process is flexible; the actual num
The spiral process requires manag
relatively low. Risk in this context e
poorly understood requirements and
potential problems in developing speci
spiral process helps to screen them ear
A simple spiral process with mini
staged process. However, most proj
their risks with multiple cross-phase
through many stages with the full exp
brief glimpse into the future which
information from later stages that can
DetailedDesign
Pla
R
e spiral product development
velopment of a competitive
shown in Figure 2, its spira
m level design, detailed des
ber and span of loops can vary
ers to evaluate risk early in
ntails all four major areas of
architecture, performance p
fic technologies. These risks
ly, before major costs are incu
mal uncertainty and only one
ects entail uncertainty; comp
iterations choose a signific
ectation of returning to them
is not allowed by staged p
be incorporated in early conc
Integration& Test
nning
Cost (Cumulative
effort)
Reviews
elease
ConceptDesign
process
product on schedule and within
ling form repeats regular steps,
ign, and integration and testing.
.
the project, when costs are still
risk described earlier, including
roblems, market changes, and
can all threaten a project, but the
rred (Boehm, 1988).
loop would closely resemble a
anies that evaluate and manage
antly different path. By going
later, the spiral process allows a
rocesses. This glimpse yields
epts, requirement specifications,
6
and architectures, thus reducing risk. The risk reduction comes at the cost of more flexible product
specifications, but this flexibility can be advantageous in dynamic environments. In this way, the
spiral process overcomes difficulties presented by unclear initial product requirements, a challenge
which is poorly handled by the classic staged process.
The spiral process has several disadvantages. First, it is more sophisticated and complex than
other processes, and thus requires more management attention. Second, the lack of rigid
specifications can potentially lead to delays in developing complex subsystems. Finally, the spiral
process may be overkill for simple projects that could use a simpler waterfall process (Boehm,
1994).
A key distinguishing feature of the spiral process is the planned, large-scale nature of iterations.
Risks are assessed in each iteration, allowing managers to plan an effective approach for the next
iteration. Unlike the expected small iterations which occur within individual stages of staged
processes, and unlike the large but unplanned and unwanted feedback loops which can occur in less
successful staged processes, iterations in the spiral process are planned and span several phases of
the development process. Despite this distinction, critics may consider it similar to a staged process
if the milestones and deliverables between each spiral round act merely as stage reviews.
Recent literature sources often recognize PDPs as risk management structures but often focus on
one process rather than comparative PDPs. For example, Cooper argues persuasively for the
effectiveness of the stage gate PDP (Cooper, 2001). Other sources, including those general sources
mentioned in the beginning of this section, take more tacit approaches but implicitly endorse this
point of view (Pahl and Beitz, 1996; Smith and Reinertsen, 1992). Boehm advocates the use of the
spiral process in software development, and is joined by others who denounce the deficiencies of
rigid waterfall processes and call for flexible prototyping (Boehm, 1988; Boehm and Bose, 1994;
Gilb, 1988; Hekmatpour and Ince, 1988). This stream of PD literature is strengthened by many
studies of individual companies’ PD efforts, ranging from software designers to automobile
manufacturers (Cusumano and Selby, 1995; Cusumano and Nobeoka, 1999; MacCormack, 2000;
Ward et. al., 1995).
Finally, some sources begin to compare different PDPs. Krubasik argues for the need to
customize PD, suggesting that “product development is not monochromatic…not all product
development is alike. Each situation has a different context…[implying] different managerial
actions” (Krubasik, 1998). Other authors offer brief and balanced comparisons of different PDPs,
but limit the scope to theoretical examples (McConnell, 1996). Finally, some sources use
7
comparative empirical studies to suggest a method of matching PDPs and context, but do not relate
these to PD success (MacCormack, 2000 and 2001).
2.3 PDP variation and problem definition
Staged PDPs facilitate managerial control while spiral PDPs allow more flexibility, and there are
many other PDP variations that fall between these extremes. The array of variants includes modified
staged processes, evolutionary prototyping and delivery processes, and design-to-schedule or design-
to-budget processes. Each of these PDP variants has distinct advantages and disadvantages, but PDP
differences are poorly understood and not yet fully acknowledged in existing literature and practice.
As a result, companies have difficulty designing or selecting PDPs.
Our research has three goals, all of which help to bridge the knowledge gap in existing literature
and industrial decision making. First we seek to identify different PDPs and establish that variety
exists. To do so, we define parameters that allow for evenhanded comparisons between PDPs.
Second, we demonstrate how different PDPs can address different risks through integrations,
iterations, and reviews. Finally, we use lessons from observation and comparison to propose a
method for improved PDP design and selection based on risk. Our overall research goal is to help
academics and business managers with the difficult task of identifying, comparing, and successfully
designing PDPs for risk management.
3. Characteristics for specific PDP comparison
This section proposes characteristics by which different PDPs can be defined, compared, and
contrasted. Companies try to balance structure and flexibility in their PDPs, but have difficulty
measuring degrees of either structure or flexibility. Characterizing PDPs requires identifying basic
traits that are shared by all processes: all PDPs employ design reviews, which uphold standards
and/or mark milestones; and all PDPs include iterations, which incorporate changes and feedback
between design groups or project phases. Characterizing PDPs also requires tenets that set PDPs
apart: although all PDPs use reviews and iterations, the manner of reviews and iterations varies
dramatically. They may vary in rigidity, frequency, scope, or several other parameters that affect
risk management. Thus, reviews and iterations – incorporating specifications, milestones,
integrations, and tests – are advanced as useful characteristics for distinguishing PDPs. These two
characteristics are useful metrics for PDP comparison because all PDPs include some combination
of iterations and reviews.
8
3.1 Design/Integrate/Test cycles
We focus our attention on the design-build-test-redesign and the design-analyze-redesign cycles
(the hard and soft forms of design iteration, respectively). Given the uncertainties inherent in PD,
iteration is inevitable and must be managed effectively. Iteration is technically defined as the
repetition of an action or process. This definition can be perceived positively (as in renewal and
improvement) or negatively (as in wasteful repetition). Our research defines iterations broadly to
include almost any kind of stepwise work that involves correction or feedback between
interdependent parts, people, or processes. Integrations and tests are types of iteration that allow
feedback from early versions of products.
Interdependent and complex tasks that require feedback introduce the potential of burdensome
and expensive rework if poorly managed. Rework, a combination of feedback and corrective action,
is also a type of iteration but is generally wasteful because it is a response to avoidable mistakes.
Although rework can be considered a specific and unfortunate type of iteration, iteration is not
synonymous with rework. Instead, well-managed design iteration can prevent rework and therefore
reduce technical, schedule and budget risks. Other types of iteration, such as presenting a customer
with a prototype to gauge consumer demands, can also alleviate market risk. Effective iteration can
prevent waste and overcome the uncertainties inherent in interdependent tasks.
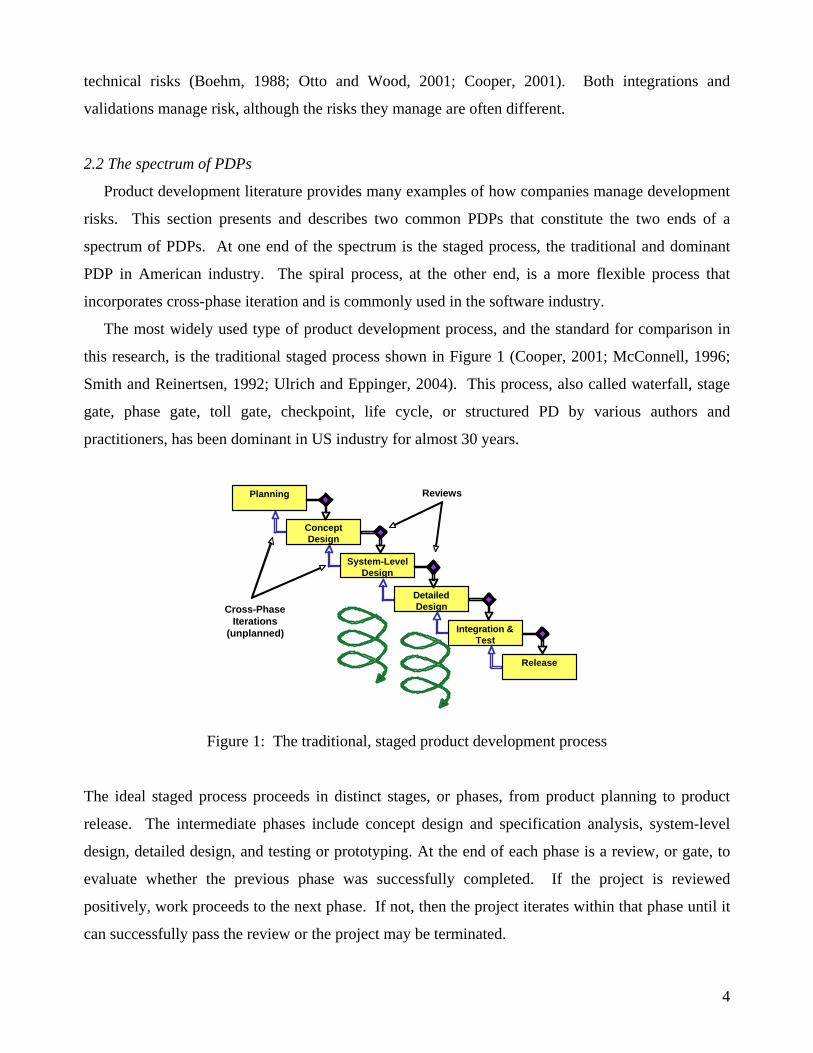
Iterations in PD can vary in three main ways. First, they can vary in breadth or scope of iteration.
Second, they can vary in the number of inter-phase loops they entail. Finally, iterations can vary in
degree of planning. These three parameters are shown in Figure 3, along with the scales we use to
measure each one.
The first parameter, the breadth or scope of iteration, is a critical descriptor of a company’s PDP.
Breadth can range from narrow to comprehensive. Narrow iteration is within phases, exemplified by
several rounds of interdependent detailed design tasks. Comprehensive iteration is across phases,
exemplified by processes that cycle not just around a specific stage, but rather over a range of
process stages from concept to prototyping.
The number of iterations can also greatly affect the nature of a PDP and its success in managing
risks. Whether a design is considered several times or just once is a major distinguishing feature
between processes. Only the cross-phase loops are of importance to this part of the study because
intra-phase loops are so common (and often automated in CAD programs) that they can barely be
distinguished from one another.
9
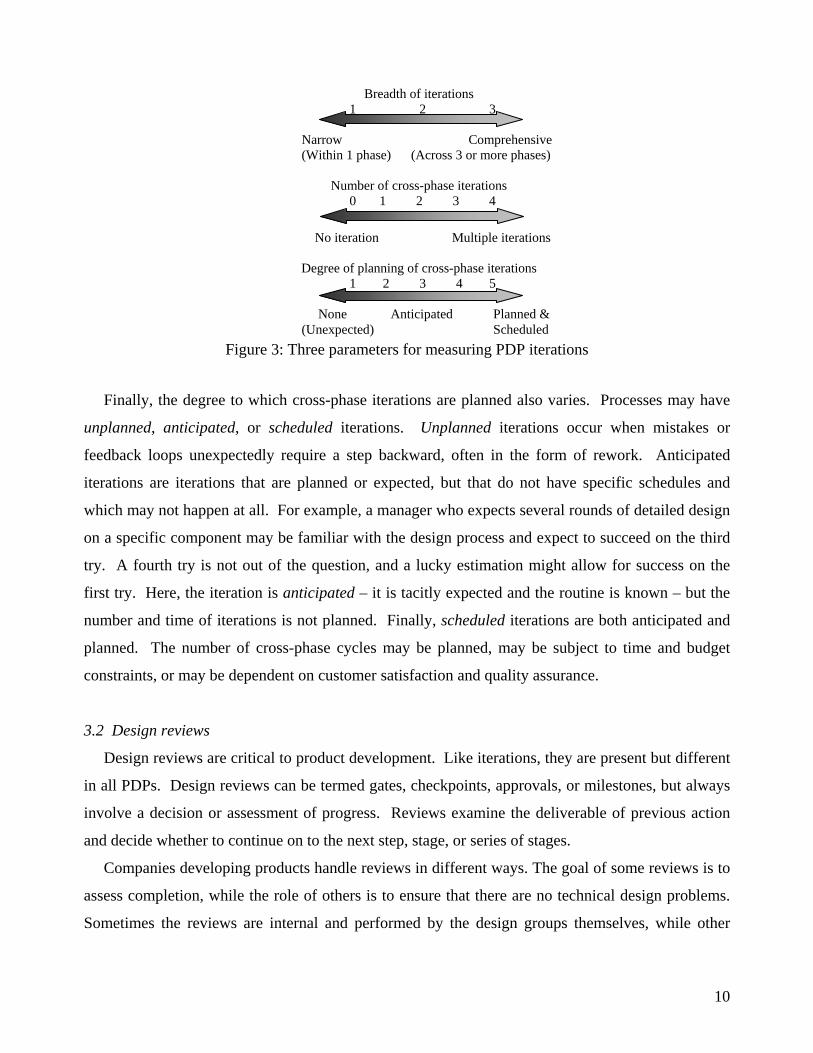
Breadth of iterations
1 2 3 Narrow Comprehensive (Within 1 phase) (Across 3 or more phases)
Number of cross-phase iterations 0 1 2 3 4
No iteration Multiple iterations
Degree of planning of cross-phase iterations 1 2 3 4 5 None Anticipated Planned & (Unexpected) Scheduled
Figure 3: Three parameters for measuring PDP iterations
Finally, the degree to which cross-phase iterations are planned also varies. Processes may have
unplanned, anticipated, or scheduled iterations. Unplanned iterations occur when mistakes or
feedback loops unexpectedly require a step backward, often in the form of rework. Anticipated
iterations are iterations that are planned or expected, but that do not have specific schedules and
which may not happen at all. For example, a manager who expects several rounds of detailed design
on a specific component may be familiar with the design process and expect to succeed on the third
try. A fourth try is not out of the question, and a lucky estimation might allow for success on the
first try. Here, the iteration is anticipated – it is tacitly expected and the routine is known – but the
number and time of iterations is not planned. Finally, scheduled iterations are both anticipated and
planned. The number of cross-phase cycles may be planned, may be subject to time and budget
constraints, or may be dependent on customer satisfaction and quality assurance.
3.2 Design reviews
Design reviews are critical to product development. Like iterations, they are present but different
in all PDPs. Design reviews can be termed gates, checkpoints, approvals, or milestones, but always
involve a decision or assessment of progress. Reviews examine the deliverable of previous action
and decide whether to continue on to the next step, stage, or series of stages.
Companies developing products handle reviews in different ways. The goal of some reviews is to
assess completion, while the role of others is to ensure that there are no technical design problems.
Sometimes the reviews are internal and performed by the design groups themselves, while other
10
times reviews are performed by upper management or by peers from other projects. The level of
formality of the reviews also varies dramatically.
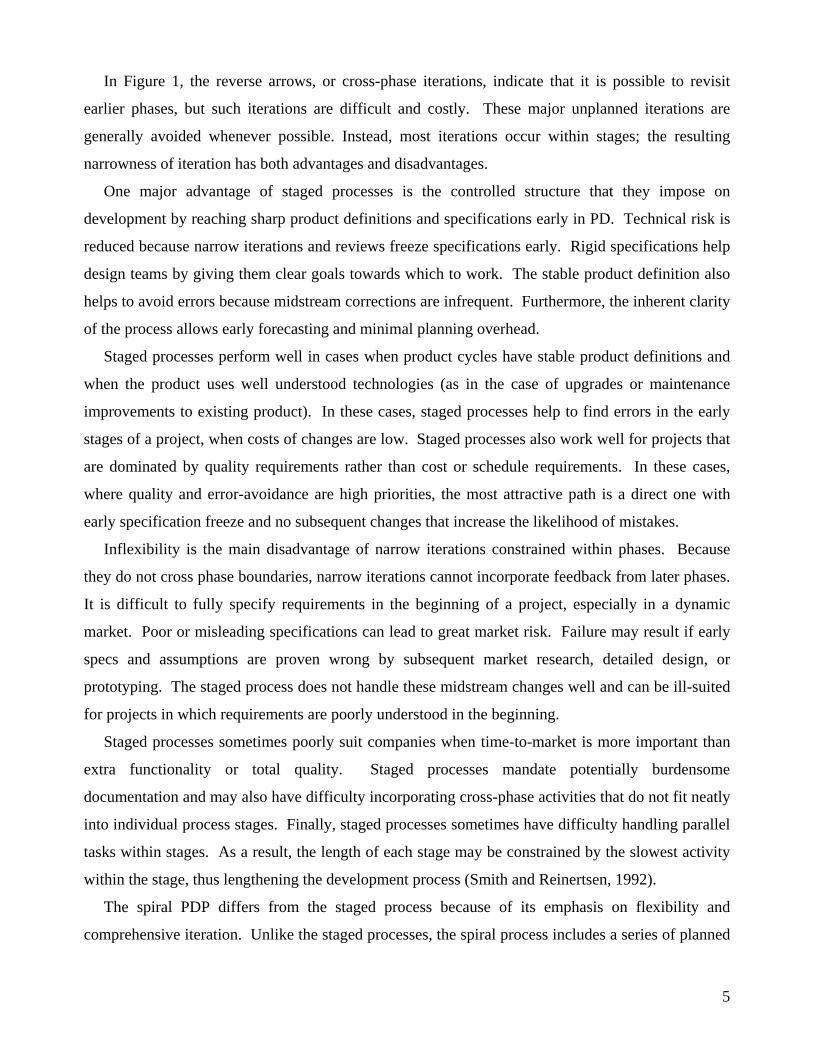
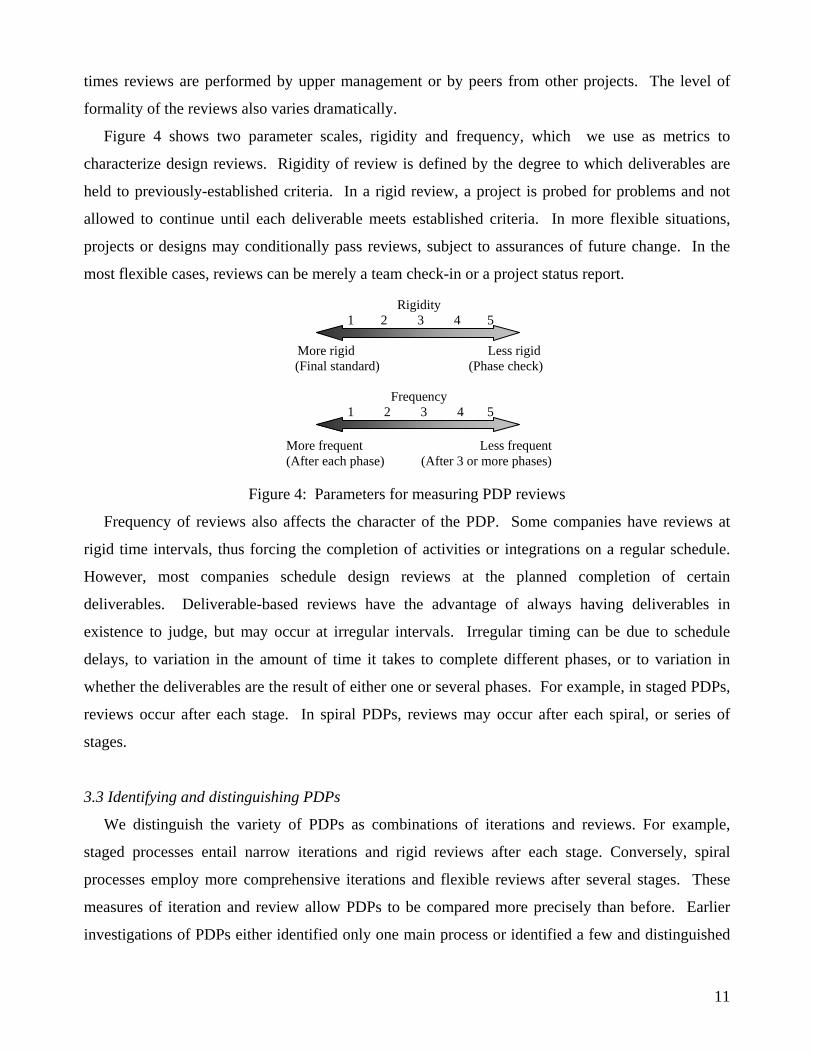
Figure 4 shows two parameter scales, rigidity and frequency, which we use as metrics to
characterize design reviews. Rigidity of review is defined by the degree to which deliverables are
held to previously-established criteria. In a rigid review, a project is probed for problems and not
allowed to continue until each deliverable meets established criteria. In more flexible situations,
projects or designs may conditionally pass reviews, subject to assurances of future change. In the
most flexible cases, reviews can be merely a team check-in or a project status report.
Rigidity 1 2 3 4 5
More rigid Less rigid (Final standard) (Phase check)
Frequency
1 2 3 4 5
More frequent Less frequent (After each phase) (After 3 or more phases)
Figure 4: Parameters for measuring PDP reviews
Frequency of reviews also affects the character of the PDP. Some companies have reviews at
rigid time intervals, thus forcing the completion of activities or integrations on a regular schedule.
However, most companies schedule design reviews at the planned completion of certain
deliverables. Deliverable-based reviews have the advantage of always having deliverables in
existence to judge, but may occur at irregular intervals. Irregular timing can be due to schedule
delays, to variation in the amount of time it takes to complete different phases, or to variation in
whether the deliverables are the result of either one or several phases. For example, in staged PDPs,
reviews occur after each stage. In spiral PDPs, reviews may occur after each spiral, or series of
stages.
3.3 Identifying and distinguishing PDPs
We distinguish the variety of PDPs as combinations of iterations and reviews. For example,
staged processes entail narrow iterations and rigid reviews after each stage. Conversely, spiral
processes employ more comprehensive iterations and flexible reviews after several stages. These
measures of iteration and review allow PDPs to be compared more precisely than before. Earlier
investigations of PDPs either identified only one main process or identified a few and distinguished
11
them only with descriptions of their diagram shapes or broad generalizations of their perceived
strengths and weaknesses. Here, the characterizations of iterations and reviews become the basis on
which all PDPs can be distinguished.
Each iteration/review combination also manages risk differently; no single PDP is suitable for all
risk circumstances. A product with many interfaces and interdependencies between hardware and
software may face a high degree of technical uncertainty. That technical uncertainty might be best
addressed with predictable, early iterations that test the technological feasibility of the concept
design and early specifications. In contrast, a product in an immature industry may face entirely
different risks if specifications are defined and frozen early. A company in this situation may opt to
employ early market tests to make sure that the specifications accurately reflect rapidly changing
customer needs.
4. Research Method
This section explains the methodology of the company case studies that underlie our research
findings. Case study methodology suits the goals of this research for four reasons. First, it provides
empirical data to help build theory about the complex and poorly understood relationship between
PDPs and risk. Second, it demonstrates the utility of using quantitative iteration and review metrics
to characterize PDPs and distinguish them from each other. Third, the resulting understanding of
several real PDPs provides counterexamples to conventional wisdom regarding the applicability of
certain processes. Finally, case study research is useful for understanding phenomena and building
theory, especially in the immature field of PD management. The case study methodology also
supports our proposal of new, quantitative characteristics that describe and distinguish different
PDPs while comparing them to earlier qualitative process information (Judd, 1991). The limitations
of case study research were of relatively minor consequence to this research. Case study
methodology has difficulty in proving causality because cases demonstrate only their own existence.
However, this research does not attempt to prove causality between development risk management
and PDP design. Rather, its main goal is to establish the existence and identities of different PDPs
and to build grounded theory relating PDP design to effective management (Dougherty, 2002).
4.1 Case study method
The goal of each case study was to gain a rich understanding of the company’s risks and PDPs.
The challenges were to identify what type of subjective risks were greatest and to learn of any
12
differences between official company PDPs and the processes that were actually implemented.
Meeting those challenges required conducting interviews, administering questionnaires, reviewing
public company literature, and studying private company PDP documentation.
In most cases, one company manager served as a lead contact and provided process documents
and lists of employees working on specific product development teams. In some cases, the lead
contact would also recommend studying certain product lines in response to the request to examine
both “new” and “variant” products. When available, official process documents were always read
first. Later, project team members were interviewed or given questionnaires about their PDPs.
Interviews followed the procedures for semi-structured “interview-conversations” described by
Blum, Buchanan, and Burgess (Blum, 1952; Buchanan, 1988; Burgess, 1984). Some common PDP
questions were asked consistently in all interviews, but in most interviews the latter half was
conversational and varied according to the person interviewed. Areas of questioning included both
the PDP and the development context. PDP questions dealt with review and iteration characteristics,
implementation of the official PDP, and perceived problems and advantages of the PDP. Contextual
questions probed the types and timing of prototypes, tests and validations, program schedules,
budgets, and major risks.
Most interviews were one-on-one discussions with employee expectations of anonymity.
Anonymity remains important because of the sensitivity of some questions about PDP
implementation. In some cases, official PDPs were not followed faithfully or were criticized by
interviewees, who were more at ease making admissions or accusations because they were assured
that they would not be personally identified. Some interviews were recorded on cassette tape when
allowed, but only for purposes of later transcription. In addition to private interviews, case studies at
two companies also included public group discussions of the companies’ PDPs, prompting open and
lively debate on the implementation, merits and disadvantages of their development processes.
Some companies were investigated with the help of public data in addition to interviews. In these
cases, such as Microsoft and Ford, existing literature and previous sources were considered first,
followed by data from interviews.
Because the case studies attempt to paint a realistic, “as-is” portrait of the PDPs, they do not
simply repeat official company process documentation. What companies say they do is not always
what they actually do. The case studies in this section reach beyond formal company descriptions to
include individual engineers’ and managers’ assessments of how the PDPs are actually implemented.
13
5. PDP case studies and analysis of results
This section presents nine of our company PDP case studies. The primary company case studies
examine Siemens Westinghouse Power Generation (SWPG), Integrated Development Enterprise
(IDe), ITT Industries, Aviation Technology Systems (ATS), Ford Motor Company, United
Technologies Corporation (UTC), DeskArtes, and Microsoft.
These case study companies represent several different industries and operating environments.
Four of the case study companies produce mostly software. Five of the case study companies
produce mostly manufactured goods, although several include important software components in
their products. Most case study subjects are large corporations, although three of them are smaller
companies with hundreds of employees rather than tens of thousands. Some of the companies
provided multiple case studies. ITT Industries and Xerox, for example, have units following
different processes. In those cases, two different projects were investigated. ITT was also included
because it was anticipated that its role as a defense contractor would lead it to have a uniquely
different risk profile from most other companies in this study. Two of the case studies, Ford and
Microsoft, were selected in part because of the availability of public PDP information. This use of
public data provides other researchers or reviewers with the means of independently examining
source data. It also allows readers who are familiar with these companies’ PDPs – which have been
extensively investigated by several other researchers – to compare these research findings to their
own knowledge and interpretations. The case study companies can be seen together in Figure 5.
5.1 Company and process descriptions
The first case study company, SWPG, is a large engineering and manufacturing company that
employs a strict staged PDP to develop turbomachinery for power generation. It faces major
technical risk, especially in the areas of quality assurance and thermal efficiency. Market risks are
mitigated by early contracts and system of guaranteed liquidated damages, which effectively transfer
market risk to technical risk by driving up engineering requirements. Cycle times for this company
are slow, with up to several years between the introduction of new products.
The second case study company, IDe, is a small software company that employs an evolutionary
delivery PDP to develop its internet-based development management products. It faces major
market risk, frequently must customize products to customers’ specifications, and operates with a
very fast cycle time of only a few months.
14
The third case study company, ITT Industries, is a large defense contractor whose products
include military electronics. ITT faces technical and schedule risks, but market risk is often limited
by the monopsonistic nature of the defense industry. The company uses a staged PDP with
“progressive freezes,” but applies it differently to different products. Progressive freezes mean that
specifications can be set in a piecewise fashion without delaying the entire development program.
Subsequent work can start on those requirements or design aspects that are known to be solidly
defined and unlikely to change. ITT’s experimentation with PDPs yielded two different results
because one process was used for development of a global positioning satellite (GPS) product while
another process was used in developing a military special unit operations radio (SUO).
The fourth case study company, Xerox, is a large manufacturing and software company that
develops copiers and document centers. Its considerable market risk forces a corporate culture of
on-time delivery and thus translates to schedule risk among design engineering groups. The
company uses a hybrid PDP that employs a staged process to develop the electro-mechanical
systems and a spiral process for the software systems.
The fifth case study, a collaboration of DeskArtes and Arabia, investigates small software and
manufacturing companies that use ray-tracing CAD software developed by DeskArtes to design
ceramic tableware manufactured by Arabia. The major risks include market risk inherent in visual
product aesthetics and industrial design. Use of the software allows an evolutionary prototyping
PDP and extensive customer testing of electronic prototypes.
The sixth and seventh case studies, ATS and Microsoft, both examine companies that use spiral
PDPs to develop software. Both faced primarily technical risk because industry dynamics subdued
market risk for both companies. The final case studies, UTC and Ford, both analyze large
manufacturing companies which employ staged PDPs despite facing considerably different risks.
Ford is more concerned with market risk and meeting disparate customer needs, while UTC is more
concerned with technical risks stemming from quality assurance.
5.2 Comparative case study findings Qualitative comparison between individual case studies reaffirms the difficulty companies have
in designing PDPs. The quantitative data applies the parameters proposed in Section 3 to actual
company processes. The resulting view demonstrates the existence of considerable variety among
company processes. The PDP distinctions also suggest that PDPs address risk and integration
differently, a principal finding that will be used later in the development of a PDP design method.
15
Qualitatively, the case studies reveal management difficulty in designing and implementing
PDPs. The cases demonstrate various reasons and inconsistent methods for choosing PDPs. The
cases also display frequent discrepancies between companies’ written and implemented processes
There appears to be no consistent method by which companies design or select their PDPs.
Although the case studies did not examine the underlying philosophy of management decisions that
led to PDP definitions, several disparate paths were evident. First, some companies changed their
PDPs due to organizational shifts. For example, SWPG formalized and added rigidity to its process
after a corporate acquisition and merger. Second, some companies redesigned their processes when
leading individuals perceived and wanted to address specific problems. For example, IDe
progressed slowly from a loosely-designed and flexible process to a more rigid evolutionary
development decision as its four lead managers determined that the company’s rapidly-growing
workforce required more order. Similarly, the Xerox process was reformed by the company’s chief
engineer in part to overcome persistent PD delays. Finally, some companies had their own
idiosyncratic reasons for PDP designs. Several of these companies hired consultants to help them
design or redesign their PD efforts; one of them specifically adopted a process “as a management
fad” that was promoted by a consultant. On the other hand, Microsoft modeled its PDP after the
culture of its developers by retaining “hacker” traits of frequent changes in development code. In
summary, some companies carefully consider the PDPs they implement, but others employ PDPs
with little regard for the suitability of those processes to company-specific risks or challenges.
Companies seem to have based their PDP decisions on many different factors, including their
disparate risk scenarios, but none had an analytical process to follow.
We observed that companies also have difficulty implementing the official processes they design.
The case studies investigate and probe actual, implemented PDPs because they frequently differ
from companies’ written processes. One of the few commonalities among all case studies is that
every one reveals discrepancies between written and implemented processes. Sometimes, those
differences are due to informal improvements to the written PDP, such as when ITT allows program
managers to omit process sections that they deem extraneous. Other times, differences between
written and actual PDPs are harmful and the result of poor implementation of good ideas. These
discrepancies must be noted in order to gain accurate understanding of companies’ PDPs.
Quantitatively, the case studies demonstrate the utility of the proposed metrics and display
differences among multiple, distinct processes. Section 3 reasoned that all companies use iterations
and reviews, and these findings confirm that this is true for each of the case study companies. No
16
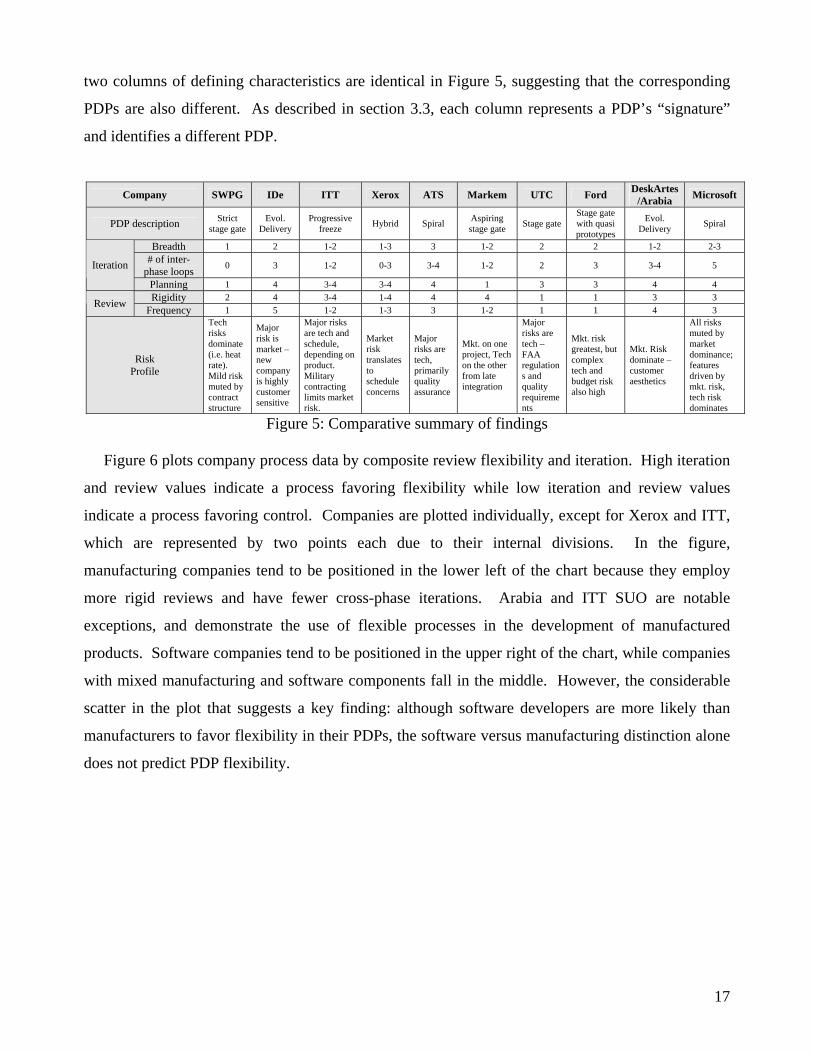
two columns of defining characteristics are identical in Figure 5, suggesting that the corresponding
PDPs are also different. As described in section 3.3, each column represents a PDP’s “signature”
and identifies a different PDP.
Company SWPG IDe ITT Xerox ATS Markem UTC Ford DeskArtes /Arabia Microsoft
PDP description Strict stage gate
Evol. Delivery
Progressive freeze Hybrid Spiral Aspiring
stage gate Stage gateStage gate with quasi prototypes
Evol. Delivery Spiral
Breadth 1 2 1-2 1-3 3 1-2 2 2 1-2 2-3 # of inter-
phase loop s 0 3 1-2 0-3 3-4 1-2 2 3 3-4 5 Iteration Planning 1 4 3-4 3-4 4 1 3 3 4 4 Rigidity 2 4 3-4 1-4 4 4 1 1 3 3 Review Frequency 1 5 1-2 1-3 3 1-2 1 1 4 3
Risk Profile
Tech risks dominate (i.e. heat rate). Mild risk muted by contract structure
Major risk is market – new company is highly customer sensitive
Major risks are tech and schedule, depending on product. Military contracting limits market risk.
Market risk translates to schedule concerns
Major risks are tech, primarily quality assurance
Mkt. on one project, Tech on the other from late integration
Major risks are tech – FAA regulations and quality requirements
Mkt. risk greatest, but complex tech and budget risk also high
Mkt. Risk dominate – customer aesthetics
All risks muted by market dominance; features driven by mkt. risk, tech risk dominates
Figure 5: Comparative summary of findings
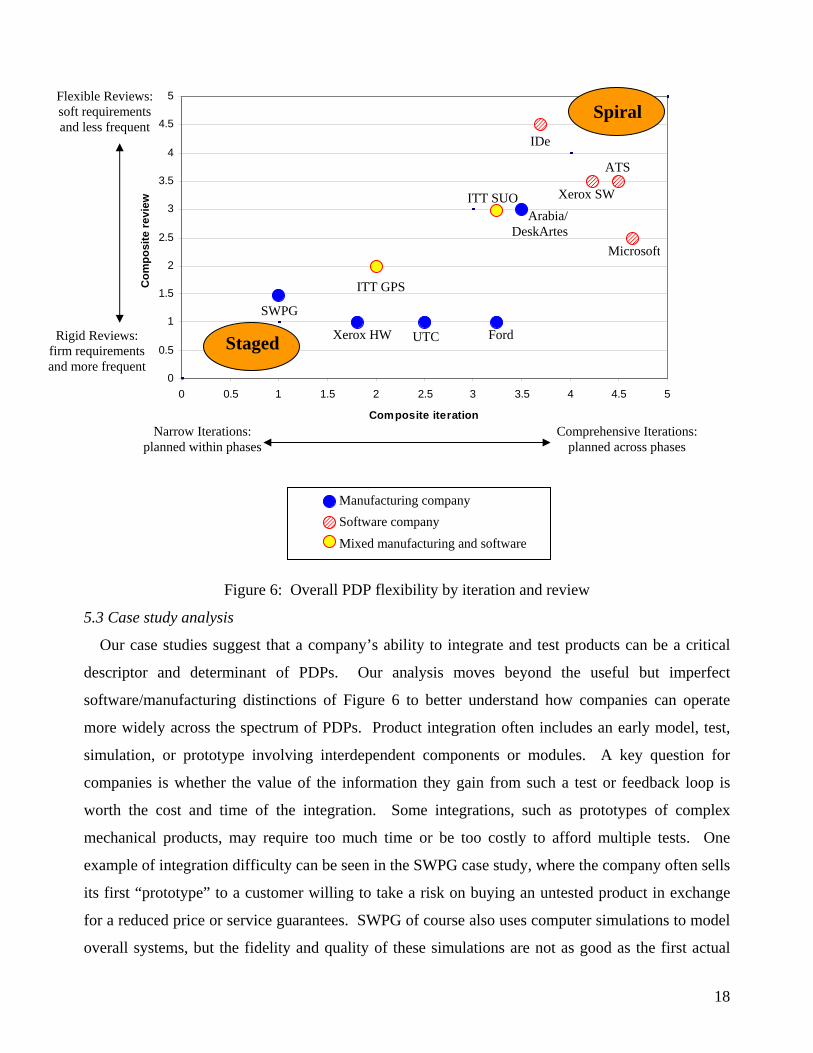
Figure 6 plots company process data by composite review flexibility and iteration. High iteration
and review values indicate a process favoring flexibility while low iteration and review values
indicate a process favoring control. Companies are plotted individually, except for Xerox and ITT,
which are represented by two points each due to their internal divisions. In the figure,
manufacturing companies tend to be positioned in the lower left of the chart because they employ
more rigid reviews and have fewer cross-phase iterations. Arabia and ITT SUO are notable
exceptions, and demonstrate the use of flexible processes in the development of manufactured
products. Software companies tend to be positioned in the upper right of the chart, while companies
with mixed manufacturing and software components fall in the middle. However, the considerable
scatter in the plot that suggests a key finding: although software developers are more likely than
manufacturers to favor flexibility in their PDPs, the software versus manufacturing distinction alone
does not predict PDP flexibility.
17
0
0.5
1
1.5
2
2.5
3
3.5
4
4.5
5
0 0.5
Com
posi
te re
view
Series1
Figu
5.3 Case study analysis
Our case studies sugges
descriptor and determina
software/manufacturing di
more widely across the sp
simulation, or prototype
companies is whether the
worth the cost and time
mechanical products, may
example of integration diff
its first “prototype” to a c
for a reduced price or serv
overall systems, but the fi
e
O
S
S
Arabia/ DeskArtes
W
Sta
Spiral Flexible Reviews: soft requirements and less frequent
Rigid Reviews: firm requirements and more frequent
Narrow Iterations:planned within phase
SWPG
1 1.5 2 2.5 3 3
Composite iteration
re 6: Overall PDP flexibility by iteration a
t that a company’s ability to integrate an
nt of PDPs. Our analysis moves bey
stinctions of Figure 6 to better understa
ectrum of PDPs. Product integration ofte
involving interdependent components or
value of the information they gain from
of the integration. Some integrations,
require too much time or be too costly
iculty can be seen in the SWPG case study
ustomer willing to take a risk on buying
ice guarantees. SWPG of course also use
delity and quality of these simulations ar
Cged
s
Manufacturing company
Software company
Mixed manufacturing and softwar
ID
ITT SU
ITT GP
Ford
.5 4
nd review
d test produ
ond the u
nd how com
n includes
modules.
such a test
such as pro
to afford
, where the
an untested
s computer s
e not as goo
Compreplann
e
AT
UT
Xerox HWXerox S
s
a
m
e
Microsoft
4.5 5
cts can be a critical
eful but imperfect
panies can operate
n early model, test,
A key question for
or feedback loop is
totypes of complex
ultiple tests. One
company often sells
product in exchange
imulations to model
d as the first actual
hensive Iterations: d across phases
18
prototype. Other companies, such as DeskArtes/Arabia, Microsoft, and ATS, can test their products
more easily because integrations of their software products require no physical construction or major
production expense. Their simulations are not merely models of reality; they are actual parts of the
code that later become the final product.
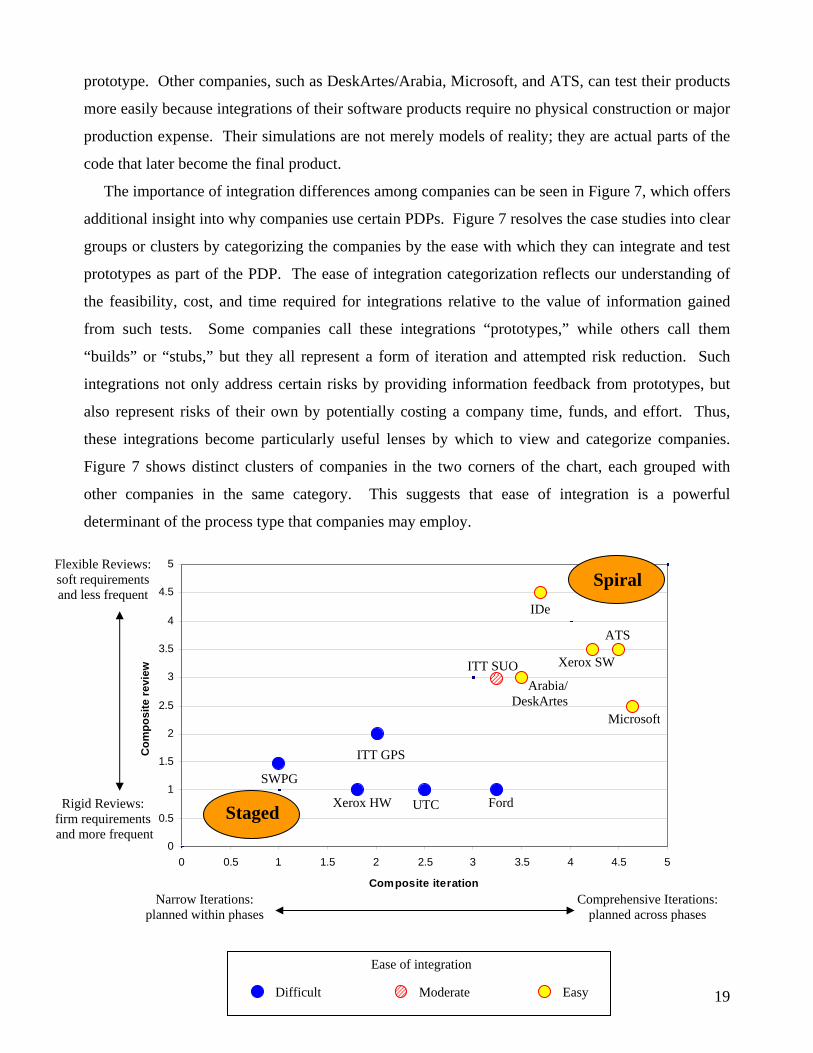
The importance of integration differences among companies can be seen in Figure 7, which offers
additional insight into why companies use certain PDPs. Figure 7 resolves the case studies into clear
groups or clusters by categorizing the companies by the ease with which they can integrate and test
prototypes as part of the PDP. The ease of integration categorization reflects our understanding of
the feasibility, cost, and time required for integrations relative to the value of information gained
from such tests. Some companies call these integrations “prototypes,” while others call them
“builds” or “stubs,” but they all represent a form of iteration and attempted risk reduction. Such
integrations not only address certain risks by providing information feedback from prototypes, but
also represent risks of their own by potentially costing a company time, funds, and effort. Thus,
these integrations become particularly useful lenses by which to view and categorize companies.
Figure 7 shows distinct clusters of companies in the two corners of the chart, each grouped with
other companies in the same category. This suggests that ease of integration is a powerful
determinant of the process type that companies may employ.
0
0.5
1
1.5
2
2.5
3
3.5
4
4.5
5
0 0.5
Com
posi
te re
view
Series1
Flexible Reviews: soft requirements and less frequent
e
O
S
S
Arabia/ DeskArtes
W
Sta
Spiral
Rigid Reviews: firm requirements and more frequent
Narrow Iterations:planned within phas
SWPG
1 1.5 2 2.5 3 3
Composite iteration
Cged
es
Difficult Moderate
Ease of integration
ID
ITT SU
ITT GP
Ford
.5 4
Compl
Easy
AT
UT
Xerox HWXerox S
Microsoft
4.5 5
prehensive Iterations: anned across phases
19
Figure 7: Case studies charted by ability to perform integrations These comparative charts of Figures 6 and 7 suggest that many PDPs in commercial practice
cluster towards two corners. Exceptions tend to occupy the lower right hand quadrant, suggesting
that companies are more flexible with their iterations than their reviews. It may be possible in the
future to find PDPs that would occupy the upper left corner of the charts, but such are likely rare
because of the difficulty of maintaining rigid iterations while simultaneously loosening reviews.
5.4 Additional research findings
The case studies and application of PDP metrics have already demonstrated the existence of
multiple PDP variants. Our research also suggests that risk and integration characteristics are useful
indicators of which process can be applied most effectively. The ensuing section points out two
additional, but related, findings. First, the proposed metrics are a useful means of comparing
processes. Second, the relationship between PD cycle times and design flexibility is
counterintuitive.
The proposed iteration and review parameters are found to be useful metrics for several reasons.
First, they fill a gap in PDP practice in literature. The metrics are necessary because previous
literature provided no equitable way of comparing or contrasting PDPs on a common scale. Indeed,
prior literature that attempted to compare PDPs did so based on either diagram shape or subjective
advantages and disadvantages. These proved to be difficult criteria by which to compare the initial
case studies. These iteration and review metrics provided a much-needed common language in
which different PDPs could be identified. Every PDP encountered could be described in terms of
review and iteration metrics. Once described quantitatively, the PDPs could be uniquely identified,
compared, and contrasted. Finally, these metrics have shown to be both understood and welcomed
by practitioners, who valued metrics as a way to better understand their own processes. The metrics
are easy to communicate and access: managers are frequently able to describe major iterations and
engineers are intimately familiar with the character of design and development reviews. Together,
the conceptual ease of communication and general applicability of the metrics made them useful.
The data also suggest that PD cycle time can be a misleading indicator of PDP choice. One might
expect that companies with long cycle times would be particularly attuned to market risk because
market needs can change over the duration of PD. Thus, companies with long cycle times would
20
emphasize prototyping, customer involvement, and cross-phase iterations. Conversely, one would
expect that companies with short cycle times, software companies for example, could afford to avoid
such market feedback efforts because customer testing would take valuable time and any potential
improvements could be included in the next product version, usually already in the pipeline.
Such assumptions about PDP choice would be misleading. Although most companies face the
common difficulty of writing specifications, companies in fast-paced markets tend to favor flexible
processes, such as the spiral process or evolutionary delivery process, that incorporate frequent
customer interaction or testing. This preference may be because the benefits of market feedback
outweigh the costs of prototyping and testing the product. Meanwhile, manufacturing companies
that release products less frequently tend to use fewer planned, cross-phase iterations and therefore
build fewer integrated prototypes. This occurs because of product complexity, steep prototyping
costs, and the long lead times necessary to build physical models. The counterintuitive result of this
mismatch is that companies with the greatest need for market flexibility are sometimes the least
likely to generate customer feedback during a PD cycle. Companies that are less sensitive to market
changes because of short cycle times nevertheless frequently incorporate market feedback.
6. Applying case study lessons: Proposing a PDP design method We learned from the case studies that companies implement vastly different PDPs. From these
companies and others, we also heard that managers lack guidance in choosing or designing such
processes. Simply adopting a PDP that works for another company is unlikely to lead to success.
We believe that PDPs should be methodically customized to different companies or programs, and
thus the need for an improved PDP design method is real and immediate. In this section, we apply
lessons from the case studies to propose and apply a helpful tool: a PDP design method that can
assist companies in planning or selecting their PDPs. The PDP design method matches risks to
specific process iterations and reviews, thus helping companies design processes that suit their own
risk profiles and abilities to integrate or prototype. To demonstrate its utility, we apply the method
to redesign the PDP at a manufacturing company.
6.1 PDP design method proposal
In formulating a new PDP design method, the relevant lessons from our case study results include:
• Companies face unique sets of individual development risks and integration abilities that should
be the basis for PDP design.
21
• PDPs are comprised of design iterations and reviews. We should consider how best to use
iteration and review cycles in customized PDP designs.
• Iterations can be employed to address various risks. The specific risks addressed depend upon
what activities are involved in the iterations and upon the timing of the iterations. For example,
technical and market risks can be handled by iterations spanning design, prototyping, integration,
and testing.
• Design reviews may also help to manage risks, both in conjunction with and independently of
iterations. The types of risks managed depend on the characteristics of the design reviews. For
example, frequent reviews can provide the control necessary to handle schedule and budget risk.
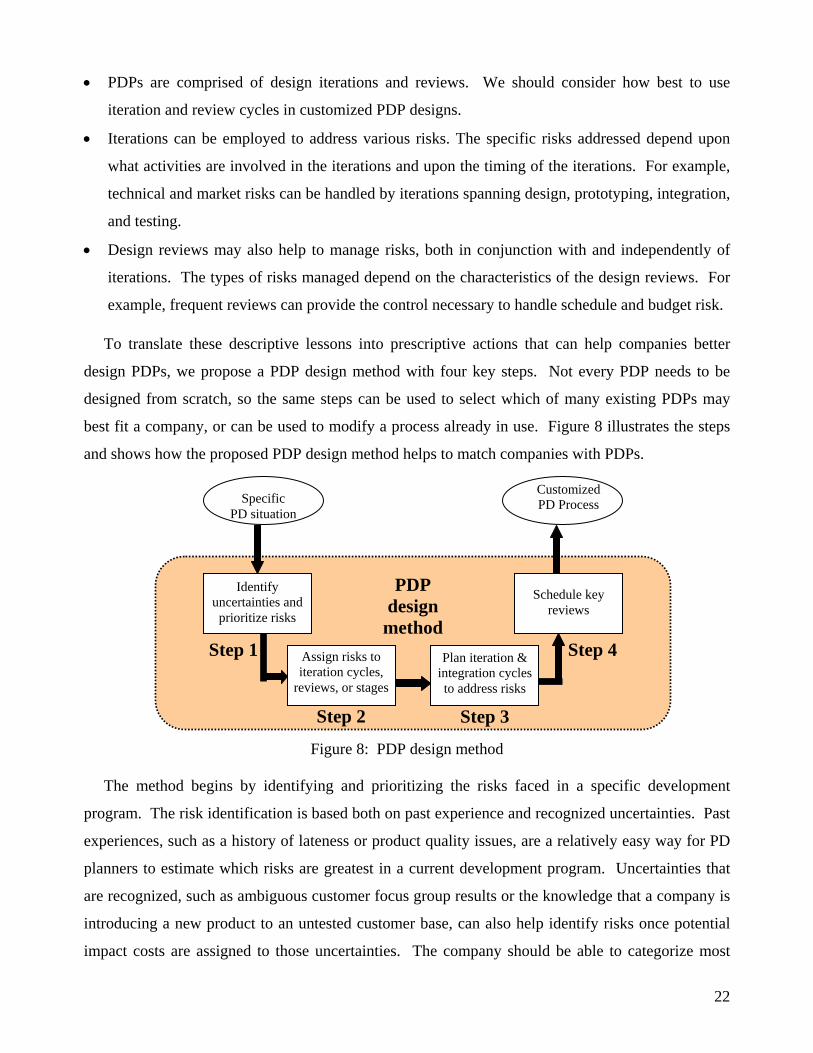
To translate these descriptive lessons into prescriptive actions that can help companies better
design PDPs, we propose a PDP design method with four key steps. Not every PDP needs to be
designed from scratch, so the same steps can be used to select which of many existing PDPs may
best fit a company, or can be used to modify a process already in use. Figure 8 illustrates the steps
and shows how the proposed PDP design method helps to match companies with PDPs.
Specific PD situation
Step 2
Assign risks to iteration cycles,
reviews, or stages
Identify uncertainties and prioritize risks d
m
Step 3
Plan iteration &integration cycleto address risks
Step 1
Figure 8: PDP design method
The method begins by identifying and prioritizing the risks fa
program. The risk identification is based both on past experience and
experiences, such as a history of lateness or product quality issues, a
planners to estimate which risks are greatest in a current developme
are recognized, such as ambiguous customer focus group results or th
introducing a new product to an untested customer base, can also he
impact costs are assigned to those uncertainties. The company sho
CustomizedPD Process
Schedule key reviews
PDP esignethod
s
Step 4
ced in a specific development
recognized uncertainties. Past
re a relatively easy way for PD
nt program. Uncertainties that
e knowledge that a company is
lp identify risks once potential
uld be able to categorize most
22
risks as technical, market, schedule, or budget risks, although some risks will defy classification.
For example, specification definition often falls in the category of market risk, but a
hardware/software interface issue that could arise during integration might result in both technical
and schedule risk. Risks are then prioritized. There are often one or two “showstoppers,” or high-
probability risks that are likely to ensure failure if they are not addressed. The resulting risk profile
becomes the focus of the PDP design method.
Our case studies have shown how iterations and reviews address risks. After risks have been
identified and prioritized, each risk is then assigned to a planned iteration cycle (either within or
across PD stages) and to a design review. Low priority risks can be simply assigned to stages rather
than to an iteration and review combination. For example, technical risk regarding the design of an
isolated product component can be assigned to a detailed design stage with only minor (intra-stage)
iterations among design engineers. More complicated risks are assigned to specific planned iteration
cycles and reviews. For example, high customer uncertainty and the resulting market risk may be
assigned to two planned, cross-phase iterations that incorporate one prototype or customer test per
cycle. Each iteration provides feedback that reduces risk in the next round. A critical product
launch date, giving rise to high schedule risk (linked also to budget risk) may prompt a company to
include reviews at regular time intervals rather than only at the end of each stage.
Once the risks are assigned to iteration cycles and reviews, the project stages are planned around
them. The stages are defined as unique combinations of iterations and reviews comprising the PDP.
The result is a PDP prescription that addresses a project’s major development risks.
6.2 Method demonstration: Printco application
The PDP design method has been successfully applied to a sample company. The company, with
the pseudonym Printco, is a 1500-employee engineering and manufacturing company that develops
printers, coders, and markers for shipping and inventory. Its products are mainly hardware, although
some machines also include important software components. The company expressed interest in
using the lessons of this research immediately because it was in the early stages of reorganizing its
own PDP. This section discusses how the method was used to prescribe process improvements for
Printco, which has implemented PDP changes based in part on these suggestions.
The application of the PDP design method described in Figure 8 identified unusual risks in the
company’s various PD efforts. For example, some of its derivative, or next-generation products,
faced substantial market risk but only minor technical risk. Other products faced both market and
23
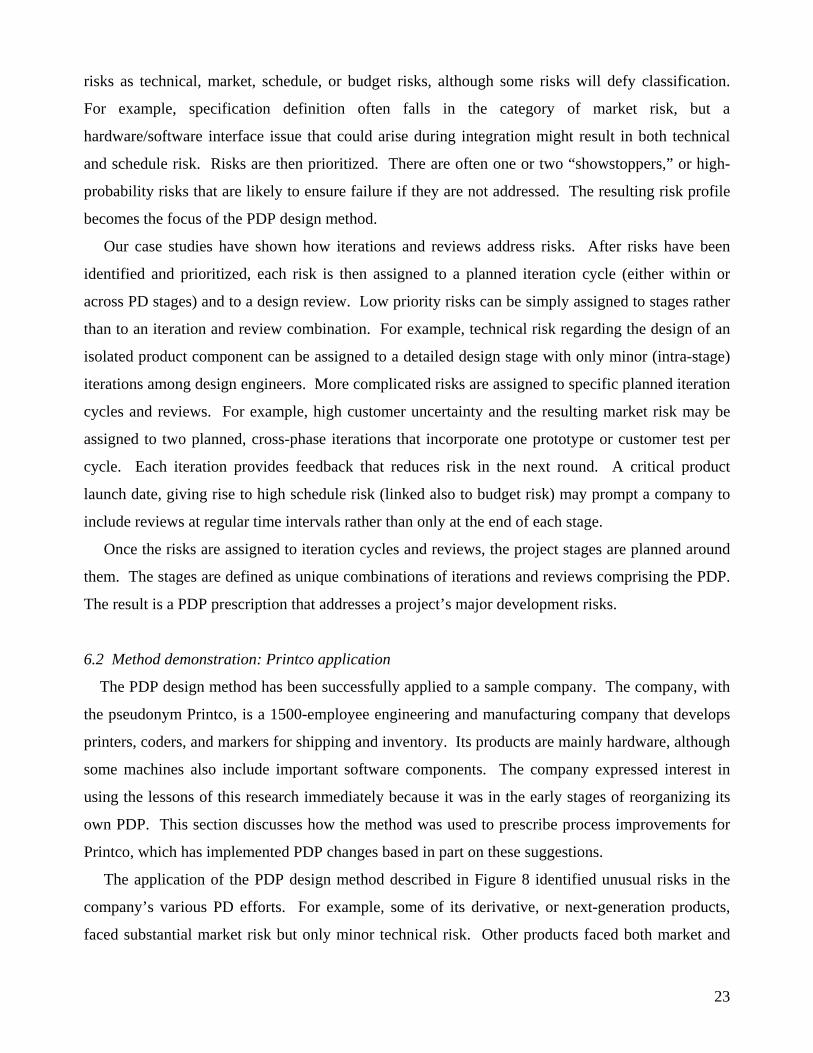
technical risk, and were delayed by technical challenges that extended late in the program. Printco’s
risk did not match with its existing iteration and review scheme. As shown in Figure 9, the former
Printco PDP incorporated design iterations of medium breadth. Most iterations were intraphase with
usually only one or two interphase loops which were manifested as rework. The degree of planning
of these iterations was low because they were neither encouraged nor overtly expected. Printco
reviews were more frequent than its iterations, but lacked rigidity. The result was a series of late
projects and quality control problems.
Iteration Review
Scope # of cross-phase loops
Level of planning
Rigidity Frequency
Former PDP 1-2 1-2 1 4 1-2
Suggested PDP 2-3 2-3 3 2 1
Figure 9: The former and recommended Printco PDPs
The PDP design method called for reassigning Printco’s risks to iterations and reviews that would
correct the problems of the old process. It was recommended that Printco make some of its reviews
more rigid to establish greater control over market and schedule risk. It was also suggested that,
rather than eliminating the cross-phase iterations (rework) that formerly delayed the product launch,
the company should acknowledge the need for such iterations and plan market prototypes within
them. Other companies have seen success in incorporating both the rigid reviews of staged
processes and the planned, early prototype iterations of spiral processes. Printco, on the other hand,
faced difficulty in building prototypes early enough to garner the information necessary to
substantively change design. Information from “late stages” frequently arrived so late that change
was costly and difficult. The company was not taking advantage of its ability to perform more
frequent integrations.
Suggested PDP incorporates
more comprehensive iterations for greater market feedback and reduced market risk
Suggested PDP incorporates
more rigid reviews for improved scheduling and reduced tech risk
The PDP design method yielded a hybrid approach of rigid reviews and modestly planned
prototyping iterations, as suggested in Figure 9. This would move Printco from the upper left region
of Figure 6 to the lower right quadrant, reflecting increased flexibility in iterations and more
restrictive reviews. These recommendations based on the PDP design method were presented first to
Printco’s senior PD manager and then to an assembly of engineers, marketers, and managers. The
24
suggestions generated much discussion and were well received. Printco has made PDP changes
based in part on these recommendations, however results of the process changes will not be known
until at least the end of several product development cycles in which they are implemented. The
Printco demonstration does not yet validate the PDP design method, but the positive reaction to the
recommendations and projected cost reductions suggest that the method is a reasoned application of
the iteration and review lessons from earlier cases.
7. Implications and Conclusions
Product development is a necessary risk for innovative companies. Although it holds the promise
of increased sales, market share and profits, PD can fail due to technical difficulties, cost overruns,
and missed market opportunities. PDPs must therefore not only focus on the final outcome – a new
product – but also on mitigating the many development risks. We exhibit and explain PDPs as risk
management structures. In exploring the relationships between risk management and PDP design,
we make three key contributions.
First, we analyze several PDPs both theoretically and empirically to demonstrate how PDPs
substantively differ from each other. We build upon previous literature that either does not
adequately distinguish between different processes or makes comparisons based on subjective
criteria. We make a secondary contribution to the field by proposing and supporting new metrics
with which PDPs can be identified and compared. The metrics are based on design reviews and
iterations, which are characteristics of all PDPs.
Second, we describe how various PDPs manage different development risks. PDPs with planned
iterations and integrations can generate valuable data that are fed back to early process stages and
reduce risk. Software companies tend to favor such processes, but the root cause of differences in
PDP applicability lies not in whether a product is manufactured with parts or written with code, but
rather in a company’s ability to integrate or prototype effectively.
Our third contribution is the proposal and subsequent application of a PDP design method based
on risk, iteration, and review. This tool is a directly applicable contribution of our research, and can
provide companies with a framework by which they can intelligently design PDPs that suit specific
project needs. The method allows project planners to evaluate risks and to manage those risks with
specific elements of the PDP. Just as segmentation is a valuable tool in marketing products, dividing
PDPs into reviews and iterations, as well as into their traditional stages, can be helpful in product
25
development. Future application of this method will integrate process changes to existing PDPs at
established companies.
References Ansell, J., and Wharton, F. (ed.) Risk: Analysis, Assessment and Management, New York: John Wiley & Sons, 1992. Blum, F.H., “Getting Individuals to Give Information to the Outsider,” Journal of Social Issues, Vol. 8, No. 3, 1952 pp.
34-52. Boehm, B., “A Spiral Model of Software Development and Enhancement,” IEEE Computer, 1988, pp. 61-72 Boehm, B., and Bose, P., “A Collaborative Spiral Software Process Model Based on Theory W,” 3rd International
Conference on the Software Process, Applying the Software Process, IEEE, Reston, Virginia 1994. Buchanan, D. et al., “Getting In, Getting On, Getting Out, and Getting Back,” Ch. 3, pp. 53-67, in Doing Research in
Organizations, Alan Bryman ed., New York: Routledge, 1988. Burgess, R. G., In the Field: An Introduction to Field Research, Boston: George Allen and Unwin, 1984. Cleland, D., Project Management, Strategic Design and Implementation, 2nd ed. New York: McGraw-Hill, 1994. Cooper, R.G., Winning at New Products, 3rd ed. Cambridge: Perseus Publishing, 2001. Cusumano, M. and Selby, R., Microsoft Secrets, New York: The Free Press, 1995. Cusumano, M. and Nobeoka, “Organizational Requirements for Multi-Project Management,” Ch. 7 in Thinking Beyond
Lean, New York: The Free Press, 1999. De Meyer, A., Loch, C., and Pich, M., “Managing Project Uncertainty: From Variation to Chaos,” MIT Sloan
Management Review, Winter 2002, Vol. 43, No. 2, pp. 60-67 De Neufville, R., Applied Systems Analysis, New York: McGraw Hill, 1990. Dougherty, D., “Grounded Theory Research Methods,” in Blackwell Companion to Organizations, Joel Baum, ed.,
Medford, MA: Blackwell Publishers, 2002. Eppinger, S.D., et. al., “A Model-Based Method for Organizing Tasks in Product Development,” Research in
Engineering Design, 6:1-13, 1994. Eppinger, S.D., “Innovation at the Speed of Information,” Harvard Business Review, January 2001, Vol. 79, No. 1, pp.
149-158. Foster, R. and Kaplan, S., Creative Destruction, “Control, Permission, and Risk,” New York: Currency, Ch. 4, 2001. Gilb, T., Principles of Software Engineering Management, Reading, Mass: Addison-Wesley Publishing Company, 1988. Hartmann, G. and Myers, M. B. “Technical Risk, Product Specifications, and Market Risk,” in Taking Technical Risk,
by Branscomb, Lewis and Auerswald, Philip, Cambridge: The MIT Press, 2001, pp. 30-43. Hekmatpour, S. and Ince, D., Software Prototyping, Formal Methods and VDM, Reading, Mass: Addison-Wesley
Publishing Company, 1988. Jachimowicz, F. et. al., “Industrial-academic Partnerships in Research,” Chemical Innovation, Sept. 2000, pp. 17-20. Judd, C.M. et. al., Research Methods in Social Relations, 6th ed. Fort Worth: Harcourt Brace Jovanovich, 1991. Krubasik, E.G., “Customize Your Product Development,” Harvard Business Review, November-December, 1998,
pp. 4-9. MacCormack, A., Verganti R., and Iansiti, M., "Developing Products on Internet Time: The Anatomy of a Flexible
Development Process." Management Science 47, No. 1 (January 2001) MacCormack, A., "Towards a Contingent Model of the New Product Development Process: A Comparative Empirical
Study." Harvard Business School Working Paper Series, No. 00-077, 2000. MacCrimmon, K.R. and Wehrung, D.A., Taking Risks: The Management of Uncertainty, New York: The Free Press,
1986. McConnell, S., Rapid Development: Taming Wild Software Schedules, Ch. 7: Lifecycle Planning, Redmond: Microsoft
Press, 1996. Otto, K. and Wood, K., Product Design, New Jersey: Prentice Hall, 2001. Pahl, G. and Beitz, W., Engineering Design, A Systematic Approach, 2nd ed. London: Springer, 1996. Smith, P.G. and Reinertsen, D.G., “Shortening the Product Development Cycle,” Research-Technology Management,
May-June, 1992, pp. 44-49 Ulrich, K.T. and Eppinger, S.D. Product Design and Development, 3rd ed. New York: McGraw Hill, 2004. Ward, A., et. al., “The Second Toyota Paradox: How Delaying Decisions Can Make Better Cars Faster,” Sloan
Management Review, Vol. 36, Issue 3, Spring, 1995, pp.43-61.
26