Embed Size (px)
Citation preview

Mitigación de las emisiones de metano: Estrategias microbiológicas y sus retos
Laboratorio de Biorremediación
Facultad de Ciencias Biológicas de la
Universidad Autónoma de Coahuila
Unidad Torreón, Coahuila
Nagamani Balagurusamy

Past and current global atmospheric concentrations
of principal greenhouse gases
GasPre-industrial
concentration
Current
atmospheric
concentration
Global
warming
potential
Carbon
dioxide
(CO2)
277 ppm 400 ppm 1
Methane
(CH4)600 ppb 1728 ppb 25
Nitrous
oxide (N2O)270-290 ppb 318 ppb 296
Introduction
Mexico accounts for
1.5% of the world
total GHG
emissions
0
5
10
15
20
25
% o
f th
e t
ota
l G
HG
em
iss
ion
s
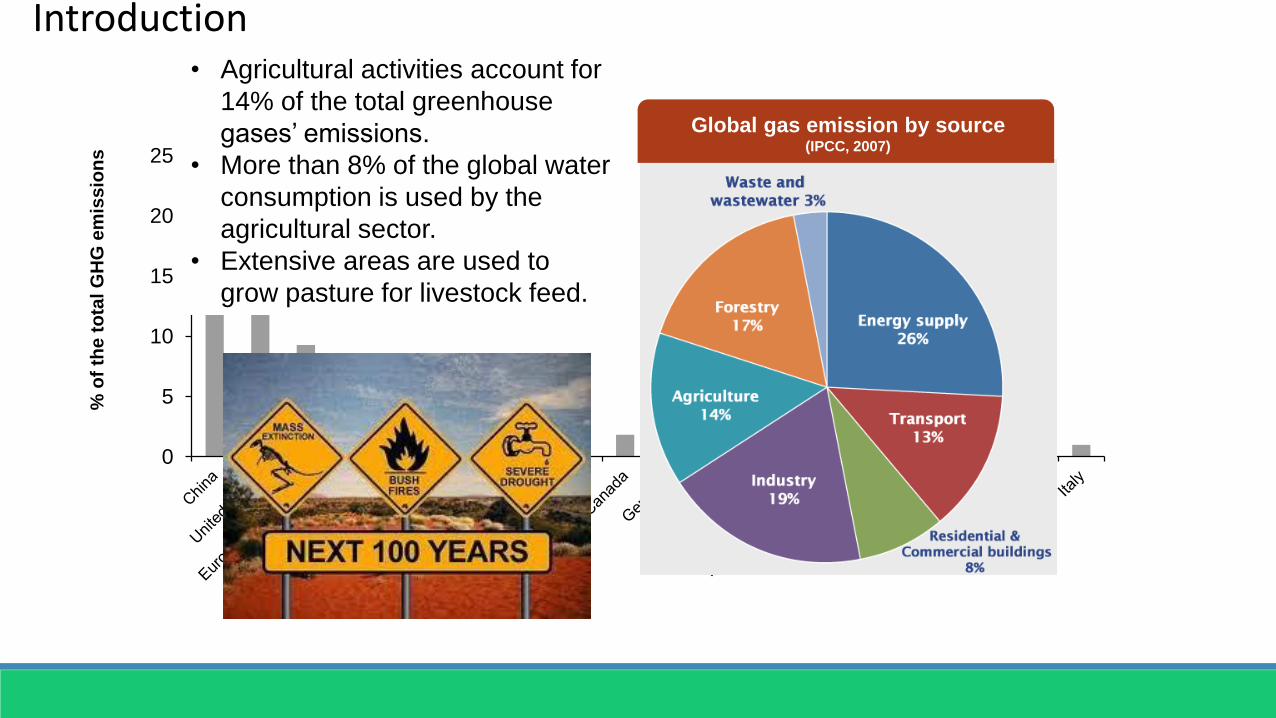
Global gas emission by source(IPCC, 2007)
World Resources Institute, 2011
• Agricultural activities account for
14% of the total greenhouse
gases’ emissions.
• More than 8% of the global water
consumption is used by the
agricultural sector.
• Extensive areas are used to
grow pasture for livestock feed.
Introduction

Livestock sector plays an important role in
climate change contributing about 14.5% of
anthropogenic GHG emissions.
Beef and cattle milk production account for the
majority of these emissions, respectively
contributing 41 and 20 percent of the sector’s
emissions.
Mexico – rich in cattle wealth.
Manure map of Mexico
LIVESTOCK
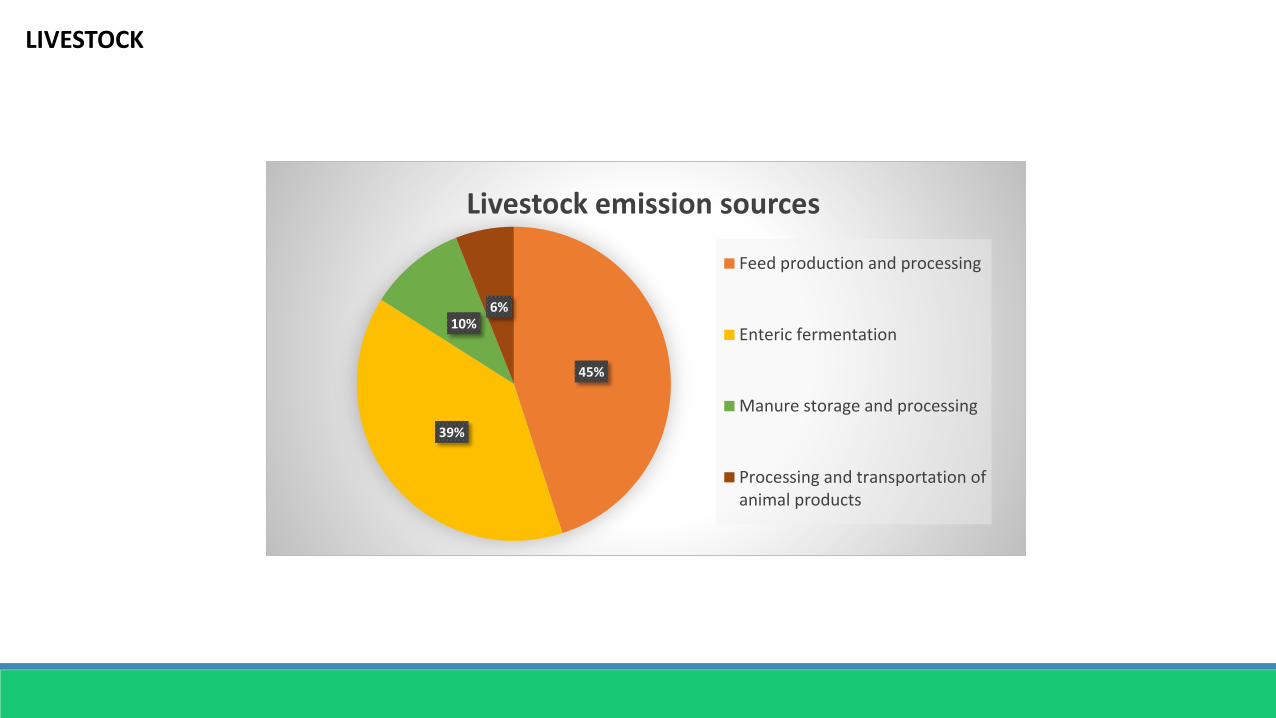
45%
39%
10%6%
Livestock emission sources
Feed production and processing
Enteric fermentation
Manure storage and processing
Processing and transportation ofanimal products
LIVESTOCK
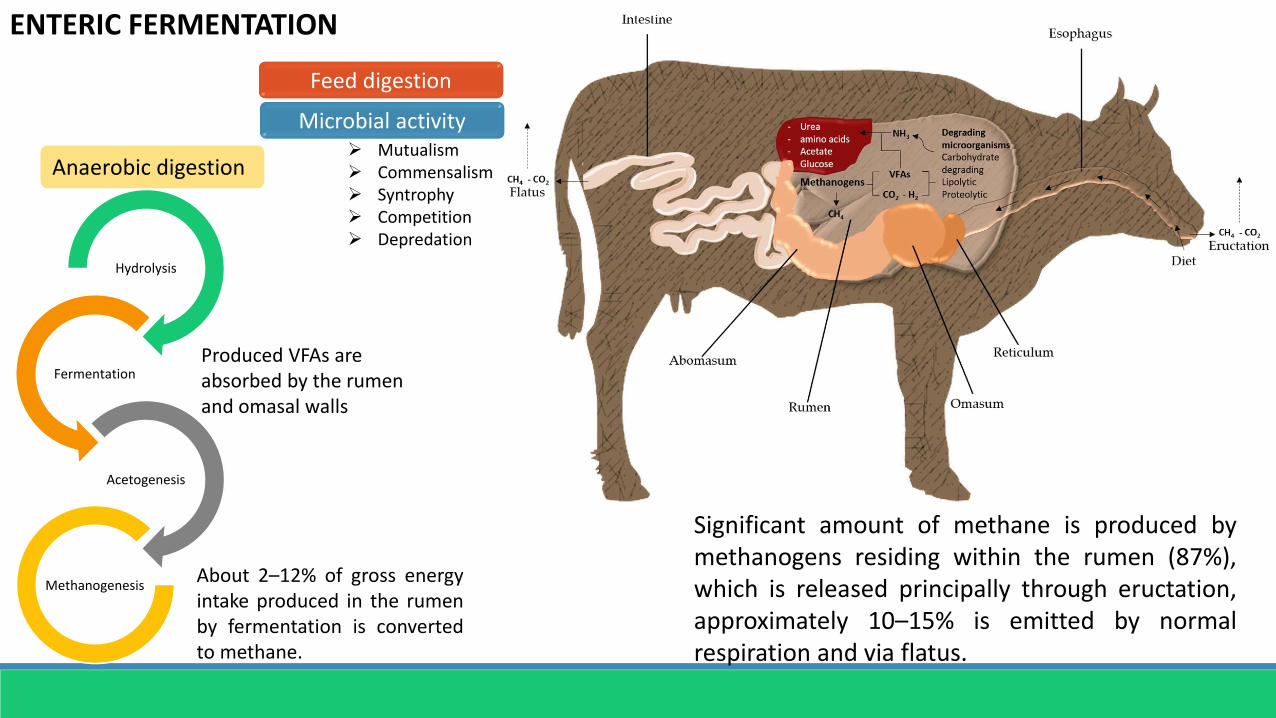
ENTERIC FERMENTATION
Significant amount of methane is produced bymethanogens residing within the rumen (87%),which is released principally through eructation,approximately 10–15% is emitted by normalrespiration and via flatus.
Feed digestion
Microbial activity
Hydrolysis
Fermentation
Acetogenesis
Methanogenesis
Produced VFAs are absorbed by the rumen and omasal walls
Mutualism Commensalism Syntrophy Competition Depredation
About 2–12% of gross energyintake produced in the rumenby fermentation is convertedto methane.
Anaerobic digestion

Microbial populations can be affected byfactors such as type and race of animal,age of the host, diets, feeds, farmingpracticing and geographical regions whichinfluence directly methane production.
MITIGATION STRATEGIES OF METHANE EMISSIONS FROM ENTERIC FERMENTATION
The main target of mitigation strategies ison methanogens by decreasing theirsubstrate availability either directly orindirectly. The main strategies are focusedon changes in dietary composition, and/orby supplementation of diet with chemicalinhibitors, lipids or plant compounds.
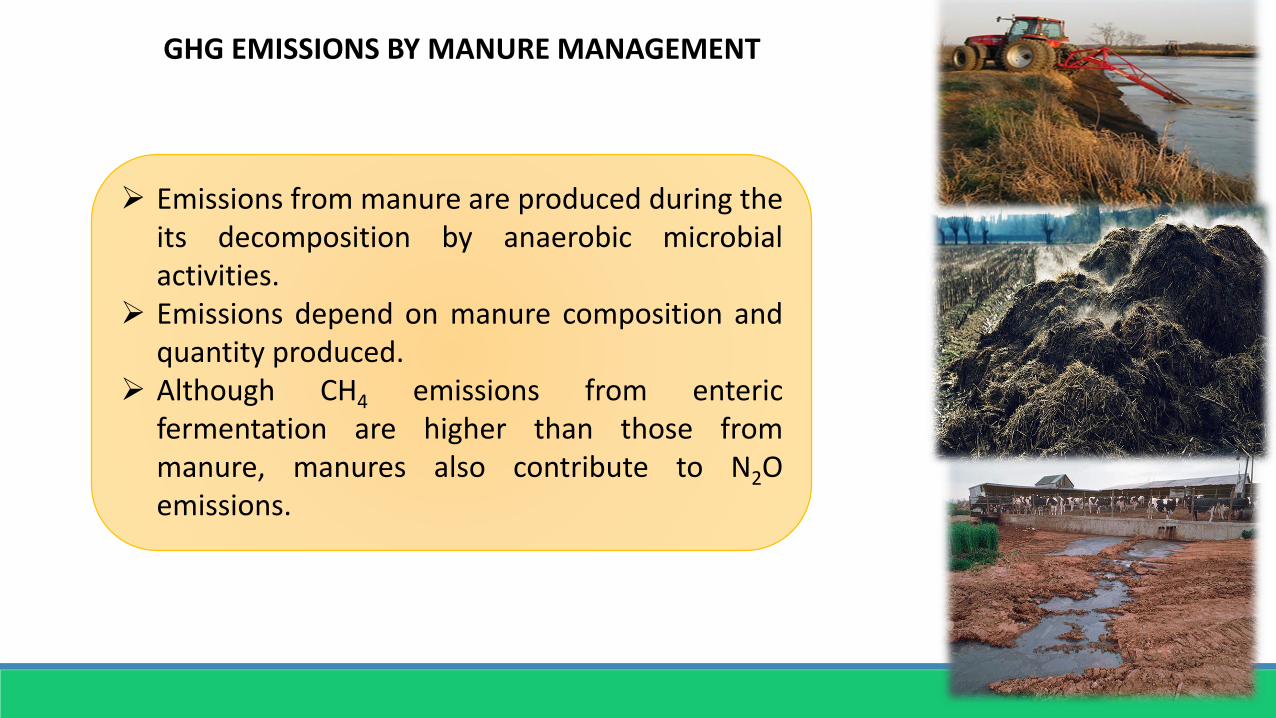
Emissions from manure are produced during theits decomposition by anaerobic microbialactivities.
Emissions depend on manure composition andquantity produced.
Although CH4 emissions from entericfermentation are higher than those frommanure, manures also contribute to N2Oemissions.
GHG EMISSIONS BY MANURE MANAGEMENT
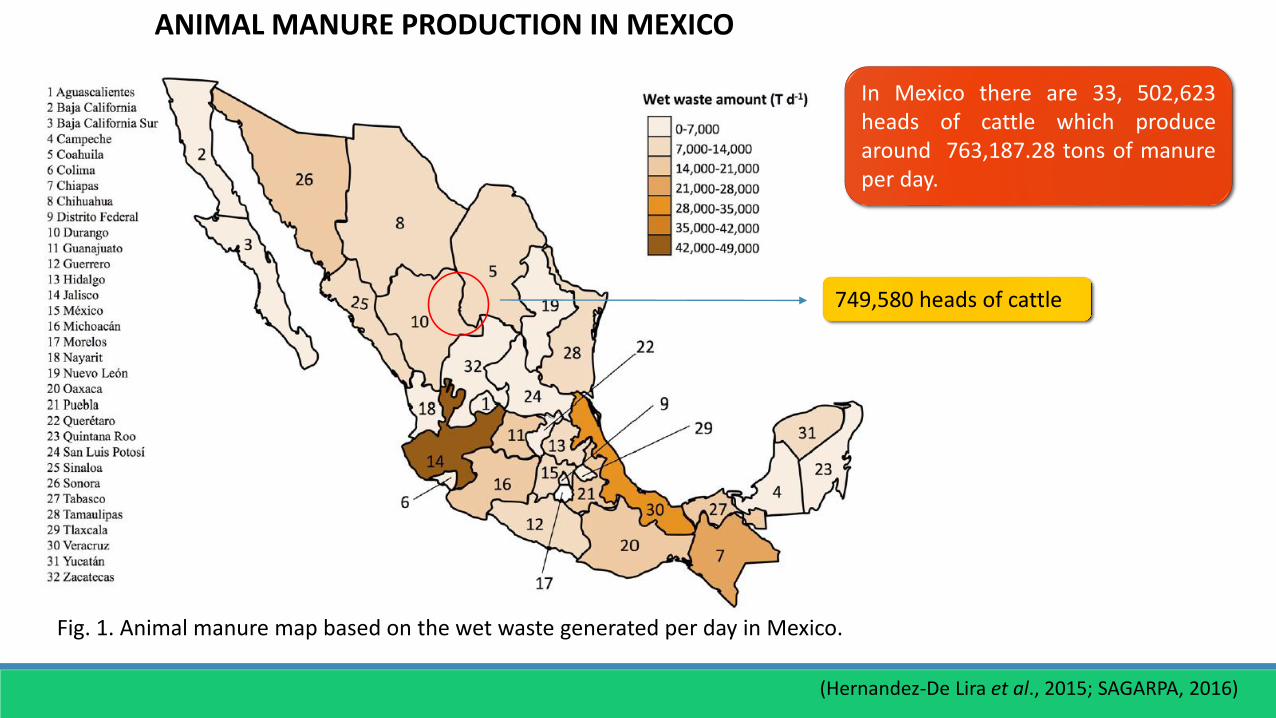
In Mexico there are 33, 502,623heads of cattle which producearound 763,187.28 tons of manureper day.
749,580 heads of cattle
ANIMAL MANURE PRODUCTION IN MEXICO
Fig. 1. Animal manure map based on the wet waste generated per day in Mexico.
(Hernandez-De Lira et al., 2015; SAGARPA, 2016)

STRATEGIES TO REDUCE METHANE EMISSIONS FROM MANURE
Nutritional management
Fertilizer
-Composting
-Bioslurry
Treatment options
BiodigestersReduction ofwastes andbioenergyproduction
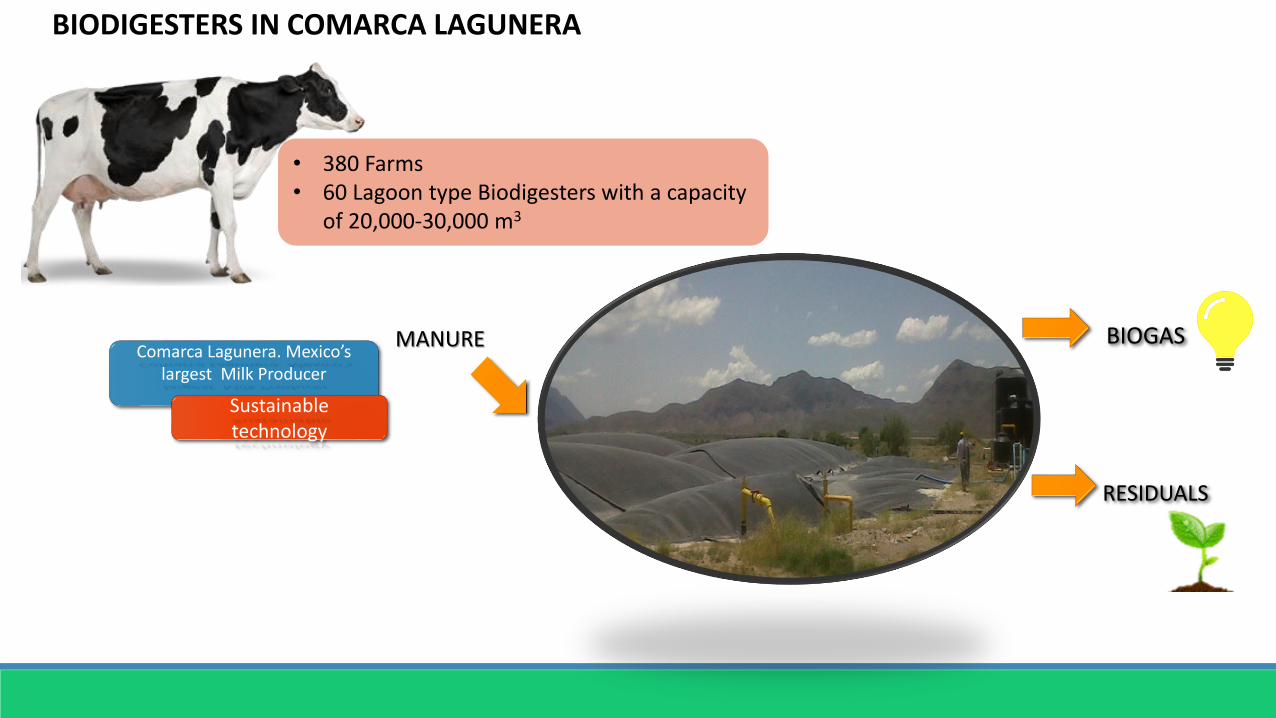
Comarca Lagunera. Mexico’slargest Milk Producer
Sustainabletechnology
MANURE
RESIDUALS
BIOGAS
BIODIGESTERS IN COMARCA LAGUNERA
• 380 Farms• 60 Lagoon type Biodigesters with a capacity
of 20,000-30,000 m3

REAL TIME MONITORING OF BIODIGESTERS
Although anaerobic digestion is a well-known and consolidated technology, the key players of methaneproduction and their associations and functioning are not completely understood yet. Thus, it is critical tomonitor the community structure and variability to better understand the biochemical reactions involved inanaerobic digestion and to optimize operational conditions. In our lab we employ three main strategies tomonitor biodigesters:
Metagenomic analysis
Biochemical approach
Gene expression
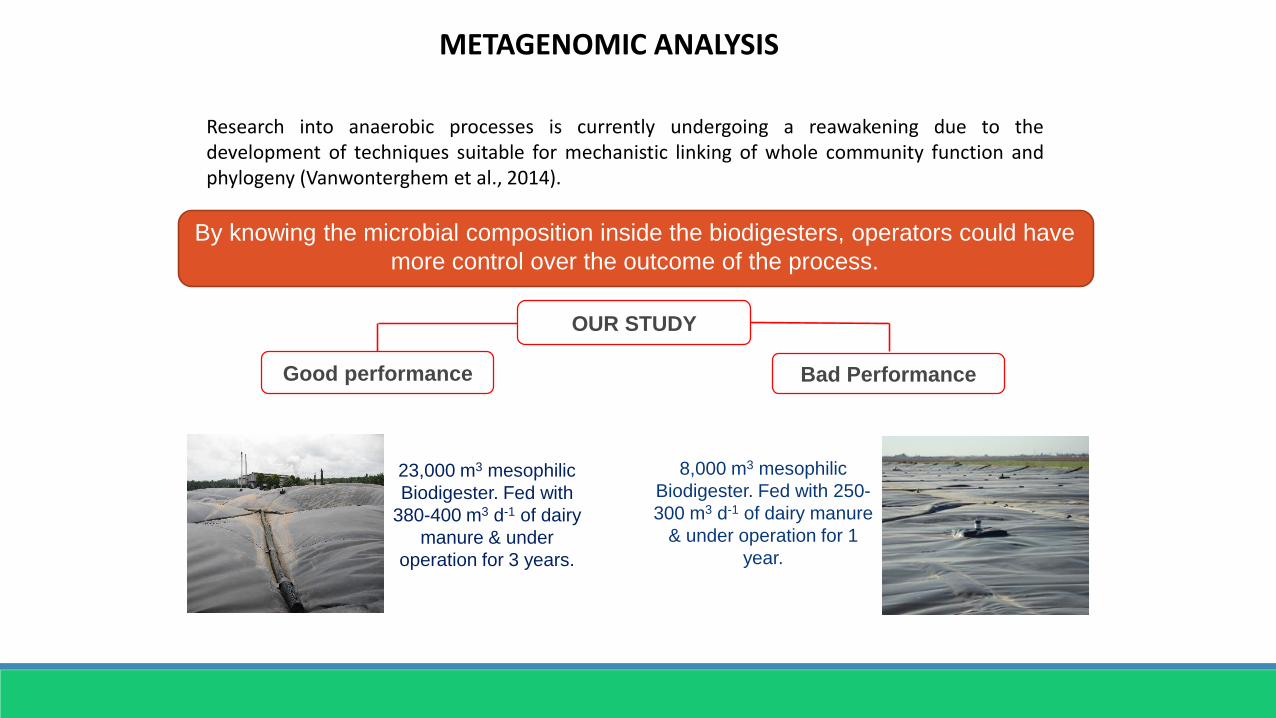
Research into anaerobic processes is currently undergoing a reawakening due to thedevelopment of techniques suitable for mechanistic linking of whole community function andphylogeny (Vanwonterghem et al., 2014).
By knowing the microbial composition inside the biodigesters, operators could have
more control over the outcome of the process.
23,000 m3 mesophilic
Biodigester. Fed with
380-400 m3 d-1 of dairy
manure & under
operation for 3 years.
Good performance
8,000 m3 mesophilic
Biodigester. Fed with 250-
300 m3 d-1 of dairy manure
& under operation for 1
year.
Bad Performance
OUR STUDY
METAGENOMIC ANALYSIS

Bad Performance Biodigester
Good Performance Biodigester
Biodigesters Performance during 12 months
METAGENOMIC ANALYSIS
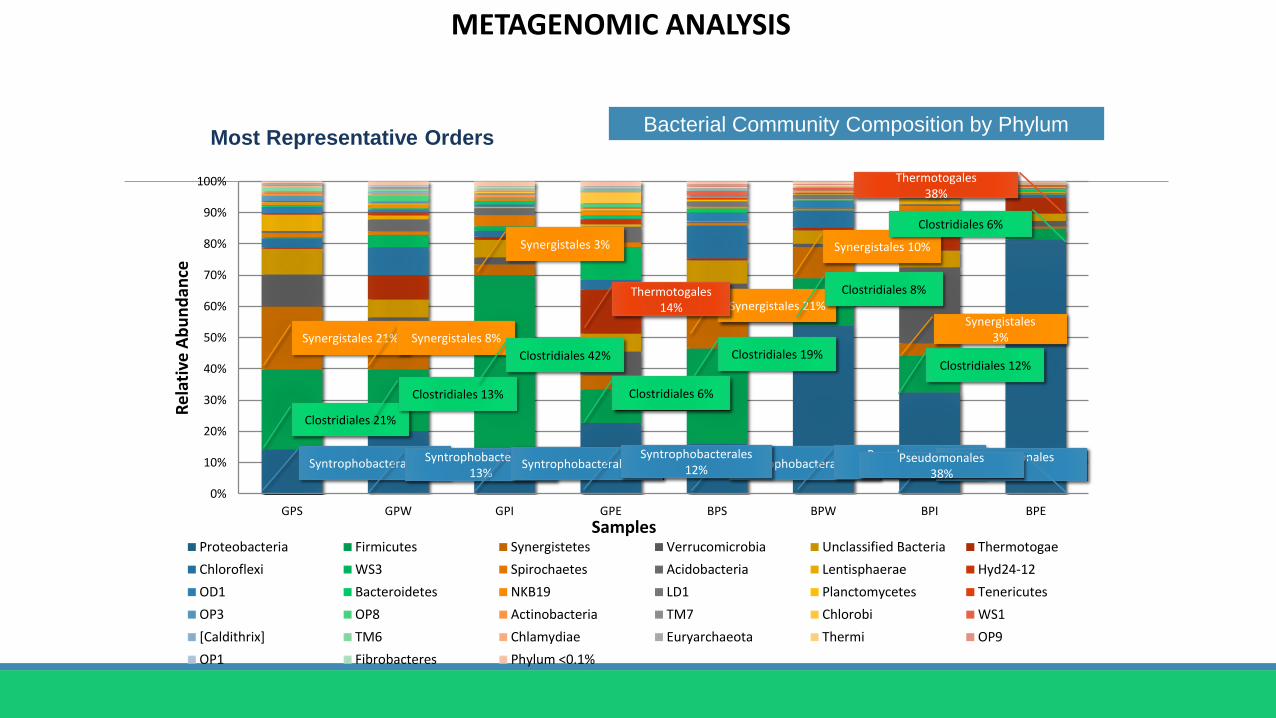
0%
10%
20%
30%
40%
50%
60%
70%
80%
90%
100%
GPS GPW GPI GPE BPS BPW BPI BPE
Re
lati
ve A
bu
nd
ance
SamplesProteobacteria Firmicutes Synergistetes Verrucomicrobia Unclassified Bacteria Thermotogae
Chloroflexi WS3 Spirochaetes Acidobacteria Lentisphaerae Hyd24-12
OD1 Bacteroidetes NKB19 LD1 Planctomycetes Tenericutes
OP3 OP8 Actinobacteria TM7 Chlorobi WS1
[Caldithrix] TM6 Chlamydiae Euryarchaeota Thermi OP9
OP1 Fibrobacteres Phylum <0.1%
Syntrophobacterales 8%
Clostridiales 21%
Synergistales 21%
Syntrophobacterales 6%
Clostridiales 19%
Synergistales 21%
Syntrophobacterales13%
Clostridiales 13%
Synergistales 8%
Pseudomonales13%
Clostridiales 8%
Synergistales 10%
Syntrophobacterales 2%
Clostridiales 42%
Synergistales 3%
Pseudomonales17%
Clostridiales 12%
Synergistales3%
Syntrophobacterales12%
Clostridiales 6%
Thermotogales14%
Thermotogales38%
Clostridiales 6%
Pseudomonales38%
Bacterial Community Composition by PhylumMost Representative Orders
METAGENOMIC ANALYSIS

0%
10%
20%
30%
40%
50%
60%
70%
80%
90%
100%
GPS GPW GPI GPE BPS BPW BPI BPE
Re
lati
ve A
bu
nd
ance
Samples
Methanogens Community Composition by Order
Unclassified Unclassified Euryarchaeota MethanobacterialesUnclassified Methanomicrobia Methanomicrobiales Methanosarcinales
0%
10%
20%
30%
40%
50%
60%
70%
80%
90%
100%
GPS GPW GPI GPE BPS BPW BPI BPE
Re
lati
veA
bu
nd
ance
Samples
Archaeal Community Composition by Phylum
Unclassified Crenarchaeota Euryarchaeota
METAGENOMIC ANALYSIS
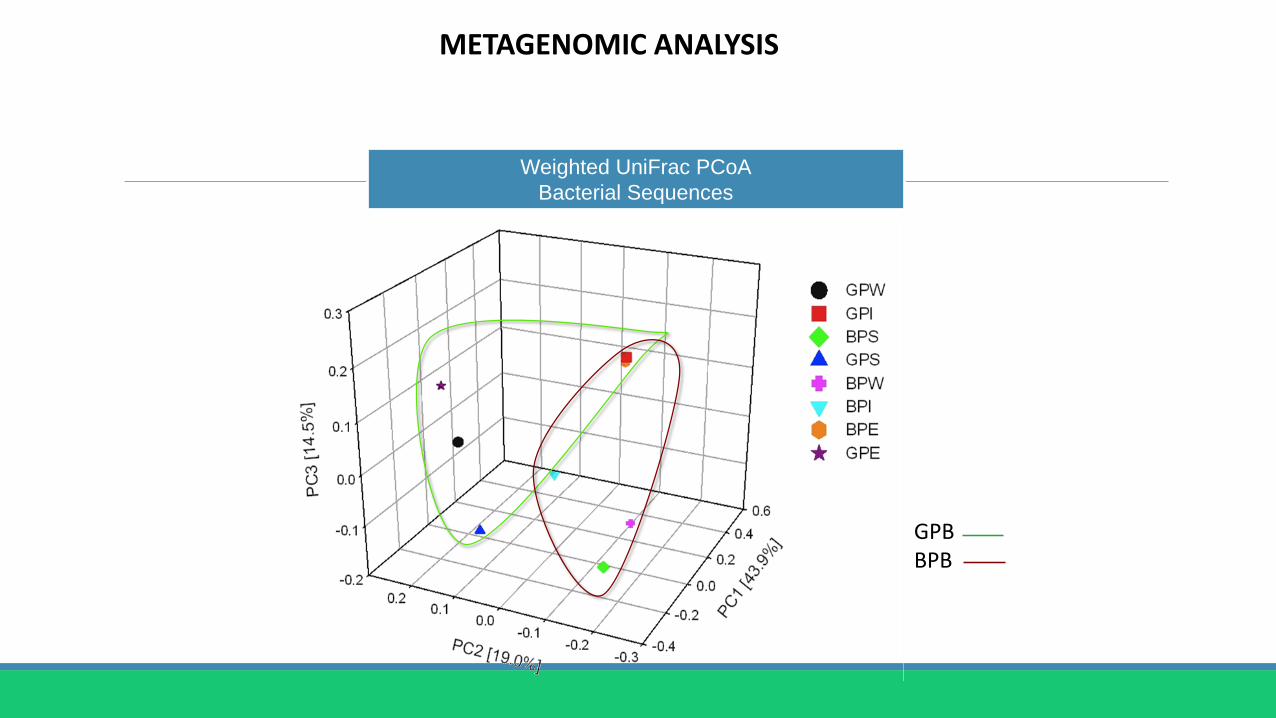
Weighted UniFrac PCoA
Bacterial Sequences
GPBBPB
METAGENOMIC ANALYSIS

Weighted UniFrac PCoAArchaea Sequences
GPBBPB
METAGENOMIC ANALYSIS

SPATIAL VARIATIONS OF BACTERIAL COMMUNITIES IN A BIODIGESTER FED WITH CATTLE MANURE
Scheme of the lagoon type biodigester. Cross-sectional view showing the sites sampled.
Influent (1), beginning (2), middle (3), final (4) and effluent (5).
23,000 m3 mesophilic
Biodigester. Fed with
380-400 m3 d-1 of
dairy manure & under
operation for 3 years.
Analysis of bacterial communities in the different sites of abiodigester fed with cattle manure in order to determine anddecipher the microbial interactions and their role in theprocess of anaerobic digestion
o Our study
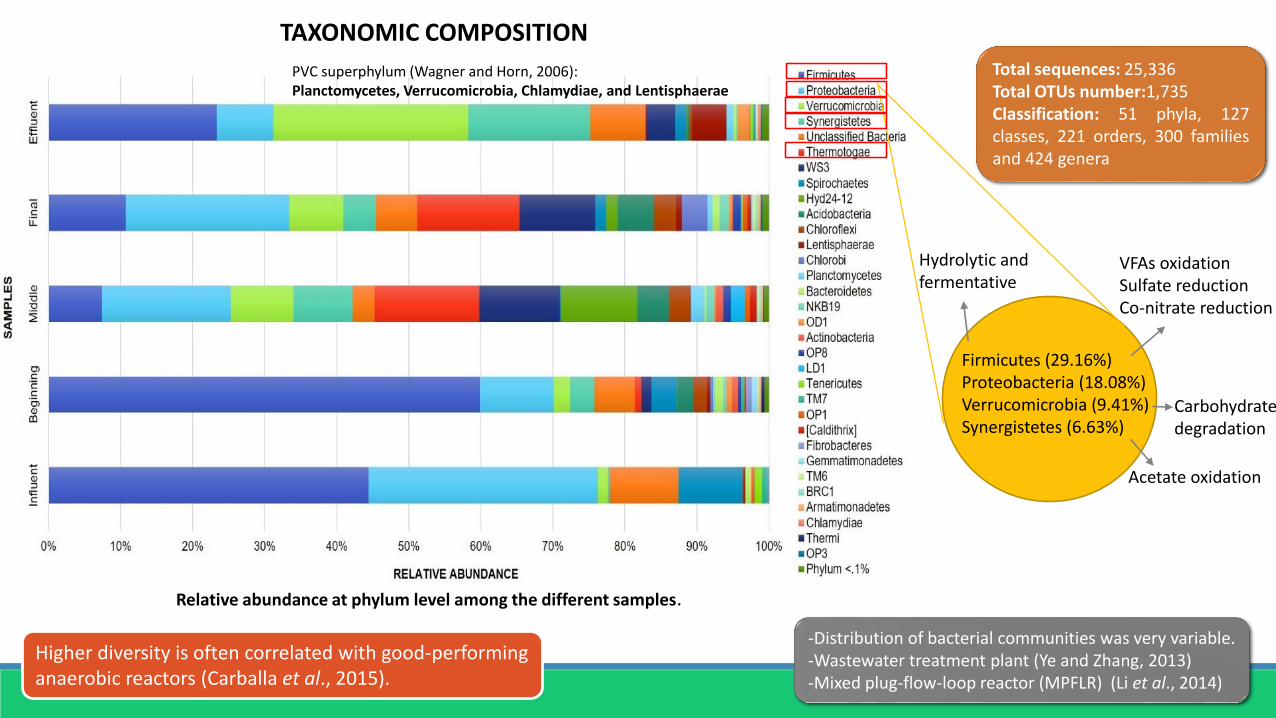
Relative abundance at phylum level among the different samples.
TAXONOMIC COMPOSITION
Total sequences: 25,336Total OTUs number:1,735Classification: 51 phyla, 127classes, 221 orders, 300 familiesand 424 genera
Hydrolytic and fermentative
VFAs oxidationSulfate reductionCo-nitrate reduction
Acetate oxidation
Carbohydrate degradation
-Distribution of bacterial communities was very variable.-Wastewater treatment plant (Ye and Zhang, 2013) -Mixed plug-flow-loop reactor (MPFLR) (Li et al., 2014)
Firmicutes (29.16%)Proteobacteria (18.08%)Verrucomicrobia (9.41%)Synergistetes (6.63%)
Higher diversity is often correlated with good-performing anaerobic reactors (Carballa et al., 2015).
PVC superphylum (Wagner and Horn, 2006):Planctomycetes, Verrucomicrobia, Chlamydiae, and Lentisphaerae
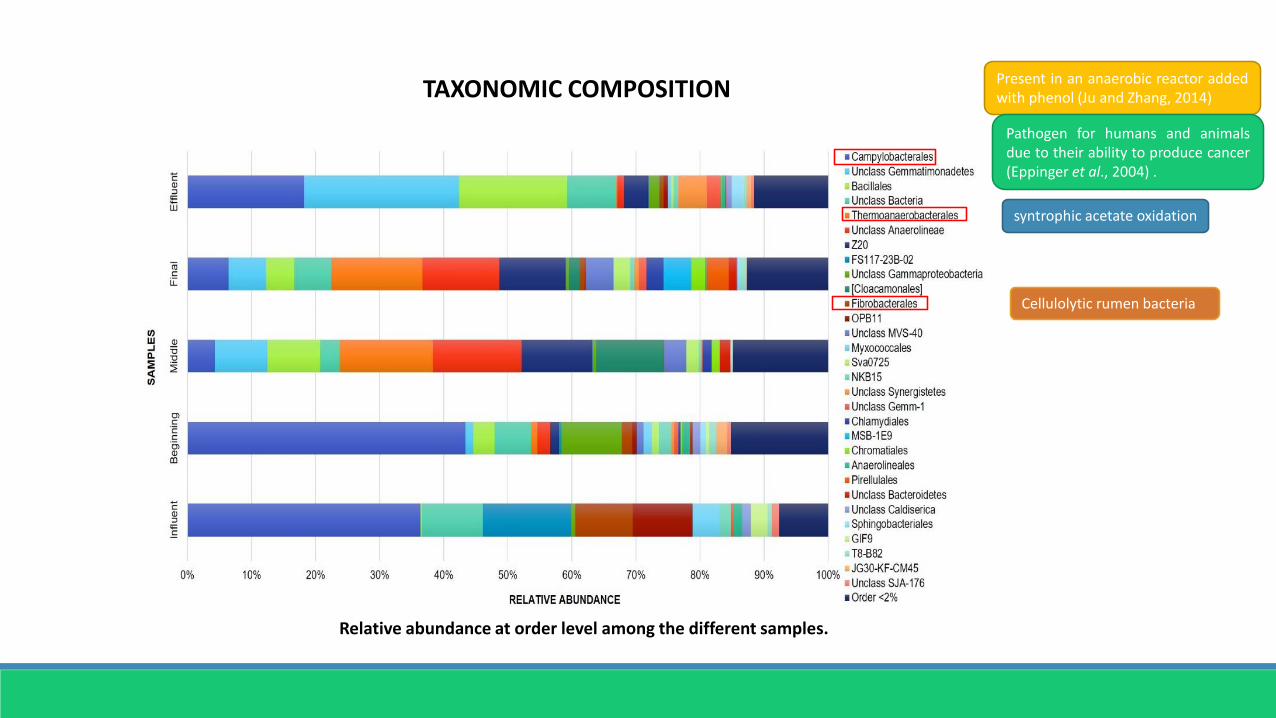
Relative abundance at order level among the different samples.
TAXONOMIC COMPOSITION Present in an anaerobic reactor addedwith phenol (Ju and Zhang, 2014)
Pathogen for humans and animalsdue to their ability to produce cancer(Eppinger et al., 2004) .
syntrophic acetate oxidation
Cellulolytic rumen bacteria

VENN ANALYSIS
Venn diagram representing the distribution of shared OTUs among the different points of
the biodigester. The numbers in the diagram represent the unique and shared OTUs.
InfluentBeginningMiddleFinalEffluent
PeptostreptococcaceaeClostridiaceaeChristensenellaceaeCampylobacteraceae
ProteobacteriaPlanctomycetesChloroflex
OD1(Parcubacteria)
The richness observed in this study can beconsidered high in comparison with a study of 21full-scale biodigesters fed with agriculturalwastes and animal manures in which the OTUsranged from 193 to 434 (Sundberg et al., 2013).
-Total biodigester richness: 1735 OTUs-364 to 656 OTUs per sample
Major quantity of unique OTUs
Major number of OTUs shared

BETA DIVERSITY
Weighted UniFrac PCoA Unweighted UniFrac PCoA
Principal Coordinate Analyses (PCoA) plot based on
weighted UniFrac distance between the different points
of the biodigester. The percentage variation explained
with first two principal components (P1, P2).
Principal Coordinate Analyses (PCoA) plot based on unweighted
UniFrac distance between the different points of the
biodigester. The percentage variation explained with first two
principal components (P1, P2).
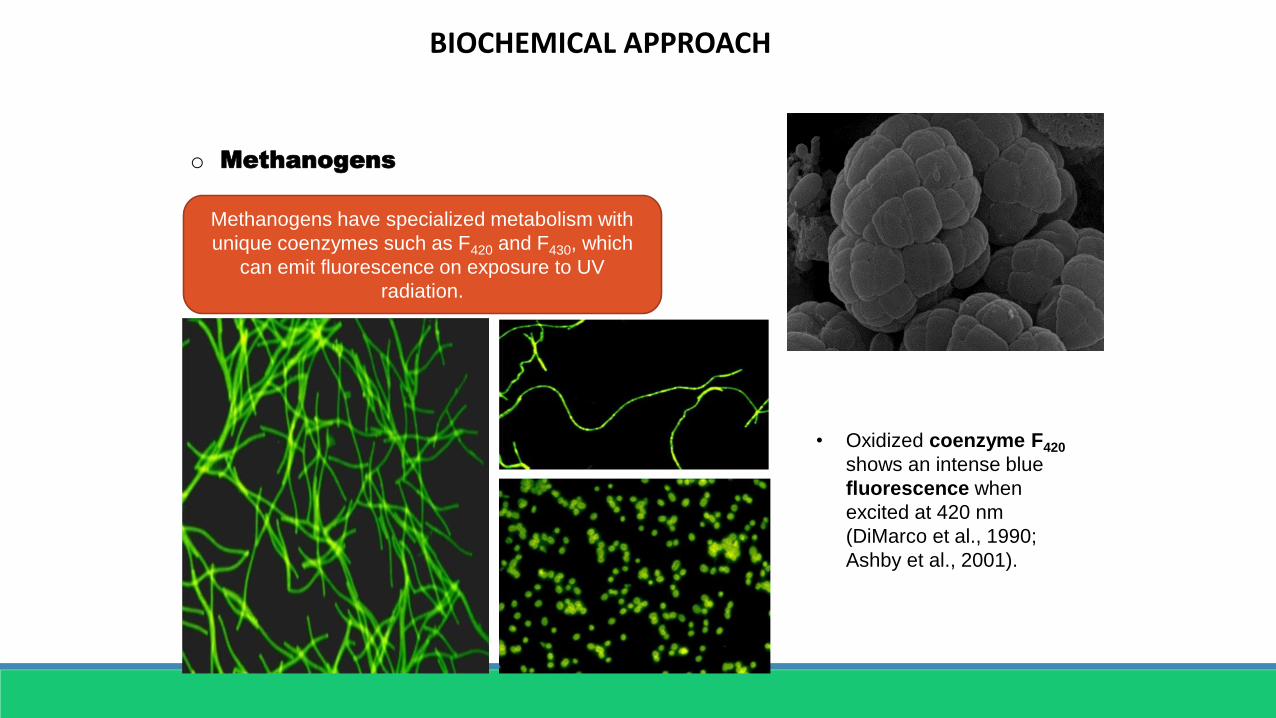
• Oxidized coenzyme F420
shows an intense blue
fluorescence when
excited at 420 nm
(DiMarco et al., 1990;
Ashby et al., 2001).
Methanogens have specialized metabolism with
unique coenzymes such as F420 and F430, which
can emit fluorescence on exposure to UV
radiation.
o Methanogens
BIOCHEMICAL APPROACH

o Methanogens
Obligate anaerobic archaea dependent on
fermentative bacteria.
Chemoheterotrophic:
Aceticlastic
Acetate to CO2 and methane
Chemoautotrophic:
H2 or formate as energy & electron
source
CO2 to methane and other cellular
components
Selective characteristics of representative genera of methanogens
Genus Morphology %G+C Wall composition Gram
reaction
Motility Methanogenic
substrates used
Order Methanobacteriales
Methanobacterium Long rods or
filaments
32-61 Pseudomurein + to
variable
- H2+CO2, formate
Methanothermus Straight to
slightly curved
rods
33 Pseudomurein
with an outer
protein S-layer
+ + H2+CO2
Order Methanococcales
Methanococcus Irregular cocci 29-34 Protein - - H2+CO2, formate
Order Methanomicrobiales
Methanomicrobium Short curved
rods
45-49 Protein - + H2+CO2, formate
Methanogenium Irregular cocci 52-61 Protein or
glycoprotein
- - H2+CO2, formate
Methanospirillum Curved rods or
spirilla
45-50 Protein - + H2+CO2, formate
Methanosarcina Irregular cocci,
packets
36-43 Heteropolysacch
aride or protein
+ to
variable
- H2+CO2, methanol,
methylamines, acetate
BIOCHEMICAL APPROACH

Variables Levels
Strain ID AB11a1 AB11a2
Substrate Acetate Formate Methano
l
Concentration (mM) 50 100 150 200 250
Temperature (ºC) 30 37 45 55
pH 5 6 7 8
Variables Levels
Strain ID AB11a1 AB11a2
Substrate Acetate Formate Methanol
Concentration (mM) 100 200
Temperature (ºC) 30 37
pH 7
o Our study
Is there any relation to the fluorescence intensity
of methanogens to their culture conditions, growth
phases and methane formation?
BIOCHEMICAL APPROACH

Specific Fluorescence
intensity (FIU/
microgram of cellular
of protein) of AB11a1
at different acetate
concentrations and at
different temperatures
FIU/ microgram of cellular protein
Temperature (°C)
0 5 10 15 20 25 30 35
Substr
ate
concentr
ation (
mM
)
0
50
100
150
200
0
10
20
30
40
50
60
70
o Our study
BIOCHEMICAL APPROACH
Temperature (°C)
0 5 10 15 20 25 30 35
0
20
40
60
80 S
pe
cific
Me
tha
no
ge
nic
Activity
4000
4000
4000
6000
6000
2000
2000
2000
2000
0
0
0
0
0
0
0
0
Su
bstr
ate
co
nce
ntr
atio
n (
mM
)
0
50
100
150
200
CH
4*u
g-1
SM
AF
CH
4 (
ppm
)/ F
IU
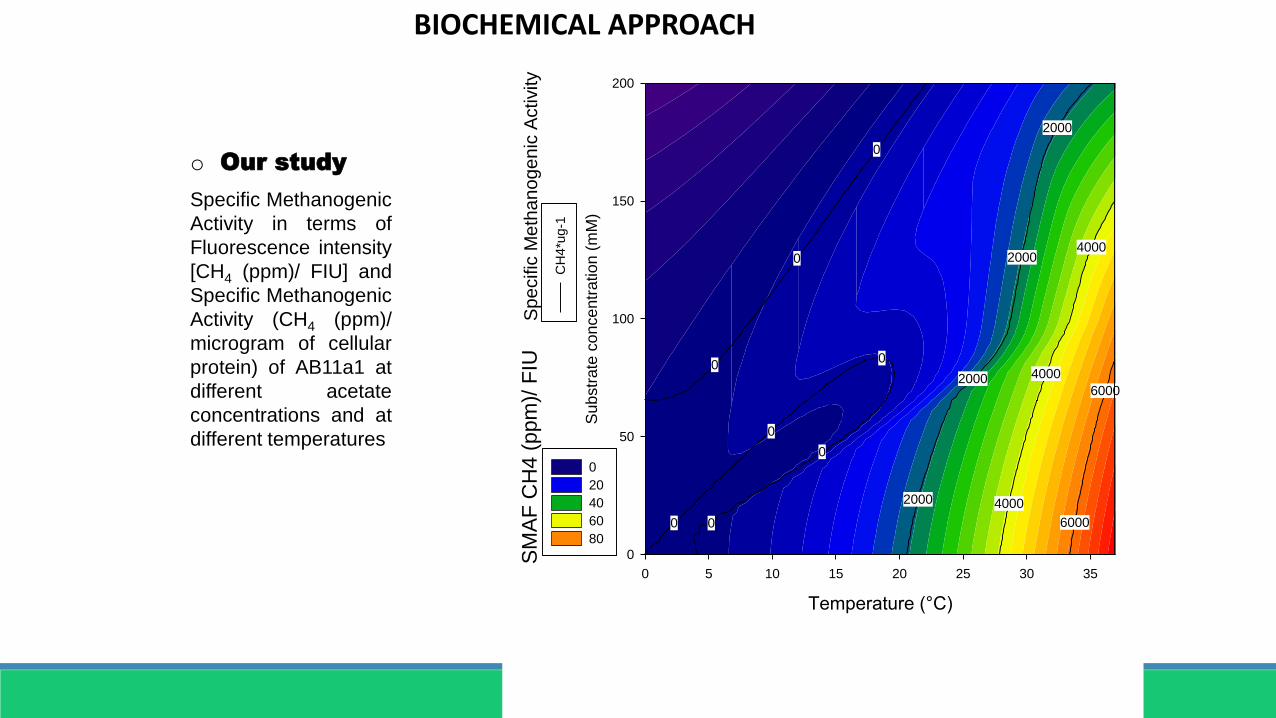
Specific Methanogenic
Activity in terms of
Fluorescence intensity
[CH4 (ppm)/ FIU] and
Specific Methanogenic
Activity (CH4 (ppm)/
microgram of cellular
protein) of AB11a1 at
different acetate
concentrations and at
different temperatures
o Our study
BIOCHEMICAL APPROACH

o Our study
Treatments
Principal Component
Analysis
(PCA) with PS1 (46.7 %) Y
PS2 (20 %) for 4 samples.
Sampling dates [0-35] are
identified
30 °C/ 200 mM
30 °C/ 100 mM
37 °C/ 200 mM
37 °C/ 100 mM
BIOCHEMICAL APPROACH

mRNA has been used in the diagnosis of several
diseases (Rybaczyk et al., 2008)
Environmental monitoring technologies based on
differential gene expression.
Changes in the performance of the
biodigesters happens way before they are
observed.
If we'd be able to spot these changes,
preventive actions could be taken.
Waste water treatment systems
and biodigesters are highly
dynamic environments: 1000
OUT’s (Hess et al., 2011).
o Our studies
GENE EXPRESSION
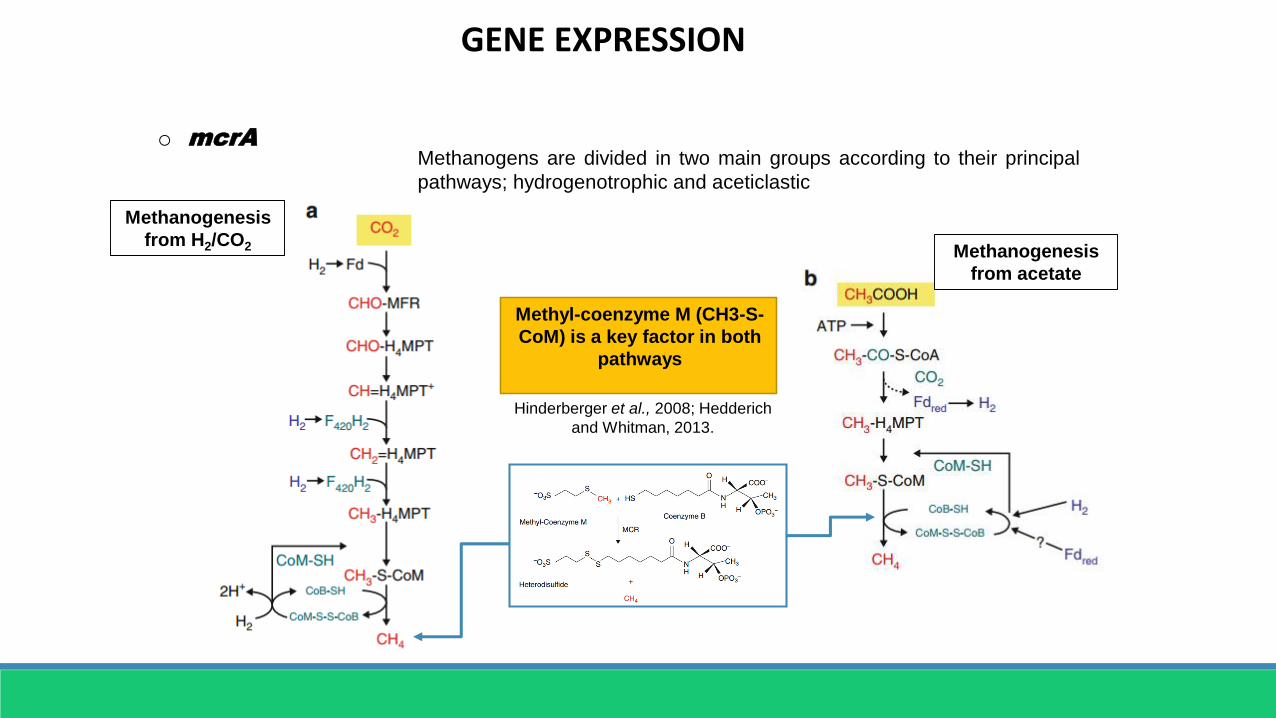
o mcrA
Methanogens are divided in two main groups according to their principal
pathways; hydrogenotrophic and aceticlastic
Methanogenesis
from acetate
Methyl-coenzyme M (CH3-S-
CoM) is a key factor in both
pathways
Hinderberger et al., 2008; Hedderich
and Whitman, 2013.
Methanogenesis
from H2/CO2
GENE EXPRESSION
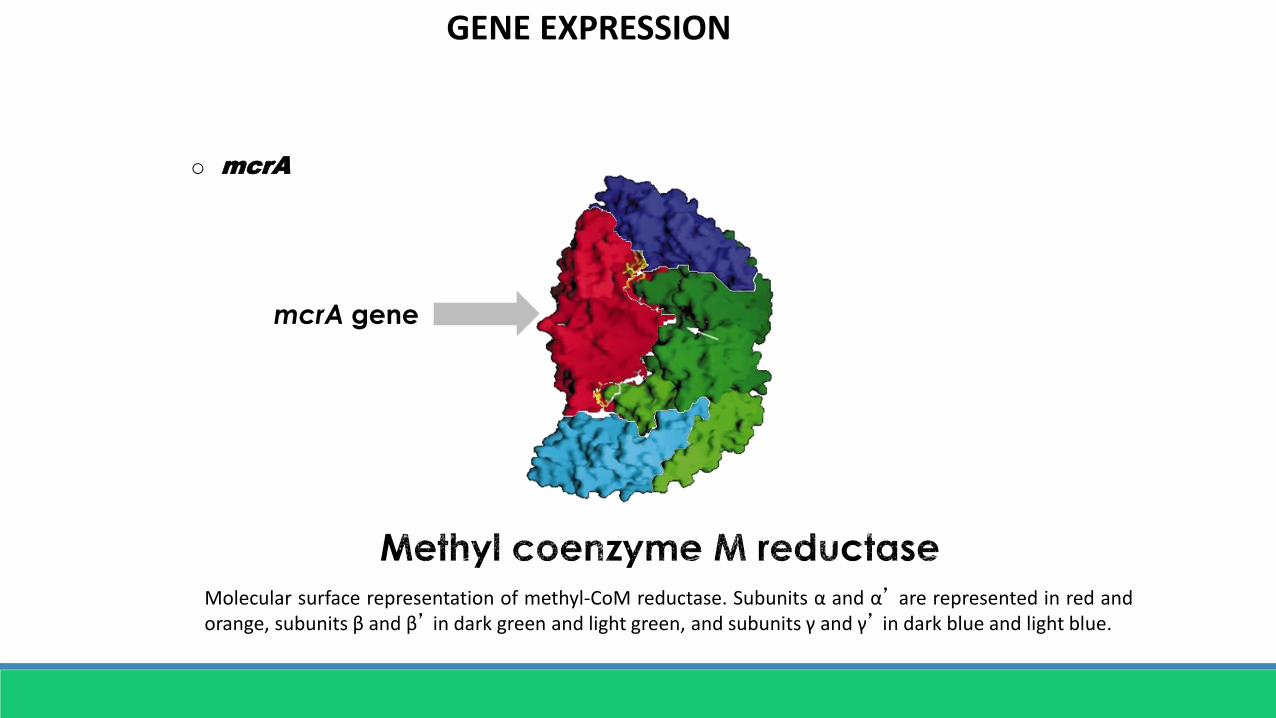
mcrA gene
Molecular surface representation of methyl-CoM reductase. Subunits α and α’ are represented in red andorange, subunits β and β’ in dark green and light green, and subunits γ and γ’ in dark blue and light blue.
o mcrA
GENE EXPRESSION

Extracción de ARN
Síntesis de cDNA
qPCR
- Protocolo de fenol ácido
- RevertAid H Minus First Strand cDNA Synthesis KitThermo Scientific
- Maxima SYBR Green/ROX qPCR Master Mix (2X) Thermo Scientific
Primers
Name Target Sequences(5’-3’) Reference
ARC787FArchaea
ATTAGATACCCSBGTAGTCC
(Yuetal.,2005)
ARC1059R GCCATGCACCWCCTCT
MBT857FMethanobacteriales
CGWAGGGAAGCTGTTAAGTMBT1196R TACCGTCGTCCACTCCTTMSL812F
MethanosarcinalesGTAAACGATRYTCGCTAGGT
MSL1159R GGTCCCCACAGWGTACCqmcrA
mcrAgene
TTCGGTGGATCDCARAGRGC (Denmanetal.,2007)
mcrA-rev CGTTCATBGCGTAGTTVGGRTAGT(SteinbergandRegan,
2008)
-PCR-Tratamiento con DNAsa
LightCycler 480 Real Time PCR System SW 1.5
(Palacio-Molina et al., 2013)
METHODOLOGY

0
20
40
60
80
100
120
Ex
pre
són
mc
rA(%
)
Transcrito MBT
Transcrito MSL
0
20
40
60
80
100
120
Po
bla
cio
ne
s (%
)
MBT
MSL
MBT transcripts MSL transcriptsMBT MSL
mcrA
exp
ressio
n (
%)
Po
pu
latio
n (
%)
GENE EXPRESSION
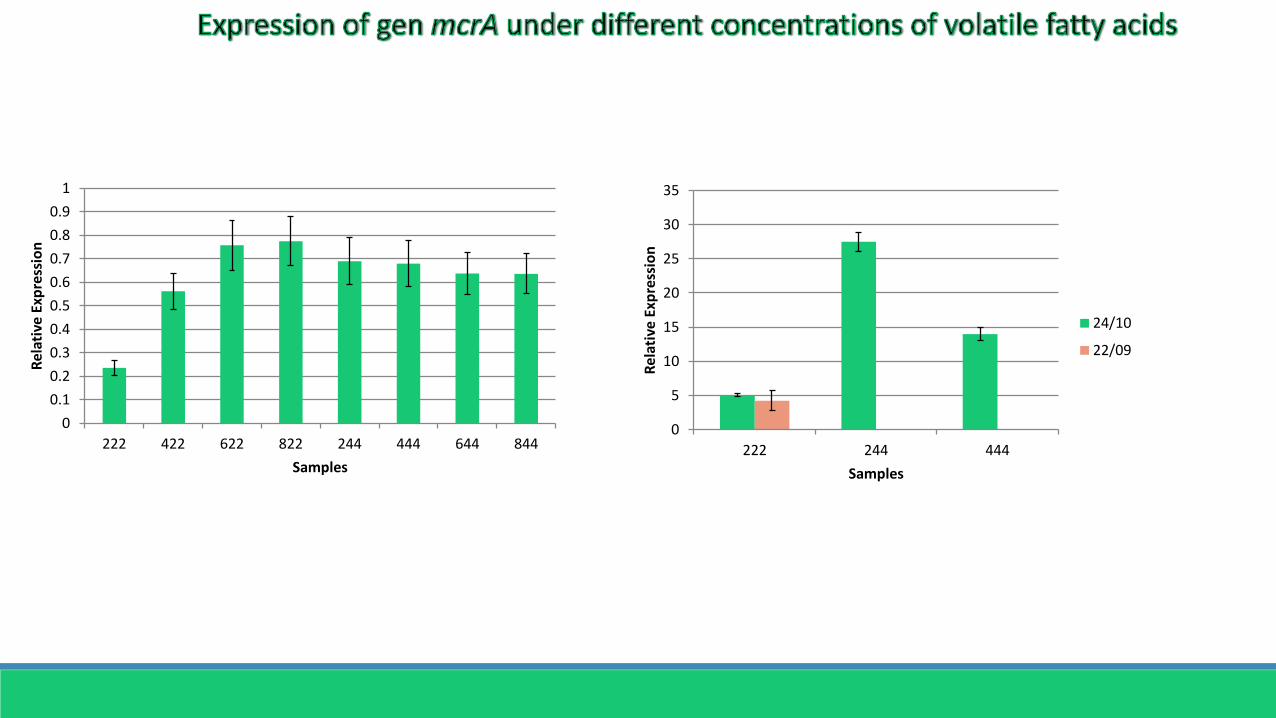
0
0.1
0.2
0.3
0.4
0.5
0.6
0.7
0.8
0.9
1
222 422 622 822 244 444 644 844
Rel
ativ
eEx
pre
ssio
n
Samples
0
5
10
15
20
25
30
35
222 244 444
Rel
ativ
eEx
pre
ssio
n
Samples
24/10
22/09

Relationship between methanogenic activity and
transcript in samples of anaerobic reactor fed with
dairy cow manure
Sample1. Carcamo2. Influent3. EffluentNúmero de muestra
0 1 2 3 4 5 6 7
Tra
nscrito
0
1
2
3
4
Activid
ad M
eta
nogénic
a (
ppm
)
0
1e+5
2e+5
3e+5
4e+5
5e+5
6e+5
7e+5
AM
/t
0.0
2.0e+5
4.0e+5
6.0e+5
8.0e+5
1.0e+6
1.2e+6
1.4e+6
Methanogenic activity – transcript ratio
Methanogenic activity (ppm)
Transcript
Número de muestra
0 1 2 3 4 5 6 7
Tra
nscrito
0
1
2
3
4
Activid
ad M
eta
nogénic
a (
ppm
)
0
1e+5
2e+5
3e+5
4e+5
5e+5
6e+5
7e+5
AM
/t
0.0
2.0e+5
4.0e+5
6.0e+5
8.0e+5
1.0e+6
1.2e+6
1.4e+6
Methanogenic activity – transcript ratio
Methanogenic activity (ppm)
Transcript
Número de muestra
0.5 1.0 1.5 2.0 2.5 3.0 3.5
Tra
nscrito
0.00
0.05
0.10
0.15
0.20
0.25
0.30
0.35
Activid
ad M
eta
no
gé
nic
a (
pp
m)
0
1e+5
2e+5
3e+5
4e+5
5e+5
6e+5
7e+5
AM
/t
0.0
2.0e+6
4.0e+6
6.0e+6
8.0e+6
1.0e+7
1.2e+7
Tra
nscri
pt
Sample
Me
tha
no
ge
nic
activ
ity(p
pm
)
Me
tha
no
ge
nic
activ
ity-tra
nscrip
tra
tio
Número de muestra
0.8 1.0 1.2 1.4 1.6 1.8 2.0 2.2
Tra
nscrito
0.0
0.1
0.2
0.3
0.4
0.5
0.6
0.7
Activid
ad M
eta
nogénic
a (
ppm
)
0.0
5.0e+4
1.0e+5
1.5e+5
2.0e+5
2.5e+5
3.0e+5
3.5e+5
AM
/t
0
1e+5
2e+5
3e+5
4e+5
5e+5
6e+5
Tra
nscri
pt
Sample
Me
tha
no
ge
nic
activ
ity(p
pm
)
Me
tha
no
ge
nic
activ
ity-tra
nscrip
tra
tio
Sample1.- UASB reactor fed with animal manures2.- UASB reactor fed with brewery wastewaters
Relationship between methanogenic
activity and transcript in samples of
UASB reactors.
Methanogenic activity - Transcript
GENE EXPRESSION
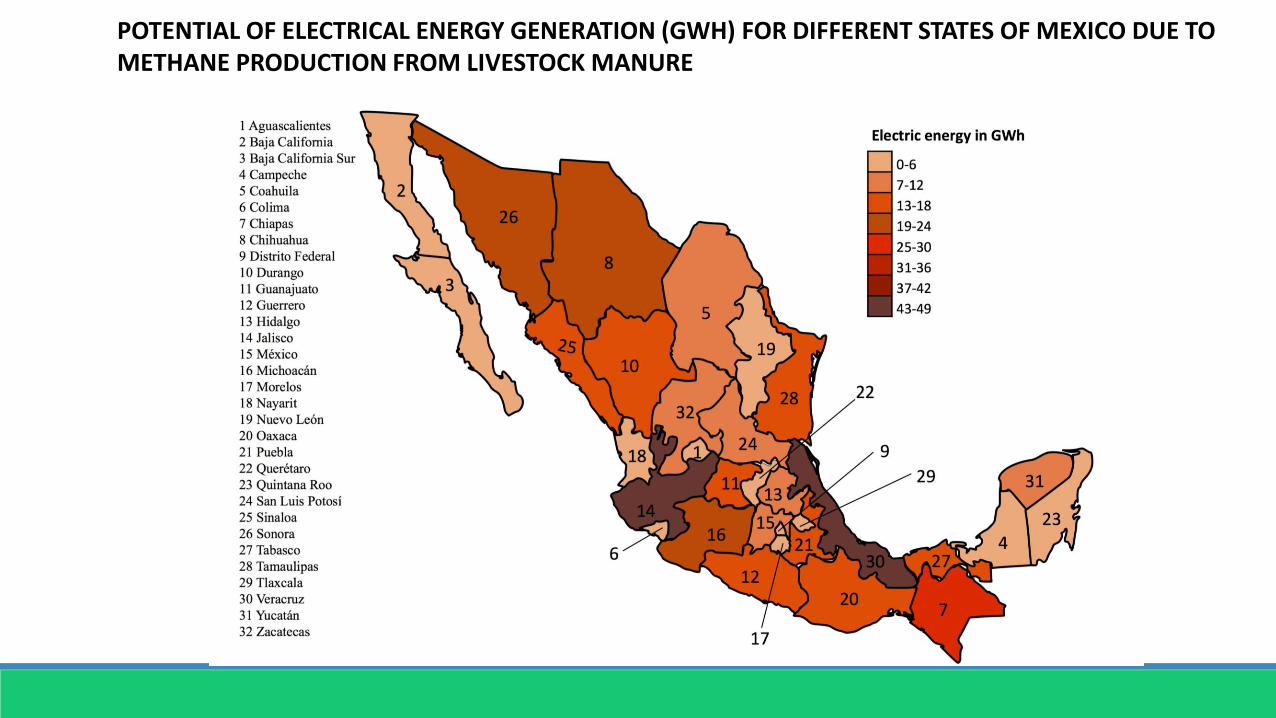
POTENTIAL OF ELECTRICAL ENERGY GENERATION (GWH) FOR DIFFERENT STATES OF MEXICO DUE TO METHANE PRODUCTION FROM LIVESTOCK MANURE

CONCLUSIONS
Microbial communities play a key role in GHG emissions since their metabolicfunctions and interactions drive methane production. Thus, strategiesfocused on alter microbial groups can help to minimize methane emissionsfrom livestock.
These communities can be used to reduce emissions from manures andincrease carbon recovery in the form of methane to produce bioenergy.
Nevertheless, the complexity of these groups are affected by several factorsand is necessary to develop integrated approach consisting of engineering,biochemistry, microbiology, molecular biology principles to guarantee theoptimum production of bioenergy and reduce GHG emissions.
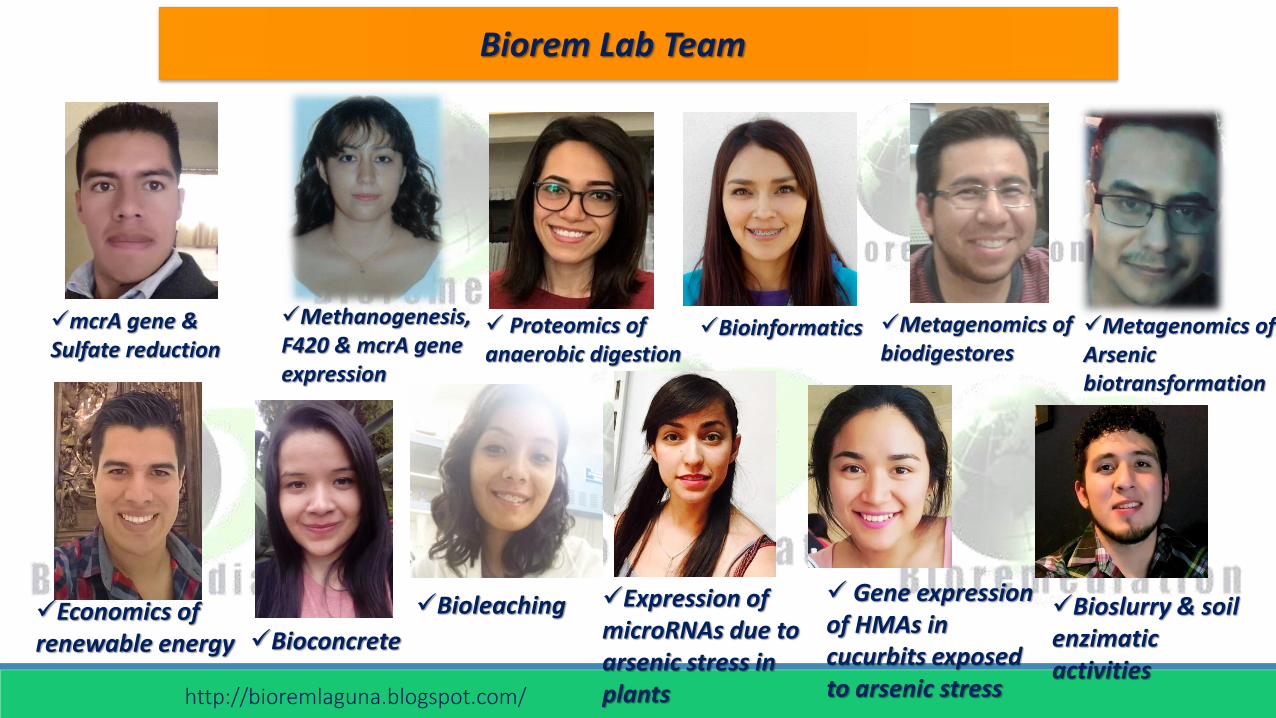
Bioinformatics
http://bioremlaguna.blogspot.com/
Proteomics of anaerobic digestion
Metagenomics of Arsenic biotransformation
Methanogenesis, F420 & mcrA gene expression
Biorem Lab Team
Bioconcrete
Bioleaching Gene expressionof HMAs in cucurbits exposedto arsenic stress
Expression of microRNAs due to arsenic stress in plants
Bioslurry & soil enzimatic activities
Metagenomics of biodigestores
mcrA gene & Sulfate reduction
Economics of renewable energy


![KM 224e-20161110135405 · 2016. 11. 10. · Chlorine (as C12) (ppm) Haloacetic Acids (HAA5) (ppb) TTHMs [Total Trihalomethanes] (ppb) MCLG MCL, Range or T T, or Your Sample MRDLG](https://img.pdfslide.net/doc/110x75/5fc23c3dac69ee2fa44f67e1/km-224e-20161110135405-2016-11-10-chlorine-as-c12-ppm-haloacetic-acids.jpg)