Embed Size (px)
Citation preview
Mitochondrial Respiration - An Important TherapeuticTarget in MelanomaMichelle Barbi de Moura1, Garret Vincent2, Shelley L. Fayewicz2, Nicholas W. Bateman1, Brian L. Hood3,
Mai Sun4, Joseph Suhan5, Stefan Duensing6, Yan Yin2, Cindy Sander2, John M. Kirkwood2,
Dorothea Becker7, Thomas P. Conrads3, Bennett Van Houten1, Stergios J. Moschos2*¤
1 Department of Pharmacology and Chemical Biology, University of Pittsburgh, Pittsburgh, Pennsylvania, United States of America, 2 Department of Medicine, University
of Pittsburgh, Pittsburgh, Pennsylvania, United States of America, 3 Gynecologic Cancer Center of Excellence, Women’s Health Integrated Research Center at Inova Health
System, Annandale, Virginia, United States of America, 4 Department of Biostatistics, University of Pittsburgh, Pittsburgh, Pennsylvania, United States of America,
5 Department of Biological Sciences, Carnegie Mellon University, Pittsburgh, Pennsylvania, United States of America, 6 Sektion Molekulare Uroonkologie, Urologische
Universitatsklinik Heidelberg, Heidelberg, Germany, 7 Department of Pathology, University of Pittsburgh, Pittsburgh, Pennsylvania, United States of America
Abstract
The importance of mitochondria as oxygen sensors as well as producers of ATP and reactive oxygen species (ROS) hasrecently become a focal point of cancer research. However, in the case of melanoma, little information is available to whatextent cellular bioenergetics processes contribute to the progression of the disease and related to it, whether oxidativephosphorylation (OXPHOS) has a prominent role in advanced melanoma. In this study we demonstrate that compared tomelanocytes, metastatic melanoma cells have elevated levels of OXPHOS. Furthermore, treating metastatic melanoma cellswith the drug, Elesclomol, which induces cancer cell apoptosis through oxidative stress, we document by way of stableisotope labeling with amino acids in cell culture (SILAC) that proteins participating in OXPHOS are downregulated. We alsoprovide evidence that melanoma cells with high levels of glycolysis are more resistant to Elesclomol. We further show thatElesclomol upregulates hypoxia inducible factor 1-a (HIF-1a), and that prolonged exposure of melanoma cells to this drugleads to selection of melanoma cells with high levels of glycolysis. Taken together, our findings suggest that moleculartargeting of OXPHOS may have efficacy for advanced melanoma.
Citation: Barbi de Moura M, Vincent G, Fayewicz SL, Bateman NW, Hood BL, et al. (2012) Mitochondrial Respiration - An Important Therapeutic Target inMelanoma. PLoS ONE 7(8): e40690. doi:10.1371/journal.pone.0040690
Editor: Janine Santos, University of Medicine and Dentistry of New Jersey, United States of America
Received February 29, 2012; Accepted June 11, 2012; Published August 17, 2012
Copyright: � 2012 Barbi de Moura et al. This is an open-access article distributed under the terms of the Creative Commons Attribution License, which permitsunrestricted use, distribution, and reproduction in any medium, provided the original author and source are credited.
Funding: This work was supported by a Career Development Award of a SPORE in Skin Cancer (P50CA121973) to SJM, and a Pennsylvania Department of HealthPA CURE award to BVH. The funders had no role in study design, data collection and analysis, decision to publish, or preparation of the manuscript.
Competing Interests: The authors have declared that no competing interests exist.
* E-mail: [email protected]
¤ Current address: Department of Medicine, University of North Carolina at Chapel Hill, Chapel Hill, North Carolina, United States of America
Introduction
Despite the recent US Food and Drug Administration (FDA)
approval of novel therapies for advanced melanoma, the prognosis
for locally advanced and stage IV melanoma remains poor
because of emerging resistance to molecular therapies, and the
relatively low number of patients with metastatic melanoma who
benefit from immunotherapies [1,2]. Thus, it is essential to further
identify signaling pathways and cellular processes that are
pertinent regulators of melanoma progression and advanced
melanoma. We herein present novel and important data, which
show that cellular bioenergetics and, in particular, mitochondrial
functions play an important role in this disease.
Involvement of pro- and anti-apoptotic mitochondria-associated
proteins in melanoma cell survival has previously been described
[3–5]. However, to date, little is known regarding the role of
mitochondrial functions, such as redox regulation and OXPHOS,
in melanoma progression and survival. A previous study, which
investigated redox regulation in melanoma progression focused on
the physicochemical properties of melanin as an anti-oxidant or a
pro-oxidant [6]. These mitochondrial functions are linked because
oxygen levels affect the dependence of cells on OXPHOS for
energy production and the production of reactive oxygen species
(ROS). The other important question that has not yet been
systematically addressed is whether melanoma cells rely more on
OXPHOS or glycolysis [7,8].
The drug Elesclomol has been shown to alter redox balance in
cells, and to act as a strong inducer of oxidative stress [9]. In
preclinical models it was found to enhance the cytotoxic effects of
the chemotherapeutic agent, paclitaxel [10]. Furthermore, signif-
icant progression-free survival (PFS) benefit for metastatic
melanoma was observed in a small randomized phase II trial of
Elesclomol combined with paclitaxel versus paclitaxel alone [11].
A large randomized phase III study of Elesclomol plus paclitaxel
versus paclitaxel alone was further conducted in patients with
metastatic melanoma [12]. In this study, preplanned subgroup
analysis of patients with normal lactate dehydrogenase (LDH)
versus patients with high serum LDH levels, a known adverse
prognostic factor for patients with metastatic melanoma [13],
suggested that the combination of Elesclomol and paclitaxel
compared with paclitaxel alone significantly prolonged median
PFS only in patients with metastatic melanoma and normal serum
LDH. These data may be an indication that oxidative stress-
PLOS ONE | www.plosone.org 1 August 2012 | Volume 7 | Issue 8 | e40690
associated cellular processes are affected in patients with normal
levels of serum LDH.
Using Elesclomol as a tool to study oxidative stress-associated
cellular processes in cells representing advanced melanoma, we
demonstrate that the drug alters the abundance of proteins
involved in OXPHOS. Furthermore, our analyses focusing upon
bioenergetics revealed that Elesclomol inhibits OXPHOS without
a major effect on glycolysis, and that melanoma cells have higher
OXPHOS activity compared with human epidermal melanocytes.
Results
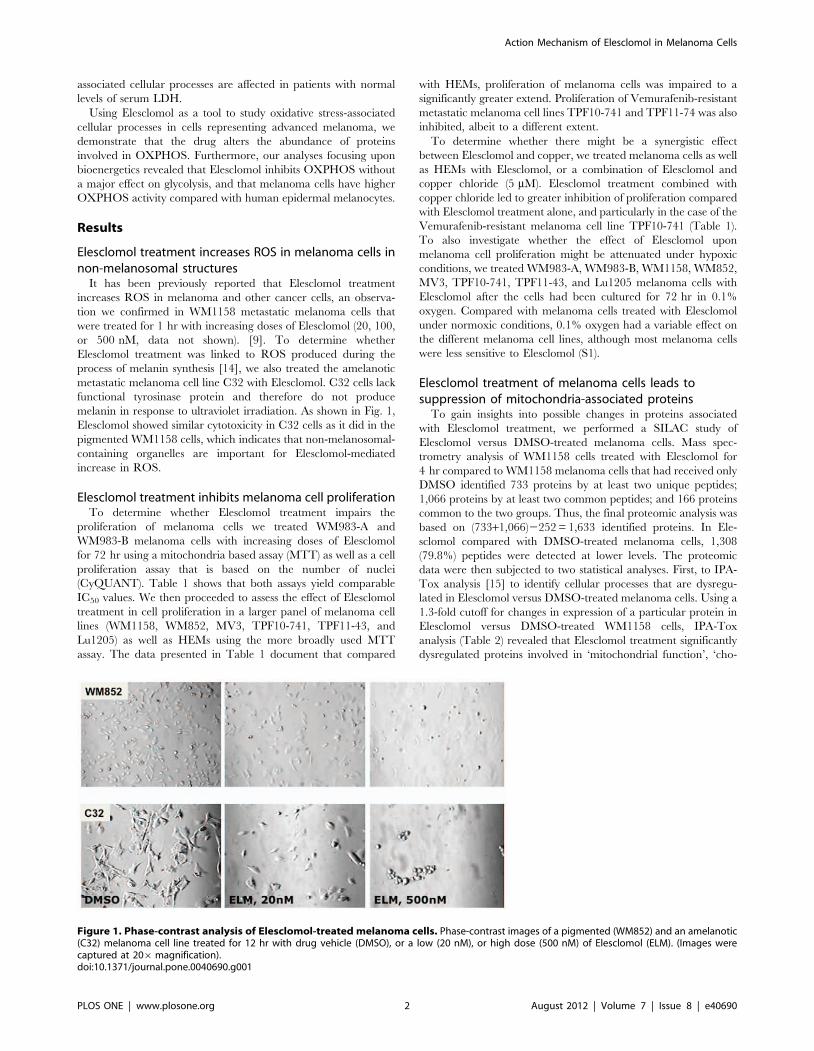
Elesclomol treatment increases ROS in melanoma cells innon-melanosomal structures
It has been previously reported that Elesclomol treatment
increases ROS in melanoma and other cancer cells, an observa-
tion we confirmed in WM1158 metastatic melanoma cells that
were treated for 1 hr with increasing doses of Elesclomol (20, 100,
or 500 nM, data not shown). [9]. To determine whether
Elesclomol treatment was linked to ROS produced during the
process of melanin synthesis [14], we also treated the amelanotic
metastatic melanoma cell line C32 with Elesclomol. C32 cells lack
functional tyrosinase protein and therefore do not produce
melanin in response to ultraviolet irradiation. As shown in Fig. 1,
Elesclomol showed similar cytotoxicity in C32 cells as it did in the
pigmented WM1158 cells, which indicates that non-melanosomal-
containing organelles are important for Elesclomol-mediated
increase in ROS.
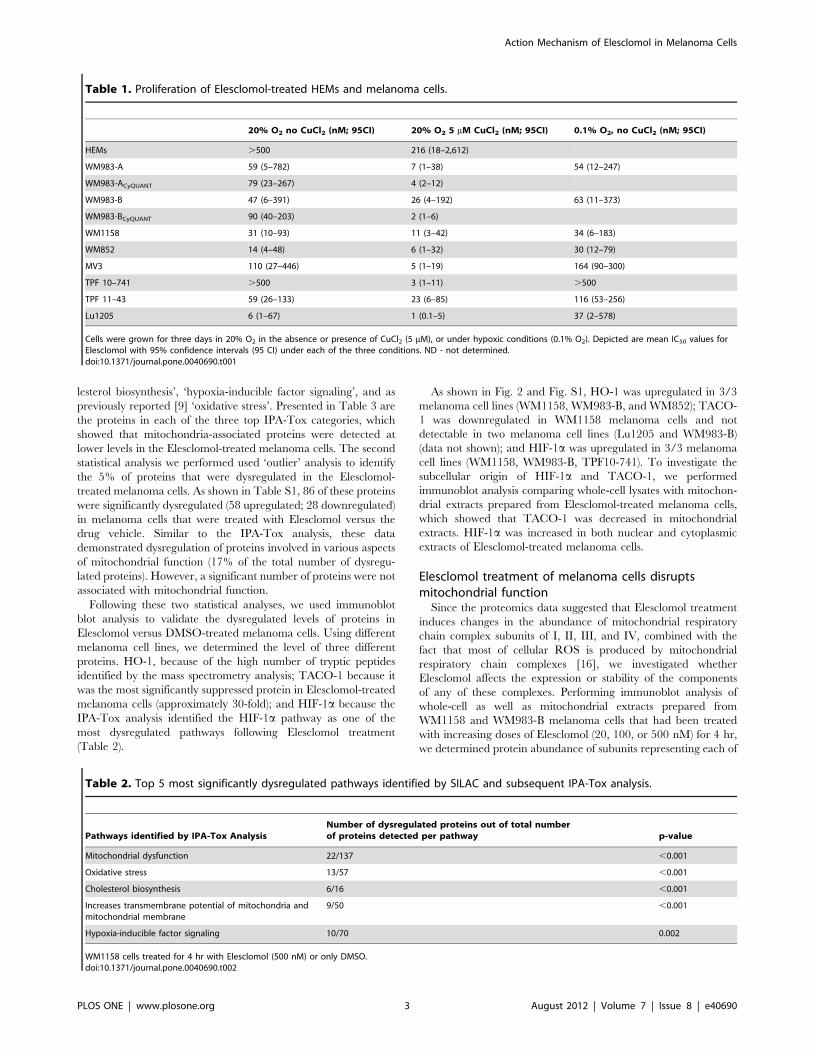
Elesclomol treatment inhibits melanoma cell proliferationTo determine whether Elesclomol treatment impairs the
proliferation of melanoma cells we treated WM983-A and
WM983-B melanoma cells with increasing doses of Elesclomol
for 72 hr using a mitochondria based assay (MTT) as well as a cell
proliferation assay that is based on the number of nuclei
(CyQUANT). Table 1 shows that both assays yield comparable
IC50 values. We then proceeded to assess the effect of Elesclomol
treatment in cell proliferation in a larger panel of melanoma cell
lines (WM1158, WM852, MV3, TPF10-741, TPF11-43, and
Lu1205) as well as HEMs using the more broadly used MTT
assay. The data presented in Table 1 document that compared
with HEMs, proliferation of melanoma cells was impaired to a
significantly greater extend. Proliferation of Vemurafenib-resistant
metastatic melanoma cell lines TPF10-741 and TPF11-74 was also
inhibited, albeit to a different extent.
To determine whether there might be a synergistic effect
between Elesclomol and copper, we treated melanoma cells as well
as HEMs with Elesclomol, or a combination of Elesclomol and
copper chloride (5 mM). Elesclomol treatment combined with
copper chloride led to greater inhibition of proliferation compared
with Elesclomol treatment alone, and particularly in the case of the
Vemurafenib-resistant melanoma cell line TPF10-741 (Table 1).
To also investigate whether the effect of Elesclomol upon
melanoma cell proliferation might be attenuated under hypoxic
conditions, we treated WM983-A, WM983-B, WM1158, WM852,
MV3, TPF10-741, TPF11-43, and Lu1205 melanoma cells with
Elesclomol after the cells had been cultured for 72 hr in 0.1%
oxygen. Compared with melanoma cells treated with Elesclomol
under normoxic conditions, 0.1% oxygen had a variable effect on
the different melanoma cell lines, although most melanoma cells
were less sensitive to Elesclomol (S1).
Elesclomol treatment of melanoma cells leads tosuppression of mitochondria-associated proteins
To gain insights into possible changes in proteins associated
with Elesclomol treatment, we performed a SILAC study of
Elesclomol versus DMSO-treated melanoma cells. Mass spec-
trometry analysis of WM1158 cells treated with Elesclomol for
4 hr compared to WM1158 melanoma cells that had received only
DMSO identified 733 proteins by at least two unique peptides;
1,066 proteins by at least two common peptides; and 166 proteins
common to the two groups. Thus, the final proteomic analysis was
based on (733+1,066)2252 = 1,633 identified proteins. In Ele-
sclomol compared with DMSO-treated melanoma cells, 1,308
(79.8%) peptides were detected at lower levels. The proteomic
data were then subjected to two statistical analyses. First, to IPA-
Tox analysis [15] to identify cellular processes that are dysregu-
lated in Elesclomol versus DMSO-treated melanoma cells. Using a
1.3-fold cutoff for changes in expression of a particular protein in
Elesclomol versus DMSO-treated WM1158 cells, IPA-Tox
analysis (Table 2) revealed that Elesclomol treatment significantly
dysregulated proteins involved in ‘mitochondrial function’, ‘cho-
Figure 1. Phase-contrast analysis of Elesclomol-treated melanoma cells. Phase-contrast images of a pigmented (WM852) and an amelanotic(C32) melanoma cell line treated for 12 hr with drug vehicle (DMSO), or a low (20 nM), or high dose (500 nM) of Elesclomol (ELM). (Images werecaptured at 206magnification).doi:10.1371/journal.pone.0040690.g001
Action Mechanism of Elesclomol in Melanoma Cells
PLOS ONE | www.plosone.org 2 August 2012 | Volume 7 | Issue 8 | e40690
lesterol biosynthesis’, ‘hypoxia-inducible factor signaling’, and as
previously reported [9] ‘oxidative stress’. Presented in Table 3 are
the proteins in each of the three top IPA-Tox categories, which
showed that mitochondria-associated proteins were detected at
lower levels in the Elesclomol-treated melanoma cells. The second
statistical analysis we performed used ‘outlier’ analysis to identify
the 5% of proteins that were dysregulated in the Elesclomol-
treated melanoma cells. As shown in Table S1, 86 of these proteins
were significantly dysregulated (58 upregulated; 28 downregulated)
in melanoma cells that were treated with Elesclomol versus the
drug vehicle. Similar to the IPA-Tox analysis, these data
demonstrated dysregulation of proteins involved in various aspects
of mitochondrial function (17% of the total number of dysregu-
lated proteins). However, a significant number of proteins were not
associated with mitochondrial function.
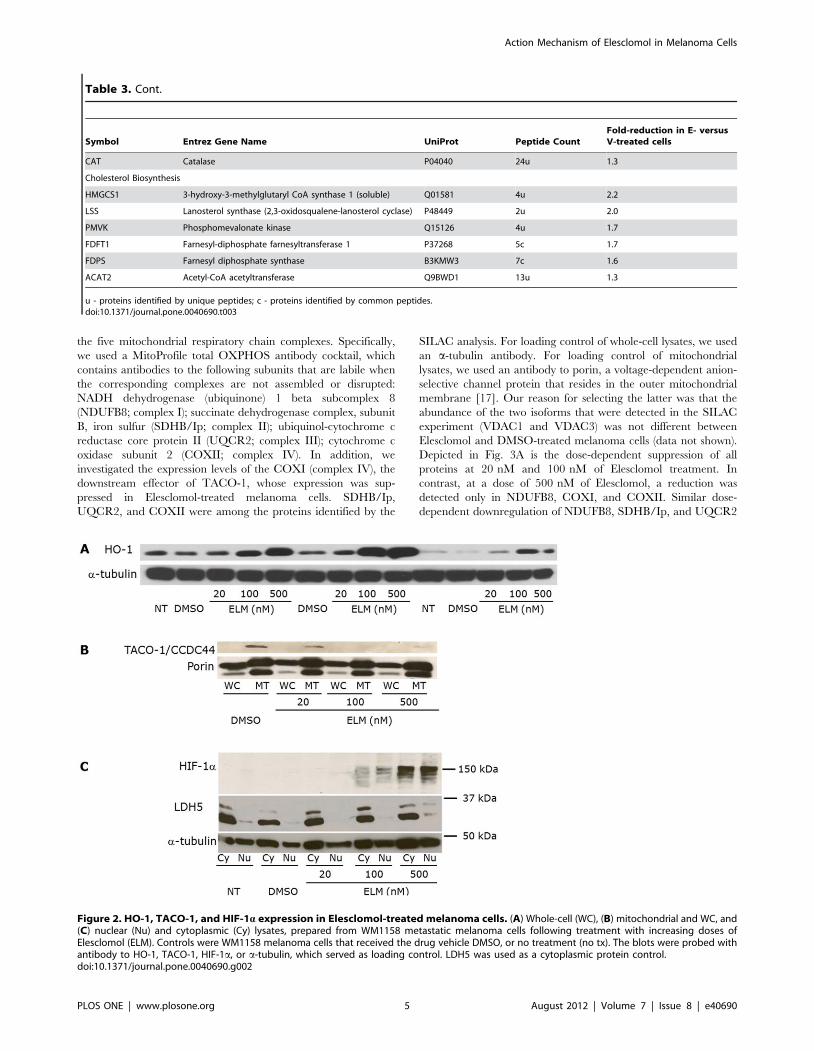
Following these two statistical analyses, we used immunoblot
blot analysis to validate the dysregulated levels of proteins in
Elesclomol versus DMSO-treated melanoma cells. Using different
melanoma cell lines, we determined the level of three different
proteins. HO-1, because of the high number of tryptic peptides
identified by the mass spectrometry analysis; TACO-1 because it
was the most significantly suppressed protein in Elesclomol-treated
melanoma cells (approximately 30-fold); and HIF-1a because the
IPA-Tox analysis identified the HIF-1a pathway as one of the
most dysregulated pathways following Elesclomol treatment
(Table 2).
As shown in Fig. 2 and Fig. S1, HO-1 was upregulated in 3/3
melanoma cell lines (WM1158, WM983-B, and WM852); TACO-
1 was downregulated in WM1158 melanoma cells and not
detectable in two melanoma cell lines (Lu1205 and WM983-B)
(data not shown); and HIF-1a was upregulated in 3/3 melanoma
cell lines (WM1158, WM983-B, TPF10-741). To investigate the
subcellular origin of HIF-1a and TACO-1, we performed
immunoblot analysis comparing whole-cell lysates with mitochon-
drial extracts prepared from Elesclomol-treated melanoma cells,
which showed that TACO-1 was decreased in mitochondrial
extracts. HIF-1a was increased in both nuclear and cytoplasmic
extracts of Elesclomol-treated melanoma cells.
Elesclomol treatment of melanoma cells disruptsmitochondrial function
Since the proteomics data suggested that Elesclomol treatment
induces changes in the abundance of mitochondrial respiratory
chain complex subunits of I, II, III, and IV, combined with the
fact that most of cellular ROS is produced by mitochondrial
respiratory chain complexes [16], we investigated whether
Elesclomol affects the expression or stability of the components
of any of these complexes. Performing immunoblot analysis of
whole-cell as well as mitochondrial extracts prepared from
WM1158 and WM983-B melanoma cells that had been treated
with increasing doses of Elesclomol (20, 100, or 500 nM) for 4 hr,
we determined protein abundance of subunits representing each of
Table 1. Proliferation of Elesclomol-treated HEMs and melanoma cells.
20% O2 no CuCl2 (nM; 95CI) 20% O2 5 mM CuCl2 (nM; 95CI) 0.1% O2, no CuCl2 (nM; 95CI)
HEMs .500 216 (18–2,612)
WM983-A 59 (5–782) 7 (1–38) 54 (12–247)
WM983-ACyQUANT 79 (23–267) 4 (2–12)
WM983-B 47 (6–391) 26 (4–192) 63 (11–373)
WM983-BCyQUANT 90 (40–203) 2 (1–6)
WM1158 31 (10–93) 11 (3–42) 34 (6–183)
WM852 14 (4–48) 6 (1–32) 30 (12–79)
MV3 110 (27–446) 5 (1–19) 164 (90–300)
TPF 10–741 .500 3 (1–11) .500
TPF 11–43 59 (26–133) 23 (6–85) 116 (53–256)
Lu1205 6 (1–67) 1 (0.1–5) 37 (2–578)
Cells were grown for three days in 20% O2 in the absence or presence of CuCl2 (5 mM), or under hypoxic conditions (0.1% O2). Depicted are mean IC50 values forElesclomol with 95% confidence intervals (95 CI) under each of the three conditions. ND - not determined.doi:10.1371/journal.pone.0040690.t001
Table 2. Top 5 most significantly dysregulated pathways identified by SILAC and subsequent IPA-Tox analysis.
Pathways identified by IPA-Tox AnalysisNumber of dysregulated proteins out of total numberof proteins detected per pathway p-value
Mitochondrial dysfunction 22/137 ,0.001
Oxidative stress 13/57 ,0.001
Cholesterol biosynthesis 6/16 ,0.001
Increases transmembrane potential of mitochondria andmitochondrial membrane
9/50 ,0.001
Hypoxia-inducible factor signaling 10/70 0.002
WM1158 cells treated for 4 hr with Elesclomol (500 nM) or only DMSO.doi:10.1371/journal.pone.0040690.t002
Action Mechanism of Elesclomol in Melanoma Cells
PLOS ONE | www.plosone.org 3 August 2012 | Volume 7 | Issue 8 | e40690
Table 3. Proteins from each of the Top 3 most significantly dysregulated pathways identified by SILAC and subsequent IPA-Toxanalysis of WM1158 cells treated with Elesclomol (E) or the drug vehicle DMSO (V).
Symbol Entrez Gene Name UniProt Peptide CountFold-reduction in E- versusV-treated cells
Mitochondrial Dysfunction
CPT1A Carnitine palmitoyltransferase 1A P50416-1 6c 2.6
NDUFA7 NADH dehydrogenase (ubiquinone) 1 alphasubcomplex 7, 14.5 kDa (cmplx I)
O95182 9u 2.1
NDUFA2 NADH dehydrogenase (ubiquinone) 1 alphasubcomplex 2, 8 kDa (cmplx I)
O43678 4u 2.0
NDUFA10 NADH dehydrogenase (ubiquinone) 1 alphasubcomplex 10, 42 kDa (cmplx I)
O95299 2u+8c 1.9
PRDX5 Peroxiredoxin 5 P30044-1 26c 1.8
SDHA Succinate dehydrogenase complex, subunit A,flavoprotein (cmplx II)
B3KYA5 5c 1.7
CYCS Cytochrome c, somatic P99999 4c 1.7
NDUFB11 NADH dehydrogenase (ubiquinone) 1 betasubcomplex 11, 17.3 kDa (cmplx I)
Q9NX14-1 4c 1.6
CASP3 Caspase 3, apoptosis-related cysteine peptidase P42574 10c 1.6
NDUFA4 NADH dehydrogenase (ubiquinone) 1 alphasubcomplex 4, 9 kDa (cmplx I)
O00483 13u 1.6
NDUFS8 NADH dehydrogenase (ubiquinone) Fe-S protein 8,23 kDa (cmplx I)
O00217 2c 1.6
SOD2 Superoxide dismutase 2, mitochondrial P04179 13c 1.5
NDUFB4 NADH dehydrogenase (ubiquinone) 1 betasubcomplex 4,15 kDa (cmplx I)
O95168 5c 1.5
FIS1 Fission-1 (mitochondrial outer membrane) homolog(S. cerevisiae) (cmplx I)
Q9Y3D6 9u 1.5
UQCRC2 Ubiquinol-cytochrome c reductase coreprotein II (cmplx III)
P22695 32u 1.4
SDHB Succinate dehydrogenase complex, subunit B, ironsulfur (cmplx II)
P21912 6u 1.4
NDUFB1 NADH dehydrogenase (ubiquinone) 1 betasubcomplex 1, 7 kDa (cmplx I)
A0AV68 4u 1.4
COX7A2L Cytochrome c oxidase, subunit VIIa, polypeptide2 like (cmplx IV)
O14548 4c 1.4
AIFM1 Apoptosis-inducing factor, mitochondrion-associated O95831-1 10c 1.4
CAT Catalase P04040 24u 1.3
NDUFS5 NADH dehydrogenase (ubiquinone) Fe-S protein 5,15 kDa (cmplx I)
O43920 6u 1.3
NDUFS7 NADH dehydrogenase (ubiquinone) Fe-S protein 7,20 kDa (cmplx I)
O75251 3c 1.3
Oxidative stress
SOD1 Superoxide dismutase 1, soluble P00441 5u 2.1
STAT3 Signal transducer and activator of transcription3 (acute-phase response factor)
P40763-1 4c 2.1
MAPK14 Mitogen-activated protein kinase 14 Q16539-1 2c 2.0
GSTM3 Glutathione S-transferase m3 (brain) P21266 3u+10c 1.8
PRDX5 Peroxiredoxin 5 P30044-1 26c 1.8
PRDX6 Peroxiredoxin 6 P30041 57u+29c 1.7
ME1 Malic enzyme 1, NADP(+)-dependent, cytosolic P48163 8u 1.6
GCLM Glutamate-cysteine ligase, modifier subunit P48507 2u 1.5
GSS Glutathione synthetase P48637 2u 1.5
SOD2 Superoxide dismutase 2, mitochondrial P04179 13c 1.5
NQO1 NAD(P)H dehydrogenase, quinone 1 P15559 2u+22c 1.4
GPX1 Glutathione peroxidase 1 P07203 2u 1.4
Action Mechanism of Elesclomol in Melanoma Cells
PLOS ONE | www.plosone.org 4 August 2012 | Volume 7 | Issue 8 | e40690
the five mitochondrial respiratory chain complexes. Specifically,
we used a MitoProfile total OXPHOS antibody cocktail, which
contains antibodies to the following subunits that are labile when
the corresponding complexes are not assembled or disrupted:
NADH dehydrogenase (ubiquinone) 1 beta subcomplex 8
(NDUFB8; complex I); succinate dehydrogenase complex, subunit
B, iron sulfur (SDHB/Ip; complex II); ubiquinol-cytochrome c
reductase core protein II (UQCR2; complex III); cytochrome c
oxidase subunit 2 (COXII; complex IV). In addition, we
investigated the expression levels of the COXI (complex IV), the
downstream effector of TACO-1, whose expression was sup-
pressed in Elesclomol-treated melanoma cells. SDHB/Ip,
UQCR2, and COXII were among the proteins identified by the
SILAC analysis. For loading control of whole-cell lysates, we used
an a-tubulin antibody. For loading control of mitochondrial
lysates, we used an antibody to porin, a voltage-dependent anion-
selective channel protein that resides in the outer mitochondrial
membrane [17]. Our reason for selecting the latter was that the
abundance of the two isoforms that were detected in the SILAC
experiment (VDAC1 and VDAC3) was not different between
Elesclomol and DMSO-treated melanoma cells (data not shown).
Depicted in Fig. 3A is the dose-dependent suppression of all
proteins at 20 nM and 100 nM of Elesclomol treatment. In
contrast, at a dose of 500 nM of Elesclomol, a reduction was
detected only in NDUFB8, COXI, and COXII. Similar dose-
dependent downregulation of NDUFB8, SDHB/Ip, and UQCR2
Table 3. Cont.
Symbol Entrez Gene Name UniProt Peptide CountFold-reduction in E- versusV-treated cells
CAT Catalase P04040 24u 1.3
Cholesterol Biosynthesis
HMGCS1 3-hydroxy-3-methylglutaryl CoA synthase 1 (soluble) Q01581 4u 2.2
LSS Lanosterol synthase (2,3-oxidosqualene-lanosterol cyclase) P48449 2u 2.0
PMVK Phosphomevalonate kinase Q15126 4u 1.7
FDFT1 Farnesyl-diphosphate farnesyltransferase 1 P37268 5c 1.7
FDPS Farnesyl diphosphate synthase B3KMW3 7c 1.6
ACAT2 Acetyl-CoA acetyltransferase Q9BWD1 13u 1.3
u - proteins identified by unique peptides; c - proteins identified by common peptides.doi:10.1371/journal.pone.0040690.t003
Figure 2. HO-1, TACO-1, and HIF-1a expression in Elesclomol-treated melanoma cells. (A) Whole-cell (WC), (B) mitochondrial and WC, and(C) nuclear (Nu) and cytoplasmic (Cy) lysates, prepared from WM1158 metastatic melanoma cells following treatment with increasing doses ofElesclomol (ELM). Controls were WM1158 melanoma cells that received the drug vehicle DMSO, or no treatment (no tx). The blots were probed withantibody to HO-1, TACO-1, HIF-1a, or a-tubulin, which served as loading control. LDH5 was used as a cytoplasmic protein control.doi:10.1371/journal.pone.0040690.g002
Action Mechanism of Elesclomol in Melanoma Cells
PLOS ONE | www.plosone.org 5 August 2012 | Volume 7 | Issue 8 | e40690
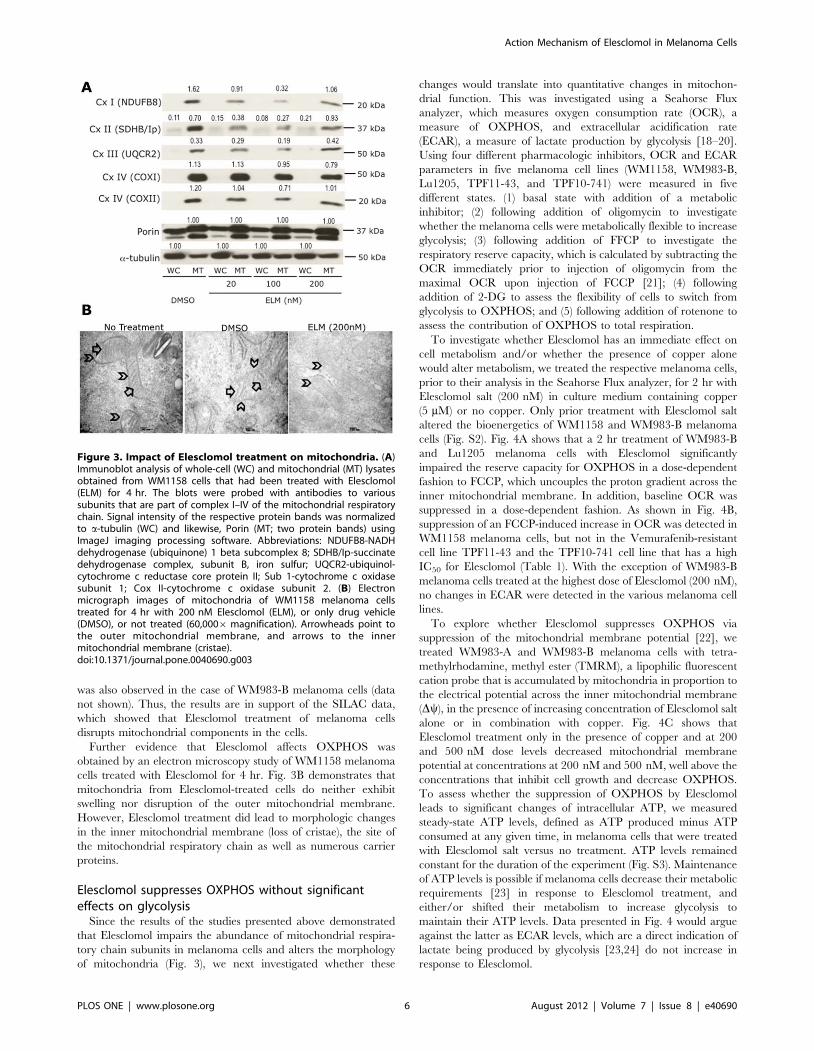
was also observed in the case of WM983-B melanoma cells (data
not shown). Thus, the results are in support of the SILAC data,
which showed that Elesclomol treatment of melanoma cells
disrupts mitochondrial components in the cells.
Further evidence that Elesclomol affects OXPHOS was
obtained by an electron microscopy study of WM1158 melanoma
cells treated with Elesclomol for 4 hr. Fig. 3B demonstrates that
mitochondria from Elesclomol-treated cells do neither exhibit
swelling nor disruption of the outer mitochondrial membrane.
However, Elesclomol treatment did lead to morphologic changes
in the inner mitochondrial membrane (loss of cristae), the site of
the mitochondrial respiratory chain as well as numerous carrier
proteins.
Elesclomol suppresses OXPHOS without significanteffects on glycolysis
Since the results of the studies presented above demonstrated
that Elesclomol impairs the abundance of mitochondrial respira-
tory chain subunits in melanoma cells and alters the morphology
of mitochondria (Fig. 3), we next investigated whether these
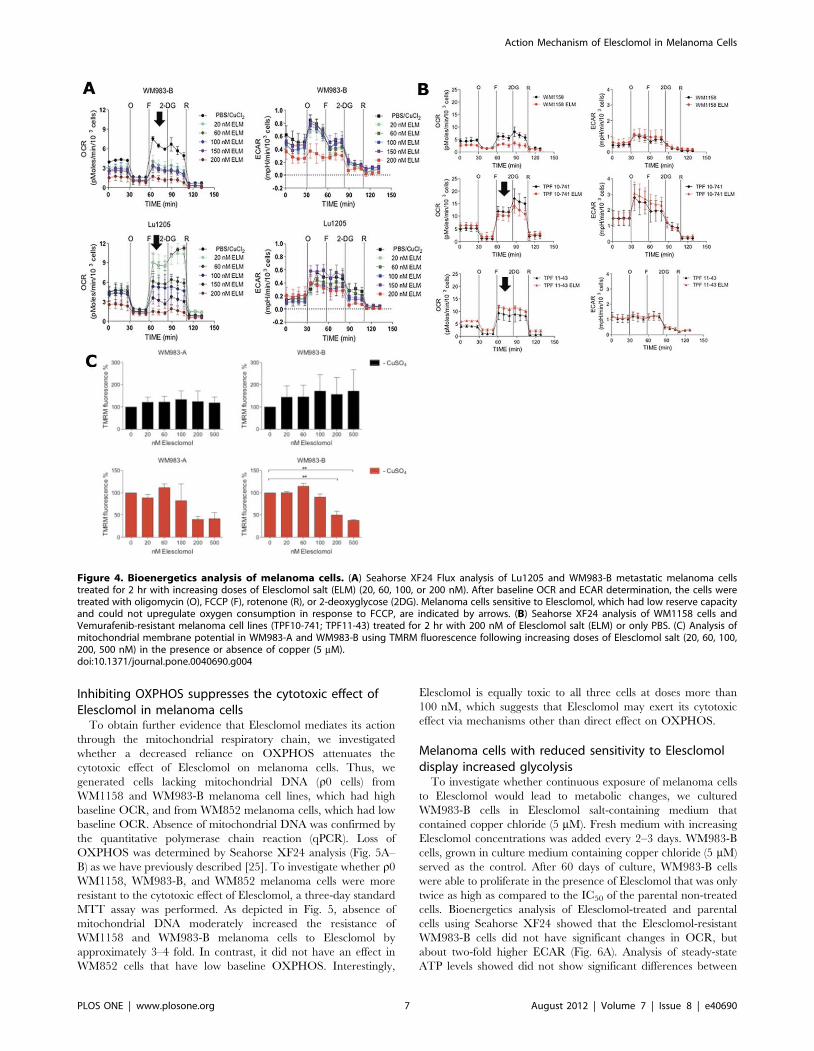
changes would translate into quantitative changes in mitochon-
drial function. This was investigated using a Seahorse Flux
analyzer, which measures oxygen consumption rate (OCR), a
measure of OXPHOS, and extracellular acidification rate
(ECAR), a measure of lactate production by glycolysis [18–20].
Using four different pharmacologic inhibitors, OCR and ECAR
parameters in five melanoma cell lines (WM1158, WM983-B,
Lu1205, TPF11-43, and TPF10-741) were measured in five
different states. (1) basal state with addition of a metabolic
inhibitor; (2) following addition of oligomycin to investigate
whether the melanoma cells were metabolically flexible to increase
glycolysis; (3) following addition of FFCP to investigate the
respiratory reserve capacity, which is calculated by subtracting the
OCR immediately prior to injection of oligomycin from the
maximal OCR upon injection of FCCP [21]; (4) following
addition of 2-DG to assess the flexibility of cells to switch from
glycolysis to OXPHOS; and (5) following addition of rotenone to
assess the contribution of OXPHOS to total respiration.
To investigate whether Elesclomol has an immediate effect on
cell metabolism and/or whether the presence of copper alone
would alter metabolism, we treated the respective melanoma cells,
prior to their analysis in the Seahorse Flux analyzer, for 2 hr with
Elesclomol salt (200 nM) in culture medium containing copper
(5 mM) or no copper. Only prior treatment with Elesclomol salt
altered the bioenergetics of WM1158 and WM983-B melanoma
cells (Fig. S2). Fig. 4A shows that a 2 hr treatment of WM983-B
and Lu1205 melanoma cells with Elesclomol significantly
impaired the reserve capacity for OXPHOS in a dose-dependent
fashion to FCCP, which uncouples the proton gradient across the
inner mitochondrial membrane. In addition, baseline OCR was
suppressed in a dose-dependent fashion. As shown in Fig. 4B,
suppression of an FCCP-induced increase in OCR was detected in
WM1158 melanoma cells, but not in the Vemurafenib-resistant
cell line TPF11-43 and the TPF10-741 cell line that has a high
IC50 for Elesclomol (Table 1). With the exception of WM983-B
melanoma cells treated at the highest dose of Elesclomol (200 nM),
no changes in ECAR were detected in the various melanoma cell
lines.
To explore whether Elesclomol suppresses OXPHOS via
suppression of the mitochondrial membrane potential [22], we
treated WM983-A and WM983-B melanoma cells with tetra-
methylrhodamine, methyl ester (TMRM), a lipophilic fluorescent
cation probe that is accumulated by mitochondria in proportion to
the electrical potential across the inner mitochondrial membrane
(Dy), in the presence of increasing concentration of Elesclomol salt
alone or in combination with copper. Fig. 4C shows that
Elesclomol treatment only in the presence of copper and at 200
and 500 nM dose levels decreased mitochondrial membrane
potential at concentrations at 200 nM and 500 nM, well above the
concentrations that inhibit cell growth and decrease OXPHOS.
To assess whether the suppression of OXPHOS by Elesclomol
leads to significant changes of intracellular ATP, we measured
steady-state ATP levels, defined as ATP produced minus ATP
consumed at any given time, in melanoma cells that were treated
with Elesclomol salt versus no treatment. ATP levels remained
constant for the duration of the experiment (Fig. S3). Maintenance
of ATP levels is possible if melanoma cells decrease their metabolic
requirements [23] in response to Elesclomol treatment, and
either/or shifted their metabolism to increase glycolysis to
maintain their ATP levels. Data presented in Fig. 4 would argue
against the latter as ECAR levels, which are a direct indication of
lactate being produced by glycolysis [23,24] do not increase in
response to Elesclomol.
Figure 3. Impact of Elesclomol treatment on mitochondria. (A)Immunoblot analysis of whole-cell (WC) and mitochondrial (MT) lysatesobtained from WM1158 cells that had been treated with Elesclomol(ELM) for 4 hr. The blots were probed with antibodies to varioussubunits that are part of complex I–IV of the mitochondrial respiratorychain. Signal intensity of the respective protein bands was normalizedto a-tubulin (WC) and likewise, Porin (MT; two protein bands) usingImageJ imaging processing software. Abbreviations: NDUFB8-NADHdehydrogenase (ubiquinone) 1 beta subcomplex 8; SDHB/Ip-succinatedehydrogenase complex, subunit B, iron sulfur; UQCR2-ubiquinol-cytochrome c reductase core protein II; Sub 1-cytochrome c oxidasesubunit 1; Cox II-cytochrome c oxidase subunit 2. (B) Electronmicrograph images of mitochondria of WM1158 melanoma cellstreated for 4 hr with 200 nM Elesclomol (ELM), or only drug vehicle(DMSO), or not treated (60,0006 magnification). Arrowheads point tothe outer mitochondrial membrane, and arrows to the innermitochondrial membrane (cristae).doi:10.1371/journal.pone.0040690.g003
Action Mechanism of Elesclomol in Melanoma Cells
PLOS ONE | www.plosone.org 6 August 2012 | Volume 7 | Issue 8 | e40690
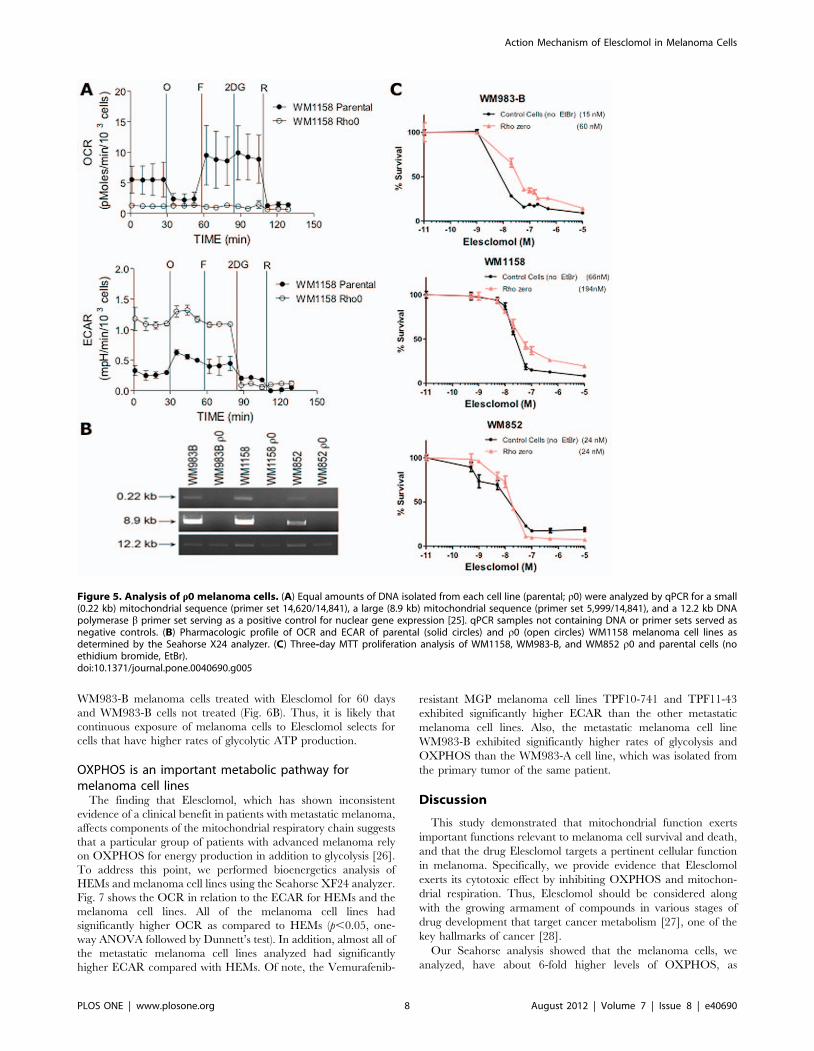
Inhibiting OXPHOS suppresses the cytotoxic effect ofElesclomol in melanoma cells
To obtain further evidence that Elesclomol mediates its action
through the mitochondrial respiratory chain, we investigated
whether a decreased reliance on OXPHOS attenuates the
cytotoxic effect of Elesclomol on melanoma cells. Thus, we
generated cells lacking mitochondrial DNA (r0 cells) from
WM1158 and WM983-B melanoma cell lines, which had high
baseline OCR, and from WM852 melanoma cells, which had low
baseline OCR. Absence of mitochondrial DNA was confirmed by
the quantitative polymerase chain reaction (qPCR). Loss of
OXPHOS was determined by Seahorse XF24 analysis (Fig. 5A–
B) as we have previously described [25]. To investigate whether r0
WM1158, WM983-B, and WM852 melanoma cells were more
resistant to the cytotoxic effect of Elesclomol, a three-day standard
MTT assay was performed. As depicted in Fig. 5, absence of
mitochondrial DNA moderately increased the resistance of
WM1158 and WM983-B melanoma cells to Elesclomol by
approximately 3–4 fold. In contrast, it did not have an effect in
WM852 cells that have low baseline OXPHOS. Interestingly,
Elesclomol is equally toxic to all three cells at doses more than
100 nM, which suggests that Elesclomol may exert its cytotoxic
effect via mechanisms other than direct effect on OXPHOS.
Melanoma cells with reduced sensitivity to Elesclomoldisplay increased glycolysis
To investigate whether continuous exposure of melanoma cells
to Elesclomol would lead to metabolic changes, we cultured
WM983-B cells in Elesclomol salt-containing medium that
contained copper chloride (5 mM). Fresh medium with increasing
Elesclomol concentrations was added every 2–3 days. WM983-B
cells, grown in culture medium containing copper chloride (5 mM)
served as the control. After 60 days of culture, WM983-B cells
were able to proliferate in the presence of Elesclomol that was only
twice as high as compared to the IC50 of the parental non-treated
cells. Bioenergetics analysis of Elesclomol-treated and parental
cells using Seahorse XF24 showed that the Elesclomol-resistant
WM983-B cells did not have significant changes in OCR, but
about two-fold higher ECAR (Fig. 6A). Analysis of steady-state
ATP levels showed did not show significant differences between
Figure 4. Bioenergetics analysis of melanoma cells. (A) Seahorse XF24 Flux analysis of Lu1205 and WM983-B metastatic melanoma cellstreated for 2 hr with increasing doses of Elesclomol salt (ELM) (20, 60, 100, or 200 nM). After baseline OCR and ECAR determination, the cells weretreated with oligomycin (O), FCCP (F), rotenone (R), or 2-deoxyglycose (2DG). Melanoma cells sensitive to Elesclomol, which had low reserve capacityand could not upregulate oxygen consumption in response to FCCP, are indicated by arrows. (B) Seahorse XF24 analysis of WM1158 cells andVemurafenib-resistant melanoma cell lines (TPF10-741; TPF11-43) treated for 2 hr with 200 nM of Elesclomol salt (ELM) or only PBS. (C) Analysis ofmitochondrial membrane potential in WM983-A and WM983-B using TMRM fluorescence following increasing doses of Elesclomol salt (20, 60, 100,200, 500 nM) in the presence or absence of copper (5 mM).doi:10.1371/journal.pone.0040690.g004
Action Mechanism of Elesclomol in Melanoma Cells
PLOS ONE | www.plosone.org 7 August 2012 | Volume 7 | Issue 8 | e40690
WM983-B melanoma cells treated with Elesclomol for 60 days
and WM983-B cells not treated (Fig. 6B). Thus, it is likely that
continuous exposure of melanoma cells to Elesclomol selects for
cells that have higher rates of glycolytic ATP production.
OXPHOS is an important metabolic pathway formelanoma cell lines
The finding that Elesclomol, which has shown inconsistent
evidence of a clinical benefit in patients with metastatic melanoma,
affects components of the mitochondrial respiratory chain suggests
that a particular group of patients with advanced melanoma rely
on OXPHOS for energy production in addition to glycolysis [26].
To address this point, we performed bioenergetics analysis of
HEMs and melanoma cell lines using the Seahorse XF24 analyzer.
Fig. 7 shows the OCR in relation to the ECAR for HEMs and the
melanoma cell lines. All of the melanoma cell lines had
significantly higher OCR as compared to HEMs (p,0.05, one-
way ANOVA followed by Dunnett’s test). In addition, almost all of
the metastatic melanoma cell lines analyzed had significantly
higher ECAR compared with HEMs. Of note, the Vemurafenib-
resistant MGP melanoma cell lines TPF10-741 and TPF11-43
exhibited significantly higher ECAR than the other metastatic
melanoma cell lines. Also, the metastatic melanoma cell line
WM983-B exhibited significantly higher rates of glycolysis and
OXPHOS than the WM983-A cell line, which was isolated from
the primary tumor of the same patient.
Discussion
This study demonstrated that mitochondrial function exerts
important functions relevant to melanoma cell survival and death,
and that the drug Elesclomol targets a pertinent cellular function
in melanoma. Specifically, we provide evidence that Elesclomol
exerts its cytotoxic effect by inhibiting OXPHOS and mitochon-
drial respiration. Thus, Elesclomol should be considered along
with the growing armament of compounds in various stages of
drug development that target cancer metabolism [27], one of the
key hallmarks of cancer [28].
Our Seahorse analysis showed that the melanoma cells, we
analyzed, have about 6-fold higher levels of OXPHOS, as
Figure 5. Analysis of r0 melanoma cells. (A) Equal amounts of DNA isolated from each cell line (parental; r0) were analyzed by qPCR for a small(0.22 kb) mitochondrial sequence (primer set 14,620/14,841), a large (8.9 kb) mitochondrial sequence (primer set 5,999/14,841), and a 12.2 kb DNApolymerase b primer set serving as a positive control for nuclear gene expression [25]. qPCR samples not containing DNA or primer sets served asnegative controls. (B) Pharmacologic profile of OCR and ECAR of parental (solid circles) and r0 (open circles) WM1158 melanoma cell lines asdetermined by the Seahorse X24 analyzer. (C) Three-day MTT proliferation analysis of WM1158, WM983-B, and WM852 r0 and parental cells (noethidium bromide, EtBr).doi:10.1371/journal.pone.0040690.g005
Action Mechanism of Elesclomol in Melanoma Cells
PLOS ONE | www.plosone.org 8 August 2012 | Volume 7 | Issue 8 | e40690
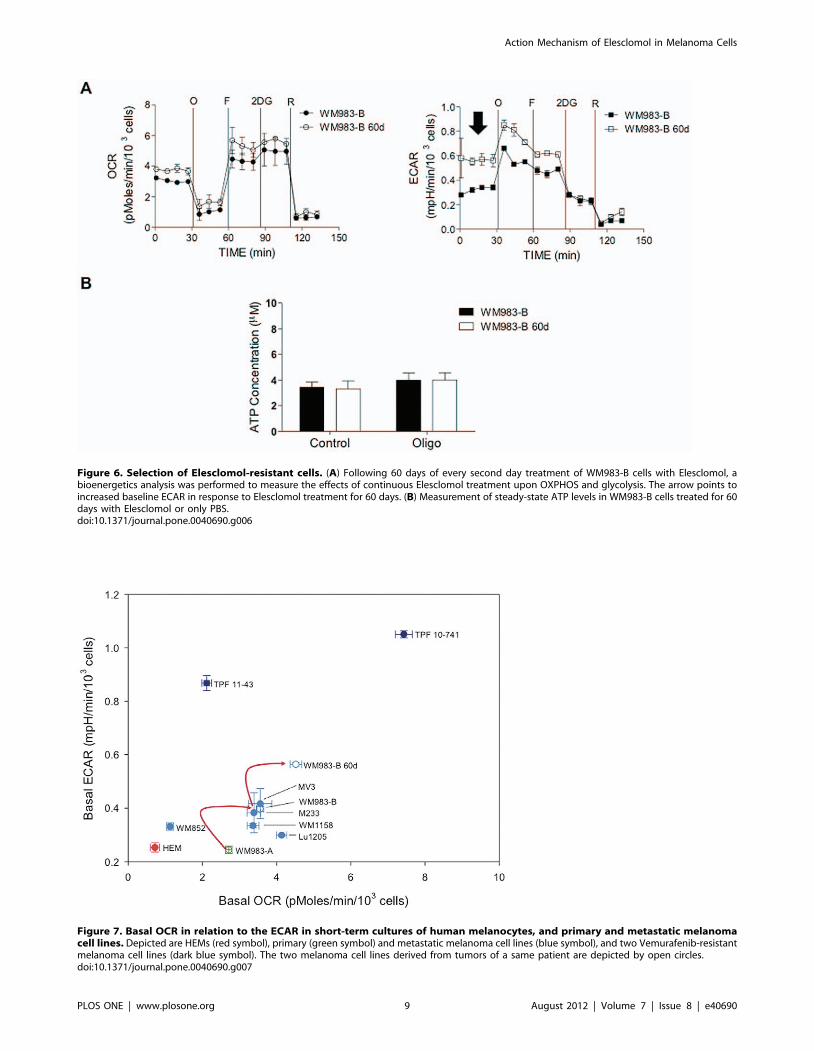
Figure 6. Selection of Elesclomol-resistant cells. (A) Following 60 days of every second day treatment of WM983-B cells with Elesclomol, abioenergetics analysis was performed to measure the effects of continuous Elesclomol treatment upon OXPHOS and glycolysis. The arrow points toincreased baseline ECAR in response to Elesclomol treatment for 60 days. (B) Measurement of steady-state ATP levels in WM983-B cells treated for 60days with Elesclomol or only PBS.doi:10.1371/journal.pone.0040690.g006
Figure 7. Basal OCR in relation to the ECAR in short-term cultures of human melanocytes, and primary and metastatic melanomacell lines. Depicted are HEMs (red symbol), primary (green symbol) and metastatic melanoma cell lines (blue symbol), and two Vemurafenib-resistantmelanoma cell lines (dark blue symbol). The two melanoma cell lines derived from tumors of a same patient are depicted by open circles.doi:10.1371/journal.pone.0040690.g007
Action Mechanism of Elesclomol in Melanoma Cells
PLOS ONE | www.plosone.org 9 August 2012 | Volume 7 | Issue 8 | e40690
compared to HEMs and that Elesclomol decreases respiratory
reserve capacity in mitochondria. Specifically, our data show that
Elesclomol suppresses basal levels of OXPHOS and affects the
ability of melanoma cells to upregulate OXPHOS in response to
agents that either inhibit glycolysis, such as 2DG, or uncouple the
mitochondrial proton gradient from ATP production, such as
FCCP. The effect of Elesclomol on OXPHOS, at or below
100 nM concentrations, appears to be direct and not secondary to
suppression of the mitochondrial membrane potential, a known
regulator of OXPHOS [22]. This is an important finding because
other non-mitochondrial effects of Elesclomol may account for its
cytotoxic effect at least at high doses, as suggested by our SILAC
analysis. Independent of the Seahorse analysis, the data we
obtained via the SILAC study also showed that Elesclomol
treatment decreases the abundance of distinct components from
complex I of the mitochondrial respiratory chain, the ‘entry’
enzyme of OXPHOS that catalyzes the transfer of electrons from
NADH to coenzyme Q (CoQ). The SILAC study also revealed
that Elesclomol treatment decreased the abundance of several
other components of the mitochondrial respiratory chain, includ-
ing mitochondria-encoded proteins, such as TACO1 whose
function per se is not associated with OXPHOS. Unlike in the
case of the noticeable changes in OXPHOS, the changes we
observed with respect to subunits in the mitochondrial respiratory
chain were not substantial, but exhibited consistent downregula-
tion. The latter is not surprising because the SILAC studies were
performed during a time window of 4 hr. In addition, electron
microscopy, showed that Elesclomol caused prominent loss of
mitochondrial cristae, the site where components of the mito-
chondrial respiratory chain reside. We therefore conclude that
Elesclomol does not exert its effect via a single molecular target
within the mitochondrial respiratory chain, but through several
molecules whose collective disruption leads to impairment of
OXPHOS. Our results are in agreement with a recent study using
yeast deletion mutants, which failed to identify a single molecule to
account for the cytotoxic effect of elesclomol [29].
The other important aspect we experimentally addressed in the
context of this study is whether Elesclomol retained its effect at a
state when mitochondrial functions were impaired in the
melanoma cells. For example, Elesclomol treatment during
hypoxia, the latter of which is known to increase glycolytic
enzymes and thus, shifts glucose utilization away from OXPHOS
was less cytotoxic for most melanoma cell lines. These results can
be explained in two different ways: First, cytochrome c oxidase
activity remains saturated even at that low oxygen level [30].
Second, under stringent hypoxic conditions cells undergo meta-
bolic reprogramming during which glutamine undergoes reductive
carboxylation for lipid synthesis, allowing for cells to conserve
glucose for production of ribose and other biosynthetic molecules
[31,32]. Another aspect we addressed was whether r0 melanoma
cells that had been depleted of mitochondrial DNA remained
sensitive to Elesclomol compared with parental cells containing
mitochondrial DNA. Only the parental cells that exhibited higher
rates of OXPHOS (WM1158 and WM983-B versus WM852)
gave rise to r0 cells that were more resistant to Elesclomol.
Ultimately, however, all three r0 melanoma cell lines were killed
by relatively high doses of Elesclomol. Our working hypothesis is
that while these r0 cells no longer perform OXPHOS, these cells
in order to survive, maintain a proton gradient across the inner
mitochondrial membrane by running complex V in reverse
consuming ATP [33]. Our data indicated that Elesclomol at high
doses ($200 nM) decreases mitochondrial membrane potential
and therefore can disrupt the inner mitochondrial membrane
proton gradient, which then lead to cell death. This high dose
effect of Elesclomol would be expected to be independent of the
presence of oxygen, as in the case of our hypoxic experiments, and
in the absence of functional OXPHOS, as in the case of our r0 cell
experiments.
In contrast with the Warburg hypothesis, which states that a
large proportion of ATP is produced by tumor cells via glucose
metabolism with concomitantly decreased ATP produced by
oxidation of mitochondrial substrates caused by mitochondrial
defects [34], our findings across multiple cell lines show that
melanoma cells exhibit substantially higher rates of OXPHOS
than HEMs. Our findings regarding the role of OXPHOS in
advanced melanoma are in line with a previous report [35], which
documented that compared with other solid tumor xenografts,
human melanoma xenografts have one of the highest rates of
oxygen consumption, a surrogate marker of OXPHOS. In
addition, it has been reported that r0 melanoma cells do not
form xenografts [36], and that non-glycolytic metabolic sources,
such as the Krebs cycle, are more prominent in melanoma cells
compared with melanocytes [37].
The other important and novel finding of our study is that even
at nanomolar concentrations, Elesclomol had a cytotoxic effect on
melanoma cells whereas HEMs were largely resistant. Since the
HEMs exhibited low rates of OXPHOS and thus generate lower
levels of endogenous ROS, it is possible that cells are less sensitive
to Elesclomol inhibition of OXPHOS, and their antioxidant
capacity is capable of quenching Elesclomol-induced ROS. In
contrast, since we found that melanoma cells exhibit high rates of
OXPHOS, it is likely that they have high levels of endogenous
ROS and therefore, their antioxidant reserve is not sufficient to
defend against the additional ROS burden induced by Elesclomol.
Thus, further induction of oxidative stress by Elesclomol likely
exceeds the antioxidant capacity of melanoma cells, leading to cell
death [9,38].
The specific effect of Elesclomol on the mitochondrial
respiratory chain and OXPHOS suggests possible mechanisms
of resistance. TPF10-741, a melanoma cell line that is resistant to
Vemurafenib and as we show, Elesclomol, exhibited the highest
levels of ECAR. However, this trend is not universal because the
Vemurafenib-resistant melanoma cell lines TPF11-43 was rela-
tively sensitive to Elesclomol at median nanomolar concentrations.
Regarding secondary resistance to Elesclomol reflected by the
finding that we could not select for melanoma cells with resistance
to Elesclomol at an IC50 value higher than 500 nM, we found that
60 days continuous exposure of WM983-B cells to Elesclomol
selected for cells with significantly higher glycolysis. The molecular
mechanisms behind this phenomenon may involve, among others,
HIF-1a upregulation. A pertinent molecule for melanoma [39],
HIF-1a is involved in suppressing OXPHOS, upregulates the
metabolic program involved in glycolysis, and shows an associa-
tion with overall worse prognosis in multiple cancers [40].
It is known that melanoma patients with either high serum
LDH or high expression of LDH5, the LDH isoenzyme involved
in the biochemical conversion of pyruvate to lactate, have poor
prognosis [5,13]. Thus, our findings regarding Elesclomol have
important clinical implications in relation to a large failed phase
III trial of this drug. The specific effect of Elesclomol upon cells
utilizing OXPHOS, but not glycolysis, may explain why
Elesclomol has a potential clinical benefit only in patients with
metastatic melanoma and normal serum LDH, a patient subgroup
with better prognosis [13], whereas in patients with high serum
LDH, Elesclomol treatment may have an adverse effect upon
overall survival [12]. Given our data, it is possible that the
metabolism of melanoma cells in these patients is more dependent
Action Mechanism of Elesclomol in Melanoma Cells
PLOS ONE | www.plosone.org 10 August 2012 | Volume 7 | Issue 8 | e40690
upon OXPHOS for energy production as opposed to glycolysis, a
hypothesis we are currently testing.
Lastly, our SILAC, immunoblot, and electron microscopy data
along with the finding that we could not generate a ‘bona fide’
Elesclomol-resistant melanoma cell line are in agreement with the
result from a recent study, which indicate that multiple protein
targets account for the cytotoxic effect of Elesclomol [29]. This
suggests that only conditions that shift metabolic balance towards
glycolysis and not individual changes in particular proteins of the
mitochondrial respiratory chain account for the resistance to
Elesclomol.
Materials and Methods
Cell culturesHuman epidermal melanocytes (HEMs) were purchased from
Cell Applications (San Diego, CA) and propagated as per the
manufacturer’s recommendation. Human melanoma cell lines
(WM1158, WM852, WM983-A, WM983-B, Lu1205, C32) were
purchased from the Coriell Institute for Medical Research
(Camden, NJ) or the American Type Culture Collection
(Manassas, VA). MV3 melanoma cells were established by Dr.
D.J Ruiter (University Hospital Nijmegen) and obtained from Dr.
S. Ferrone (University of Pittsburgh) [41], and M233 melanoma
cells [42] were established and provided by Dr. A. Ribas (UCLA).
The human cell lines TPF10-741 and TPF11-43 were established
at our institution (JMK, CS, YY) under the University of
Pittsburgh Cancer Institute (UPCI) tissue banking protocol
UPCI96-099 that allows acquisition of fresh tumor tissue from
patients with metastatic melanoma who have signed written
informed consent. Both cell lines were established from subcuta-
neous metastases of two patients who developed secondary
resistance to Vemurafenib after an initial partial response in a
phase II trial of Vemurafenib in metastatic melanoma (BRIM-2)
[43]. Immunoblot analysis of whole-cell lysates prepared from
TPF10-741 and TPF11-43 cells and probed with antibodies to
S100 antigen, Melan-A, tyrosinase, and MAGE-A served to
confirm that they were melanoma cells. Melanoma cell lines were
made deficient of mitochondrial DNA (rho zero, r0) as previously
described [25]. For experiments performed under hypoxic
conditions, a hypoxic chamber (Billups-Rothenberg, Inc., Del
Mar, CA) and premixed gas (0.1% O2, 5% CO2 balanced with N2)
were used as previously described [44].
Drugs and antibodiesTwo different formulations of Elesclomol, provided by Synta
Pharmaceuticals, Inc. (Lexington, MA) were used: Elesclomol
soluble in DMSO, and Elesclomol salt, soluble in phosphate
buffered saline (PBS). Copper (CuCl2) was purchased from Sigma-
Aldrich (St. Louis, MO). Antibodies were Heme Oxygenase-1
(HO-1) (rabbit anti-human monoclonal, Epitomics, Burlingame,
CA), hypoxia inducible factor-1alpha (HIF-1a) (mouse anti-human
monoclonal, BD Biosciences, San Diego, CA), a-tubulin (rabbit
anti-human monoclonal, Cell Signaling, Danvers, MA), Mitopro-
file total OXPHOS human Western blot antibody cocktail
(MitoSciences, Eugene, OR), OXPHOS complex IV subunit I
(mouse monoclonal anti-human, Invitrogen, Carlsbad, CA), and
Porin (mouse anti-human monoclonal, MitoSciences). Transla-
tional activator of cytochrome c oxidase subunit-1 (TACO-1)
(rabbit anti-human polyclonal antibody) was provided by Dr. Eric
Shoubridge (McGill University).
Cell proliferation analysisMelanoma cells were seeded, in triplicate, into 96-well tissue
culture plates. Following overnight incubation, the medium was
replenished with fresh medium containing increasing concentra-
tions of Elesclomol or only DMSO. Seventy-two hr following drug
treatment, cell viability was determined using the the CyQUANT
Cell Proliferation Assay and the Vybrant MTT Cell Proliferation
Assay Kit (both from Invitrogen). Using CalcuSyn Version 2.1
(Biosoft, Cambridge, UK), IC50 values were determined using the
Chou’s median-effect equation, correlating dose and effect via the
following formula fa/fu = (D/Dm)m, with D being dose of the drug;
Dm, median-effect dose signifying the potency; fa fraction affected
by the dose; fu fraction unaffected (i.e. fu = 12fa), and m an
exponent signifying the sigmoidicity (shape) of the dose-effect
curve.
SILAC analysisAs previously described [45], melanoma cells were grown in
medium supplemented with ‘heavy’ arginine (13C615N4 L-Arg) and
lysine (13C6 L-Lys), or corresponding ‘light’ amino acids. Cells
grown in ‘heavy’ media were treated with Elesclomol, and cells
grown in ‘light’ amino acid-containing medium were treated with
the drug vehicle, DMSO. Whole-cell lysates, prepared from
Elesclomol or DMSO-treated cells, were mixed at a ratio of 1:1,
followed by sodium dodecyl sulfate polyacrylamide gel electro-
phoresis (SDS-PAGE). Peptides were analyzed in duplicates by
liquid chromatography Mass Spectrometry (LC-MS,) and queried
using a human proteome database [Uniprot, version (10/2008)].
For each protein, the SILAC ratio (Elesclomol-treated)/(Drug
vehicle-treated) was normalized to the mean ratio and standard
deviation for the entire data set. Proteins below two standard
deviations from the mean (outside of a 95% confidence interval;
two-tailed distribution) were discerned as significantly upregulated
or downregulated. In this transformed distribution, two tails equal
to 5% exist, i.e. 2.5% for the majority of upregulated proteins and
2.5% for the majority of downregulated proteins. For determina-
tion of cellular processes associated with Elesclomol-treated
melanoma cells, identified proteins with fold changes of $1.3
were interrogated in Ingenuity Pathway Analysis Toxicology (IPA-
Tox) (Ingenuity Systems).
Immunoblot blot analysis and electron microscopyWhole-cell lysates were prepared using 106 lysis buffer [46].
Nuclear and cytoplasmic extracts were isolated using the NE-PER
nuclear and cytoplasmic extraction kit (Thermo Scientific).
Mitochondria isolated from melanoma cells using a mitochondrial
isolation kit (Mitosciences) were stored at 280uC until further use.
Mitochondrial proteins were extracted from snap-frozen mito-
chondria by adding 0.2% SDS. Protein lysates (30 mg/sample),
prepared from whole cells or subcellular fractions, were separated
on 10% SDS-PAGE, transferred onto nitrocellulose membrane,
and probed with primary antibody followed by incubation with a
horseradish peroxidase-conjugated secondary antibody (Cell Sig-
naling), and chemiluminescent HRP Substrate (Millipore). For
electron microscopy studies, melanoma cells were treated with
Elesclomol (200 nM for 4 hr), fixed with 2% glutaraldehyde for
30 min at room temperature, and stored at 4uC until further
analysis. Samples were analyzed by electron microscopy as
previously described [47].
Seahorse XF24 Flux AnalyzerThe Seahorse XF24 Flux analyzer (Seahorse Biosciences,
Billerica, MA) was used to determine the metabolic profiles of
Action Mechanism of Elesclomol in Melanoma Cells
PLOS ONE | www.plosone.org 11 August 2012 | Volume 7 | Issue 8 | e40690
melanoma cells [25]. 46104 cells/well were seeded into Seahorse
XF24 microplates and incubated at 37uC for approximately 24 hr.
Thereafter, the cells were treated for 2 hr with different doses of
Elesclomol salt in combination with copper chloride (5 mM), or
likewise with different doses of Elesclomol in the absence of
copper. Basal oxygen consumption rate (OCAR) and extracellular
acidification rate (ECAR) were measured in the Seahorse XF24
Flux analyzer. Additional measurements were performed after
injection of four compounds affecting bioenergetics: (oligomycin
(1 mM) (Sigma-Aldrich), carbonyl cyanide 4-trifluoromethoxy-
phenylhydrazone (FCCP) (300 nM) (Sigma-Aldrich), 2-deoxyglu-
cose (2-DG), (100 mM) (Sigma-Aldrich), and rotenone (1 mM)
(Sigma-Aldrich). Upon completion of the Seahorse XF24 Flux
analysis, cells were trypsinized, counted, and the results were
normalized per 103 cells. Statistical analysis was performed using
one-way analysis of variance (ANOVA), followed by the Dunnett’s
test.
Mitochondrial membrane potential analysisMelanoma cells were seeded in duplicates, into 96-well tissue
culture plates (1.56104 cells/well). Following overnight incuba-
tion, fresh medium (50 mL) containing increasing concentrations of
Elesclomol salt in combination with copper chloride (5 mM), or
likewise with different doses of Elesclomol in the absence of
copper, or the drug vehicle (PBS) was added to cells. Six hours
following drug treatment, cells were rinsed twice with DMEM/
L15 medium without phenol red and incubated for 15 min at
37uC with 10 mM tetramethylrhodamine, methyl ester (TMRM,
Molecular Probes). Fluorescent measurements were obtained on a
Biotek Synergy 2 plate reader (Winooski, VT). Statistical analysis
was performed using one-way analysis of variance (ANOVA),
followed by the Tukey’s multiple comparison test.
ATP measurementsSteady-state ATP levels were measured using a luminescence
ATP detection assay (ATPlite PerkinElmer Inc., Waltham, MA).
46104 cells/well were grown overnight in 96-well black plates and
treated separately with the indicated compounds for 45 min,
followed by cell lysis using 50 ml of cell lysis solution, and
incubation for 5 min at 300 rpm. Thereafter, substrate solution
(50 ml) was added, and the microplates were incubated for 5 min
at 270 rpm. The plates were kept in the dark for 10 min, and
luminescence was measured using a Biotek Synergy 2 plate reader
(Winooski, VT). Statistical analysis was performed using one-way
analysis of variance (ANOVA).
Supporting Information
Figure S1 HIF-1a and HO-1 analysis of Elesclomol-treated melanoma cells. (A) HIF-1a immunoblot analysis of
whole-cell lysates prepared from WM983-B and TPF10-741
melanoma cells treated for 6 hr with increasing doses of
Elesclomol (ELM) (20, 100, or 500 nM). (B) HO-1 immunoblot
analysis of whole-cell lysates prepared from WM983-B and
TPF10-741 melanoma cells treated with increasing doses of
Elesclomol (ELM) (20, 100, or 500 nM) for 4, 8, or 24 hr. Cells
not treated or treated with drug vehicle, DMSO, served as
controls.
(TIFF)
Figure S2 Bioenergetics analysis of WM1158 andWM983-B melanoma cells. Cells treated with 200 nM of
Elesclomol salt in the presence of 5 mM copper (ELM), PBS/
CuCl2 (5 mM), or only PBS (control). Elesclomol was administered
either via a 2 hr incubation (ELM incubated), or by injection from
port A of the Seahorse XF24 Flux analyzer (ELM injected). After
determination of baseline OCR and ECAR, the cells were treated
with oligomycin (O), FCCP (F), and rotenone (R).
(TIFF)
Figure S3 Steady-state ATP levels in melanoma cellstreated with Elesclomol salt. Melanoma cells were treated for
2 hr with 200 nM of Elesclomol salt (ELM) or only PBS (NT).
Thereafter, the cells were treated for 45 min with 1 mM of
oligomycin (oligo) or only DMSO (control).
(TIFF)
Table S1 Dysregulated proteins identified by outlieranalysis of the SILAC data of WM1158 melanoma cellstreated with Elesclomol (E) versus the drug vehicleDMSO (V). Results are presented as E/V ratio. Highlighted
(boldface) are proteins associated with mitochondrial functions.
Abbreviations: u - proteins identified by unique peptides; c -
proteins identified by common peptides.
(DOCX)
Acknowledgments
The authors would like to thank Dr. Soldano Ferrone, University of
Pittsburgh, and Dr. Antoni Ribas, UCLA, for providing the MV3 and
M233 melanoma cell lines, respectively, and Dr. Eric Shoubridge, McGill
University, for providing the rabbit anti-human polyclonal antibody
against TACO-1.
Author Contributions
Conceived and designed the experiments: MBDM GV BV SJM.
Performed the experiments: MB GV SLF NWB BLH JS SD YY CS
JMK DB TPC BVH SJM. Analyzed the data: MB GV NWB BLH MS SD
TPC BVH SJM. Contributed reagents/materials/analysis tools: MB NWB
BLH JS SD YY CS JMK TPC BVH SJM. Wrote the paper: MB JMK DB
BV SJM.
References
1. Chapman PB, Hauschild A, Robert C, Haanen JB, Ascierto P, et al. (2011)
Improved Survival with Vemurafenib in Melanoma with BRAF V600E
Mutation. New England Journal of Medicine 364: 2507–2516.
2. Hodi FS, O’Day SJ, McDermott DF, Weber RW, Sosman JA, et al. (2010)
Improved survival with ipilimumab in patients with metastatic melanoma.
N Engl J Med 363: 711–723.
3. Eberle J, Hossini AM (2008) Expression and function of bcl-2 proteins in
melanoma. Curr Genomics 9: 409–419.
4. Boisvert-Adamo K, Longmate W, Abel EV, Aplin AE (2009) Mcl-1 is required
for melanoma cell resistance to anoikis. Mol Cancer Res 7: 549–556.
5. Zhuang L, Scolyer RA, Murali R, McCarthy SW, Zhang XD, et al. (2010)
Lactate dehydrogenase 5 expression in melanoma increases with disease
progression and is associated with expression of Bcl-XL and Mcl-1, but not
Bcl-2 proteins. Mod Pathol 23: 45–53.
6. Meyskens FL Jr, Farmer P, Fruehauf JP (2001) Redox regulation in human
melanocytes and melanoma. Pigment Cell Res 14: 148–154.
7. de Moura MB, dos Santos LS, Van Houten B (2010) Mitochondrial dysfunction
in neurodegenerative diseases and cancer. Environ Mol Mutagen 51: 391–405.
8. Nakajima EC, Van Houten B (2012) Metabolic symbiosis in cancer: Refocusing
the Warburg lens. Mol Carcinog Jan 6 [Epub ahead of print].
9. Kirshner JR, He S, Balasubramanyam V, Kepros J, Yang CY, et al. (2008)
Elesclomol induces cancer cell apoptosis through oxidative stress. Mol Cancer
Ther 7: 2319–2327.
10. Foley KP, Bertin J, Chan K, Inoue T, Kirshner JR, et al. (2007) The oxidative
stress inducer STA-4783 enhances the in vivo efficacy of multiple anti-cancer
therapies in mouse tumor models (abstr A290). AACR-NCI-EORTC Sympo-
sium on Molecular Targets and Cancer Therapeutics San Francisco, CA.
11. O’Day S, Gonzalez R, Lawson D, Weber R, Hutchins L, et al. (2009) Phase II,
randomized, controlled, double-blinded trial of weekly elesclomol plus paclitaxel
Action Mechanism of Elesclomol in Melanoma Cells
PLOS ONE | www.plosone.org 12 August 2012 | Volume 7 | Issue 8 | e40690
versus paclitaxel alone for stage IV metastatic melanoma. J Clin Oncol 27:
5452–5458.12. Hauschild A, Eggermont AM, Jacobson E, O’Day SJ. (2009) Phase III,
randomized, double-blind study of elesclomol and paclitaxel versus paclitaxel
alone in stage IV metastatic melanoma (LBA9012). ASCO Annual MeetingOrlando, Fl.
13. Manola J, Atkins M, Ibrahim J, Kirkwood J (2000) Prognostic factors inmetastatic melanoma: a pooled analysis of Eastern Cooperative Oncology
Group trials. J Clin Oncol 18: 3782–3793.
14. Farmer PJ, Gidanian S, Shahandeh B, Di Bilio AJ, Tohidian N, et al. (2003)Melanin as a target for melanoma chemotherapy: pro-oxidant effect of oxygen
and metals on melanoma viability. Pigment Cell Res 16: 273–279.15. Ganter B, Giroux CN (2008) Emerging applications of network and pathway
analysis in drug discovery and development. Curr Opin Drug Discov Devel 11:86–94.
16. Brand MD (2010) The sites and topology of mitochondrial superoxide
production. Exp Gerontol 45: 466–472.17. Jonas EA, Hickman JA, Chachar M, Polster BM, Brandt TA, et al. (2004)
Proapoptotic N-truncated BCL-xL protein activates endogenous mitochondrialchannels in living synaptic terminals. Proc Natl Acad Sci U S A 101: 13590–
13595.
18. McConnell HM, Owicki JC, Parce JW, Miller DL, Baxter GT, et al. (1992) Thecytosensor microphysiometer: biological applications of silicon technology.
Science 257: 1906–1912.19. Parce JW, Owicki JC, Kercso KM, Sigal GB, Wada HG, et al. (1989) Detection
of cell-affecting agents with a silicon biosensor. Science 246: 243–247.20. Vlashi E, Lagadec C, Vergnes L, Matsutani T, Masui K, et al. (2011) Metabolic
state of glioma stem cells and nontumorigenic cells. Proc Natl Acad Sci U S A
108: 16062–16067.21. Hill BG, Dranka BP, Zou L, Chatham JC, Darley-Usmar VM (2009)
Importance of the bioenergetic reserve capacity in response to cardiomyocytestress induced by 4-hydroxynonenal. Biochem J 424: 99–107.
22. Huttemann M, Lee I, Pecinova A, Pecina P, Przyklenk K, et al. (2008)
Regulation of oxidative phosphorylation, the mitochondrial membranepotential, and their role in human disease. J Bioenerg Biomembr 40: 445–456.
23. Birket MJ, Orr AL, Gerencser AA, Madden DT, Vitelli C, et al. (2011) Areduction in ATP demand and mitochondrial activity with neural differentiation
of human embryonic stem cells. J Cell Sci 124: 348–358.24. Wu M, Neilson A, Swift AL, Moran R, Tamagnine J, et al. (2007)
Multiparameter metabolic analysis reveals a close link between attenuated
mitochondrial bioenergetic function and enhanced glycolysis dependency inhuman tumor cells. Am J Physiol Cell Physiol 292: C125–136.
25. Qian W, Van Houten B (2010) Alterations in bioenergetics due to changes inmitochondrial DNA copy number. Methods 51: 452–457.
26. Hersey P, Watts RN, Zhang XD, Hackett J (2009) Metabolic approaches to
treatment of melanoma. Clin Cancer Res 15: 6490–6494.27. Vander Heiden MG (2011) Targeting cancer metabolism: a therapeutic window
opens. Nat Rev Drug Discov 10: 671–684.28. Hanahan D, Weinberg RA (2011) Hallmarks of cancer: the next generation. Cell
144: 646–674.29. Blackman RK, Cheung-Ong K, Gebbia M, Proia DA, He S, et al. (2012)
Mitochondrial electron transport is the cellular target of the oncology drug
elesclomol. PLoS One 7: e29798.
30. Gnaiger E, Lassnig B, Kuznetsov A, Rieger G, Margreiter R (1998)
Mitochondrial oxygen affinity, respiratory flux control and excess capacity of
cytochrome c oxidase. J Exp Biol 201: 1129–1139.
31. Metallo CM, Gameiro PA, Bell EL, Mattaini KR, Yang J, et al. (2012)
Reductive glutamine metabolism by IDH1 mediates lipogenesis under hypoxia.
Nature 481: 380–384.
32. Filipp FV, Scott DA, Ronai ZA, Osterman AL, Smith JW (2012) Reverse TCA
cycle flux through isocitrate dehydrogenases 1 and 2 is required for lipogenesis in
hypoxic melanoma cells. Pigment Cell Melanoma Res 25: 375–383.
33. Buchet K, Godinot C (1998) Functional F1-ATPase essential in maintaining
growth and membrane potential of human mitochondrial DNA-depleted rho
degrees cells. J Biol Chem 273: 22983–22989.
34. Warburg O (1956) On the origin of cancer cells. Science 123: 309–314.
35. Kallinowski F, Schlenger KH, Runkel S, Kloes M, Stohrer M, et al. (1989)
Blood flow, metabolism, cellular microenvironment, and growth rate of human
tumor xenografts. Cancer Res 49: 3759–3764.
36. Berridge MV, Tan AS (2010) Effects of mitochondrial gene deletion on
tumorigenicity of metastatic melanoma: reassessing the Warburg effect.
Rejuvenation Res 13: 139–141.
37. Scott DA, Richardson AD, Filipp FV, Knutzen CA, Chiang GG, et al. (2011)
Comparative metabolic flux profiling of melanoma cell lines: beyond the
Warburg effect. J Biol Chem 286: 42626–42634.
38. Kong Q, Beel JA, Lillehei KO (2000) A threshold concept for cancer therapy.
Med Hypotheses 55: 29–35.
39. Kuphal S, Winklmeier A, Warnecke C, Bosserhoff AK (2010) Constitutive HIF-
1 activity in malignant melanoma. Eur J Cancer 46: 1159–1169.
40. Semenza GL (2010) HIF-1: upstream and downstream of cancer metabolism.
Curr Opin Genet Dev 20: 51–56.
41. Wang X, Katayama A, Wang Y, Yu L, Favoino E, et al. (2011) Functional
characterization of an scFv-Fc antibody that immunotherapeutically targets the
common cancer cell surface proteoglycan CSPG4. Cancer Res 71: 7410–7422.
42. Sondergaard JN, Nazarian R, Wang Q, Guo D, Hsueh T, et al. (2010)
Differential sensitivity of melanoma cell lines with BRAFV600E mutation to the
specific Raf inhibitor PLX4032. J Transl Med 8: 39.
43. Sosman J, Kim K, Schuchter L, Gonzalez R, Pavlick A, et al. (2012) Antitumor
activity of vemurafenib in previously treated patients with BRAFV600 mutated
metastatic melanoma (BRIM2). N Engl J Med 366: 707–714.
44. Silverthorn CF, Alani RM (2010) Glyceraldehyde-3-phosphate dehydrogenase
expression is altered by hypoxia in melanoma cells and primary human
melanocytes. Melanoma Res 20: 61–63.
45. Flint MS, Kim G, Hood BL, Bateman NW, Stewart NA, et al. (2009) Stress
hormones mediate drug resistance to paclitaxel in human breast cancer cells
through a CDK-1-dependent pathway. Psychoneuroendocrinology 34: 1533–
1541.
46. Moschos SJ, Dodd NR, Jukic DM, Fayewicz SL, Wang X, et al. (2009)
Suppressing the high-level expression and function of ATM in advanced-stage
melanomas does not sensitize the cells to ionizing radiation. Cancer Biol Ther 8:
1815–1825.
47. Dykstra KM, Pokusa JE, Suhan J, Lee TH (2010) Yip1A structures the
mammalian endoplasmic reticulum. Mol Biol Cell 21: 1556–1568.
Action Mechanism of Elesclomol in Melanoma Cells
PLOS ONE | www.plosone.org 13 August 2012 | Volume 7 | Issue 8 | e40690