Embed Size (px)
Citation preview
© 2019 JETIR May 2019, Volume 6, Issue 5 www.jetir.org (ISSN-2349-5162)
JETIR1905A62 Journal of Emerging Technologies and Innovative Research (JETIR) www.jetir.org 368
Mode choice analysis of Trips of Urban Residents
using Multinomial Logit Model
1R. N. Shukla, 2Aniket D. Bhola, 3P. J. Gundaliya, 4L. B. Zala 1Ph.D Scholar, Civil Engineering, Gujarat Technological University, Ahmedabad, India,
2 PG Student, L.D. College of Engineering, Ahmedabad, India, 3Professor, Department of Civil Engineering, L.D. College of Engineering, Ahmedabad, India
4Professor, Department of Civil Engineering, Birla Vishwakarma Mahavidhyalya, Vallabhvidhyanagar, India
Abstract: An efficient transportation system is necessary for the development and growth of economy of a growing country like
India. The population of developing cities like Ahmedabad in India are continuously increasing. Understanding the mode choice
preferences of urban residents by identifying different parameters affecting the selection of a specific mode are necessary. Mode
choice analysis forms an integral part of transportation planning. The private vehicle ownership as number of two-wheeler and four-
wheeler increasing rapidly. Mode choice behaviour of urban inhabitants plays an important role in transportation planning decisions.
Choice of a particular mode affect the general efficiency of travel within the city. For mode choice modelling different techniques
are available. Use of Multinomial logit model (MNL) are found to be efficient in estimating the different mode shares in a scenario
where more than two choices of modes of travel are available for a trip maker. Socio-economic parameters and trip information are
important factors for development of the utility function model for different modes of travel. Travel time, Travel cost, Travel length
and income of trip makers are major affecting parameters on selection of a particular modes in urban area. Utility functions are
developed based upon these parameters. TransCAD software used for development of utility model. Probability of different mode
of travel has been derived for selected study area.
Keywords: Mode choice, Population, Probability, Transportation planning, Utility function
I. INTRODUCTION
Transportation planning is an important part for development and growth of country’s economy. Travel behavior analysis and
modeling is essential in transportation planning. Increase in population of developing countries like India number of captive transit
rider and choice transit riders are also increasing. Use of specific mode of travel of any area depends on Travel characteristics and
socio-economic characteristics of urban inhabitants. Trip makers have choice to select the different mode based on these
characteristics. The process of proportionate division of total number of persons trips between different modes of travel in terms of
fraction, ratio or percentage is called as Mode choice analysis. Mode choice analysis is the process of arriving at a decision about
which mode to use under a set of circumstances. More use of private vehicles increases the problems of traffic, congestion, vehicle
parking, delay, air pollution, noise pollution and increase in travel time. Efficiency of road space reduces due to a greater number
of private vehicle users. Use of public transport facilities can increase the efficiency of road and also solve the problems of traffic
congestion and vehicle parking. To minimize various problems of urban area, mode shift from private vehicle to personal vehicle
for transportation planning is required. For Transportation planning it is necessary to find out percentage of users with specific
mode of travel.
Comparison of Public and Private Transportation modes are shown in figure 1 below. As number of private vehicle users are
increasing more space is occupied by the vehicles and different problems of transportation arises.
Figure 1: Comparison of Public and Private Transportation
© 2019 JETIR May 2019, Volume 6, Issue 5 www.jetir.org (ISSN-2349-5162)
JETIR1905A62 Journal of Emerging Technologies and Innovative Research (JETIR) www.jetir.org 369
MULTINOMIAL LOGIT (MNL) MODEL
The MNL model structure has been widely used for both urban and intercity mode choice models primarily due to its simple
mathematical form, ease of estimation and interpretation, and the ability to add or remove choice alternatives. These are found to
be efficient in estimating the different mode shares in a scenario where more than two choices of modes of travel are available for
a trip maker. Discrete choice models statistically relate the choice made by each persons to the attributes of the person and the
attributes of the alternatives available to the person. The MNL model gives the choice probabilities of each alternative as a function
of the systematic portion of the utility of all the alternatives.
𝑃𝑟(𝑖) = Exp(Ui)
∑ exp(𝑈𝑗)𝐽𝑗=1
Where, Pr(i) = probability of the decision maker choosing alternative “i” and Uj = systematic component of the utility of
alternative “j”.
Utility of different mode of travel can be derived by following equation
U = a0+a1x1+a2x2+……..+ arxr
Where, a0, a1, …ar is the coefficient and x1, x2….xr is the variables like income, travel cost, travel time, trip length etc.
II. STUDY AREA
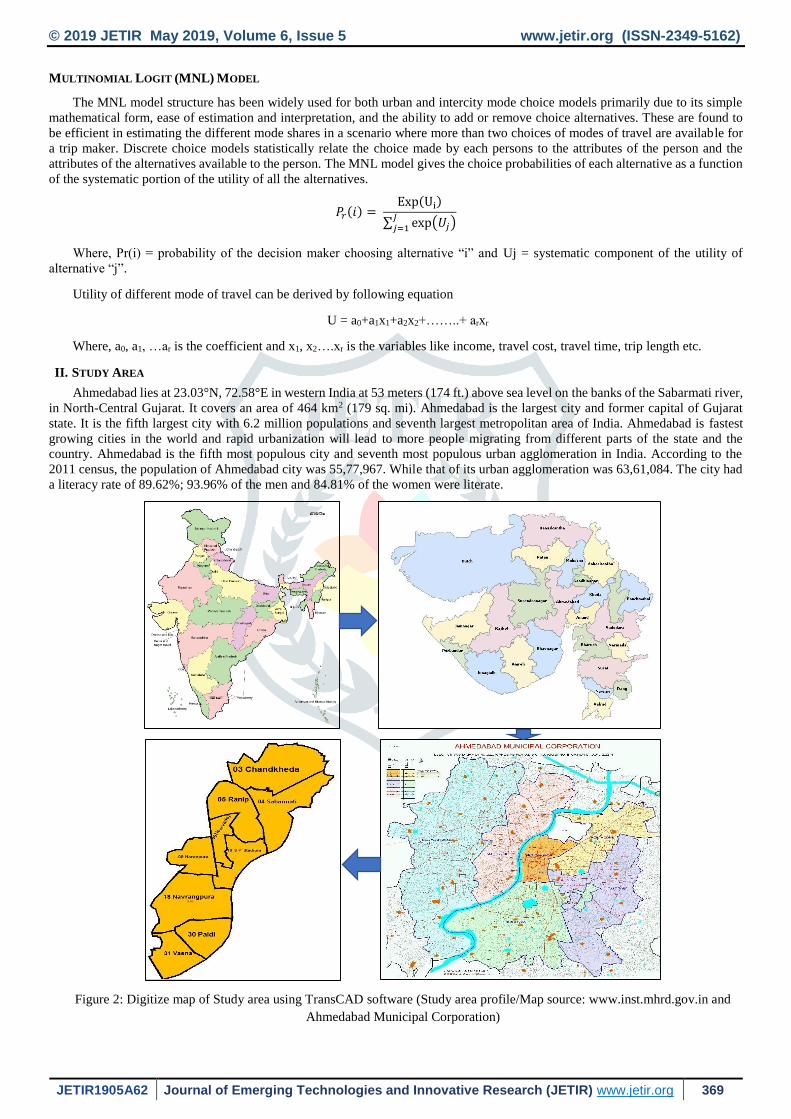
Ahmedabad lies at 23.03°N, 72.58°E in western India at 53 meters (174 ft.) above sea level on the banks of the Sabarmati river,
in North-Central Gujarat. It covers an area of 464 km2 (179 sq. mi). Ahmedabad is the largest city and former capital of Gujarat
state. It is the fifth largest city with 6.2 million populations and seventh largest metropolitan area of India. Ahmedabad is fastest
growing cities in the world and rapid urbanization will lead to more people migrating from different parts of the state and the
country. Ahmedabad is the fifth most populous city and seventh most populous urban agglomeration in India. According to the
2011 census, the population of Ahmedabad city was 55,77,967. While that of its urban agglomeration was 63,61,084. The city had
a literacy rate of 89.62%; 93.96% of the men and 84.81% of the women were literate.
Figure 2: Digitize map of Study area using TransCAD software (Study area profile/Map source: www.inst.mhrd.gov.in and
Ahmedabad Municipal Corporation)
© 2019 JETIR May 2019, Volume 6, Issue 5 www.jetir.org (ISSN-2349-5162)
JETIR1905A62 Journal of Emerging Technologies and Innovative Research (JETIR) www.jetir.org 370
Figure 2 shows the map of study area which is digitize using TransCAD software and ward boundaries of study area considered
for mode choice analysis according to Ahmedabad Municipal Corporation Map.
There are mainly two public transport systems exists in Ahmedabad which are: Ahmedabad municipal transport service
(AMTS) and Bus rapid transit system (BRTS). The AMTS has maximum coverage in all the zones of the city. The mass transit
metro system, for the cities of Ahmedabad and Gandhinagar is under construction since March 2015. The North-South and East-
West corridors are expected to complete by 2019.
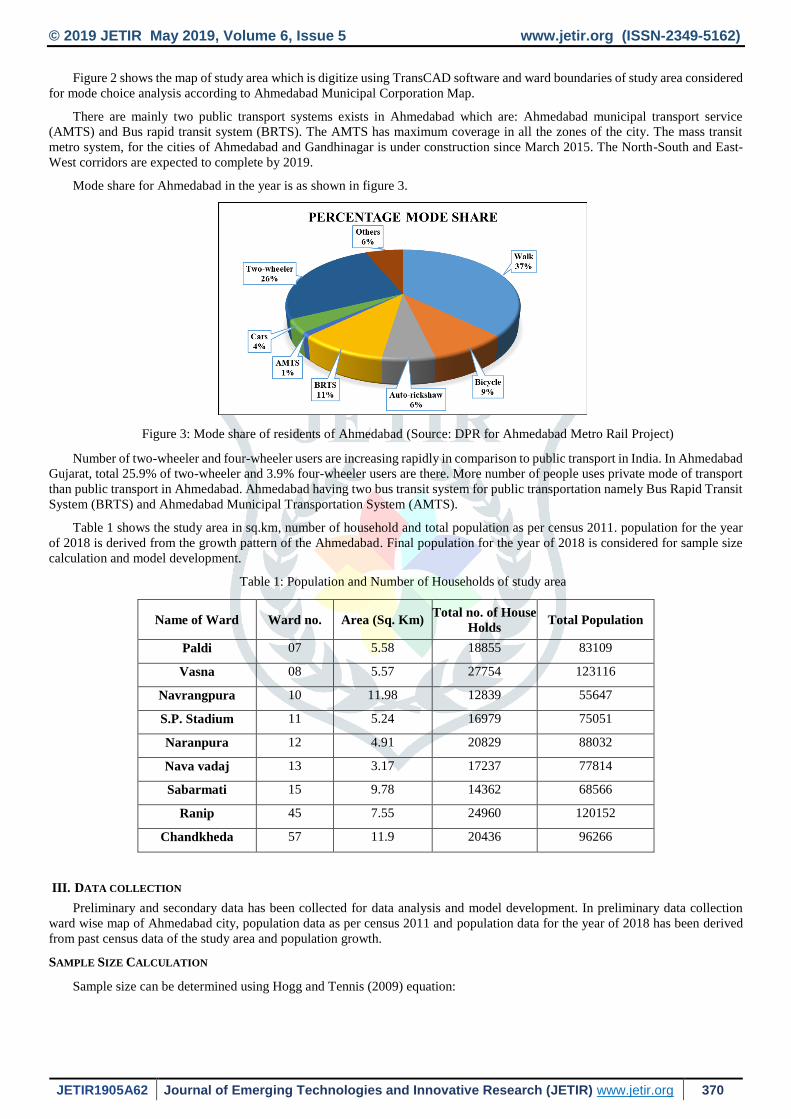
Mode share for Ahmedabad in the year is as shown in figure 3.
Figure 3: Mode share of residents of Ahmedabad (Source: DPR for Ahmedabad Metro Rail Project)
Number of two-wheeler and four-wheeler users are increasing rapidly in comparison to public transport in India. In Ahmedabad
Gujarat, total 25.9% of two-wheeler and 3.9% four-wheeler users are there. More number of people uses private mode of transport
than public transport in Ahmedabad. Ahmedabad having two bus transit system for public transportation namely Bus Rapid Transit
System (BRTS) and Ahmedabad Municipal Transportation System (AMTS).
Table 1 shows the study area in sq.km, number of household and total population as per census 2011. population for the year
of 2018 is derived from the growth pattern of the Ahmedabad. Final population for the year of 2018 is considered for sample size
calculation and model development.
Table 1: Population and Number of Households of study area
Name of Ward Ward no. Area (Sq. Km) Total no. of House
Holds Total Population
Paldi 07 5.58 18855 83109
Vasna 08 5.57 27754 123116
Navrangpura 10 11.98 12839 55647
S.P. Stadium 11 5.24 16979 75051
Naranpura 12 4.91 20829 88032
Nava vadaj 13 3.17 17237 77814
Sabarmati 15 9.78 14362 68566
Ranip 45 7.55 24960 120152
Chandkheda 57 11.9 20436 96266
III. DATA COLLECTION
Preliminary and secondary data has been collected for data analysis and model development. In preliminary data collection
ward wise map of Ahmedabad city, population data as per census 2011 and population data for the year of 2018 has been derived
from past census data of the study area and population growth.
SAMPLE SIZE CALCULATION
Sample size can be determined using Hogg and Tennis (2009) equation:
© 2019 JETIR May 2019, Volume 6, Issue 5 www.jetir.org (ISSN-2349-5162)
JETIR1905A62 Journal of Emerging Technologies and Innovative Research (JETIR) www.jetir.org 371
n = Z2*p*q
C2
Where; Z = Z value (e.g. 1.96 for 95% confidence level), p = percentage picking a choice, expressed as decimal (0.5 used for
sample size needed), c = confidence interval, expressed as decimal (e.g., .04 = ±4%), Confidence level: 95% and n = sample size
for infinite population
Sample size = 𝑛
1+ (𝑛−1)
𝑃𝑜𝑝𝑢𝑙𝑎𝑡𝑖𝑜𝑛
If family size is 4.5 then final sample size = 599.75/4.5 = 132. Required sample size for different wards of study area are
calculated and shown in following Table 2. Sample size is taken more than required from the calculation to meet the standards of
Bureau of Public Road Manual for Household Interview Survey.
Table 2: Number of households required and surveyed
Name of Ward No. of Household
surveyed
Household by
calculation
Paldi 346 132
Vasna 149 132
Navrangpura 147 131
S.P. Stadium 297 132
Naranpura 333 132
Nava vadaj 140 132
Sabarmati 115 131
Ranip 221 132
Chandkheda 323 132
Total 2071 1186
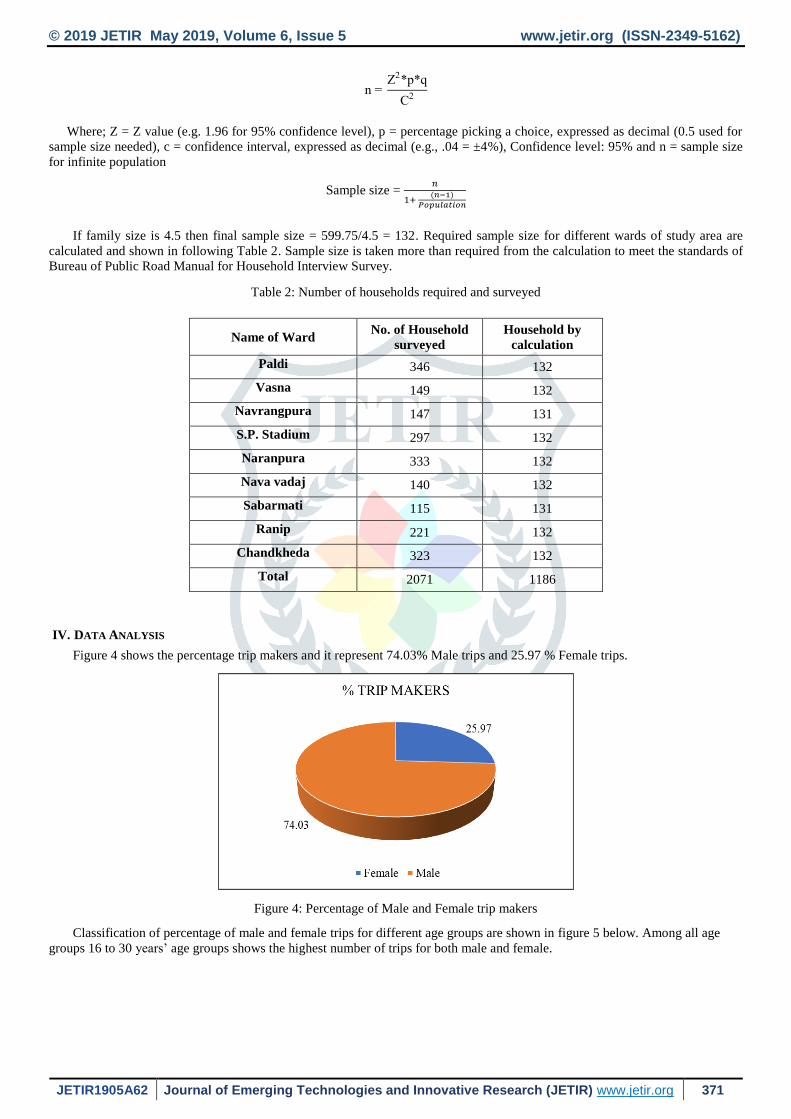
IV. DATA ANALYSIS
Figure 4 shows the percentage trip makers and it represent 74.03% Male trips and 25.97 % Female trips.
Figure 4: Percentage of Male and Female trip makers
Classification of percentage of male and female trips for different age groups are shown in figure 5 below. Among all age
groups 16 to 30 years’ age groups shows the highest number of trips for both male and female.
© 2019 JETIR May 2019, Volume 6, Issue 5 www.jetir.org (ISSN-2349-5162)
JETIR1905A62 Journal of Emerging Technologies and Innovative Research (JETIR) www.jetir.org 372
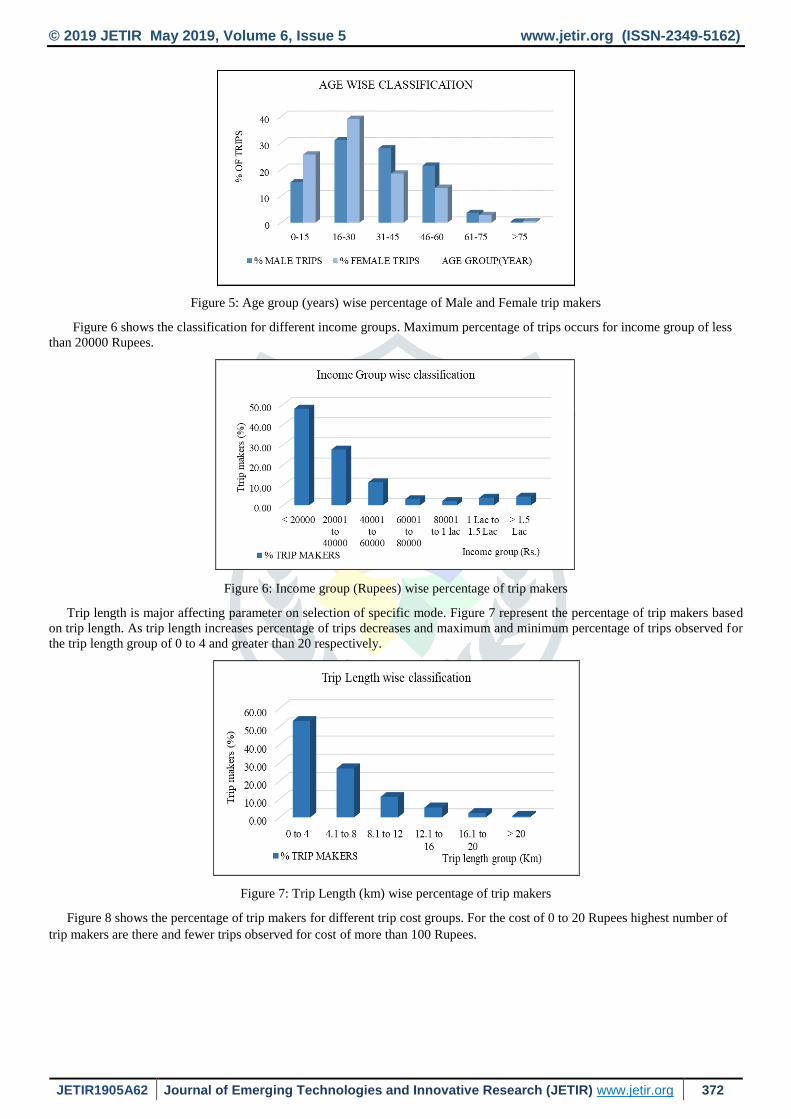
Figure 5: Age group (years) wise percentage of Male and Female trip makers
Figure 6 shows the classification for different income groups. Maximum percentage of trips occurs for income group of less
than 20000 Rupees.
Figure 6: Income group (Rupees) wise percentage of trip makers
Trip length is major affecting parameter on selection of specific mode. Figure 7 represent the percentage of trip makers based
on trip length. As trip length increases percentage of trips decreases and maximum and minimum percentage of trips observed for
the trip length group of 0 to 4 and greater than 20 respectively.
Figure 7: Trip Length (km) wise percentage of trip makers
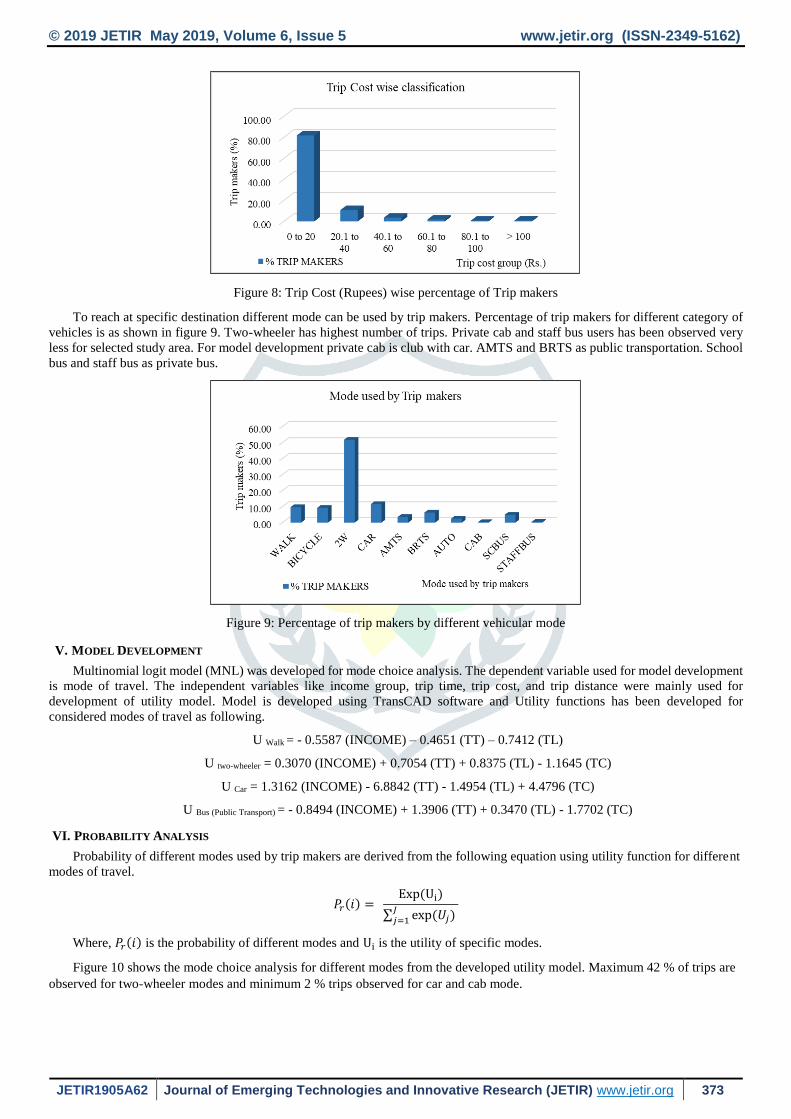
Figure 8 shows the percentage of trip makers for different trip cost groups. For the cost of 0 to 20 Rupees highest number of
trip makers are there and fewer trips observed for cost of more than 100 Rupees.
© 2019 JETIR May 2019, Volume 6, Issue 5 www.jetir.org (ISSN-2349-5162)
JETIR1905A62 Journal of Emerging Technologies and Innovative Research (JETIR) www.jetir.org 373
Figure 8: Trip Cost (Rupees) wise percentage of Trip makers
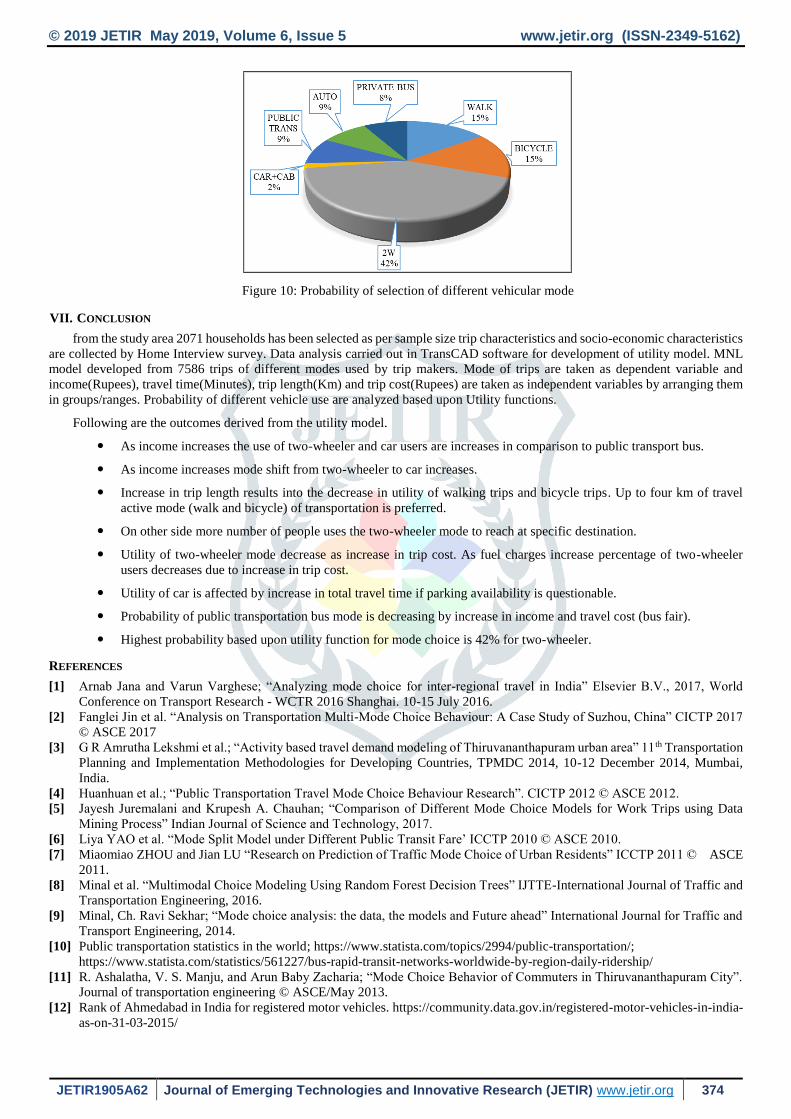
To reach at specific destination different mode can be used by trip makers. Percentage of trip makers for different category of
vehicles is as shown in figure 9. Two-wheeler has highest number of trips. Private cab and staff bus users has been observed very
less for selected study area. For model development private cab is club with car. AMTS and BRTS as public transportation. School
bus and staff bus as private bus.
Figure 9: Percentage of trip makers by different vehicular mode
V. MODEL DEVELOPMENT
Multinomial logit model (MNL) was developed for mode choice analysis. The dependent variable used for model development
is mode of travel. The independent variables like income group, trip time, trip cost, and trip distance were mainly used for
development of utility model. Model is developed using TransCAD software and Utility functions has been developed for
considered modes of travel as following.
U Walk = - 0.5587 (INCOME) – 0.4651 (TT) – 0.7412 (TL)
U two-wheeler = 0.3070 (INCOME) + 0.7054 (TT) + 0.8375 (TL) - 1.1645 (TC)
U Car = 1.3162 (INCOME) - 6.8842 (TT) - 1.4954 (TL) + 4.4796 (TC)
U Bus (Public Transport) = - 0.8494 (INCOME) + 1.3906 (TT) + 0.3470 (TL) - 1.7702 (TC)
VI. PROBABILITY ANALYSIS
Probability of different modes used by trip makers are derived from the following equation using utility function for different
modes of travel.
𝑃𝑟(𝑖) = Exp(Ui)
∑ exp(𝑈𝑗) 𝐽𝑗=1
Where, 𝑃𝑟(𝑖) is the probability of different modes and Ui is the utility of specific modes.
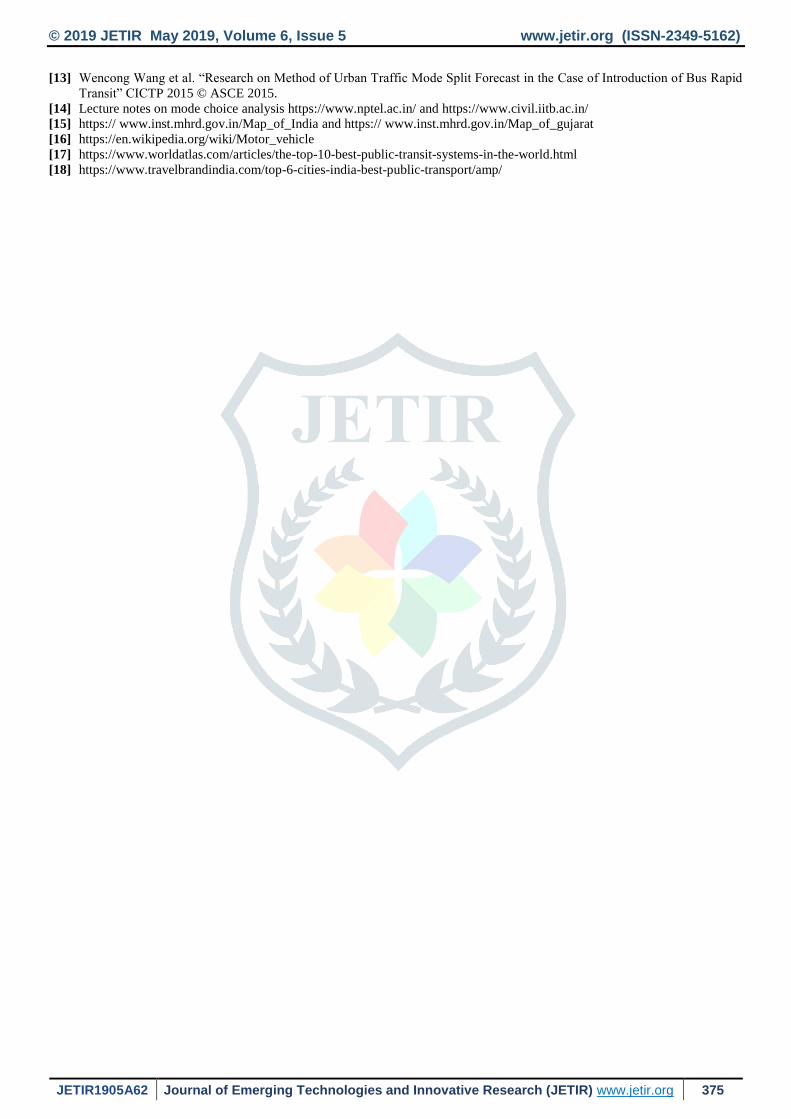
Figure 10 shows the mode choice analysis for different modes from the developed utility model. Maximum 42 % of trips are
observed for two-wheeler modes and minimum 2 % trips observed for car and cab mode.
© 2019 JETIR May 2019, Volume 6, Issue 5 www.jetir.org (ISSN-2349-5162)
JETIR1905A62 Journal of Emerging Technologies and Innovative Research (JETIR) www.jetir.org 374
Figure 10: Probability of selection of different vehicular mode
VII. CONCLUSION
from the study area 2071 households has been selected as per sample size trip characteristics and socio-economic characteristics
are collected by Home Interview survey. Data analysis carried out in TransCAD software for development of utility model. MNL
model developed from 7586 trips of different modes used by trip makers. Mode of trips are taken as dependent variable and
income(Rupees), travel time(Minutes), trip length(Km) and trip cost(Rupees) are taken as independent variables by arranging them
in groups/ranges. Probability of different vehicle use are analyzed based upon Utility functions.
Following are the outcomes derived from the utility model.
As income increases the use of two-wheeler and car users are increases in comparison to public transport bus.
As income increases mode shift from two-wheeler to car increases.
Increase in trip length results into the decrease in utility of walking trips and bicycle trips. Up to four km of travel
active mode (walk and bicycle) of transportation is preferred.
On other side more number of people uses the two-wheeler mode to reach at specific destination.
Utility of two-wheeler mode decrease as increase in trip cost. As fuel charges increase percentage of two-wheeler
users decreases due to increase in trip cost.
Utility of car is affected by increase in total travel time if parking availability is questionable.
Probability of public transportation bus mode is decreasing by increase in income and travel cost (bus fair).
Highest probability based upon utility function for mode choice is 42% for two-wheeler.
REFERENCES
[1] Arnab Jana and Varun Varghese; “Analyzing mode choice for inter-regional travel in India” Elsevier B.V., 2017, World
Conference on Transport Research - WCTR 2016 Shanghai. 10-15 July 2016.
[2] Fanglei Jin et al. “Analysis on Transportation Multi-Mode Choice Behaviour: A Case Study of Suzhou, China” CICTP 2017
© ASCE 2017
[3] G R Amrutha Lekshmi et al.; “Activity based travel demand modeling of Thiruvananthapuram urban area” 11th Transportation
Planning and Implementation Methodologies for Developing Countries, TPMDC 2014, 10-12 December 2014, Mumbai,
India.
[4] Huanhuan et al.; “Public Transportation Travel Mode Choice Behaviour Research”. CICTP 2012 © ASCE 2012.
[5] Jayesh Juremalani and Krupesh A. Chauhan; “Comparison of Different Mode Choice Models for Work Trips using Data
Mining Process” Indian Journal of Science and Technology, 2017.
[6] Liya YAO et al. “Mode Split Model under Different Public Transit Fare’ ICCTP 2010 © ASCE 2010.
[7] Miaomiao ZHOU and Jian LU “Research on Prediction of Traffic Mode Choice of Urban Residents” ICCTP 2011 © ASCE
2011.
[8] Minal et al. “Multimodal Choice Modeling Using Random Forest Decision Trees” IJTTE-International Journal of Traffic and
Transportation Engineering, 2016.
[9] Minal, Ch. Ravi Sekhar; “Mode choice analysis: the data, the models and Future ahead” International Journal for Traffic and
Transport Engineering, 2014.
[10] Public transportation statistics in the world; https://www.statista.com/topics/2994/public-transportation/;
https://www.statista.com/statistics/561227/bus-rapid-transit-networks-worldwide-by-region-daily-ridership/
[11] R. Ashalatha, V. S. Manju, and Arun Baby Zacharia; “Mode Choice Behavior of Commuters in Thiruvananthapuram City”.
Journal of transportation engineering © ASCE/May 2013.
[12] Rank of Ahmedabad in India for registered motor vehicles. https://community.data.gov.in/registered-motor-vehicles-in-india-
as-on-31-03-2015/
© 2019 JETIR May 2019, Volume 6, Issue 5 www.jetir.org (ISSN-2349-5162)
JETIR1905A62 Journal of Emerging Technologies and Innovative Research (JETIR) www.jetir.org 375
[13] Wencong Wang et al. “Research on Method of Urban Traffic Mode Split Forecast in the Case of Introduction of Bus Rapid
Transit” CICTP 2015 © ASCE 2015.
[14] Lecture notes on mode choice analysis https://www.nptel.ac.in/ and https://www.civil.iitb.ac.in/
[15] https:// www.inst.mhrd.gov.in/Map_of_India and https:// www.inst.mhrd.gov.in/Map_of_gujarat
[16] https://en.wikipedia.org/wiki/Motor_vehicle
[17] https://www.worldatlas.com/articles/the-top-10-best-public-transit-systems-in-the-world.html
[18] https://www.travelbrandindia.com/top-6-cities-india-best-public-transport/amp/


![Transportation sustainability is largely being measured by ... · BUS RAPID TRANSIT SYSTEM [BRTS] 1. Initiated in Ahmedabad the first BRTS Project. 2. Ahmedabad Municipal Corporation](https://img.pdfslide.net/doc/110x75/5f09d03f7e708231d4289c3b/transportation-sustainability-is-largely-being-measured-by-bus-rapid-transit.jpg)