Embed Size (px)
Citation preview

HAL Id: inserm-00134397https://www.hal.inserm.fr/inserm-00134397
Submitted on 27 Mar 2007
HAL is a multi-disciplinary open accessarchive for the deposit and dissemination of sci-entific research documents, whether they are pub-lished or not. The documents may come fromteaching and research institutions in France orabroad, or from public or private research centers.
L’archive ouverte pluridisciplinaire HAL, estdestinée au dépôt et à la diffusion de documentsscientifiques de niveau recherche, publiés ou non,émanant des établissements d’enseignement et derecherche français ou étrangers, des laboratoirespublics ou privés.
Model-based interpretation of cardiac beats byevolutionary algorithms: signal and model interaction.
Alfredo Hernández, Guy Carrault, Fernando Mora, Alain Bardou
To cite this version:Alfredo Hernández, Guy Carrault, Fernando Mora, Alain Bardou. Model-based interpretation ofcardiac beats by evolutionary algorithms: signal and model interaction.. Artificial Intelligence inMedicine, Elsevier, 2002, 26 (3), pp.211-35. �10.1016/S0933-3657(02)00078-7�. �inserm-00134397�

1
Model-based interpretation of cardiac beats by 1
evolutionary algorithms: signal and model interaction 2
Alfredo I. Hernández*, Guy Carrault*, Fernando Mora**, Alain Bardou* 3
*Laboratoire Traitement du Signal et de l'Image. Université de Rennes 1. 4
Campus de Beaulieu Bât 22. 35042 Rennes, France. 5
**Grupo de Bioingeniería y Biofísica Aplicada. Universidad Simón Bolívar. 6
Apartado 89000. Caracas, Venezuela. 7
8
Corresponding author: Alfredo I. Hernández. 9
Tel: +(33)2 99 28 62 29 Fax:+(33) 2 99 28 69 17 10
E-mail: [email protected] 11
12
ABSTRACT 13
This paper presents a new approach for cardiac beat interpretation, based on a direct integration 14
between a model and observed ECG signals. Physiological knowledge is represented by means of a 15
semi-quantitative model of the cardiac electrical activity. The interpretation of cardiac beats is 16
formalized as an optimization problem, by minimizing an error function defined between the model's 17
output and the observations. Evolutionary algorithms are used as the search technique in order to obtain 18
the set of model parameters reproducing at best the observed phenomena. Examples of model 19
adaptation to three different kinds of cardiac beats are presented. Preliminary results show the 20
potentiality of this approach to reproduce and explain complex pathological disorders and to better 21
localize their origin. 22
23
Keywords: Cardiac rhythm interpretation, Model-based systems, Evolutionary Algorithms. 24
25
1 INTRODUCTION 26
Computer-assisted cardiac rhythm interpretation has been considered a very important issue in the 27
biomedical field. Although there have been major contributions to this area, the poor performance of 28
HA
L author manuscript inserm
-00134397, version 1
HAL author manuscriptArtif Intell Med 11/2002; 26(3): 211-35

2
current automatic systems is an important drawback in their introduction into routine clinical practice. 1
During the last decade, large efforts have been directed to integrate medical knowledge into the 2
interpretation process, in order to develop “intelligent monitoring” systems. Despite its limitations, this 3
approach has shown promise in improving automatic interpretation of clinical data [23]. 4
Integration of medical knowledge can be done by distinguishing two main representation levels: 5
"shallow" or experiential knowledge and "deep" knowledge. By directly mapping experiential 6
knowledge into a computer-assisted system, an expert or knowledge-based system (KBS) can be 7
implemented. Most of the current systems for medical diagnosis have been developed following this 8
methodology. Deep knowledge can be introduced by means of model-based systems (MBS), in which a 9
model of the underlying physiology is built to obtain a useful explanation of the observation, leading to 10
a comprehensive and compact knowledge representation that can be applied for diagnosis or for 11
prediction. A stepping-stone in the practical application of MBS to dynamic systems has been the 12
implementation of the interface between model and observations, as well as the stages of hypothesis 13
generation and machine reasoning, often difficult to define. This paper presents a new approach for the 14
interpretation of cardiac beats, combining model-based reasoning and evolutionary computing, which 15
is part of a system named CARMEM (Cardiac Arrhythmia Recognition by Model-based ECG 16
Matching), being developed in our laboratory [9]. This approach directly integrates observed ECG 17
signals with a semi-qualitative cardiac model by: i) defining an error function between the model's 18
output and the observations and ii) applying evolutionary algorithms to adapt the model parameters in 19
order to minimize the observed error. 20
After a brief review of current MBS for cardiac arrhythmia interpretation, the proposed approach is 21
described. Three beat interpretation examples are also presented, showing the potentialities and current 22
limitations of the approach. 23
24
1.1 STATE OF THE ART 25
The initial efforts towards the development of a model-based system for the analysis and diagnosis 26
of cardiac arrhythmias can be summarized into four representative systems, each one possessing its 27
own peculiarities: "KARDIO" [2], the set of "Ticker" models [12], "EINTHOVEN" [25] and 28
"HOLMES" [6]. 29
HA
L author manuscript inserm
-00134397, version 1

3
KARDIO is a well-known system, often used as a textbook example of machine-generated 1
knowledge. It consists of a set of rules defining deep electrophysiological relations that permits the 2
generation of new knowledge about the observed phenomena. The other three systems are based on 3
spatio-temporal electrophysiological models of the cardiac activity, with varying degrees of detail. 4
They also present a reasoning mechanism, generally based on a hypothesize-and-test paradigm, 5
allowing the generation of a set of explanations, followed by a pruning phase, in order to keep the most 6
significant interpretations. However, among the systems mentioned, only EINTHOVEN presents a 7
complete reasoning structure that has been evaluated on a number of different rhythms [26]. 8
Besides the limitation in the explanation of pathological rhythms, current MBS’s lack a practical 9
way of associating the modeled knowledge with the clinical observations. Usually, a set of hand-made 10
annotations about occurrence of atrial and ventricular activities are employed, accompanied, in some 11
cases (EINTHOVEN and HOLMES), with a qualitative morphological description of each observed 12
ECG wave. The absence of a direct automatic integration of model and observed phenomena represents 13
a huge limitation of current MBS in their on-line interpretation of cardiac activity. 14
1.2 PROPOSED APPROACH 15
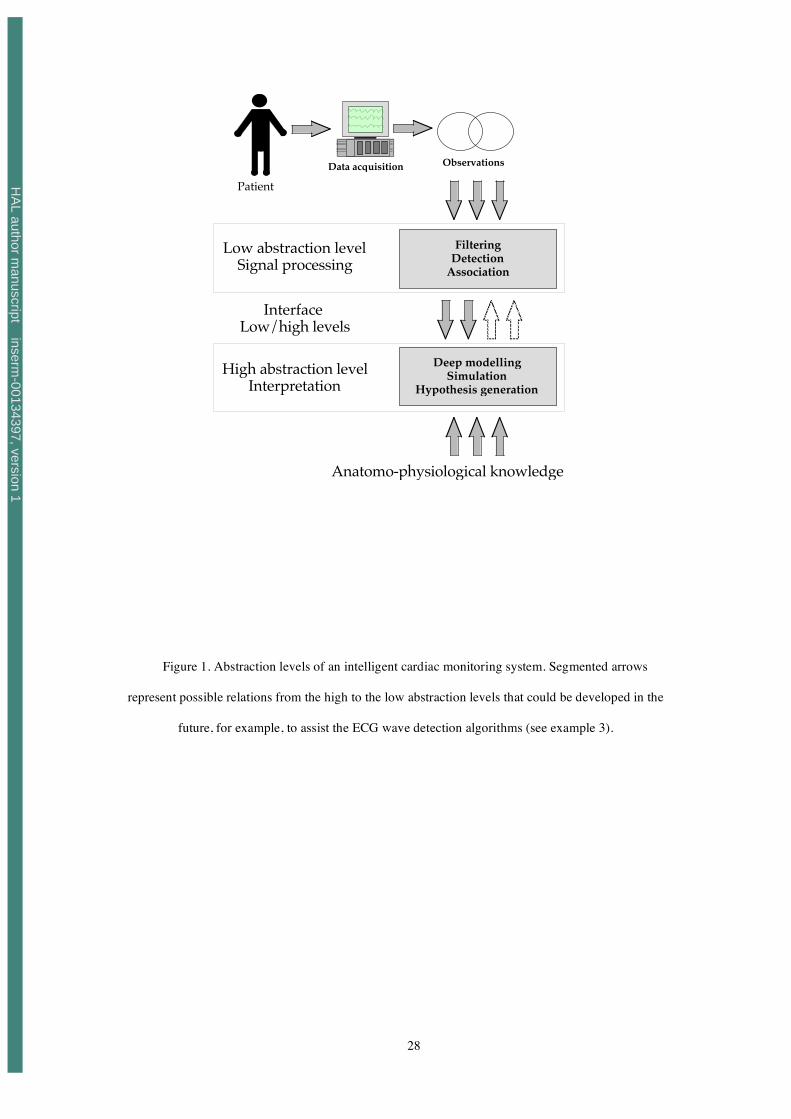
Two major abstraction levels can be identified in any intelligent monitoring system (see Figure 1): 16
A lower abstraction level, dedicated to the preprocessing of the observed activity and a higher 17
abstraction level, concerned with the interpretation of the observed phenomena. 18
19
20
INSERT Figure 1 HERE. 21
22
In the proposed system for cardiac diagnosis, the lower level is responsible for detecting the main 23
cardiac events, for example, occurrence of atrial and ventricular activities (P-wave and QRS complex 24
of the ECG, respectively). Low level signal processing can be regarded as a very difficult problem in 25
the presence of noisy data, typically measured in coronary care units (CCU) or in emergency and 26
ambulatory monitoring. Improvement of the detection performance in these conditions has been an 27
important research line undertaken in our laboratory. Recently, a new approach that exploits the 28
complementary information extracted from different sensors has been proposed [10]. 29
HA
L author manuscript inserm
-00134397, version 1

4
The higher abstraction level takes advantage of the information obtained from the low-level and 1
integrates it with medical knowledge, in order to propose an interpretation of the observed phenomena. 2
Three key aspects have to be addressed for such model-based ECG interpretation: 3
4
• Interfacing clinical observations with the model: Once the events of interest have been detected 5
from the acquired signals, this stage calculates an error function indicating the likelihood of a 6
given diagnostic hypothesis (represented as a set of model parameters) to explain the 7
observation. 8
9
• Intra-beat model adaptation: Changes model parameters in order to reproduce and explain 10
individual beats. 11
12
• Inter-beat model adaptation: Adjusts the parameters of the model so as to reproduce the 13
observed cardiac rhythm (or a sequence of beats), by using parameters found during the intra-14
beat adaptation process. 15
16
This paper concentrates on the two first aspects. A preliminary inter-beat adaptation method has 17
been presented elsewhere [7]. 18
2 OVERVIEW OF CARMEM 19
CARMEM contains a dynamic, semi-quantitative model of the cardiac electrical activity, 20
implemented in Simulink, using a cellular automata approach [9]. This model is inspired on a previous 21
cardiac model [19, 20], developed in our laboratory during the 90’s, and has been reengineered 22
specifically for its integration into an on-line, model-based system. The main features of the 23
CARMEM’s model are: 24
• Sufficient physiological deep knowledge to simulate normal and major rhythm and conduction 25
disorders, 26
• An abstraction level similar to that cardiologists use for cardiac arrhythmia diagnosis, 27
• Direct physiological interpretation of its internal parameters, 28
• An open architecture facilitating the integration of new knowledge (or new models), 29
HA
L author manuscript inserm
-00134397, version 1

5
• A meta-level allowing the generation of explicit explanations, as well as an approach to 1
dynamically adapt its structure and internal parameters. 2
3
The model can be broken down into three different levels: i) Structural level, ii) Heart conduction 4
and ECG synthesis level and iii) Meta-level. 5
2.1 STRUCTURAL LEVEL 6
The heart is modeled as a set of macro-cellular structures of two kinds representing nodal and 7
myocardial tissues respectively. The structures are implemented by means of two different cellular 8
automata one nodal (NA) and one myocardial (MA). The basic physiological model presents the same 9
abstraction level as EINTHOVEN or HOLMES and is composed of 16 automata (ten NA and six MA), 10
representing the following cardiac structures: 11
• the sino-atrial node (SAN); 12
• the upper and lower parts of internodal atrial tracts (UANT and LANT), which, although 13
historically questioned, can help to explain some atrial conduction abnormalities [17]; 14
• the atrio-ventricular node (AVN); 15
• the upper and lower parts of the bundle of His (UH and LH); 16
• the upper and lower, left and right bundle branches (ULBB, URBB, LLBB and LRBB), 17
which have been artificially segmented in this way in order to facilitate the simulation of 18
some particular rhythms, presenting both antegrade and retrograde conductions (fusions); 19
• the upper and lower parts of both atria (UA and LA) and 20
• the upper and lower, left and right ventricles (ULV, URV, LLV and LRV). 21
New automata can be added and connected dynamically to the basic model in order to represent 22
other structures, such as ectopic pacemakers, pathological pathways like accessory pathways, etc. 23
However, as in other models presenting the same anatomo-physiological level of detail, the model 24
in CARMEM is not able to generate some particular rhythms like atrial or ventricular fibrillation or 25
flutter. These particular rhythms can be characterized by means of specific low-level signal processing 26
methods [21, 27]. 27
At any given time, each automaton can be in one of four physiological states: slow diastolic 28
depolarization (SDD) (for NA) or idle (for MA), upstroke depolarization period (UDP), absolute 29
refractory period (ARP) and relative refractory period (RRP). At the end of the UDP of a given 30
HA
L author manuscript inserm
-00134397, version 1

6
automaton, an activation impulse is sent to all the neighboring structures. In each automaton, state 1
transitions are triggered both from the inside and from outside. In the former case, a set of internal 2
parameters, representing the time associated with each physiological state, govern the transitions. In the 3
later, the automaton is externally activated by the depolarization of a neighboring structure. The 4
hysteresis properties of the cardiac tissue, namely, the cycle rate dependency of refractory periods and 5
the response to premature activations, have also been modeled in each automaton by means of simple 6
mathematical models [9]. 7
Nodal automata are characterized by 6 real-valued parameters: four parameters representing the 8
duration of each one of the physiological phases (SDD, UDP, ARP and RRP), and two others 9
corresponding to the slope (or sensibility) of the two relations describing the hysteresis properties of 10
the cardiac tissue. Myocardial automata present five parameters: the same parameters as for NA, but 11
without the duration of the SDD. All the parameters characterizing each automaton can be modified 12
dynamically (manually and/or automatically) during a simulation. For example, a nodal automaton 13
representing an ectopic foci, can be enabled or disabled during the simulation by changing its SDD 14
duration parameter (an SDD duration value defined in the model to infinity, will disable the NA). 15
A simplified piece-wise linear representation of the action potential (AP) of each structure is 16
calculated during a simulation. Simplified AP’s are also useful to automatically generate beat 17
interpretations. The individual contribution of each MA to the vectorcardiogram (VCG) is calculated 18
during the depolarization and repolarization periods of each myocardial structure by a set of VCG 19
templates (see appendix 1). 20
21
2.2 HEART CONDUCTION SYSTEM AND ECG GENERATION LEVEL 22
Connections between structures are defined at this level, according to anatomical considerations for 23
antegrade, retrograde and lateral activations. These connections, as well as those associated with 24
additional structures inserted during a simulation, can also be modified dynamically. 25
The VCG is calculated, at each time-step, by the addition of the individual contributions of all 26
myocardial structures. Since the electrical axis of the heart is considered as a dynamic parameter at this 27
level, simulation of QRS complex morphology variations derived from patient movements and 28
respiration are possible. The VCG obtained can be projected onto any chosen set of ECG leads by 29
means of a transformation matrix, using the current value of the electrical axis of the heart. Appendix 1 30
HA
L author manuscript inserm
-00134397, version 1

7
presents a brief description of the VCG/ECG synthesis process. More details can be found in [9, 14, 1
20]. 2
2.3 META-LEVEL 3
This level allows interfacing of CARMEM to other physiological models (such as a model of 4
autonomic baroreflex) that can interact with the cardiac model, or for the implementation of meta-5
algorithms, that adapt physiological parameters during dynamic cardiac rhythm simulation or 6
arrhythmia interpretation. 7
The automatic explanation of each simulated beat is also performed in this level by means of a 8
spatio-temporal representation of the cardiac conduction, known as ladder (or Lewis) diagrams [24]. 9
Each nodal structure of the model is associated with its corresponding zone on the ladder diagram, 10
according to anatomical considerations. In order to generate the diagram, the following process is 11
applied: 12
Let
!
yui and
!
yli be the upper and lower boundaries of the zone representing nodal structure i on the 13
ladder diagram,
!
t0i its initial depolarization time and
!
UDPi its duration of the depolarization period. All 14
this information is obtained directly form the model parameters and from the current value of the 15
simplified action potential of each nodal structure. A point is thus drawn on the diagram, for each 16
active nodal structure, at the position
!
t, yi( ) , where t is the current time instant and
!
yi is defined by: 17
!
yi
=
yli " yu
i
UDPit " t 0
i( ) + yui , for antegrade activations and
yui " yl
i
UDPit " t 0
i( ) + yli , for retrograde activations
#
$ % %
& % %
( 1 )
18
The left and right bundle branches are represented individually, making it easier to identify, for 19
example, the affected branch in a bundle branch block. 20
The meta-level is essential to perform model-based interpretation, allowing the definition of an 21
interface between the model and clinical observations and a way to adapt the cardiac model in order to 22
reproduce observed phenomena. 23
3 INTERFACE BETWEEN THE MODEL AND THE OBSERVATION 24
The first problem to solve is to develop an appropriate interface between the observations and the 25
output of the model. In other words, how to find a representation of the observed activity (XO= 26
HA
L author manuscript inserm
-00134397, version 1

8
g(ECGO)) which can be quantitatively compared with the activity generated by the model (XS=M(P)), 1
depending upon the set of parameters P. 2
3
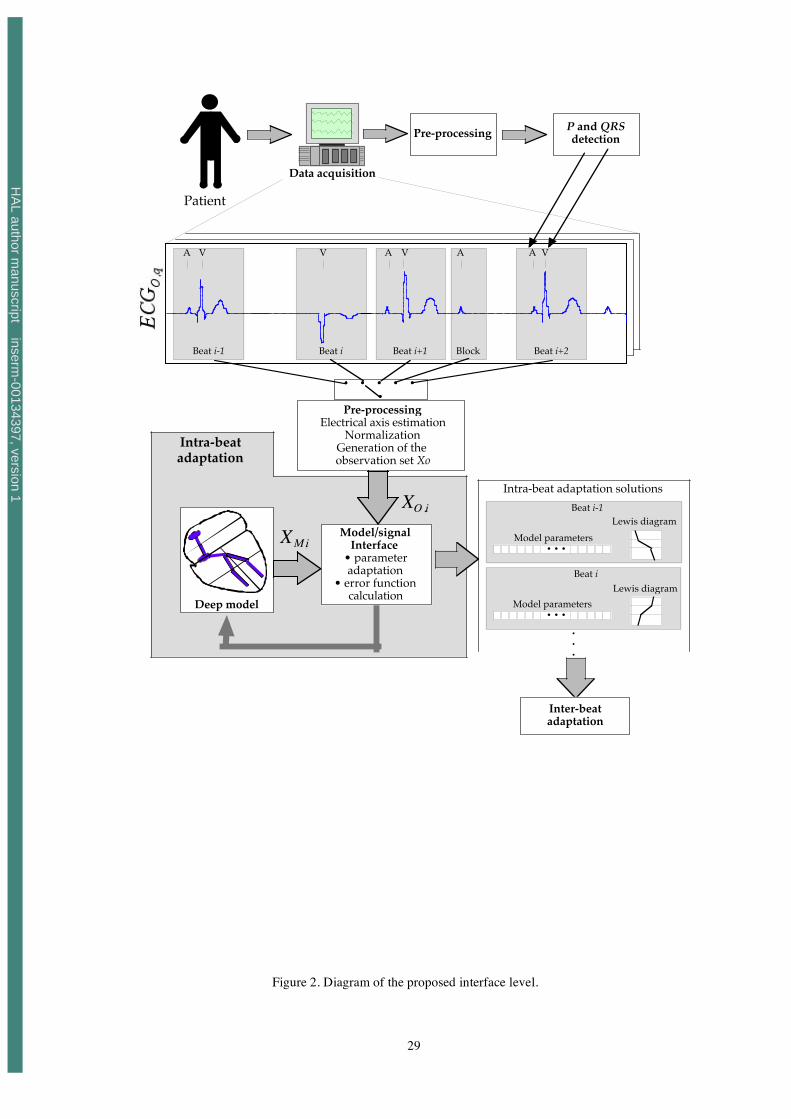
The proposed interface level is presented in Figure 2 and consists of different steps: 4
5
1 A set of acquired ECG signals is preprocessed in order to minimize the different types of noise 6
and baseline wandering. 7
8
2 Detection of observed P-waves and QRS complexes is achieved by using data fusion techniques 9
presented in [8, 10]. 10
11
3 The i-th observed beat (to be reproduced) is extracted from observed signals by means of simple 12
windowing: 13
Bi, jO(k) = ECGO, j (! i
AVO " M1 ), ...,ECGO, j (!iAVO + M2 )[ ]
T
( 2 )
14
where ECGO,j(k) is the sample at time k of lead j of the observed ECG. ! iAVO represents the instant 15
of occurrence of the i-th detected QRS and (M1+M2) is the width of the window, centered at the 16
QRS complex peak. This window may include a P-wave, appearing at instant ! iAAO . The same 17
process is applied to the synthesized signal, to construct the simulated beat, Bi, jS(k) . 18
19
4 A transformation is applied to Bi, jO(k) in order to obtain the same dynamic range as the simulated 20
beat. Also, an estimation of the electrical axis of the heart is calculated from the observed signals. 21
22
5 The model adaptation is performed. It calculates an error function between 23
XO ,i = Bi, jOk( ), ! i
AVO , ! iAAO{ } and XS ,i = Bi, j
Sk( ), ! i
AVS , ! iAAS{ } which depends on the chosen 24
intra-beat adaptation method. Bi, jSk( ) represents the i-th synthesized beat for lead j and ! i
AVS , ! iAAS , 25
the instants of appearance of the simulated QRS complex and P-wave, respectively. The best 26
estimated solution (i.e. the set of model parameters that reproduce at best the observed beat) is 27
retained for each beat and listed with its ladder diagram, which is generated automatically by the 28
HA
L author manuscript inserm
-00134397, version 1

9
model. Parameters contained in this list of intra-beat characterization are used for the explanation 1
of the whole observed rhythm. 2
3
INSERT Figure 2 HERE 4
5
Detected P-waves that are not contained in one of the Bi,mO(k) windows are considered as blocked 6
P-waves and initiate a specific adaptation process, based on the alignment of the simulated and 7
observed P-waves. 8
9
4 INTRA-BEAT ADAPTATION 10
Once the interface between observations and model output has been defined, interpretation of 11
incoming beats becomes the search of the parameter set of each modeled cardiac structure that best 12
reproduce the observed beat. Intra-beat adaptation can thus be seen as an optimization problem 13
consisting of minimizing, for each beat i, the error function of the difference between synthesized and 14
observed activity. This error function can be expressed as: 15
16
! i XO ,i ,XS,i( ) = ! i XO ,i ,M Pi( )( ). ( 3 )
17
Since the model parameters convey a direct physiological interpretation, an explanation of the i-th 18
observed beat can be obtained from the optimal set of parameters, Pi*, that minimizes this error 19
function. Nevertheless, a number of obstacles have to be overcome in order to have a meaningful and 20
practical optimization process, among them: 21
22
• Due to the semi-quantitative nature of the CARMEM model, the error function is not differentiable 23
with respect to individual parameters of each modeled structure. This aspect prevents the use of 24
deterministic optimization algorithms, such as those based on gradient descent. 25
26
• The model depends on a large number of variables. 27
28
HA
L author manuscript inserm
-00134397, version 1

10
• The parameter adaptation process, designed to reproduce the observed ECG, is an ill-posed 1
problem, comparable, in a minor scale, to the inverse problem of the electrocardiography. 2
3
These difficulties make it mandatory the use of an optimization technique which is: i) independent 4
of the existence of the derivative of the error function with respect to the model's parameters (i.e. the 5
search of solutions has to be based solely on the evaluation of the error function), ii) adapted to 6
complex problems including a great number of parameters and multiple local optima, and iii) robust. 7
Two types of optimization methods seem adequate to this problem: exhaustive search and combinatory 8
or stochastic search methods. 9
The first group was not considered here, due to their computational cost. In the second group, two 10
methods were tested in an initial phase: simulated annealing [13] and evolutionary algorithms (EA) 11
[11],[15]. Evolutionary algorithms have been the subject of intensive research during the last decade 12
and have shown to be useful in the solution of hard identification problems, including different 13
biomedical applications [18]. In EA’s, the additional property of evaluating many potential solutions at 14
the same time is particularly adapted to our problem, because it allows the definition of a set of 15
predefined beats, which are commonly observed in clinical practice, as initial solutions. Due to these 16
facts, EA’s were kept as the identification approach for the adaptation process. 17
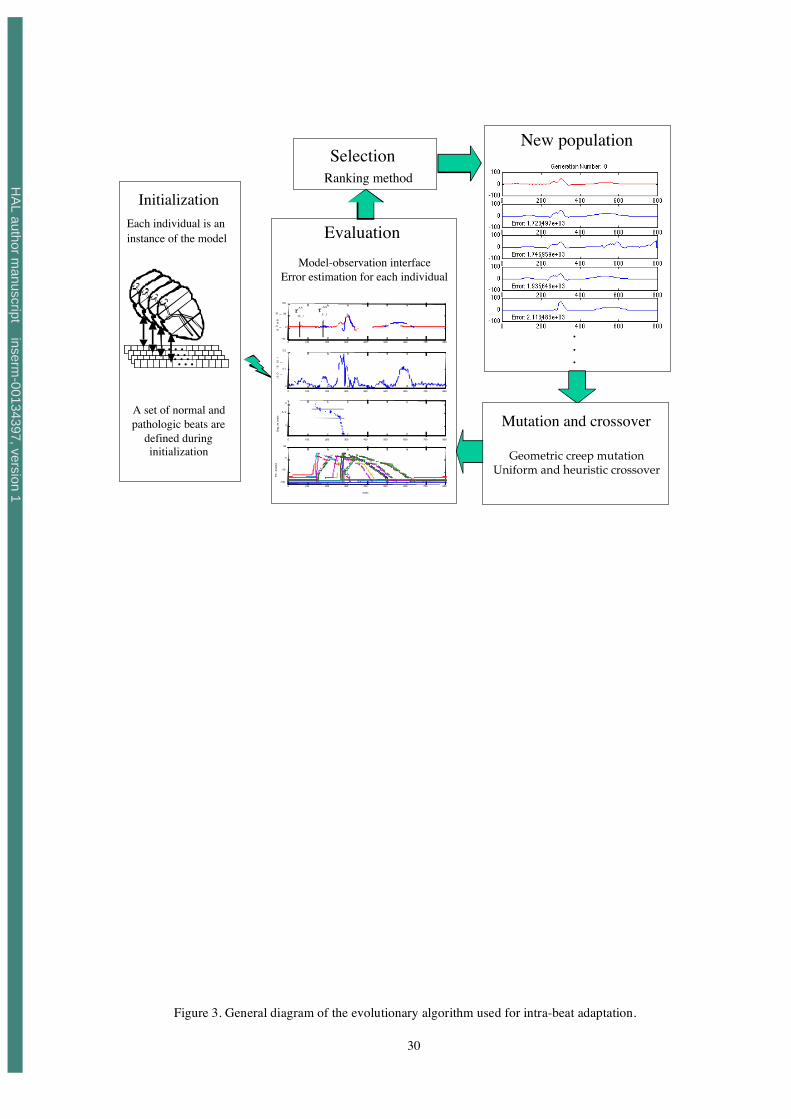
4.1 INTRA-BEAT ADAPTATION BY EVOLUTIONARY ALGORITHMS 18
Figure 3 depicts graphically the application of EA’s for intra-beat adaptation. Convergence and 19
robustness properties of EA’s have been largely studied in the literature [1, 3, 5]. These properties 20
depend upon: i) adequate individual coding, ii) proper definition of the fitness function used for the 21
evaluation of individuals and iii) selection of appropriate genetic operators for cross-over and mutation. 22
These aspects are discussed in the following paragraphs. Modifications undertaken on classic 23
evolutionary methods to integrate the physiological knowledge are also described. 24
25
INSERT Figure 3 HERE. 26
27
HA
L author manuscript inserm
-00134397, version 1

11
4.1.1 INDIVIDUAL REPRESENTATION 1
Each individual of the EA represents an instance of the whole model of CARMEM. The 2
chromosome of each individual can be seen as the concatenation of 21 segments, representing the 16 3
fundamental structures of CARMEM, 4 nodal structures, representing ectopic foci connected to each 4
modeled ventricular structure and one myocardial structure, characterizing a right free wall accessory 5
pathway. Segments of nodal structures are constituted of three real values, with temporal parameters 6
for the SDD, the UDP and the ARP. Segments associated with myocardial structures present only two 7
parameters, UDP and ARP. The two parameters of nodal and myocardial structures specifying the 8
sensibility to the hysteresis properties of the cardiac tissue, and the relative refractory period of all 9
structures, are assumed constant during the adaptation process and defined to their specific default 10
values. Thus, chromosomes are composed of G=56 real values as shown in Figure 4. Chromosome 11
definition is accompanied by a matrix indicating the possible upper and lower limits for each parameter 12
(Figure 4). This matrix is employed by the EA, in order to synthesize physiologically feasible beats, 13
during the construction of the initial population and the application of genetic operators. 14
15
INSERT Figure 4 HERE. 16
4.1.2 INITIALIZATION OF THE POPULATION 17
The initial population is constituted of 16 predefined individuals and 34 variations. Predefined 18
individuals represent beats from different origins (sino-atrial node, atrio-ventricular (A-V) node and 19
ectopic foci connected to the ventricles) and conduction disturbances (such as A-V blocks, branch 20
blocks,...). Variations are built by random selection, with replication, of one of the 16 predefined 21
individuals and by modifying, also randomly, one of its genes in the valid interval. Moreover, for the 22
adaptation of beats i> 1, the solution of the beat i-1 is also included in the initial population. 23
This initialization technique contributes to a faster convergence and an improved robustness, 24
avoiding premature convergence to a local minimum. It also allows integration of explicit medical 25
knowledge, by introducing as individuals a set of beats observed often in clinical practice. 26
HA
L author manuscript inserm
-00134397, version 1

12
4.1.3 ERROR FUNCTION AND SELECTION METHOD 1
The interface between the model and the observations, defined in section 3, is used here to calculate the 2
performance of each individual l, by means of the error function ! XO,XS( ) . Three sources of error 3
between the synthesized and the observed activities can be identified to construct the error function !: 4
1. The sample-to-sample morphological difference between the observed and synthesized beat: 5
eM (l, k ) = Bi,jO(k) ! Bi, j
S,l(k ) , k=1,…,MB ( 4 )
where Bi, jo
represents lead j of the observed beat, Bi, js ,l
is the synthesized beat for the same lead j 6
by individual l. MB is the size of the evaluation window (M1+M2=MB= 800 ms). 7
8
2. The difference between occurrence instants in the observed and synthesized P-waves ( ! iAAO and 9
! iAAS respectively) for individual l, obtained as: 10
11
eAA(l) = ! iAAO " ! i,l
AAS ( 5 )
3. The difference between observed ( ! iAVO ) and synthesized ( ! i
AVS ) QRS-complex timing, which is 12
always zero, due to the application of the procedure of QRS alignment in the interface algorithm. 13
14
15
Thus, the error function for individual l and beat i can be calculated by: 16
Fl = eM (l, k)( )k =1
MB
! +" # eAA(l) ( 6 )
17
Where constant ! " 0,1[ ] , allows to establish the relative weight of the error associated with the 18
generation of the P-wave. 19
20
Once the error function has been evaluated for each individual, selection based on the ranking 21
method, adapted for function minimization, is carried out [15]. All the information obtained from the 22
model for each individual l (i.e. time of occurrence of simulated P-waves, simulated action potentials 23
for all structures and the ladder diagram) is saved for future use during cross-over and mutation 24
operations. 25
HA
L author manuscript inserm
-00134397, version 1

13
4.1.4 KNOWLEDGE INTEGRATION INTO GENETIC OPERATORS 1
Convergence improvement and reduction of computational load of an evolutionary algorithm can 2
be achieved by means of different evolution strategies [1, 3, 4]. One of them consists in determining, 3
for a given individual l, two important values, in order to improve its performance: i) the gene, or set of 4
genes, that should be modified to improve the solution and ii) the direction of this modification, 5
whether positive or negative. This information can be compared to the error function gradient with 6
respect to each parameter. Normally, no information on the gradient is employed in genetic operators. 7
Both, the gene to modify and the direction of the modification are obtained randomly following a given 8
distribution. In the case of the intra-beat adaptation, some electrophysiological knowledge can be used 9
in order to give a higher modification probability to specific genes. Particularly, three heuristic criteria 10
have been used to improve the adaptation of the EA: 11
12
1. ECG wave duration is mainly controlled by the rapid depolarization period (UDP) of cardiac 13
structures. For example, a long QRS complex, observed in a bundle branch block, is associated 14
with a conduction delay in this structure. This first criterion (wB), that attributes a more 15
important weight to genes (q) representing the UDP period, is defined by: 16
17
!
wB (q,l ) =1 if q represents the UDP
0.5 else
" # $
( 7 )
18
2. The morphological error eM(l,k) of a specific part of the beat can be related to a set of cardiac 19
structures. For example, the morphological error of the QRS complex is related to ventricular 20
structures. This second criterion (wM) assigns a higher weight to genes deriving a higher 21
morphological error eM(l,k). This information is extracted from action potentials generated by 22
the model during the simulation. The value of the second criterion is the same for all genes q 23
of a given cardiac structure S and is given by: 24
25
wM (q, l) = eM (l, k)k=M 1S
M 2S
! , "q #S ( 8 )
26
HA
L author manuscript inserm
-00134397, version 1

14
Values M1S and M2S represent respectively the activation instant (start of the UDP) and the 1
end of the RRP period, detected from the action potential of structure S. 2
3
3. The final criterion is based upon the fact that the difference between the observed and 4
simulated times of occurrence of P-waves (i.e. the error eAA(l)) can be controlled by modifying 5
the UDP of atrio-ventricular nodal structures (i.e. the A-V node, upper and lower bundle of 6
His, etc…). This criterion (wAA) can be calculated only if the occurrence time for the observed 7
P-wave is available. It assigns a higher weight to genes representing the UDP of A-V 8
structures, by: 9
10
!
wAA(q,l) =" # e
AA(l ) if q represents the UDP of a junctional structure
0 else
$ % &
( 9 )
11
and ! " 0,1[ ]. 12
13
These criteria have been included in the EA, by calculating or assigning a weight, w(q,l), to 14
represent the modification likelihood for gene q of individual l during mutation and cross-over. The 15
final selection weight for gene q of individual l is given by: 16
17
w(q,l ) = wB(q, l) + wM (q,l ) + wAA(q,l ), q=1,…,G ( 10 )
18
The developed EA is thus driven by a mutation process (geometrical creep mutation) and by two 19
cross-over methods (uniform and heuristic cross-over) [1]. The random function generator used for 20
these operators has been modified in order to take advantage of the proposed criteria (w(q,l)), giving 21
higher modification probabilities to the genes with higher weights. 22
23
24
4.2 EVALUATION OF THE ROBUSTNESS OF THE INTRA-BEAT ADAPTATION 25
As mentioned earlier, general robustness properties of EAs have been largely studied in the 26
literature [4, 5]. However, in order to evaluate the effectiveness of the customized genetic operators and 27
HA
L author manuscript inserm
-00134397, version 1

15
the variability of the proposed beat interpretations, a robustness analysis has been designed. It is based 1
on the following steps: 2
1. 35 realizations of the intra-beat evolutionary algorithm were applied to each one of the 3
beats selected from the MIT-BIH arrhythmia database [16]. Each realization of the EA was 4
stopped when the error of the best individual of the population was lower than a predefined 5
threshold. 6
2. For each realization of the intra-beat EA, the following data were saved for further 7
analysis: i) the set of parameters of the best individual of the last generation, ii) its ladder 8
diagram, iii) the error value of the best individual and iii) the EA computation time. 9
3. Beat interpretations (ladder diagrams) obtained from the solutions of each realization of 10
the EA were compared between them, and to the annotations of the MIT-BIH database, 11
with the aid of a specialist. 12
4. The global conduction times through the atria, the atrio-ventricular junction and the left 13
and right bundle branches were calculated for each one of the 35 realizations, by adding 14
the corresponding model parameters (i.e. the conduction time through the atria equals the 15
sum of the UDP parameters of the UANT and LANT structures). These values were 16
analyzed by means of boxplots [22], in order to better quantify the variability of the 17
proposed solutions. 18
19
5 RESULTS 20
The first evaluation stage of the intra-beat adaptation process required several tests reproducing five 21
different beat morphologies, associated with distinct pathologies, in order to find appropriate parameter 22
values for the EA. The best results were obtained with a relatively high mutation probability pm (close 23
to 0.6) and a cross-over probability pr close to 0.3, corresponding to a “naïve evolution” strategy, which 24
mimics the evolution of an “asexual” population and has been used successfully on a number of 25
applications [1]. The size of the population has been fixed to 50 individuals. The stopping criterion is 26
passed if no solution improvement is found during 15 consecutive generations, or if the maximum 27
number of iterations (fixed to 400) is reached. Parameters M1 and M2 of the interface definition 28
(equation 2) have been set to 300 and 500 ms respectively. Results are calculated by using the most 29
HA
L author manuscript inserm
-00134397, version 1
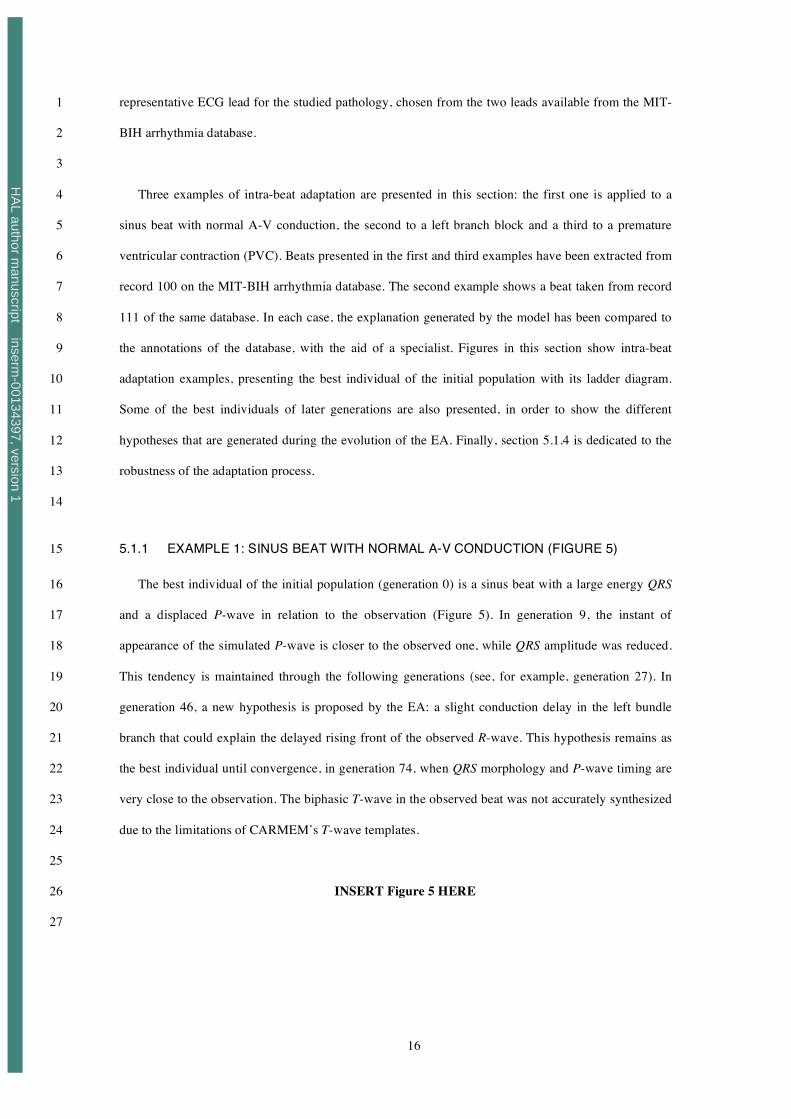
16
representative ECG lead for the studied pathology, chosen from the two leads available from the MIT-1
BIH arrhythmia database. 2
3
Three examples of intra-beat adaptation are presented in this section: the first one is applied to a 4
sinus beat with normal A-V conduction, the second to a left branch block and a third to a premature 5
ventricular contraction (PVC). Beats presented in the first and third examples have been extracted from 6
record 100 on the MIT-BIH arrhythmia database. The second example shows a beat taken from record 7
111 of the same database. In each case, the explanation generated by the model has been compared to 8
the annotations of the database, with the aid of a specialist. Figures in this section show intra-beat 9
adaptation examples, presenting the best individual of the initial population with its ladder diagram. 10
Some of the best individuals of later generations are also presented, in order to show the different 11
hypotheses that are generated during the evolution of the EA. Finally, section 5.1.4 is dedicated to the 12
robustness of the adaptation process. 13
14
5.1.1 EXAMPLE 1: SINUS BEAT WITH NORMAL A-V CONDUCTION (FIGURE 5) 15
The best individual of the initial population (generation 0) is a sinus beat with a large energy QRS 16
and a displaced P-wave in relation to the observation (Figure 5). In generation 9, the instant of 17
appearance of the simulated P-wave is closer to the observed one, while QRS amplitude was reduced. 18
This tendency is maintained through the following generations (see, for example, generation 27). In 19
generation 46, a new hypothesis is proposed by the EA: a slight conduction delay in the left bundle 20
branch that could explain the delayed rising front of the observed R-wave. This hypothesis remains as 21
the best individual until convergence, in generation 74, when QRS morphology and P-wave timing are 22
very close to the observation. The biphasic T-wave in the observed beat was not accurately synthesized 23
due to the limitations of CARMEM’s T-wave templates. 24
25
INSERT Figure 5 HERE 26
27
HA
L author manuscript inserm
-00134397, version 1

17
5.1.2 EXAMPLE 2: LEFT BUNDLE BRANCH BLOCK (FIGURE 6) 1
Figure 6 depicts intra-beat adaptation algorithm generations for a case of left bundle branch block. 2
In the beginning of the adaptation process (between generations 0 and 2), the best adapted individual 3
presents an active right free wall accessory pathway (which accounts to the energy found at the 4
beginning of the QRS, or delta wave) and a slightly delayed ventricular conduction. The hypothesis of 5
left bundle branch block is started after generation 3 (see ladder diagram of generations 3 to 73). The 6
hypothesis of right bundle branch block, present in the initial population, is later rejected because peak 7
amplitude, R and R', are inverted with respect to the observation. From the third generation on, the 8
adaptation process seeks to improve P-wave timing and QRS complex morphology. The final solution, 9
shows important conduction delays in junctional structures (characteristic of a first-degree A-V block) 10
and an important conduction delay at the left bundle branch (left bundle branch block). This solution is 11
consistent with the annotation on the database. 12
13
14
INSERT Figure 6 HERE 15
16
5.1.3 EXAMPLE 3: PREMATURE VENTRICULAR CONTRACTION (FIGURE 7) 17
In this example (Figure 7), the best individual of the initial population represents an ectopic beat of 18
ventricular origin, initiated at the inferior left ventricle with retrograde conduction to the atria. This 19
solution is also confirmed by the annotation of the database. The error is slightly reduced during the 20
following generations and, at generation 14th, an appropriate explanation of the beat is available. 21
Nevertheless, as mentioned before, CARMEM was unable to accurately model observed T-waves. This 22
leads to a situation in which later generations tend to eliminate the valid solution in order to cope with 23
T-wave morphological errors, which presents an important energy. In the 32nd generation, a new 24
hypothesis is found where the synthesized T-wave is closer to the observation. This solution exhibits a 25
first ectopic activation, starting at the left ventricle, with retrograde conduction through the left bundle 26
branch, through the His bundle and finally to the atria. At the same time, the impulse is transmitted to 27
the right bundle branch, showing an antegrade activation of the right ventricle to produce a positive T-28
wave. A new explanation is obtained in the 39th generation, where two impulses are simultaneously 29
HA
L author manuscript inserm
-00134397, version 1

18
generated (one of junctional origin and another from the left ventricle). The junctional activation 1
presents a retrograde conduction to the atria and an antegrade conduction to the ventricles. This 2
antegrade activation does not attain the depolarization of the left ventricle that has been previously 3
activated by an ectopic focus. This example shows how a beat explanation can diverge to unlikely 4
solutions in order to minimize morphological error. 5
One interesting element of these results can be observed between generations 14th and 32nd, where 6
a negative P-wave generated by the model (represented by ! and produced by the retrograde activation 7
of the atria), coincides with that of the observed beat (represented by "). It is possible to see how it is 8
feasible to take advantage of knowledge within the model to generate valid hypotheses on wave 9
locations, especially the P-waves, which are often very difficult to detect when they are embedded into 10
the QRS complex. 11
12
13
INSERT Figure 7 HERE 14
15
5.1.4 RESULTS OF THE ROBUSTNESS TEST 16
Figure 8 presents four different solutions, which are representative of those obtained from 35 17
realizations of the intra-beat adaptation, applied to the beat shown in example 2 (section 5.1.2). It can 18
be seen that, even if the ladder diagrams differ slightly, the interpretation proposed by these different 19
solutions remains coherent. For example, the A-V delay of the observed beat can be explained by a 20
very slow conduction at the AV node and an almost normal conduction through the his bundle, (Figure 21
8 a), or equivalently slow conductions through the AV node and the his bundle (Figure 8 b to d), the 22
conduction time between the atria and the ventricles remaining comparable. Some differences of the 23
same nature can also be observed in the right bundle branch (see, for example, Figure 8 c and d). 24
In order to statistically quantify this variability, boxplots of these results are shown in Figure 8 e, in 25
which the corresponding values of the four solutions (a to d) are identified with different symbols (see 26
[22] for a description of boxplots). Solutions of all realizations provide similar values of global 27
conduction times, confirming the robustness of the interpretation for this beat. The lowest variability 28
(more compact boxplot -and more reliable identification) was observed for the left bundle branch 29
conduction time, which is a key parameter for the identified pathology. Wider dispersions are observed 30
HA
L author manuscript inserm
-00134397, version 1

19
for the identification of the conduction times through the AV junction and right bundle branch. 1
Although the atrial conduction time presents a compact boxplot, 6 outlier solutions can be observed 2
(‘+’ symbols), making it the least reliable marker. Two of these outliers, marked with the symbols ! 3
and !, are shown in Figure 8 b and c. This can be explained in part by the low amplitude of the 4
observed P-wave. 5
6
INSERT Figure 8 HERE 7
8
6 DISCUSSION 9
During the initial evaluation of the EA, the best results were found by adopting a “naïve evolution” 10
strategy. Two main reasons led us to retain this approach: i) the specific physiological knowledge 11
allowing us to improve the EA’s convergence, represented by means of customized genetic operators 12
(section 4.1.4), is more effective for mutation than for crossover and ii) a high crossover probability led 13
to a big number of aberrant solutions during the initial generations, containing, for example, two or 14
more active ectopic foci. In the current EA implementation, values for pr and pm remain constant 15
throughout the whole adaptation process. A specific rule can be defined to modify these probabilities in 16
order to accelerate convergence. 17
Robustness analysis of supra-ventricular beats, with or without conduction disorders, presented 18
similar results to those of section 5.1.4. For ectopic beats of ventricular origin, the pacemaker structure 19
of the proposed solution stayed coherent for different realizations, but showed important differences in 20
the conduction path (such as those shown in Figure 7). These explanations represent local minima of 21
the error function, leading always to good morphological reproductions of the observed beat. Most of 22
the convergence errors observed for the intra-beat adaptation are related to the reproduction of PVC’s 23
and are a consequence of the T-wave synthesis limitations. 24
The calculation time for intra-beat adaptation depends, obviously, on the number of generations 25
necessary to obtain population convergence, which depends itself on the difference between the 26
observed beat and the individuals of the initial population. Mean computation time of the intra-beat 27
EA, obtained from the robustness analysis of section 5.1.4, was of 19 minutes, running on a PowerMac 28
G4 at 733 MHz and starting from the initial population described in section 4.1.2. For subsequent beats 29
HA
L author manuscript inserm
-00134397, version 1

20
of the same rhythm, the best solution of previous beats is saved in the initial population, reducing 1
significantly the calculation time (around 40 seconds for the second beat). It should be noted that the 2
whole system has been implemented in Matlab/Simulink (which is an interpreted language running 3
slower than a compiled one) and that both the cellular automata model and the evolutionnary algorithm 4
used are inherently parallelizable. 5
Another interesting point concerns the potential utilization of the model as the source of knowledge 6
in cardiac event detection, particularly for P waves. Indeed, if the occurrence time of observed P-waves 7
is not introduced as parameter to the intra-beat adaptation algorithm (case of a miss-detection at the low 8
level), only the morphological differences are used in the error function. Although this implies a slower 9
convergence, if the observed P-wave presents sufficient energy, the EA is capable of finding its 10
position by minimizing the morphological error. Moreover, in cases where the P-wave is not easy to 11
detect, as in the example 3, the implicit knowledge of the cardiac conduction system represented in the 12
model allows us to produce a hypothesis about its location. 13
7 CONCLUSIONS 14
This work has demonstrated the feasibility of using deep physiological model-based interpretation 15
of the cardiac rhythm, combined with a direct interface to real observations. The proposed approach 16
differs considerably from manually interfaced cardiac rhythm analysis model-based systems. Two key 17
aspects were developed: model-observation interfacing and intra-beat adaptation. 18
Model-observation interfacing relies on robust detection algorithms for P-waves and QRS 19
complexes proposed in our laboratory. Another original characteristic of the interface resides in the fact 20
that the main element of comparison between patient observation and simulated activity is based on the 21
recorded ECG signal. To the best of our knowledge, CARMEM is the only model-based system 22
providing such integration. 23
Intra-beat adaptation was approached as an optimization problem, requiring the implementation of 24
stochastic search algorithms. The proposed approach, based on evolutionary methods, differs notably 25
from those of current model based systems, which are often implemented using a set of first-order logic 26
rules. Physiological knowledge has been integrated in individual representation, in the control of 27
genetic operators (mutation and cross-over) and in the calculation of the error function. Population 28
HA
L author manuscript inserm
-00134397, version 1

21
initialization is based upon a set of hypotheses (beat explanations) observed commonly in clinical 1
practice, leading to an improved robustness and convergence speed of the adaptation process. 2
Preliminary adaptation results are encouraging and show how the anatomic and physiological 3
knowledge can be exploited in order to explain underlying disorders, to better localize their origin, to 4
retrieve missed detections and to correct false alarms obtained from the signal processing stage. In the 5
long run, a similar model-based approach could also be used to explain differences between predicted 6
patient's states and observations. 7
Some limitations still persist in the model and they represent the motivations for current and future 8
development. The most important one concerns the ECG synthesis stage. Although the templates used 9
are useful in generating beats with antegrade activations, this is not the case for retrograde conductions, 10
limiting the capability of the model to reproduce and explain these phenomena. Development of ECG 11
synthesis based on the equivalent source method is a possibility to solve the problem, however, it will 12
increase considerably computational costs. 13
Finally, an inter-beat adaptation stage, aiming at reproducing the global activity of an observed 14
rhythm, has to be developed. This is a complex task that has to take into account, on one hand, the 15
individual solutions of the intra-beat adaptation (explanation of individual beats) and, on the other, the 16
preservation of the global physiological state and the continuity of parameter values between 17
consecutive beats (rhythm explanation). 18
19
HA
L author manuscript inserm
-00134397, version 1

22
8 APPENDIX 1: ECG SYNTHESIS STAGE OF THE CARMEM!S MODEL 1
Due to the semi-quantitative nature of the CARMEM’s model and in order to optimize 2
computational costs during model simulation and adaptation, a particular VCG and ECG synthesis 3
stage had to be designed. It is based on the same principles, already described in a previous version of 4
our model [14, 20]. This short appendix recalls the fundamental aspects of the synthesis stage, which is 5
performed, for each time instant, in four different steps: 6
• The electrical vector produced by each myocardial structure is calculated, with respect to a 7
predefined heart-related axis. 8
• A global activation vector is calculated by the sum of the individual contributions of all active 9
myocardial structures. 10
• The global activation vector is projected from the heart-related axis, into a body-related axis in 11
order to obtain the VCG. 12
• The VCG is projected into a set of ECG leads. 13
The contribution of each myocardial structure to the surface ECG depends on: 1) its current electrical 14
state, 2) its volume, 3) the propagation direction inside the structure, 4) its anatomical position in the 15
myocardium and 5) the duration of its current electrical phase. Each myocardial structure generates a 16
particular time-varying electrical vector, depending on these conditions. The set of all these electrical 17
vectors constitutes the template database used by the ECG synthesis stage. 18
8.1 TEMPLATE DEFINITION 19
Each MA contains templates representing its contribution to the X, Y and Z axes of the VCG, for 20
different electrophysiological conditions. For example, Figure 9 shows the Simulink diagram of the 21
base cardiac model of CARMEM and the VCG contribution templates of each MA in the case of a 22
normal, antegrade activation. These templates are defined with respect to a heart-related local axis. 23
Templates have been defined for the atria and the ventricles. 24
Atrial templates: Two different cases were considered for both the upper and lower atria: antegrade 25
and retrograde depolarization. As atrial repolarization is never perceptible on real ECGs, it has not been 26
taken into account in the current version of the model. 27
HA
L author manuscript inserm
-00134397, version 1

23
Ventricular templates: The direction and the general form of ventricular depolarization vectors 1
depend closely on the activation origin. For example, 5 different cases have been considered for the 2
upper part of the right ventricle: 3
• normal antegrade activation from the bundle branch, 4
• retrograde depolarization from the bundle branch; 5
• retrograde, muscle-to-muscle depolarization from the lower part of the right ventricle; 6
• antegrade depolarization coming from the accessory pathway; 7
• depolarization from an ectopic foci, located in the upper part of the right ventricle. 8
For the ventricular repolarization phase, only three cases were considered, corresponding to 9
antegrade conductions, retrograde conductions and antegrade repolarization after an activation from the 10
accessory pathway. Only the right free wall location of accessory pathways has been considered in the 11
current version. 12
13
Synthetically, for the six myocardial structures and the different activation directions (i.e. 14
antegrade, retrograde, lateral, …), 30 different template vectors have been defined, that is, a total of 90 15
different predefined waveforms. The determination of these templates has been made in an iterative 16
manner, by successive approximations, guided by a set of ECG and VCG observations, corresponding 17
to selected normal and pathological cases. Three steps were applied iteratively: i) extraction of ECG 18
invariants; ii) projection of the observed X-Y-Z axes, to a body-related axis, Mc,b, and to a heart-related 19
axis, Mb-d, based on the observed electrical axis of the heart; iii) qualitative determination of the 20
individual contribution of each structure and iv) validation. This work, which can be compared with the 21
determination of wave morphology rules of previous model-based systems, is described in detail in 22
[14]. 23
8.2 VCG AND ECG SYNTHESIS 24
The generation of the VCG implies: i) the sum of the individual contribution of all active MA and 25
ii) the projection from a heart-related axis VCGc (k) = Xc (k ) Yc(k) Zc (k)[ ]T
to an axis defined with 26
respect to the body of the patient VCGb (k) = Mc,b !VCGc , by means of the following transformation: 27
Mc,b =
cos! sin! 0
" sin! cos! 0
0 0 1
#
$
% % %
&
'
( ( (
28
HA
L author manuscript inserm
-00134397, version 1

24
where the value " represents the patient’s heart electrical axis. 1
The 12 standard ECG leads can be calculated by using a projection defined by: 2
Mb ,d = cos! cos" sin! cos" sin"[ ] 3
and the relation ECGlead(k) =Mb,d !VCGb (k) . Each ECG lead is built by using a specific couple of 4
values for # and $. 5
6
7
HA
L author manuscript inserm
-00134397, version 1

25
References 1
[1] Beasley, D., Bull, D. R., Martin, R., An Overview of genetic algorithms: Part 2, Research 2
Topics, University Computing. 15, (1993) 170-181. 3
[2] Bratko, I., Mozetic, I., Lavrac, N., KARDIO: A study in deep and qualitative knowledge for 4
expert systems. (The MIT Press, Cambridge, MA, 1989). 5
[3] Davis, L., Genetic Algorithms and Simulated Annealing. (Pitman Publisher, New York, 6
1987). 7
[4] Davis, L., Handbook of Genetic Algorithms. (Van Nostrand Reinhold, New York, 1991). 8
[5] Goldberg, D. E., Genetic Algorithms in search, optimization and machine learning. 9
(Addison-Wesley, Boston, MA, 1989). 10
[6] Guertin, M., Abductive inference of events: diagnosing cardiac arrhythmias , Phd Thesis 11
Boston University (1996). 12
[7] Hernández, A., Fusion de signaux et de modèles pour la caractérisation d'arythmies 13
cardiaques , Phd Thesis Université de Rennes 1 (2000). 14
[8] Hernández, A. I., Carrault, G., Mora, F., Improvement of a P-wave detector by a bivariate 15
classification stage, Transactions of the institute of measurement and control. 22, (2000) 16
231-242. 17
[9] Hernández, A. I., Carrault, G., Mora, F., Bardou, A., Overview of CARMEM: A new 18
dynamic quantitative cardiac model for ECG monitoring and its adaptation to observed 19
signals, Acta Biotheoretica. 48, (2000) 303-322. 20
[10] Hernández, A. I., Carrault, G., Mora, F., Thoraval, L., Passariello, G., Schleich, J. M., 21
Multisensor fusion for atrial and ventricular activity detection in coronary care monitoring, 22
IEEE Transactions on biomedical engineering. 46, (1999) 1186-1190. 23
[11] Holland, J. H., Adaptation in Natural and Artificial Systems. (MIT Press, MA, 1975). 24
[12] Hunter, J., Kirby, I., Gotts, N., Using Quantitative and Qualitative Constraints in Models of 25
Cardiac Electrophysiology, Artificial Intelligence in Medicine. 3, (1991) 41-61. 26
[13] Kirkpatrick, S., Gelatt, C. D., Vecchi, M. P., Optimization by simulated annealing, Science. 27
220, (1983) 671-680. 28
HA
L author manuscript inserm
-00134397, version 1
26
[14] Le Moulec, F., Etude et réalisation d'un modèle qualitatif profond de l'activité électrique du 1
coeur pour un système de monitoring intelligent en unité de soins intensifs pour coronariens, 2
Phd Thesis Université de Rennes 1 (1991). 3
[15] Michalewicz, Z., Genetic Algotithms + Data Structures = Evolution Programs. (Springer-4
Verlag, New York, 1994). 5
[16] Moody, G. B., Mark, R. G., Goldberger, A. L., PhysioNet: a Web-based resource for the 6
study of physiologic signals, IEEE Eng Med Biol Mag. 20, (2001) 70-5. 7
[17] Opie, L., The heart: Physiology, from cell to circulation. (Lippincott-Ravec Publishers, 8
Philadelphia, 1998). 9
[18] Peña-Reyes, C. A., Sipper, M., Evolutionary computation in medicine: an overview, 10
Artificial Intelligence in Medicine. 19, (2000) 1-23. 11
[19] Siregar, P., Chahine, M., Lemoulec, F., Le Beux, P., An interactive qualitative model in 12
cardiology, Comput Biomed Res. 28, (1995) 443-78. 13
[20] Siregar, P., Coatrieux, J. L., Mabo, P., How can deep knowledge be used in CCU 14
monitoring?, IEEE Eng. Med. Biol. Soc. 12, (1993) 92-99. 15
[21] Stridh, M., Sornmo, L., Spatiotemporal QRST cancellation techniques for analysis of atrial 16
fibrillation, IEEE Trans Biomed Eng. 48, (2001) 105-11. 17
[22] Tukey, J. W., Exploratory Data Analysis. (Addison-Wesley, MA, 1977). 18
[23] Uckun, S., Intelligent systems in patient monitoring and therapy management. A survey of 19
research projects, Int. J. Clin. Monit. Comput. 11, (1994) 241-53. 20
[24] Wagner, G. S., Marriott, H. J., Marriott's Practical Electrocardiography. (Lippincott 21
Williams & Wilkins, New York, 2001). 22
[25] Widman, L. E., The EINTHOVEN system: toward an improved cardiac arrhythmia monitor, 23
Annu Symp Comput Appl Med Care, (1991) 441-445. 24
[26] Widman, L. E., Tong, D. A., Validation of the EINTHOVEN model-based computerized 25
electrocardiogram rhythm analysis system with three classes of clinical arrhythmias, Am J 26
Cardiol. 78, (1996) 927-31. 27
[27] Zhang, X. S., Zhu, Y. S., Thakor, N. V., Wang, Z. Z., Detecting ventricular tachycardia and 28
fibrillation by complexity measure, IEEE Transactions On Biomedical Engineering. 46, 29
(1999) 548-55. 30
HA
L author manuscript inserm
-00134397, version 1

27
Figure Captions
Figure 1. Abstraction levels of an intelligent cardiac monitoring system. Segmented arrows represent
possible relations from the high to the low abstraction levels that could be developed in the
future, for example, to assist the ECG wave detection algorithms (see example 3).
Figure 2. Diagram of the proposed interface level.
Figure 3. General diagram of the evolutionary algorithm used for intra-beat adaptation.
Figure 4. Chromosome representation for the evolutionary algorithm of intra-beat adaptation.
Figure 5. Model adaptation to a sinus beat in record 100 of the MIT-BIH database. Each panel shows
the best individual of some populations of the EA, presenting the observed beat (thicker line)
and the synthesized beat (finer line) along with its ladder diagram.
Figure 6. Adaptation of the model to a beat presenting a left bundle branch block obtained from record
111 of the MIT-BIH database.
Figure 7. Application of the intra-beat adaptation algorithm to a premature ventricular contraction in
record 100 of the MIT-BIH database.
Figure 8. Panels a to d: Four solutions obtained from different realizations of the intra-beat adaptation
algorithm for the same observed beat. Panel e: Boxplot of conduction times through the
atria, the atrio-ventricular junction and the left and right bundle branches, calculated from 35
different realizations of the intra-beat adaptation algorithm. The upper and lower parts of
each box represent the last and the first quartile of the population, respectively; the line at the
middle of the box represents the median value; the ‘+’ symbol represents the outliers; the
lines showing upper and lower limits symbolize the extent of the observed samples (without
the outliers) and the notches show the 95% confidence interval of the mean value. Symbols
", ! , !, and " show, respectively, the position of solutions a, b, c and d on the boxplot.
Figure 9. Simulink diagram of CARMEM’s model (normal case without ectopic foci or accessory
pathways) presenting the templates of each MA for the case of a normal antegrade
conduction.
HA
L author manuscript inserm
-00134397, version 1
28
Patient
Data acquisition Observations
FilteringDetection
Association
Low abstraction levelSignal processing
Interface Low/high levels
Deep modellingSimulation
Hypothesis generation
High abstraction levelInterpretation
Anatomo-physiological knowledge
Figure 1. Abstraction levels of an intelligent cardiac monitoring system. Segmented arrows
represent possible relations from the high to the low abstraction levels that could be developed in the
future, for example, to assist the ECG wave detection algorithms (see example 3).
HA
L author manuscript inserm
-00134397, version 1
29
Patient
Deep model
•
•
•
Intra-beat adaptation
Data acquisition
P and QRS detection
Beat i+1
A V
Beat i+2
A V
Beat i
V
Beat i-1
A V A
Block
Pre-processingElectrical axis estimation
NormalizationGeneration of the observation set Xo
Beat i-1
• • •
Model parameters
Lewis diagram
Intra-beat adaptation solutions
Beat i
• • •
Model parameters
Inter-beat adaptation
XO ,i
XM,iModel/signal
Interface • parameter adaptation
• error function calculation
Pre-processing
Lewis diagram
Figure 2. Diagram of the proposed interface level.
HA
L author manuscript inserm
-00134397, version 1
30
Figure 3. General diagram of the evolutionary algorithm used for intra-beat adaptation.
Initialization
Each individual is an
instance of the model
Selection
Ranking method
Evaluation
A set of normal and
pathologic beats are
defined during
initialization
• • •• • •• • •
• • •
Model-observation interface
Error estimation for each individual
0 100 200 300 400 500 600 700 800
-50
0
50
100
BO j
et
BS
,l
j
0 100 200 300 400 500 600 700 800
0
0.1
0.2
| B
O j
- B
S,l
j
|
0 100 200 300 400 500 600 700 800
V
A-V
A
Dia
g.
de
Le
wis
0 100 200 300 400 500 600 700 800
-100
-50
0
50
Po
t. d
'action
msec
!S ,l
AA
!O, i
AA
•
•
•
Mutation and crossover
Geometric creep mutationUniform and heuristic crossover
New population
HA
L author manuscript inserm
-00134397, version 1

31
Maxima
Segment of a myocardial structure
• • • • • •SDD1!
"
UDP1!ARP1
!
"
UDPi!ARPi
!
• • • • • •SDD1+
"
UDP1+ARP1
+
"
UDPi+ARPi
+
Minima
Segment of a nodal structure
• • • • • •SDD1 ARP1
"
UDPi ARPi
"
UDP1
Figure 4. Chromosome representation for the evolutionary algorithm of intra-beat adaptation.
HA
L author manuscript inserm
-00134397, version 1

32
0 100 200 300 400 500 600 700 800-100
-50
0
50
100Best Indiv. Generation Number: 0
Error: 1.610532e+03
0 100 200 300 400 500 600 700 800
V
A-V
A
0 100 200 300 400 500 600 700 800-100
-50
0
50
100Best Indiv. Generation Number: 9
Error: 1.367500e+03
0 100 200 300 400 500 600 700 800
V
A-V
A
0 100 200 300 400 500 600 700 800-100
-50
0
50
100Best Indiv. Generation Number: 27
Error: 1.218794e+03
0 100 200 300 400 500 600 700 800
V
A-V
A
0 100 200 300 400 500 600 700 800-100
-50
0
50
100Best Indiv. Generation Number: 46
Error: 1.168328e+03
0 100 200 300 400 500 600 700 800
V
A-V
A
0 100 200 300 400 500 600 700 800-100
-50
0
50
100Best Indiv. Generation Number: 64
Error: 1.149681e+03
0 100 200 300 400 500 600 700 800
V
A-V
A
0 100 200 300 400 500 600 700 800-100
-50
0
50
100Best Indiv. Generation Number: 74
Error: 1.140963e+03
0 100 200 300 400 500 600 700 800
V
A-V
A
Figure 5. Model adaptation to a sinus beat in record 100 of the MIT-BIH database. Each panel shows
the best individual of some populations of the EA, presenting the observed beat (thicker line) and the
synthesized beat (finer line) along with its ladder diagram.
HA
L author manuscript inserm
-00134397, version 1

33
0 100 200 300 400 500 600 700 800-100
-50
0
50
100Best Indiv. Generation Number: 0
Fit: 1.780263e+03
0 100 200 300 400 500 600 700 800
V
A-V
A
0 100 200 300 400 500 600 700 800-100
-50
0
50
100Best Indiv. Generation Number: 3
Fit: 1.607280e+03
0 100 200 300 400 500 600 700 800
V
A-V
A
0 100 200 300 400 500 600 700 800-100
-50
0
50
100Best Indiv. Generation Number: 20
Fit: 1.348914e+03
0 100 200 300 400 500 600 700 800
V
A-V
A
0 100 200 300 400 500 600 700 800-100
-50
0
50
100Best Indiv. Generation Number: 73
Error: 1.171286e+03
0 100 200 300 400 500 600 700 800
V
A-V
A
Figure 6. Adaptation of the model to a beat presenting a left bundle branch block obtained from record
111 of the MIT-BIH database.
HA
L author manuscript inserm
-00134397, version 1

34
0 100 200 300 400 500 600 700 800-100
-50
0
50
100Best Indiv. Generation Number: 0
Error: 1.213686e+04
0 100 200 300 400 500 600 700 800
V
A-V
A
0 100 200 300 400 500 600 700 800-100
-50
0
50
100Best Indiv. Generation Number: 14
Error: 1.189957e+04
0 100 200 300 400 500 600 700 800
V
A-V
A
0 100 200 300 400 500 600 700 800-100
-50
0
50
100Best Indiv. Generation Number: 32
Error: 1.137648e+04
0 100 200 300 400 500 600 700 800
V
A-V
A
0 100 200 300 400 500 600 700 800-100
-50
0
50
100Best Indiv. Generation Number: 39
Error: 9.514112e+03
0 100 200 300 400 500 600 700 800
V
A-V
A
Figure 7. Application of the intra-beat adaptation algorithm to a premature ventricular contraction
in record 100 of the MIT-BIH database.
"
!
"
!
HA
L author manuscript inserm
-00134397, version 1

35
a
b
c
d
e
Figure 8. Panels a to d: Four solutions obtained from different realizations of the intra-beat adaptation algorithm
for the same observed beat. Panel e: Boxplot of conduction times through the atria, the atrio-ventricular junction
and the left and right bundle branches, calculated from 35 different realizations of the intra-beat adaptation
algorithm. The upper and lower parts of each box represent the last and the first quartile of the population,
respectively; the line at the middle of the box represents the median value; the ‘+’ symbol represents the outliers;
the lines showing upper and lower limits symbolize the extent of the observed samples (without the outliers) and
the notches show the 95% confidence interval of the mean value. Symbols ", ! , !, and " show, respectively,
the position of solutions a, b, c and d on the boxplot.
"
"
!
" !
HA
L author manuscript inserm
-00134397, version 1

36
URV
URV
URBB
URBB
ULV
ULV
ULBB
ULBBUH
UH
UANT
UANT
UA
UA
SumaURBB
SumaULBB
SumaUANT
SumaLRV
SumaLLV
SumaLHSumaLANT
SumaLA
NSA
NSA
NAV
NAV
LRV
LRV
LRBB
LRBB
LLV
LLV
LLBB
LLBB
LH
LH
LANT
LANT
LA
LA
Grnd1
0 200 400 600-40
-20
0
20
40LRV
X
0 200 400 600-40
-20
0
20
40
Y
0 200 400 600-40
-20
0
20
40
Z
0 200 400 600-40
-20
0
20
40LLV
X
0 200 400 600-40
-20
0
20
40
Y
0 200 400 600-40
-20
0
20
40
Z
0 200 400 600-40
-20
0
20
40URV
X
0 200 400 600-40
-20
0
20
40
Y
0 200 400 600-40
-20
0
20
40
Z
0 200 400 600-40
-20
0
20
40ULV
X
0 200 400 600-40
-20
0
20
40
Y
0 200 400 600-40
-20
0
20
40
Z
0 200 400 600-40
-20
0
20
40LA
X
0 200 400 600-40
-20
0
20
40
Y
0 200 400 600-40
-20
0
20
40
Z
0 200 400 600-40
-20
0
20
40UA
X
0 200 400 600-40
-20
0
20
40
Y
0 200 400 600-40
-20
0
20
40
Z
Figure 9. Simulink diagram of CARMEM’s model (normal case without ectopic foci or accessory
pathways) presenting the templates of each MA for the case of a normal antegrade conduction.
HA
L author manuscript inserm
-00134397, version 1