Embed Size (px)
Citation preview

468
NOAANational Marine Fisheries Service
Fishery Bulletin First U.S. Commissioner of Fisheries and founder
of Fishery Bulletin established 1881
Modeling age and growth of the bigeye thresher (Alopias superciliosus) in the Atlantic Ocean
Joana Fernandez-Carvalho1,2
Rui Coelho (contact author)1,2
Karim Erzini2
Miguel N. Santos1
Email address for contact author: [email protected]
1 Instituto Português do Mar e da Atmosfera (IPMA) Avenida 5 de Outubro s/n 8700-305 Olhão, Portugal2 Centro de Ciências do Mar (CCMAR) Universidade do Algarve, FCT Ed. 7 Campus de Gambelas 8005-139 Faro, Portugal
Manuscript submitted 5 September 2014.Manuscript accepted 1 September 2015.Fish. Bull. 113:468–481 (2015).Online publication date: 22 September 2015.doi: 10.7755/FB.113.9
The views and opinions expressed or implied in this article are those of the author (or authors) and do not necessarily reflect the position of the National Marine Fisheries Service, NOAA.
Abstract—The bigeye thresher (Alo-pias superciliosus) is a pelagic shark captured as bycatch in pelagic long-line fisheries. Important informa-tion on its biology is still missing, especially from the Atlantic Ocean. In all, 546 vertebrae collected by fishery observers between 2007 and 2009 were used to estimate age and growth parameters for this spe-cies in the Atlantic Ocean. The size composition was 102–265 cm fork length (FL) for females and 94–260 cm FL for males. The estimated ages ranged from 0 to 25 years for both sexes. From the 5 growth models used, the 3-parameter von Berta-lanffy growth model, reparameter-ized to estimate length at birth (L0), produced the best results. The esti-mated parameters were asymptotic maximum length (Linf)=284 cm FL, growth coefficient (k)=0.06/year, and L0=109 cm FL for females and Linf=246 cm FL, k=0.09/year, and L0=108 cm FL for males. Although differences between hemispheres indicate slower growth rates in the South Atlantic Ocean, these differ-ences may also have been caused by the lower sample size and larg-er specimen sizes for the Southern Hemisphere. The estimated growth coefficients are among the lowest found for the Alopiidae, highlighting the bigeye thresher’s slow growth and consequent low resilience to fishing pressure.
The bigeye thresher (Alopias super-ciliosus) is a pelagic shark distin-guished by its long, whiplike upper caudal lobe, large eyes, and deep horizontal grooves above the gills (Bigelow and Schroeder, 1948). It has a worldwide distribution in the Atlantic, Pacific, and Indian oceans and Mediterranean Sea, ranging from tropical to temperate regions in primarily oceanic epipelagic waters, but it sometimes approaches coastal waters (Stillwell and Casey, 1976; Compagno, 2001; Nakano et al., 2003; Weng and Block, 2004; Smith et al., 2008; Cao et al., 2011).
Like other members of the order Lamniformes, the bigeye thresher is an aplacental, viviparous species with intrauterine oophagy, bearing 2–4 pups per litter, resulting in an extremely low fecundity (Moreno and Morón, 1992; Gilmore, 1993; Chen et al., 1997; Compagno, 2001). This species has been described as hav-ing one of the lowest intrinsic rates of population increase among elas-mobranchs, highlighting its high vulnerability to exploitation (Smith et al., 1998; Chen and Yuan, 2006;
Cortés, 2008). According to the Inter-national Union for the Conservation of Nature (IUCN) Red List Criteria, this species is classified as “vulner-able” globally and “endangered” in the northwestern and western cen-tral Atlantic Ocean (Amorim et al., 2009). Furthermore, this species was classified as being at high risk in an ecological risk assessment of pelagic sharks caught in pelagic longlines in the Atlantic Ocean, highlighting the urgent need for better basic biologi-cal information on this shark (Cortés et al., 2010).
In the Atlantic Ocean, the pelagic longline fisheries that target sword-fish (Xiphias gladius) also capture several species of pelagic sharks as bycatch (Moreno and Morón, 1992; Buencuerpo et al., 1998; Megalo-fonou et al., 2005; Coelho et al., 2012). Bycatch of bigeye thresher by these fisheries has been estimated at around 0.2% of the total shark by-catch for the entire Atlantic Ocean (Mejuto et al., 2009). The Interna-tional Commission for the Conser-vation of Atlantic Tunas (ICCAT), responsible for the management of

Fernandez-Carvalho et al.: Age and growth of Alopias superciliosus in the Atlantic Ocean 469
bigeye thresher in the Atlantic Ocean, recently pro-hibited the retention and commercialization of bigeye thresher caught in tuna fisheries, recommending the release of live specimens when they are accidentally captured and requiring that both incidental catches and live releases be recorded in accordance with IC-CAT data reporting requirements (ICCAT1). However, simply releasing caught specimens may not be enough to protect this species because 51% of bigeye thresher that are caught in the pelagic swordfish longline fish-ery have been estimated to have been released dead (Coelho et al., 2012).
Although pelagic sharks are affected by fishing, they remain among the least studied elasmobranchs because of their highly migratory nature and because the lack of information on these species poses particular diffi-culties for their management and conservation (Pikitch et al., 2008). Knowledge of the life history of a species is essential for successful management of that species. In particular, age and growth studies provide informa-tion for estimating important biological variables, such as growth rates, natural mortality, productivity, and longevity of a species (Campana, 2001; Goldman, 2004, Goldman et al., 2012). Understanding these biological parameters is important for assessment of the current status of shark populations and for prediction of how their population size and structure may change over time (Goldman et al., 2012). In fact, it is crucial that age determinations be precise and accurate because an erroneous understanding of the population dynamics of a species may lead to serious bias in stock assessment, bias that frequently results in overexploitation (Gold-man et al., 2012).
Because elasmobranch species are characterized by slow growth rates (e.g., Coelho and Erzini, 2002) and a low reproductive potential (e.g., Coelho and Erzini, 2006), they are extremely vulnerable to fishing pres-sure, and overexploitation occurs with even relatively low levels of fishing-induced mortality (Smith et al., 1998). Therefore, study of their life history, including age and growth, is more critical than it is for more resilient species (Goldman et al., 2012).
In most age and growth studies of teleost fishes, otoliths or scales are used; however, vertebrae are the most widely used structures for age determina-tion in elasmobranch fishes, but dorsal spines (usually in Squalidae) and caudal thorns (in skates) have also been used (Campana, 2001; Caillet and Goldman, 2004, Goldman, 2004; Coelho and Erzini, 2007; Moura et al., 2007; Coelho and Erzini, 2008). In general, an annual vertebral growth ring is composed of one opaque band (representing faster summer growth) and one translu-cent band (representing winter growth), although the periodicity of deposition may be different for some elas-
1 ICCAT (International Commission for the Conservation of Atlantic Tunas). 2009. Recommendation by ICCAT on the conservation of thresher sharks caught in association with fisheries in the ICCAT convention area. ICCAT Recomman-dation 09-07, 1 p. [Available at website.]
mobranchs (Cailliet and Goldman, 2004; Caillet et al., 2006). It should be noted that the opacity and trans-lucency of these bands varies depending on the light source used (transmitted versus reflected) and method of preparation of the vertebrae (Goldman et al., 2012). Because the pattern of calcification can vary greatly within and among taxonomic groups of elasmobranchs, a species-specific approach is necessary for studies of their age and growth; it cannot be assumed that the banding pattern of one species is representative of an-other (Ridewood, 1921; Goldman, 2004).
In the case of bigeye thresher, little biological in-formation is currently available, especially for this species in the Atlantic Ocean, probably because of its low prevalence numbers in longline catches (Mejuto and Garcés2; Mejuto3; Castro et al., 2000; Berrondo et al., 2007; Mejuto et al., 2009). Gruber and Compagno (1981) explored the age and growth of this species on the basis of a limited data set of mostly museum specimens captured in the Pacific and Atlantic oceans. Fernandez-Carvalho et al. (2011) estimated growth parameters for a specific region of the tropical north-eastern Atlantic Ocean. Mancini (2005) studied the age and growth of bigeye thresher caught by longliners in the southwestern coast of Brazil. In the Pacific Ocean, an extensive age and growth study was carried out by Liu et al. (1998) in the western central Pacific region (Taiwan). In addition, some reproductive parameters have been reported for the Pacific Ocean (Gruber and Compagno, 1981; Gilmore, 1993; Chen et al., 1997) and Atlantic Ocean (Moreno and Morón, 1992; Mancini, 2005). The objective of this study was to improve the biological information for bigeye thresher by providing new knowledge about the age and growth parameters for this species throughout the Atlantic Ocean.
Materials and methods
Sampling and processing
All samples were collected by fishery observers, from the Portuguese Institute for the Ocean and Atmosphere onboard Portuguese commercial longline vessels that targeted swordfish in the Atlantic Ocean. Vertebral samples were collected only from bigeye thresher specimens that were retrieved already dead when the longline was hauled aboard. From September 2007 to December 2009, vertebral samples from 546 shark were collected throughout the Atlantic Ocean, between latitudes 38°N and 35°S (Fig. 1). Some of these samples
2 Mejuto, J., and A. G. Garcés. 1984. Shortfin mako, Isurus oxyrinchus, and porbeagle, Lamna nasus, associated with longline swordfish fishery in NW and N Spain. ICES Coun-cil Meeting (C.M.) Documents 1984/G:72, 10 p.
3 Mejuto, J. 1985. Associated catches of sharks, Prionace glauca, Isurus oxyrinchus, and Lamna nasus, with NW and N Spanish swordfish fishery, in 1984. ICES Council Meet-ing (C.M.) Documents 1985/H:42, 16 p.

470 Fishery Bulletin 113(4)
(n=117) were used by Fernandez-Carvalho et al. (2011) to estimate initial growth curves, and a relationship between size of specimen and size of vertebrae, for the region of the Cape Verde Archipelago in the tropi-cal northeastern Atlantic Ocean. These samples from the Cape Verde Archipelago were also included in this study (and used as a reference set to model the growth of this species for a wider area in the Atlantic Ocean) because the readers were the same, our sample size was small, and because it was desirable to increase our sample area.
The sexes of specimens were determined and fork lengths (FLs) measured in a straight line (in centime-ters) onboard ship. A section of vertebrae was removed from the area below the anterior part of the first dorsal fin. Each of these samples was kept frozen on the ves-sel and during land transport until it was processed in the laboratory. One vertebra was removed from each sample and processed by following the method de-scribed in detail in Fernandez-Carvalho et al. (2011). First, scalpels were used to remove the soft tissue, and then the vertebrae were immersed in a solution of 4–6% sodium hypochlorite (commercial bleach) for 10–20 min, depending on the size of the vertebrae. The vertebrae were mounted on a microscopic slide with ei-
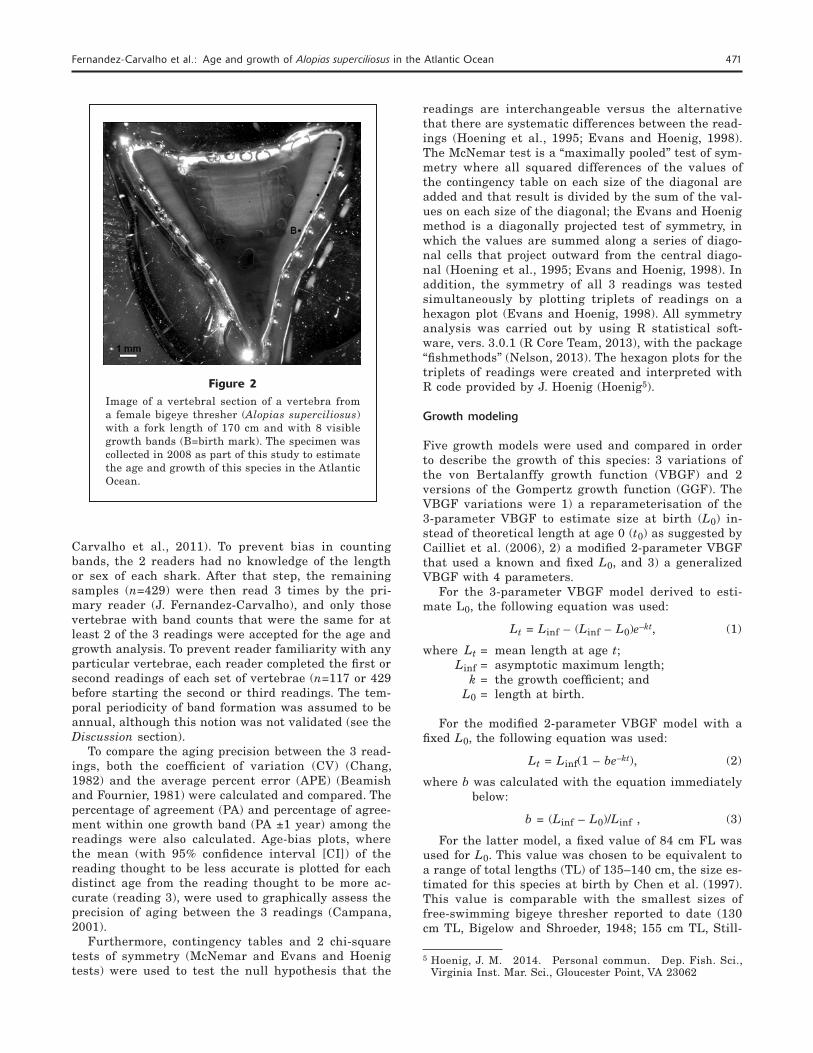
ther thermoplastic cement or a synthetic polymer glue and sectioned sagittally with a Buehler4 (Lake Bluff, IL) low-speed saw, with 2 blades spaced approximately 0.5 mm apart. For a better visualization of the growth band pairs, the sections were stained with crystal vio-let solution (Sigma-Aldrich Co., St. Louis, MO) for 5–15 min depending on the size of the vertebrae (Fig. 2). Once dried, the sections were mounted onto microscope slides with Cytoseal 60 (Thermo Fisher Scientific Inc., Waltham, MA). Finally, growth bands were examined under a dissecting microscope with transmitted white light.
Age estimation and comparison of age readings
A preliminary reading of a reference set (n=117) of ver-tebrae (from the full set of 546 vertebrae) was complet-ed to familiarize the readers with the banding pattern of this species. Then, this reference set was indepen-dently read by 2 readers 3 times to maintain quality control and precision of the readings (see Fernandez-
4 Mention of trade names or commercial companies is for iden-tification purposes only and does not imply endorsement by the authors or the National Marine Fisheries Service, NOAA.
Figure 1Locations where the vertebrae of bigeye thresher (Alopias superciliosus) were collected between September 2007 and December 2009 for use in estimation of the age and growth of this species in the Atlantic Ocean. Open circles represent females and black triangles indicate males. The horizontal line at 5°N represents the parallel used by the International Commission for the Conservation of Atlantic Tunas (ICCAT) to separate the stocks in the Southern and Northern Hemispheres and was, therefore, also used in this study as the boundary between samples of the North and South Atlantic Ocean.
Fernandez-Carvalho et al.: Age and growth of Alopias superciliosus in the Atlantic Ocean 471
Carvalho et al., 2011). To prevent bias in counting bands, the 2 readers had no knowledge of the length or sex of each shark. After that step, the remaining samples (n=429) were then read 3 times by the pri-mary reader (J. Fernandez-Carvalho), and only those vertebrae with band counts that were the same for at least 2 of the 3 readings were accepted for the age and growth analysis. To prevent reader familiarity with any particular vertebrae, each reader completed the first or second readings of each set of vertebrae (n=117 or 429 before starting the second or third readings. The tem-poral periodicity of band formation was assumed to be annual, although this notion was not validated (see the Discussion section).
To compare the aging precision between the 3 read-ings, both the coefficient of variation (CV) (Chang, 1982) and the average percent error (APE) (Beamish and Fournier, 1981) were calculated and compared. The percentage of agreement (PA) and percentage of agree-ment within one growth band (PA ±1 year) among the readings were also calculated. Age-bias plots, where the mean (with 95% confidence interval [CI]) of the reading thought to be less accurate is plotted for each distinct age from the reading thought to be more ac-curate (reading 3), were used to graphically assess the precision of aging between the 3 readings (Campana, 2001).
Furthermore, contingency tables and 2 chi-square tests of symmetry (McNemar and Evans and Hoenig tests) were used to test the null hypothesis that the
readings are interchangeable versus the alternative that there are systematic differences between the read-ings (Hoening et al., 1995; Evans and Hoenig, 1998). The McNemar test is a “maximally pooled” test of sym-metry where all squared differences of the values of the contingency table on each size of the diagonal are added and that result is divided by the sum of the val-ues on each size of the diagonal; the Evans and Hoenig method is a diagonally projected test of symmetry, in which the values are summed along a series of diago-nal cells that project outward from the central diago-nal (Hoening et al., 1995; Evans and Hoenig, 1998). In addition, the symmetry of all 3 readings was tested simultaneously by plotting triplets of readings on a hexagon plot (Evans and Hoenig, 1998). All symmetry analysis was carried out by using R statistical soft-ware, vers. 3.0.1 (R Core Team, 2013), with the package “fishmethods” (Nelson, 2013). The hexagon plots for the triplets of readings were created and interpreted with R code provided by J. Hoenig (Hoenig5).
Growth modeling
Five growth models were used and compared in order to describe the growth of this species: 3 variations of the von Bertalanffy growth function (VBGF) and 2 versions of the Gompertz growth function (GGF). The VBGF variations were 1) a reparameterisation of the 3-parameter VBGF to estimate size at birth (L0) in-stead of theoretical length at age 0 (t0) as suggested by Cailliet et al. (2006), 2) a modified 2-parameter VBGF that used a known and fixed L0, and 3) a generalized VBGF with 4 parameters.
For the 3-parameter VBGF model derived to esti-mate L0, the following equation was used:
Lt = Linf – (Linf – L0)e–kt, (1)
where Lt = mean length at age t; Linf = asymptotic maximum length; k = the growth coefficient; and L0 = length at birth.
For the modified 2-parameter VBGF model with a fixed L0, the following equation was used:
Lt = Linf(1 – be–kt), (2)
where b was calculated with the equation immediately below:
b = (Linf – L0)/Linf , (3)
For the latter model, a fixed value of 84 cm FL was used for L0. This value was chosen to be equivalent to a range of total lengths (TL) of 135–140 cm, the size es-timated for this species at birth by Chen et al. (1997). This value is comparable with the smallest sizes of free-swimming bigeye thresher reported to date (130 cm TL, Bigelow and Shroeder, 1948; 155 cm TL, Still-
5 Hoenig, J. M. 2014. Personal commun. Dep. Fish. Sci., Virginia Inst. Mar. Sci., Gloucester Point, VA 23062
Figure 2Image of a vertebral section of a vertebra from a female bigeye thresher (Alopias superciliosus) with a fork length of 170 cm and with 8 visible growth bands (B=birth mark). The specimen was collected in 2008 as part of this study to estimate the age and growth of this species in the Atlantic Ocean.

472 Fishery Bulletin 113(4)
well and Casey, 1976; 159 cm TL, Gruber and Compagno, 1981; 156 cm TL, Moreno and Morón, 1992). The mean value of this range (135 to 140 cm TL) was converted to FL (84 cm FL) by using this equation (n=390; coefficient of multiple determi-nation [R2]=0.92; standard error of the intercept=2.41; standard error of the slope=0.01; regression analysis of vari-ance: F=4675; P<0.01) (see Fernandez-Carvalho et al., 2011):
FL = 0.58 TL + 4.83. (4)
The generalized VBGF with 4 parame-ters was defined by Richards (1959) with the following equation:
Lt = Linf ((1 – e(– k(1 – m) (t – t0)))(1/1 –m ), (5)
where t0 = the theoretical age at zero length; and
m is the fitted fourth function para- meter.
Two versions of the GGF (Ricker, 1975) were fitted, one with 3 parameters and the other with 2 parameters and a fixed L0. The same value of L0 that was used in the 2-parameter VBGF model (84 cm FL) was used in the second GGF model:
Lt = L0eG[1 – e(– kt)], (6)
where G = the instantaneous rate of growth at time t;
Lt = the mean length at age t; k = the rate of decrease in G; and L0 = length at birth.
The size distribution of the sample was plotted and analyzed in R with ggplot2 (Wickham, 2009). All but 1 of the 5 growth models were fitted in R, by using non-linear least squares with the Gauss-Newton algorithm (nls function in R). The generalized VBGF model was fitted through the use of nonlinear least squares with a grid-search technique (package nls2; Grothendieck, 2013). For each model, the mean values of parameters were estimated, and the standard errors and 95% CIs of those estimates were calculated. Furthermore, model goodness-of-fit was assessed with the Akaike informa-tion criterion (AIC) and the Bayesian information cri-terion values. A likelihood ratio test (LRT), as defined by Kimura (1980) and recommended by Cerrato (1990), was used to test the null hypothesis that there is no difference in growth parameters between males and fe-males for the bigeye thresher. The growth parameters of the samples from the North and South Atlantic Ocean were also compared. For the purposes of this analysis, the samples from the 2 hemispheres were separated on the basis of the 5°N parallel, as recommended in the ICCAT manual for shark species (ICCAT6).
6 ICCAT (International Commission for the Conservation of
Results
Samples
Of the 546 vertebrae of bigeye thresher, 501 were used for the age and growth analysis because they had at least 2 identical readings. From these samples, 258 vertebrae were from females (52%) and 241 vertebrae were from males (48%); the sex of 2 specimens could not be determined. The size distribution used in this study ranged from 102 to 265 cm FL for females (mean: 165.7 cm FL [standard deviation (SD)] 32.8) and from 94 to 260 cm FL for males (mean: 170.2 cm FL [SD 30.9]) (Fig. 3).
The sample size for vertebrae of bigeye thresher that were collected in the North Atlantic Ocean was 358 (200 from females and 158 from males), and the size distribution ranged from 94 to 242 cm FL (mean: 159.3 cm FL [SD 29.9]). The sample size for vertebrae that were collected in the South Atlantic Ocean was 141 (58 from females and 83 from males), and size dis-tribution ranged from 128 to 260 cm FL (mean: 189.5 cm FL [SD 26.2]).
Atlantic Tunas). 2013. ICCAT Manual. [Online publica-tion under development]. [Available at website, accessed January 2014.]
Figure 3Length-frequency distributions of the (A) female and (B) male bigeye thresher (Alopias superciliosus) collected between 2007 and 2009 and used to estimate the age and growth of this species in the Atlantic Ocean. These histograms show size classes by increments of 5 cm in fork length.
Fork length (cm)
Co
unt
(N)
20
15
10
5
0
20
15
10
5
080 120 160 200 240
A
B

Fernandez-Carvalho et al.: Age and growth of Alopias superciliosus in the Atlantic Ocean 473
Age estimation and comparison of age readings
Although the vertebrae of bigeye thresher were in gen-eral difficult to read, the birth band was easily identifi-able because it coincides with an angle change in the corpus calcareum of vertebrae (Goldman and Musick, 2005). A high degree of agreement over time was ob-served between the 3 readings of the primary reader, with the PA between the first and second, first and third, and second and third readings being 46%, 43% and 87%, respectively. Of the vertebrae examined, 91.8% had at least 2 identical readings (94.4% within one growth band) and, therefore, were accepted for growth
modeling. The CV between the 3 readings of the primary reader was 10%, and the APE was 7.7%. In a graphical compari-son with age-bias plots, a high agreement with no systematic bias was observed be-tween the first 2 readings and the last reading of the primary reader (Fig. 4). The chi-square tests of symmetry showed little evidence of systematic differences between these readings, and only one test indicated marginally significant dif-ferences (McNemar test of readings 2 and 3: χ2=4, df=1, P=0.046) (Table 1).
In the hexagon plot (Fig. 5), 3 axes correspond with readings 1, 2, and 3. If all 3 readings are the same, the triplet is plotted in the center, regardless of the reading values (e.g., 1,1,1 or 3,3,3). If 2 of the readings agree, the observation will fall along one of the axis lines; for example, a reading of 3,3,5 will fall along the line where readings 1 and 2 agree, and the point will be 2 units away from the center (because the observation that disagrees is 2 values higher than the readings that agree). Similarly, a read-ing of 6,6,8 will fall on top of the reading of 3,3,5. If all 3 readings are equivalent (i.e., interchangeable), then there would be an overall symmetry. That is, each tri-angle would have the same number of ob-servations, and the 6 rays from the cen-ter outward would have the same number of observations (except for discrepancies solely due to sampling error).
The hexagon plot developed in this study shows that most of the observations fell on the A axis (the horizontal line) (Fig. 5). This placement of observations in the plot corresponds with the second reading (B) equaling the third reading (C) and with the first reading (A) being more variable than the other 2 readings. However, the tests of symmetry did not reveal significant differences that would have supported systematic changes in the readings over time toward higher or
lower values (i.e., the aging criteria remained stable). As time passed, the primary reader’s readings showed less variability but did not change systematically be-cause there was little evidence of differences between the readings from causes other than random error.
Growth modeling
The ages estimated in this study ranged from 0 (young of the year) to 25 years for both sexes. Of the 5 growth models used, the generalized VBGF with 4 parameters was the only model that did not converge, even when the grid-search technique (with the starting values
Figure 4Age-bias plots of pairwise comparisons of mean ages for the 3 readings by the primary reader: (A) reading 1 versus reading 2 and (B) read-ing 2 versus reading 3. The readings were based on an examination of vertebrae taken from bigeye thresher (Alopias superciliosus) collected between 2007 and 2009 and used to estimate the age and growth of this species in the Atlantic Ocean.
Mea
n ag
e (r
ead
ing
1)
Age (reading 3)
Age (reading 3)
Mea
n ag
e (r
ead
ing
2)
0 2 4 6 8 10 12 14 16 18 20 22 24
0 2 4 6 8 10 12 14 16 18 20 22 24
A
B
24
22
20
18
14
12
10
8
6
4
2
0
24
22
20
18
14
12
10
8
6
4
2
0

474 Fishery Bulletin 113(4)
varying between a range of possible values) was used. The growth parameters obtained from the regular 3-parameter VBGF model were considered best for de-scribing the growth of this species for both sexes. This designation was decided on the basis of both the statis-tical goodness-of-fit of this model and because the esti-mated biological parameters obtained seemed realistic. When this VBGF model was used, the estimated Linf values were always higher and the k values were lower than those values obtained from the VBGF model with a fixed L0, for both females (Linf=284.2 cm FL, k=0.06/
year) and males (Linf=245.6 cm FL, k= 0.09/year) (Ta-ble 2; Fig. 6). When the GGF models were used, a simi-lar pattern was found, with the GGF producing lower k values for both sexes than the values obtained from the GGF model with a fixed L0.
With the LRT tests (Kimura, 1980), significant dif-ferences were found between sexes in all the esti-mated VBGF parameters, except for the L0 (Linf LRT: χ2=6.08, df=1, P<0.05; k LRT: χ2=4.13, df=1, P<0.05; L0 LRT: χ2=1.66, df=1, P>0.05; combined parameters LRT: χ2=9.69, df=3, P<0.05). For all models, k values were lower and Linf values were higher for females than for males.
When we compared the growth of bigeye thresher between the 2 hemispheres (North and South Atlan-tic Ocean), only the 2-parameter VBGF model with a fixed L0 converged for the separate sexes in each hemi-sphere and the traditional VBGF model converged for the North Atlantic Ocean but not for the South Atlan-tic Ocean. Therefore, the VBGF model with a fixed L0 was used to obtain and compare the growth parameters for the 2 hemispheres (Table 3). The overlaps in the 95% CIs of the parameters were used for this compari-son. There was no overlapping of the 95% CIs between the North and South Atlantic Ocean, with the excep-tion of a slight overlap in the Linf for males. For both sexes, the Linf was higher for the South Atlantic Ocean than for the North Atlantic Ocean and the estimated k values were higher for the North Atlantic Ocean (kfe-
males=0.16 [95% CI 0.14, 0.18]; kmales=0.18 [CI 0.15, 0.21]) than for the South Atlantic Ocean (kfemales=0.09 [CI 0.07, 0.11]; kmales=0.13 [CI 0.11, 0.15]).
Discussion
Several approaches were used in this study to evaluate the precision of age estimates and to test for bias in the age determinations of bigeye thresher, as suggested by Goldman et al. (2012): PA, PA ±1 year, APE, CV, age-bias plots, and tests of symmetry. To our knowl-edge, this study is the first to test the symmetry of 3
Table 1
Results from the 2 forms of chi-square (χ2) tests of symmetry used to compare and detect nonrandom differences between the 3 sets of age readings of bigeye thresher (Alopias superciliosus), the McNemar maximally pooled method and the Evans and Hoenig method that pools along diagonals (Hoening et al., 1995; Evans and Hoenig, 1998). The vertebrae were collected in the Atlantic Ocean between September 2007 and December 2009.
McNemar Evans and Hoenig
Readings χ2 P χ2 df P
Reading 1 vs. reading 2 0.03 0.85 3.18 7 0.87Reading 1 vs. reading 3 0.51 0.47 3.98 7 0.78Reading 2 vs. reading 3 4.00 0.05 8.49 5 0.13
Figure 5Hexagon plot used to test the symmetry of the 3 readings of growth bands in vertebrae taken from bigeye thresher (Alopias superciliosus) collected between 2007 and 2009 and used to estimate the age and growth of this species in the Atlantic Ocean. The 3 axes correspond to the first reading (A), second reading (B), and third reading (C). The numbers refer to the number of triplets at each location on the plot, and all possible locations are represented as gray circles.

Fernandez-Carvalho et al.: Age and growth of Alopias superciliosus in the Atlantic Ocean 475
Table 2
Estimated means for growth parameters of bigeye thresher (Alopias superciliosus) collected from the Atlantic Ocean between 2007 and 2009, obtained with the regular 3-parameter von Bertalanffy growth function (VBGF) model, the VBGF model with a fixed size at birth (L0), the 3-parameter Gompertz growth function (GGF) model, and the GGF model with a fixed L0 (L0=84 cm in fork length). For each model, the estimated means for parameters, including asymptotic maximum length (Linf), growth coefficient (k), size at birth (L0), and instantaneous rate of growth (G), are given with their respective standard errors (SE) and 95% confidence intervals (CIs). The Akaike information criterion (AIC) and Bayesian information criterion (BIC) values are given for a comparison of models within each sex group.
95% CI
Sex Model AIC BIC Parameter Mean SE Lower Upper
Sexes combined Linf 263.50 7.516 248.75 278.28 VBGF 3827.1 3843.9 k 0.07 0.006 0.06 0.08 L0 108.80 1.623 105.63 112.01
VBGF fixed L0 3984.0 3996.6
Linf 224.70 2.513 219.72 229.59 k 0.14 0.005 0.13 0.15
G 0.80 0.016 0.77 0.83 GGF 3837.1 3854.0 k 0.11 0.007 0.09 0.12 L0 110.90 1.494 107.91 113.79
GGF fixed L0 4042.2 4054.8
G 0.94 0.009 0.92 0.96 k 0.22 0.006 0.20 0.23
Males Linf 245.60 7.535 230.73 260.42 VBGF 1831.0 1845 K 0.09 0.009 0.07 0.10 L0 108.50 2.306 103.91 113.00
VBGF Fixed L0 1908.8 1919.2
Linf 218.10 3.077 211.99 224.11 K 0.16 0.008 0.14 0.18
G 0.75 0.020 0.71 0.79 GGF 1835.4 1849.4 K 0.12 0.010 0.10 0.14 L0 110.30 2.143 106.10 114.55
GGF fixed L0 1936.2 1946.6
G 0.92 0.011 0.90 0.94 K 0.23 0.009 0.21 0.25
Females Linf 284.20 14.430 255.76 312.60 VBGF 1993.3 2007.5 k 0.06 0.008 0.04 0.08 L0 109.00 2.249 104.61 113.47
VBGF fixed L0 2073.7 2084.3
Linf 231.90 4.037 223.99 239.89 k 0.13 0.007 0.12 0.15
G 0.86 0.027 0.80 0.91 GGF 1998.5 2012.8 k 0.10 0.009 0.08 0.11 L0 111.20 47.000 107.20 115.27
GGF fixed L0 2105.9 2116.5
G 0.96 0.014 0.94 0.99 k 0.20 0.008 0.19 0.22
age counts by using a hexagon plot, as described by Evans and Hoenig (1998). The values obtained in this study, together with the results of the age-bias and symmetry plots, indicate that our age estimates are consistent and adequate for this species.
It was not possible to objectively determine mar-ginal growth increments because of the morphological structure of the vertebrae of bigeye thresher; these ver-tebrae were very difficult to read as a result of the nar-row and faint bands at their edges. Few studies on the
age and growth of alopiid sharks exist, and of these the majority of studies have focused on the Pacific Ocean (bigeye thresher: Liu et al., 1998; common thresher shark (A. vulpinus): Cailliet and Bedford, 1983; Smith et al., 2008; and pelagic thresher (A. pelagicus): Liu et al., 1999), only 2 studies have been conducted within the North Atlantic Ocean (bigeye thresher: Fernandez-Carvalho et al., 2011; common thresher shark: Gervelis and Natanson, 2013), and 1 study in the South Atlantic Ocean (bigeye thresher: Mancini, 2005).

476 Fishery Bulletin 113(4)
(1999) verified the same pattern for the pelagic thresher, in both cases using marginal increment analysis for populations of the northwestern Pa-cific Ocean. In the Atlantic Ocean, Mancini (2005) attempted marginal increment analysis and cen-trum edge analysis that weakly supported an-nual growth-band formation. Also in the Atlantic Ocean, preliminary centrum edge analysis (with limited samples from 6 months of each year) was conducted for bigeye thresher, also indicating a seasonal pattern in band formation (Fernandez-Carvalho et al., 2011). Therefore, although no age verification or validation was carried out in the study presented here, the assumption of a one-band-per-year periodicity for this species is rea-sonable in light of the few available studies.
Furthermore, in age and growth studies of other species of lamniform sharks an annual band deposition has been validated. Natanson et al. (2002), who used vertebrae from recaptured oxytetracycline-injected porbeagle (Lamna na-sus), proposed that vertebral band pairs are de-posited annually. On the other hand, Francis et al. (2007), when performing bomb radiocarbon as-says, found that the ages of older porbeagle (>20 years) were underestimated from vertebral band counts, indicating that in some long-lived shark species, after a certain age, either growth bands are deposited on vertebrae in extremely narrow increments (and are impossible to recognize) or vertebrae cease to grow altogether. Nevertheless, Campana et al. (2002) and Francis et al. (2007) found that it was possible to validate that the visible growth bands were formed annually, with no gaps, for the first 20 years of life in porbeagle.
The same periodicity of one band per year was validated for the shortfin mako (Isurus oxyrin-chus), both by bomb carbon chronology and by oxytetracycline marking (Ardizzone et al., 2006; Natanson et al., 2006). Finally, Wintner and Cliff (1999) stated that, although they could not deter-mine band periodicity by using marginal incre-ment analysis in the white shark (Carcharodon carcharias) off the coast of South Africa, annual deposition was indicated for one specimen that had been tagged with oxytetracycline and recap-tured. More recently, Hamady et al. (2014), us-ing bomb radiocarbon, also observed deposition of one band pair per year for white shark from the northwestern Atlantic Ocean up to 44 years old. On the other hand, Hamady et al. (2014) and An-drews and Kerr (2015) suggested that some age underestimation for older white shark resulted from change in the rate of deposition of vertebral material or from the narrowing of the growth
bands to the point of becoming unreadable. Therefore, there is a growing body of evidence that
annual banding counts of growth bands in shark ver-tebrae may not provide an accurate estimate of maxi-mum age, given that long-lived sharks can become con-
Figure 6Growth curves estimated for (A) male and (B) female big-eye thresher (Alopias superciliosus), collected between 2007 and 2009 in the Atlantic Ocean by using models fitted with data from readings of vertebrae. Results are presented for the regular 3-parameter von Bertalanffy growth function (VBGF) model reparameterized to estimate size at birth (L0), the VBGF model with a fixed L0, the 3-parameter Gom-pertz growth function (GGF) model, and the GGF model with a fixed L0 (L0=84 cm in fork length). The bottom panel (C) shows the growth curve estimated with the regular VBGF model, which was selected on the basis of the statistical goodness-of-fit as the best model for describing the growth of this species for both males and females and highlighting the differences in growth between the sexes.
Fo
rk l
eng
th (
cm)
Age (years)
A
B
C
Fo
rk l
eng
th (
cm)
Fo
rk l
eng
th (
cm)
Age (years)
Age (years)
Of these studies, only in 3 of them was age verifica-tion attempted and in none of them was age validation attempted. Liu et al. (1998) verified a periodicity of one band (composed of one opaque ring and one hya-line ring) per year in bigeye thresher, and Liu et al.

Fernandez-Carvalho et al.: Age and growth of Alopias superciliosus in the Atlantic Ocean 477
siderably older than the age at which band counting is no longer possible for aging (Francis et al., 2007; Andrews et al., 2011; Hamady et al., 2014; Passerotti et al., 2014; Andrews and Kerr, 2015). Underestimation of longevity may cause little change in the estimation of growth parameters, but the life-time reproductive pro-ductivity of long-lived sharks would be greater (Pas-serotti et al., 2014). Despite the lack of validation for bigeye thresher in this study, the growth data present-ed are the most comprehensive age estimates for this species for the North and South Atlantic Ocean and, as such, are an important contribution to our understand-ing of the biology of this species. Nonetheless, it should be noted that these estimates should be used with cau-tion for stock assessment and management decisions until a definitive age validation is accomplished.
In this study, all growth parameters estimated with the 4 growth models that converged had biologically reasonable values. The differences between the AIC values of the VBGF model with the lowest AIC (3-pa-rameter VBGF model) and the 3-parameter GGF for both sexes were small (DAIC males=4.4; DAIC females=5.2), but the differences between the VBGF model with the lowest AIC and both the VBGF and GGF models with a fixed L0 were high (>10); therefore, these models with a fixed L0 should be discarded, as suggested by Katsa-nevakis (2006). Nevertheless, it should be noted that when considering VBGF and GGF models with a fixed L0, different authors give different values for size at birth (e.g., Bass et al., 1975; Moreno and Morón, 1992; Gilmore, 1993) and that changing this value will affect the estimation of the other parameters (Pardo et al., 2013). On the other hand, although the GGF models also produced realistic growth parameters, this growth function has been described as better suited for batoids (or elasmobranchs that hatch from eggs), for which vol-ume increases more with age than with length (e.g.,
Myliobatiformes) (Goldman et al., 2012). Because the growth parameters obtained by the 3-parameter VBGF model had the best statistical fit and seemed to be bio-logically realistic, we recommend its use for describing the growth of bigeye thresher.
To our knowledge, this study is the first comprehen-sive one for the age and growth of bigeye thresher, cov-ering both the North and South Atlantic Ocean. Initial growth curves have been produced by Fernandez-Carv-alho et al. (2011) for the region of the Cape Verde Ar-chipelago in the tropical northeastern Atlantic Ocean. Because the sample size and coverage area in that study were relatively small, these samples collected in Cape Verde Archipelago have been included in the study described in this article. In comparisons of the parameters from our most recent study with our previ-ous estimates for the Cape Verde region, the main dif-ferences were observed among Males; among females, the growth parameters were similar (Table 4). The k value obtained in this study for males (k=0.09/year) was lower than our first estimate (k=0.18/year), and the Linf of 245.6 cm FL for this study was higher than the Linf of 206.0 cm FL for just the Cape Verde region.
The growth parameters obtained in this study are comparable with those parameters generated by Liu et al. (1998) for the population in the northwestern Pa-cific Ocean and by Mancini (2005) for the southwestern Atlantic Ocean—with some differences. Females in our study grew to a larger size (Linf=284.2 cm FL) but did so at a slower rate (k=0.06/year) than did the females in the study in the northwestern Pacific Ocean (Linf=241.7 cm FL, k=0.09/year) (Table 4). On the other hand, males sampled in our study grew to a slightly larger size (Linf=245.6 cm FL) but did so at a rate similar to that of males described for the northwestern Pacific Ocean (Linf=235.5 cm FL, k=0.09/year) (Table 4). Man-cini (2005) presented Linf values higher than those of
Table 3
Estimated means of growth parameters for bigeye thresher (Alopias superciliosus) col-lected from the North and South Atlantic Ocean between 2007 and 2009, obtained with the VBGF model with a fixed size at birth (L0=84 cm in fork length [FL]). For the models for each sex and region, the parameter means are given with their respective standard errors (SE) and 95% confidence intervals (CIs). Linf=asymptotic maximum length, given in FL; k=growth coefficient per year.
95% CI
Sex Atlantic Parameter Estimate SE Lower Upper
Males North Linf 211.77 4.64 202.62 220.93 k 0.18 0.01 0.15 0.21 South Linf 229.00 5.10 218.85 239.15 k 0.13 0.01 0.11 0.15Females North Linf 219.20 4.34 210.64 227.77 k 0.16 0.01 0.14 0.18 South Linf 265.70 11.34 243.01 288.43 k 0.09 0.01 0.07 0.11

478 Fishery Bulletin 113(4)
Table 4
Comparison of von Bertalanffy growth function (VBGF) parameters from studies (carried out worldwide) of age and growth of species of Alopias : bigeye thresher (A. superciliosus), common thresher shark (A. vulpinus), and pelagic thresher (A. pelagicus). The parameters presented in this table are asymptotic maximum length (Linf) and growth coefficient per year (k). An asterisk (*) indicates data for sexes combined, and 2 asterisks (**) indicate sizes in precaudal length. NA=values not available.
Size range Sample Max. obs Study Sex (FL, cm) size (n) Linf k age (y) Region Species
This study Males 94–260 241 245.6 0.09 25 Atlantic wide A. superciliosus Females 102–265 258 284.2 0.06 25
Fernandez-Carvalho Males 101–210 42 206.0 0.18 17 NE Tropical A. superciliosus et al. (2011)1 Females 115–242 73 293.0 0.06 22 Atlantic
Liu et al. (1998)2 Males NA–213.5 214 235.5 0.09 20 NW Pacific A. superciliosus Females NA–256.5 107 241.7 0.09 21 (Taiwan)
Mancini (2005)3 Males 162–232 73 272 0.073 18 SW Atlantic A. superciliosus Females 164–245 87 296 0.06 19
Cailliet and Bedford Males 35.1–312.7* 143* 271.1 0.22 15* NE Pacific A. vulpinus (1983)4 Females 345.2 0.16 (California/Oregon)
Smith et al. (2008)5 Males NA 83 229.7 0.19 19 NE Pacific A. vulpinus Females NA 129 253.9 0.12 22 (California/Oregon)
Gervelis and Males 56.3–264.4* 135 227.9 0.16 22 NW Atlantic A. vulpinus Natanson (2013)6 Females 173 274.5 0.09 24 (NE USA)
Liu et al. (1999)7 Males NA 323 182.2** 0.12 14 NW Pacific A. pelagicus Females NA 508 197.2** 0.09 16 (Taiwan)
1 Fernandez-Carvalho, J., R. Coelho, K. Erzini, and M. N. Santos. 2011. Age and growth of the bigeye thresher shark, Alopias superciliosus, from the pelagic longline fisheries in the tropical northeastern Atlantic Ocean, determined by vertebral band counts. Aquat. Living Resour. 24:359–368.
2 Liu, K.-M., P.-J. Chiang, and C.-T. Chen. 1998. Age and growth estimates of the bigeye thresher shark, Alopias superciliosus, in northeastern Taiwan waters. Fish. Bull. 96: 482–491.
3 Mancini, P. L. 2005. Estudo Biológico-pesqueiro do tubarão-raposa, Alopias superciliosus (Lamniformes, Alopiidae) captura-do no sudeste-sul do Brasil. M.S. thesis, 195 p. São Paulo State Univ., São Paulo, Brazil.
4 Cailliet, G. M., and D. W. Bedford. 1983. The biology of three pelagic sharks from california waters, and their emerging fisheries: a review. CalCOFI Rep. 24:57–69.
5 Smith, S. E., R. C. Rasmussen, D. A. Ramon, and G. M. Cailliet. 2008. The biology and ecology of thresher sharks (Alopiidae). In Sharks of the open ocean: biology, fisheries and conservation (M. D. Camhi, E. K. Pikitch, and E. A. Babcock, eds.), p. 60–68. Blackwell Publ., Oxford, UK.
6 Gervelis, B. J., and L. J. Natanson. 2013. Age and growth of the common thresher shark in the western North Atlantic Ocean. Trans. Am. Fish. Soc. 142:1535–1545.
7 Liu, K.-M., C.-T. Chen, T.-H. Liao, and S.-J. Joung. 1999. Age, growth, and reproduction of the pelagic thresher shark, Alopias pelagicus in the northwestern Pacific. Copeia 1999:68–74.
VBGF parameters
our estimates for both males and females (Linf=272 and 296 cm FL) and similar k values for females (k=0.06/year) and slightly lower values for males (k=0.07/year). In age and growth studies, there is a high potential for bias in specimen sampling; therefore, these differences could be explained by the fact that our sample con-tained both female and male bigeye thresher of larger sizes and consequently of older ages than the males and females in the study in the northwestern Pacific Ocean (Liu et al., 1998).
The values of Linf obtained in our study were close to the maximum sizes of bigeye thresher reported in
the literature (Gruber and Compagno, 1981; Moreno and Morón, 1992; Liu et al., 1998; Mancini 2005). The k values obtained in our study (and by Mancini, 2005) for bigeye thresher are the lowest growth coefficients ever presented for this species and within the Alopi-idae (Table 4), highlighting the slow growth pattern of this species and its consequent vulnerability to fishing pressure and mortality.
As has been described for other shark species, the growth of bigeye thresher was statistically different for males and females, with a lower k value and higher Linf value observed for females than for males (e.g.,

Fernandez-Carvalho et al.: Age and growth of Alopias superciliosus in the Atlantic Ocean 479
Piercy et al., 2007; Coelho et al., 2011; Gervelis and Natanson, 2013). Therefore, it is advisable to use the growth parameters obtained specifically for each sex, instead of the parameters obtained for the sexes com-bined. The growth curves of both sexes were similar until age 10, after which males exhibited a consider-able reduction in growth rate, and females showed a straighter growth curve.
Future studies of this species should include more samples from the South Atlantic Ocean, and especially of the smaller and larger length classes, because some difficulties occurred when comparing results for sam-ples from the 2 hemispheres. These difficulties were due to not only the relatively smaller sample size for the Southern Hemisphere but also the fact that most samples from the North Atlantic Ocean were collected around the Cape Verde Archipelago, where the majority of the specimens tended to be small (size distribution: North Atlantic Ocean, 102–242 cm FL; South Atlantic Ocean, 128–265 cm FL). The differences observed in the growth of bigeye thresher samples from the North and South Atlantic Ocean, especially for females, indi-cate slower growth rates for the southern population. However, because this species seems to be segregated by size and sex, the differences in the VBGF parame-ters may also be caused by the possibility that we mod-eled 2 parts of the same population. The differences do not necessarily indicate the existence of 2 distinct populations. Future studies of this species should ad-dress the genetic structure and population delimitation in the Atlantic Ocean.
Accurate age information is vital for obtaining qual-ity estimates of growth, which in turn are essential for successful and sustainable fisheries management. The growth parameters determined in this study and pre-sented here are the first estimates for bigeye thresher that cover an extensive area in the Atlantic Ocean, and they now can be incorporated into stock assessment models to improve science-based fishery management and conservation initiatives. The slow growth rates de-termined in our study indicate a high susceptibility to fishery-induced mortality for this species and, there-fore, the importance of protecting it. Although the big-eye thresher is managed currently and some conserva-tion measures are already in place (ICCAT1 prohibits onboard retention), its slow growth rates, together with its high mortality at haulback, indicate the need for further studies to help implement additional conser-vation measures designed to prevent increased fishing mortality and population declines.
Acknowledgments
This study was funded by projects THRESHER (Por-tuguese Foundation for Science and Technology [FCT] proj. PTDC/MAR/109915/2009), SELECT-PAL (PRO-Mar proj. 31-03-05-FEP-1), and the EU Data Collection Framework. We thank the skippers and crews of sev-eral Portuguese longliners, as well as the technicians
(S. Amorim, M. Cerqueira, S. Góis, I. Ribeiro, J.R. Táta, and C. Barbosa) for collecting samples. We are grateful to G. Burgess and A. Piercy (Florida Museum of Natu-ral History) for their help with processing vertebrae and to J. Hoenig (Virginia Institute of Marine Science) for providing the R code and helping with the inter-pretation of the hexagon plots. J. Fernandez-Carvalho was supported with a doctoral grant from FCT (grant ref: SFRH/BD/60624/2009), and R. Coelho was support-ed by an Investigador-FCT contract funded by the EU European Social Fund and Programa Operacional Po-tencial Humano (ref: IF/00253/2014). We also thank A. Andrews (NOAA Fisheries) and 2 anonymous review-ers for their comments and suggestions that greatly improved this manuscript.
Literature cited
Amorim, A., J. Baum, G. M. Cailliet, S. Clò, S. C. Clarke, I. Fergusson, M. Gonzalez, D. Macias, P. Mancini, C. Mancusi, R. Myers, M. Reardon, T. Trejo, M. Vacchi, and S. V. Valenti. 2009. Alopias superciliosus. In IUCN Red List of Threat-
ened Species, vers. 2013.2. [Available at website, ac-cessed June 2014.]
Andrews, A. H, and L. A. Kerr. 2015. Validated age estimates for large white sharks of
the northeastern Pacific Ocean: altered perceptions of vertebral growth shed light on complicated bomb Δ14C results. Environ. Biol. Fish. 98:971–978. Article
Andrews, A. H., L. J. Natanson, L. A. Kerr, G. H. Burgess, and G. M. Caillet.2011. Bomb radiocarbon and tag-recpture dating of
sandbar shark (Carcharhinus plumbeus). Fish. Bull. 109:454–465.
Ardizzone, D., G. M. Cailliet, L. J. Natanson, A. H. Andrews, L. A. Kerr, and T. A. Brown.2006. Application of bomb radiocarbon chronologies to
shortfin mako (Isurus oxyrinchus) age validation. Envi-ron. Biol. Fish. 77:355–366. Article
Bass, A. J., J. D. D’Aubrey, and N. Kistnasamy.1975. Sharks of the east coast of southern Africa. IV. The
families Odontaspididae, Scapanorhynchidae, Isuridae, Cetorhinidae, Alopiidae, Orectolobidae and Rhiniodonti-dae. Invest. Rep. 39, 99 p. Oceanogr. Res. Inst., Dur-ban, South Africa.
Beamish, R. J., and D. A. Fournier.1981. A method for comparing the precision of a set
of age determinations. Can. J. Fish. Aquat. Sci. 38:982–983. Article
Berrondo, L., M. Pons, R. Forselledo, P. Miller, and A. Domingo.2007. Distribución espaciotemporal y composición de tal-
las de Alopias superciliosus y A. vulpinus observados en la flota palangrera Uruguaya en el océano Atlántico (2001–2005). Collect. Vol. Sci. Pap. ICCAT 60:566–576.
Bigelow, H. B., and W. C. Shroeder.1948. Sharks. In Fishes of the Western North Atlantic,
part one. Lancelets, cyclostomes, sharks (A. E. Parr and Y. H. Olsen, eds.), p. 59–564. Sears Found. Mar. Res., Yale Univ., New Haven, CT.
Buencuerpo, V., S. Rios, and J. Morón.1998. Pelagic sharks associated with the swordfish, Xiphi-

480 Fishery Bulletin 113(4)
as gladius, fishery in the eastern North Atlantic Ocean and the Strait of Gibraltar. Fish. Bull. 96:667–685.
Cailliet, G. M., and D. W. Bedford.1983. The biology of three pelagic sharks from california
waters, and their emerging fisheries: a review. CalCOFI Rep. 24:57–69.
Cailliet, G. M., and K. J. Goldman.2004. Age determination and validation in chondrich-
thyan fishes. In Biology of sharks and their relatives (J. Carrier, J. A. Musick, and M. R. Heithaus, eds.), p. 399–447. CRC Press, Boca Raton, FL.
Cailliet, G. M., W. D. Smith, H. F. Mollet, and K. J. Goldman.2006. Age and growth studies of chondrichthyan fishes:
the need for consistency in terminology, verification, vali-dation, and growth function fitting. Environ. Biol. Fish. 77:211–228. Article
Campana, S. E.2001. Accuracy, precision and quality control in age deter-
mination, including a review of the use and abuse of age validation methods. J. Fish Biol. 59:197–242. Article
Campana, S. E., L. J. Natanson, and S. Myklevoll.2002. Bomb dating and age determination of large pelagic
sharks. Can. J. Fish. Aquat. Sci. 59:450–455. ArticleCao, D.-M., L.-M. Song, Y. Zhang, K.-K. Lv, and Z. X. Hu.
2011. Environmental preferences of Alopias supercilio-sus and Alopias vulpinus in waters near Marshall Is-lands. N.Z. J. Mar. Freshw. Res. 45:103–119. Article
Castro, J., J. M. Serna, D. Mácias, and J. Mejuto.2000. Estimaciones científicas de los desembarcos de espe-
cies asociadas realizados por la flota española de palan-gre de superficie en 1997 y 1998. Collect. Vol. Sci. Pap. ICCAT 51:1882–1893.
Cerrato, R. M.1990. Interpretable statistical tests for growth compari-
sons using parameters in the von Bertalanffy equa-tion. Can. J. Fish. Aquat. Sci. 47:1416–1426. Article
Chang, W. Y. B.1982. A statistical method for evaluating the reproduc-
ibility of age determination. Can. J. Fish. Aquat. Sci. 39:1208–1210. Article
Chen, P., and W. Yuan.2006. Demographic analysis based on the growth param-
eter of sharks. Fish. Res. 78:374–379. ArticleChen, C.-T., K.-M. Liu, and Y.-C. Chang.
1997. Reproductive biology of the bigeye thresher shark, Alopias superciliosus (Lowe, 1839) (Chondrichthyes: Alopiidae), in the northwestern Pacific. Ichthyol. Res. 44:227–235. Article
Coelho, R., and K. Erzini.2002. Age and growth of the undulate ray, Raja undulata,
in the Algarve (Southern Portugal). J. Mar. Biol. Assoc. U.K. 82:987–990. Article
2006. Reproductive aspects of the undulate ray, Raja un-dulata, from the south coast of Portugal. Fish. Res. 81:80–85. Article
2007. Population parameters of the smooth lantern shark, Etmopterus pusillus, in southern Portugal (NE Atlan-tic). Fish. Res. 86:42-57. Article
2008. Life history of a wide-ranging deepwater lantern shark in the north-east Atlantic, Etmopterus spinax (Chondrichthyes: Etmopteridae), with implications for conservation. J. Fish Biol. 73: 1419–1443. Article
Coelho, R., J. Fernandez-Carvalho, S. Amorim, and M. N. Santos.2011. Age and growth of the smooth hammerhead shark,
Sphyrna zygaena, in the Eastern Equatorial Atlan-
tic Ocean, using vertebral sections. Aquat. Living Resour.24:351–357. Article
Coelho, R., J. Fernandez-Carvalho, P. G. Lino, and M. N. Santos.2012. An overview of the hooking mortality of elas-
mobranchs caught in a swordfish pelagic longline fishery in the Atlantic Ocean. Aquat. Living Resour. 25:311–319. Article
Compagno, L. J. V.2001. Sharks of the world. An annotated and illustrated
catalogue of shark species known to date. Vol. 2. bull-head, mackerel and carpet sharks (Heterodontiformes, Lamniformes and Orectolobiformes). FAO Species Cata-logue for Fishery Purposes 1, 269 p. FAO, Rome.
Cortés, E.2008. Comparative life history and demography of pelagic
sharks. In Sharks of the open ocean: biology, fisheries and conservation (M. D. Camhi, E. K. Pikitch, and E. A. Babcock, eds.), p. 309–322. Blackwell Publ., Oxford, UK.
Cortés, E., F. Arocha, L. Beerkircher, F. Carvalho, A. Domingo, M. Heupel, H. Holtzhausen, M. N. Santos, M. Ribera, and C. Simpfendorfer.2010. Ecological risk assessment of pelagic sharks caught
in Atlantic pelagic longline fisheries. Aquat. Living Re-sour. 23:25–34. Article
Evans, G. T., and J. M. Hoenig.1998. Testing and viewing symmetry in contingency ta-
bles, with application to readers of fish ages. Biometrics 54:620–629. Article
Fernandez-Carvalho, J., R. Coelho, K. Erzini, and M. N. Santos.2011. Age and growth of the bigeye thresher shark,
Alopias superciliosus, from the pelagic longline fisher-ies in the tropical northeastern Atlantic Ocean, deter-mined by vertebral band counts. Aquat. Living Resour. 24:359–368. Article
Francis, M. P., S. E. Campana, , and C. M. Jones.2007. Age under-estimation in New Zealand porbeagle
sharks (Lamna nasus): is there an upper limit to ages that can be determined from shark vertebrae? Mar. Freshw. Res. 58:10–23. Article
Gervelis, B. J., and L. J. Natanson.2013. Age and growth of the common thresher shark in
the western North Atlantic Ocean. Trans. Am. Fish. Soc. 142:1535–1545. Article
Gilmore, R. G.1993. Reproductive biology of lamnoid sharks. Environ.
Biol. Fish. 38:95–114. ArticleGoldman, K. J.
2004. Age and growth of elasmobranch fishes. In Elas-mobranch fisheries management techniques (J. A. Mu-sick and R. Bonfil, eds.), p. 97–132. APEC Secretariat, Singapore.
Goldman, K. J., G. M. Cailliet, A. H. Andrews, and L. J. Natanson.2012. Assessing the age and growth of Chondrichthyan
fishes. In Biology of sharks and their relatives, 2nd ed. (J. C. Carrier, J. A. Musick, and M. R. Heithaus, eds.), p. 423–451. CRC Press, Boca Raton, FL.
Goldman, K. J., and J. A. Musick.2005. Growth and maturity of salmon sharks (Lamna
ditropis) in the eastern and western North Pacific, and comments on back-calculation methods. Fish. Bull. 104:278–292.
Grothendieck, G.2013. nls2: non-linear regression with brute force. R
package, vers. 0.2. [Available at website, accessed May 2013.]

Fernandez-Carvalho et al.: Age and growth of Alopias superciliosus in the Atlantic Ocean 481
Gruber, S. H., and L. J. V. Compagno.1981. Taxonomic status and biology of the bigeye thresher,
Alopias superciliosus. Fish. Bull. 79:617–640.Hamady, L. L., L. J. Natanson, G. B. Skomal, and S. R.
Thorrold.2014. Vertebral bomb radiocarbon suggests extreme lon-
gevity in white sharks. PLoS ONE 9(1):e84006. ArticleHoening, J. M., M. J. Morgan, and C. A. Brown.
1995. Analysing differences between two age determina-tion methods by tests of symmetry. Can. J. Fish. Aquat. Sci. 52:364–368. Article
Katsanevakis, S.2006. Modelling fish growth: model selection, multi-model
inference and model selection uncertainty. Fish. Res. 81:229–235. Article
Kimura, D. K.1980. Likelihood methods for the von Bertalanffy growth
curve. Fish. Bull. 77:765–773.Liu, K.-M., P.-J. Chiang, and C.-T. Chen.
1998. Age and growth estimates of the bigeye thresher shark, Alopias superciliosus, in northeastern Taiwan wa-ters. Fish. Bull. 96: 482–491.
Liu, K.-M., C.-T. Chen, T.-H. Liao, and S.-J. Joung.1999. Age, growth, and reproduction of the pelagic thresh-
er shark, Alopias pelagicus in the northwestern Pacif-ic. Copeia 1999:68–74. Article
Mancini, P. L.2005. Estudo Biológico-pesqueiro do tubarão-raposa, Alo-
pias superciliosus (Lamniformes, Alopiidae) capturado no sudeste-sul do Brasil. M.S. thesis, 195 p., São Paulo State Univ., São Paulo, Brazil.
Megalofonou, P., C. Yannopoulos, D. Damalas, G. De Metrio, M. Deflorio, J. M. de la Serna, and D. Macias.2005. Incidental catch and estimated discards of pelagic
sharks from the swordfish and tuna fisheries in the Med-iterranean Sea. Fish. Bull. 103:620–634.
Mejuto, J., B. García-Cortés, A. Ramos-Cartelle, and J. M. Serna.2009. Scientific estimations of by-catch landed by the
Spanish surface longline fleet targeting swordfish (Xi-phias gladius) in the Atlantic Ocean with special refer-ence to the years 2005 and 2006. Collect. Vol. Sci. Pap. ICCAT 64:2455–2468.
Moreno, J. A., and J. Morón.1992. Reproductive biology of the bigeye thresher shark,
Alopias superciliosus (Lowe, 1839). Aust. J. Mar. Freshw. Res. 43:77–86.
Moura, T., I. Figueiredo, I. Farias, B. Serra-Pereira, R. Coelho, K. Erzini, A. Neves, and L. S. Gordo.2007. The use of caudal thorns for ageing Raja undu-
lata from the Portuguese continental shelf, with com-ments on its reproductive cycle. Mar. Freshw. Res. 58:983–992. Article
Nakano, H., H. Matsunaga, H. Okamoto, and M. Okazaki.2003. Acoustic tracking of bigeye thresher shark Alopias
superciliosus in the eastern Pacific Ocean. Mar. Ecol. Prog. Ser. 265:255–261. Article
Natanson, L. J., J. J. Mello, and S. E. Campana.2002. Validated age and growth of the porbeagle
shark (Lamna nasus) in the western North Atlantic Ocean. Fish. Bull. 100:266–278.
Natanson, L. J., N. E. Kohler, D. Ardizzone, G. M. Cailliet, S. P. Wintner, and H. F. Mollet.2006. Validated age and growth estimates for the short-
fin mako, Isurus oxyrinchus, in the North Atlantic Ocean. Environ. Biol. Fish. 77:367–383. Article
Nelson ,G. A.2013. fishmethods: fishery science methods and models
in R. R package, vers. 1.5-0. [Available at website, ac-cessed February 2014.]
Pardo, S. A., A. B. Cooper, and N. K. Dulvy.2013. Avoiding fishy growth curves. Methods Ecol. Evol.
4:353–360. ArticlePasserotti, M. S., A. H. Andrews, J. K. Carlson, S. P. Wintner,
K. J. Goldman, and L. J. Natanson.2014. Maximum age and missing time in the vertebrae
of sand tiger shark (Carcharias taurus): validated lifes-pan from bomb radiocarbon dating in the western North Atlantic and southwestern Indian Ocean. Mar. Freshw. Res. 65:674–687. Article
Piercy, A. N., J. K. Carlson, J. A. Sulikowski, and G. H. Burgess.2007. Age and growth of the scalloped hammerhead
shark, Sphyrna lewini, in the north-west Atlantic Ocean and Gulf of Mexico. Mar. Freshw. Res 58:34–40. Article
Pikitch, E. K., M. D. Camhi, and E. A. Babcock.2008. Introduction to sharks of the open ocean. In
Sharks of the open ocean: biology, fisheries and conser-vation (M. D. Camhi, E. K. Pikitch, and E. A. Babcock, eds.), p. 3–13. Blackwell Publ., Oxford, UK.
R Core Team.2013. R: a language and environment for statistical com-
puting. R Foundation for Statistical Computing, Vienna, Austria. [Available at website, accessed May 2013.]
Richards, F. J.1959. A flexible growth function for empirical use. J.
Exp. Bot. 10:290–301. ArticleRicker, W. E.
1975. Computation and interpretation of biological sta-tistics of fish populations. Fish. Res. Board Can., Bull. 191, 382 p.
Ridewood, W. G. 1921. On the calcification of the vertebral centra in
sharks and rays. Philos. Trans. R. Soc. Lond., B, 210:311–407. Article
Smith, S. E., D. W. Au, and C. Show.1998. Intrinsic rebound potentials of 26 species of Pacific
sharks. Mar. Freshw. Res. 49:663–678. ArticleSmith, S. E., R. C. Rasmussen, D. A. Ramon, and G. M. Cailliet.
2008. The biology and ecology of thresher sharks (Alo-piidae). In Sharks of the open ocean: biology, fisheries and conservation (M. D. Camhi, E. K. Pikitch, and E. A. Babcock, eds.), p. 60–68. Blackwell Publ., Oxford, UK.
Stillwell, C. E., and J. G. Casey.1976. Observations on the bigeye thresher shark, Alopias
superciliosus, in the western North Atlantic. Fish. Bull. 74:221–225.
Weng, K. C., and B. A. Block.2004. Diel vertical migration of the bigeye thresher shark
(Alopias superciliosus), a species possessing orbital retia mirabilia. Fish. Bull. 102:221–229.
Wickham, H.2009. ggplot2: elegant graphics for data analysis, 213
p. Springer-Verlag, New York.Wintner, S. P., and G. Cliff.
1999. Age and growth determination of the white shark, Carcharodon carcharias, from the east coast of South Af-rica. Fish. Bull. 97:153–169.


![CMM 2008-01 [Bigeye and yellowfin] - Home | WCPFC 2008-01 [Bigeye...1 FIFTH REGULAR SESSION Busan, Republic of Korea 8-12 December 2008 CONSERVATION AND MANAGEMENT MEASURE FOR BIGEYE](https://img.pdfslide.net/doc/110x75/5addd45e7f8b9a213e8d4a04/cmm-2008-01-bigeye-and-yellowfin-home-wcpfc-2008-01-bigeye1-fifth-regular.jpg)