Embed Size (px)
Citation preview

Modeling and measuring thetransport and scattering of energeticdebris in an extreme ultravioletplasma source
John R. SporreDaniel T. ElgKishor K. KalathiparambilDavid N. Ruzic
Downloaded From: http://nanolithography.spiedigitallibrary.org/ on 02/05/2016 Terms of Use: http://spiedigitallibrary.org/ss/TermsOfUse.aspx

Modeling and measuring the transport and scattering ofenergetic debris in an extreme ultraviolet plasma source
John R. Sporre,† Daniel T. Elg, Kishor K. Kalathiparambil, and David N. Ruzic*University of Illinois at Urbana-Champaign, Center for Plasma-Material Interactions, Department of Nuclear, Plasma, andRadiological Engineering, 216 Talbot Laboratory MC-234, 104 South Wright Street, Urbana, Illinois 61801, United States
Abstract. A theoretical model for describing the propagation and scattering of energetic species in an extremeultraviolet (EUV) light lithography source is presented. An EUV light emitting XTREME XTS 13-35 Z-pinchplasma source is modeled with a focus on the effect of chamber pressure and buffer gas mass on energeticion and neutral debris transport. The interactions of the energetic debris species, which is generated by the EUVlight emitting plasma, with the buffer gas and chamber walls are considered as scattering events in the model,and the trajectories of the individual atomic species involved are traced using a Monte Carlo algorithm. Thisstudy aims to establish the means by which debris is transported to the intermediate focus with the intent toverify the various mitigation techniques currently employed to increase EUV lithography efficiency. The modelingis compared with an experimental investigation. © 2016 Society of Photo-Optical Instrumentation Engineers (SPIE) [DOI: 10.1117/1.JMM.15.1.013503]
Keywords: extreme ultraviolet; intermediate focus; debris mitigation; Monte Carlo; elastic scattering.
Paper 15179 received Nov. 10, 2015; accepted for publication Jan. 14, 2016; published online Feb. 5, 2016.
1 IntroductionThe contamination and damage of reflective optics, by ener-getic plasma debris, is a critical issue in extreme ultravioletlight (EUV) lithography tools. EUV lithography sourcesutilize 13.5-nm light, which is aimed to achieve resolutionlimits superior to currently utilized 193 nm immersionlithography techniques while also attempting to improveon throughput costs. EUV light emitting plasma can beformed by focusing laser radiation, with a power range of∼10 W∕cm2, onto a mass-limited Sn droplet on the orderof tens of microns in diameter.1 The photon radiation pres-sure accelerates electrons from the droplet surface into thebulk creating the EUV light emitting plasma through heatand compression. The expanding plasma generates radiationin several wavelengths, including the required EUV light.One key component in the lithography tool is the EUVfocusing optics. Since EUV radiation is absorbed into nearlyall substances, reflective optics are mandatory. Collectoroptics may be either multilayer normal incidence mirrors orgrazing-incidence reflectors, while downstream mirrors inthe optical chain are typically multilayer normal incidencemirrors. Both configurations require highly precise coatingsdeposited on optically flat base materials. For example,normal incidence EUV reflectors have alternating bilayersof high and low Z, with layer thicknesses determined byBragg diffraction. One typical configuration is a bilayer of4.5 nm Si and 2.4 nm Mo. The resulting segment lengthof 6.9 nm is nearly half the wavelength of the 13.5 nmlight, and consequently optimizes Bragg diffraction.2–4
Such is the precision kept in the multilayer mirrors that eitherthe addition of layers by debris deposition, or the sputteringinduced removal of the deposited multilayers, can change the
surface properties of the layers and severely disrupt the effi-ciency and performance of the EUV source.
Generating EUV light requires a considerable amount ofenergy to excite the Sn atoms into the required highly ionizedstates (8þ to 12þ).5 The energy requirement is worsened bythe fact that less than 6% of total energy input is actuallyconverted into useable EUV light. In addition to heat andout-of-band radiation, such an energetic plasma (Te ∼ 30 eV,ne ∼ 1020 cm−3) generates energetic ions and neutrals, whichinteract with the buffer gas and wall materials.6–8 Buffer gasspecies, through scattering events, can consequently acquireenergies significantly higher than the sputtering threshold ofthe chamber wall materials,9 or multilayer mirror materials,resulting in sputtering and creation of further debris or ero-sion of the EUV reflectors. In terms of the redeposition ofmaterials, a typical discharge produced plasma EUVemittinglight source can deposit Sn at a rate of 3.2 × 10⁻⁸ nm∕pulseeven with a buffer gas and foil trap in place.10 This is verydetrimental to source operation. For example, consideringthat manufacturing tools need to run upward of 20 kHz,it would take only hours of operation to deposit 5 nm ofSn on the surface of the collector, which would result ina 70% reduction in the EUV light. However, while muchresearch has been carried out on mitigating debris transportto the collector and on cleaning Sn deposition from the col-lector,6,11,12 the collector is not the only mirror in the opticalchain. Photons from the collector are focused to the inter-mediate focus (IF), beyond which the rest of the opticalchain lies. Focus must also be placed on understanding thedebris transport mechanisms from the plasma source to theIF location, where only the clean EUV photons are allowedto be transmitted.13
A theoretical understanding of the observed effects isnecessary for implementing various mitigation techniques aswell as for anticipating unaccounted for problems. In this
*Address all correspondence to: David N. Ruzic, E-mail: [email protected]
†Present address: IBM Corporation, 257 County Road 156, Albany, New York12203, United States. 1932-5150/2016/$25.00 © 2016 SPIE
J. Micro/Nanolith. MEMS MOEMS 013503-1 Jan–Mar 2016 • Vol. 15(1)
J. Micro/Nanolith. MEMS MOEMS 15(1), 013503 (Jan–Mar 2016)
Downloaded From: http://nanolithography.spiedigitallibrary.org/ on 02/05/2016 Terms of Use: http://spiedigitallibrary.org/ss/TermsOfUse.aspx

paper, the creation and transport of energetic debris witha Z-pinch EUV light source is analyzed using the MonteCarlo method and compared to experiment. The developedmodel operates by creating a test atom, giving it an initialtrajectory and energy, and subjecting it to gas scattering andwall-scattering collisions. The model is implemented usingMATLAB code, and the effect of chamber pressure and thebuffer gas species, on the created energetic species emanat-ing from the EUV plasma is investigated. The results areillustrated using realistic particle trajectory plots. The oper-ating conditions in which the energetic debris reaches theoptic conditions are identified. It will be shown that thebuffer gas mass and pressure must be chosen in a mannerthat not only prevents Sn from reaching the IF but also min-imizes transport of high-energy buffer gas ions to the IF.
2 Theoretical Model
2.1 Experimental Setup and Model Domain
The experimental setup being modeled is the XTS 13-35EUV light source, which utilizes a pulsed Z-pinch dischargeto compress a pre-ionized gas to generate the EUV light.Details describing the technical specifications and the oper-ating range of parameters of the experimental setup areprovided in Refs. 7 and 14. In the associated experimentsperformed, the cathode used is solid Sn, which is ablatedby N2 gas, and introduced into the pinch plasma. The capaci-tor bank is discharged (2.5 kV, 20 kA, 1 μs) to generatethe EUV light emitting plasma (1020 cm−3, 30 eV) from theablated Sn atoms. After the capacitor discharge pulse, thecylindrical pinch plasma expands radially from the source,and the EUV light is emitted along with the out-of-band radi-ation as well as energetic ions and neutrals, which expandsinto the chamber. The model takes into account the three-dimensional (3-D) geometry of the chamber, with the cham-ber wall treated as a perfect cylinder of diameter 0.92 m.To simulate a collector optic, a mock grazing-incidencecollector optic was created, consisting of two stainless steelshells. The outer shell was 0.44 m in diameter and designedto reflect 30 deg light while the inner shell was 0.13 m indiameter and designed to reflect 10 deg light. These shellsserve to simulate the reflection and transport of energeticdebris emanating from the EUV emitting plasma througha grazing-incidence collector, even though they are unableto reflect EUV light. The brackets that support the shapeof the shells obscured direct line of sight from the EUVplasma source to the IF similar to those used in industry.The model geometry is shown in Fig. 1, and the exact dimen-sions used are provided in Table 1. Cartesian coordinateswere used.
Experimental diagnostics were performed by the Sn inter-mediate focus flux emission detector (SNIFFED). At theIF is a differential pumping gasket with a 1-mm radius.SNIFFED is located beyond this gasket and contains multi-ple diagnostics placed on a ring positioned to intersect the10 deg specular reflection. In the model, the gasket orificewas given a radius of 10 cm to allow for the capture ofenough computational atoms; this discrepancy betweenmodel and experiment was later remedied as part of a cali-bration factor, detailed in Sec. 5. The most relevant diagnos-tic for this work is a set of microchannel plates (MCPs),which measure the flux of energetic ions and neutrals to
the IF. The fluxes measured by these plates were comparedwith those calculated by the model. Additionally, Si witnessplates were used to measure solid debris deposition. Sincethis included C (from pump oil) and Cu (from the anode),x-ray photoelectron spectroscopy (XPS) was used to quan-tify how much of the deposition consisted of Sn debris.Full detail of the SNIFFED apparatus is provided in Ref. 13.
2.2 Creation of a Test Atom
At the beginning of each computational trial, a test atom iscreated with an initial energy and trajectory, and then under-goes gas-scattering or wall-scattering collision events until itreaches a required threshold for elimination. The assignedvalues of the initial energy were based on the experimentallyobtained values from the energy analysis of ions and neutralsusing a spherical sector electrostatic energy analyzer.15,16
The total flux measured at the detector for an N2 fueledpinch is shown in Fig. 2. Such a curve was utilized for deter-mining the initial energy of the test atom. For the model, thetotal flux curve was normalized to determine the probabilityof an atom being at a given energy. A random number gen-erator was used to select energies between 0 and 50 keVaccording to probabilities given by the measured spectrum.
Similarly, the initial direction vector of the test atom wasassigned using a cosine distribution probability function[Eq. (1)], which adhered to experimental angular measure-ments
Fig. 1 Chamber geometry considered in the model, which resemblesthe actual experimental chamber in dimensions. It consists of the twoshells included to act as a mock-up collector optic, the brackets thatsupport these shells and block direct line of sight between the plasmaand the IF. The modeled size of the IF is much larger compared tothe actual size.
Table 1 The dimensions of the modeled chamber and the mock-upcollector optic components (denoted as inner and outer shells inFig. 1).
Shell name Radius (m) Length (m)Distance fromplasma (m)
Inner shell 0.064 0.15 0.285
Outer shell 0.216 0.305 0.2075
Chamber walls 0.46 0.72 0.0
IF 0.1 0.0 0.72
J. Micro/Nanolith. MEMS MOEMS 013503-2 Jan–Mar 2016 • Vol. 15(1)
Sporre et al.: Modeling and measuring the transport and scattering of energetic debris. . .
Downloaded From: http://nanolithography.spiedigitallibrary.org/ on 02/05/2016 Terms of Use: http://spiedigitallibrary.org/ss/TermsOfUse.aspx

EQ-TARGET;temp:intralink-;e001;63;545fðx; μ; sÞ ¼ 1
2s
�1þ Cos
�x − μ
sπ
��: (1)
In this equation, f is the probability distribution function, μis the centroid of the cosine distribution, μþ s is the right-ward boundary of the function, and μ − s is the leftwardboundary.17 The assumption of azimuthal symmetry allowsfor a random value from 0 to 2π to be chosen for θ also. Theangular values thus obtained in spherical coordinates are thenconverted to Cartesian coordinate-based vectors. The chosenrandomization resulted in the desired cosine distribution tomimic the angular spectra from the cylindrical Z-pinchplasma.
2.3 Collisions
The flow chart shown in Fig. 3 outlines the various collisionschemes followed in the model and defines the resulting newgenerations of test atoms as the test particle is released intothe system.
The model starts by running a loop that determines thetest atom’s new location if no collisions occur. Initially, a
timestep of 10−6 s is assigned. The projected (collisionless)distance is determined by Eq. (2)
EQ-TARGET;temp:intralink-;e002;326;730rp − ri ¼ vpt: (2)
In this Eq. (2), ri is the initial location vector, rp is the pro-jected new location vector, vp the velocity vector (as derivedfrom the energy and mass of the test atom), and t is thetime step.
The model then proceeds to calculate the nearest distanceto a surface where wall collision interactions need to pro-ceed. If this distance is shorter than the difference betweenthe initial and projected positions, the outcome of a potentialwall collision is determined. The code then calculateswhether or not a gas-atom collision occurred while traversingthe shorter of the two distances; if a collision did occur, thenew location is noted. In the case of either a wall collision ora gas-atom collision, the new location of the test atom is setat the point of the collision, and the trajectory and energy ofthe atom is adjusted. The main loop then repeats itself, mov-ing the test atom from collision to collision until an end pointis reached. If no collisions occurred during the timestep,the energy and direction remain the same, since any long-dis-tance attractive or repulsive forces are neglected (even at theoperating pressures considered) to maintain computationalsimplicity. The handling of wall-scattering and gas-scatteringcollisions is discussed in detail, in Secs. 2.3.1 and 2.3.2.
2.3.1 Wall-scattering collisions
Wall collisions are handled separately from gas collisions inthe model. The first step in determining if a test atom hasundergone a collision is determining the point of intersectionwith the nearest wall surface. Given the default (collision-less) projected location ðxp; yp; zpÞ and the initial locationðxi; yi; ziÞ, a 3-D parametric equation is derived as a functionof t [Eqs. (3)–(6)]. In these equations, it is important to notethat t ¼ 0 represents the starting location and t ¼ 1 repre-sents the projected location
EQ-TARGET;temp:intralink-;e003;326;331XðtÞ ¼ ðxp − xiÞtþ xi; (3)
Fig. 2 The total and neutral flux measured by the detector during thepinch operation with N2 as the fuel gas. The ion flux is thereforeobtained from the difference.
Fig. 3 The flow diagram showing the collision processes of the test atom, as considered in the model.
J. Micro/Nanolith. MEMS MOEMS 013503-3 Jan–Mar 2016 • Vol. 15(1)
Sporre et al.: Modeling and measuring the transport and scattering of energetic debris. . .
Downloaded From: http://nanolithography.spiedigitallibrary.org/ on 02/05/2016 Terms of Use: http://spiedigitallibrary.org/ss/TermsOfUse.aspx

EQ-TARGET;temp:intralink-;e004;63;752YðtÞ ¼ ðyp − yiÞtþ xi; (4)
EQ-TARGET;temp:intralink-;e005;63;729ZðtÞ ¼ ðzp − ziÞtþ xi; (5)
EQ-TARGET;temp:intralink-;e006;63;701XðtÞ2 þ YðtÞ2 ¼ R2: (6)
The wall collision code is then broken into three collision-determining parts: collisions with inner cylinder surfaces,collisions with the near pinch and near IF planar walls,and collisions with the brackets that support the collectoroptics. The value of t is calculated for each of these surfaces.For collisions with cylinders (inner shell, outer shell, andcylindrical chamber wall), Eq. (6) is solved with R equalto the radius of each cylinder. Negative values of t are dis-carded; for positive values, it must be determined whetherthe corresponding value of ZðtÞ resides with the distancesassigned to the shells. Cases that do not meet that require-ment are discarded. For the planar chamber walls (where thepinch and IF are located), Eq. (5) is solved with the value ofZðtÞ set to either 0 (pinch location) or 0.72 (IF-containingwall). Finally, for the support brackets, Eq. (6) is solvedwith ZðtÞ set as the distance from the plasma for each setof brackets. The resulting value of t is plugged intoEqs. (4) and (5) to compute values of XðtÞ and YðtÞ. If thevalues of XðtÞ and YðtÞ lie within the brackets’ dimensions,the positive value of t is kept; otherwise, it is discarded. Fromthe compiled list of t values, the smallest positive value isselected. If this value is greater than 1 or if there are no pos-itive values, no wall collision occurred. However, if there isa positive value less than 1, then a wall collision did occur(pending the possibility of a gas collision, which will be dis-cussed in Sec. 2.3.2).
Proceeding with the assumption that the test atom wasfound to participate in a wall collision, and that a gas-atomcollision did not occur in the process of reaching the wall,it is now necessary to understand how the incident atomwill interact with the surface. In this model, there weretwo possible consequences of the incident atoms interactionwith the surface: deposition and reflection. With each ofthese possibilities, there also exists the potential for sput-tering to occur; this will be addressed later. When an ener-getic atom impacts a surface, it is possible that the atom willnot penetrate the outer surface potential because of insuffi-cient energy, or it could possibly traverse a few monolayersof the surface and backscatter back out of the surface. Thedescription of this process is complicated and very difficultto analytically describe with a single equation, and is cer-tainly not describable by the specular reflection propertiesenjoyed with photons. For the purposes of the debris trans-port model, it is very important to be able to simulate thisprocess, so a set of scattering properties were calculatedusing the stopping and range of ions in matter (SRIM)code developed by Ziegler et al.18 This SRIM code takesthe inputs of ion mass, surface composition, ion energy,and angle of incidence, and calculates how the ion will inter-act with the surface. SRIM itself is a Monte Carlo simulationthat models the reaction of surface atoms to the displacementand momentum transfer caused by an incident atom. An out-put file is created at the end of the simulation, which containsenergy, direction (in Cartesian coordinates), and mass infor-mation about each of the atomic species that leaves the
surface due to sputtering or back scattering (which will bethe incident ion itself). The incident atom is monitored todetermine whether it is deposited into the surface or back-scattered away from the surface, and its final energy anddirection (or location in the surface if it is deposited) arenoted as well. The directional cosines of each of the relevantspecies are provided as well.
SRIM simulations were carried out separately before run-ning the main code. For each incident atom species, a look-up table was created containing the deposition probability,backscattering probability, sputtering probability, ratio ofsputtered atoms per incident sputtering ion, average back-scattered atom energy, and average sputtered atom. Thedetails of the SRIM calculations are not elaborated here.It was evident from the SRIM analysis, for the energyrange relevant to this model, that the ion energy is theonly major influence on the sputtering yield and the averageenergy of the sputtered species. For all other parameters,the predominant determining factor is the angle at whichthe incident ion collides with the surface being sputtered.Since one single SRIM analysis does not account for all pos-sible atom-surface interactions, 1000 individual runs wereperformed for each energy and angle condition to averageout case by case variations. The surface composition of inter-action was constructed as a 5-nm layer of Sn deposited ontop of a stainless steel substrate. The Sn layer is included toaccount for the fact that most of the mock-up collector opticsurfaces were covered by more than a few nanometers ofSn (as well as other electrode materials) at the end of eachhour-long experiment. Even at only 5 nm, SRIM modelingsuggests that almost no stainless steel species are capable ofbeing sputtered out of the Sn surface. This is independentlyverified by XPS of Si witness plates positioned insidethe chamber in an effort to experimentally characterize thevarious species deposited on different parts of the chamberduring experiments.
The SRIM code also provides a way of estimating thebackscatter direction of incident atoms that do not depositon the surface. A backscattered or sputtered atom’s newdirection can be characterized by two angles. As shown inFig. 4, a test atom collides with a surface at an angle of inci-dence θincident, with respect to the surface normal vector. Thebackscattered direction can be described as a function of theangles θscattered, and θstraggle. While these angles are com-plexly coupled to intrasurface scattering, they can adequately
Fig. 4 The relative angles representing the wall-scattering process.For the incident atom, the SRIM code considers the angles relativeto the surface normal. A backscattered atom will leave the surfacewith an angle of θscattered from the surface normal, and an angle ofθstraggle away from the plane that is comprised of the incident vectorand the surface normal vector. These two angles are able to beapproximated using cosine distribution functions.
J. Micro/Nanolith. MEMS MOEMS 013503-4 Jan–Mar 2016 • Vol. 15(1)
Sporre et al.: Modeling and measuring the transport and scattering of energetic debris. . .
Downloaded From: http://nanolithography.spiedigitallibrary.org/ on 02/05/2016 Terms of Use: http://spiedigitallibrary.org/ss/TermsOfUse.aspx

be described by a cosine distribution fit. Furthermore, thegeometry of the problem lends itself readily to the sphericalcoordinate system. As such, it is simple to convert fromthe Cartesian vector coordinates provided by SRIM, to thetwo characterizing angles.
The last part of the wall collision calculations involvesdetermining the backscatter direction vector based on theacquired cosine distributions coefficients for a test atom withknown mass, energy, and angle. Because the coefficients areonly calculated for a discrete number of conditions, it is firstnecessary to linearly extrapolate values for a given energyvalue and angle of incidence. This extrapolation was per-formed using the three data points closest to the desiredenergy and angle values. This is performed twice for the scat-tering and straggling angles to create the new direction vectorR for the test atom that has undergone a wall-scatteringcollisions.
The energy for backscattered atoms is derived from theSRIM-generated look-up table, an adjustment is made tothe test atom variable, and a collision is accordingly notedin the test atom’s history log. It is important to mentionthat the same process is used for determining the scatteringangles, straggling angles, and resulting energy, of the speciesthat are sputtered out of the surface. The only differencebetween the two processes is that the scattering angle ofthe sputtered species is modeled as a random angle fromð0;2πÞ because there is no preferred directionality of the spe-cies that are sputtered out of the surface layer. The probabil-ity of sputtering is determined from the SRIM tables andfour-point estimate process, as is the number of sputteredatoms that should be expected per sputter inducing incidention.
2.3.2 Gas-scattering collisions
If no wall collision occurred, there is still a potential for agas collision as the test atom traverses its mean-free path.Additionally, even if a test atom was projected to collidewith a wall, it is still possible for a gas collision to occurfirst, preventing the atom from reaching the wall. The firststep in handling gas-atom collisions is the determinationif and where such a collision occurs. Only elastic collisionsare considered and the mean-free-path λ is determined byEq. (7),
EQ-TARGET;temp:intralink-;e007;63;275λ ¼ 1
nσ; (7)
where, n is the density of the buffer gas species and σ isthe elastic-scattering cross-section. The buffer gas density isdetermined by the ideal gas law as given by Eq. (8), assum-ing a temperature of 295 K,
EQ-TARGET;temp:intralink-;e008;63;189P ¼ nRT: (8)
The probability of traveling a distance d0 without under-going an elastic-scattering collision is then given by P0 as inEq. (9),
EQ-TARGET;temp:intralink-;e009;63;125P0 ¼ e−d0λ : (9)
The value of d0 is selected as either the distance the testatom travels before a wall collision, or the distance it
would travel in the default time step, whichever distanceis shorter. Initially, a random value between 0 and 1 is chosenand compared to the probability of survival. If the randomvalue is larger than the value determined by Eq. (5), a colli-sion is deemed to have occurred. The actual distance traveledbefore the collision is determined using the cumulativedistribution function [Eq. (10)]
EQ-TARGET;temp:intralink-;e010;326;675r0 ¼ −λ lnð1 − PxÞ; (10)
where Px is a random value between 0 and the maximumvalue of the survival probability in the total distance origi-nally tested [given by (1 − Px)].
Classical scattering theory is utilized to determine the col-lision parameters resulting in a new direction and energy forthe incident and scattered species, as shown in Fig. 5.19
Energy [Eq. (11)] and angular momentum [Eq. (13)] areconserved in the elastic collision center mass (COM) prob-lem within the coordinate system ðr;ϕÞ
EQ-TARGET;temp:intralink-;e011;326;545ECOM ¼ VðrÞ þ 1
2μðr 02 þ r2ϕ 02Þ; (11)
EQ-TARGET;temp:intralink-;e012;326;503μ ¼ m1m2
m1 þm2
; (12)
EQ-TARGET;temp:intralink-;e013;326;466vb ¼ r2ϕ 0: (13)
Here, ECOM is the total center-of-mass energy of the binarysystem, VðrÞ is the interatomic potential between the twoatoms, μ is the reduced mass as defined by Eq. (12), b isthe impact parameter, and v is the incident atom velocity.The interatomic potential between each species was deter-mined using a combination of the repulsive Abrahamsonpotential coupled with an attractive well determined basedoff of the Lennard-Jones potential with a fitting parameterto couple the two different potentials.20 The fitting parameteris determined roughly by trying to match the slopes of therise visually. In reality, for the energies being examined inthis paper, this ad hoc fitting process adds very little errorto the measurement. The resulting potential is describedby Eq. (14) and the fitting parameters given in Table 2,
EQ-TARGET;temp:intralink-;e014;326;285VðrÞ ¼ Ae−Br þ 4εh�σ
r
�x þ
�σr
�6i: (14)
Fig. 5 The COM diagram of the collision between an atom with themass m and velocity v − vCOM incident on a resting mass M with a(relative) velocity—vCOM. The resulting collision has a nearest impactpoint of r 0 and scattering angle of θCOM. Figure taken from Ref. 19.
J. Micro/Nanolith. MEMS MOEMS 013503-5 Jan–Mar 2016 • Vol. 15(1)
Sporre et al.: Modeling and measuring the transport and scattering of energetic debris. . .
Downloaded From: http://nanolithography.spiedigitallibrary.org/ on 02/05/2016 Terms of Use: http://spiedigitallibrary.org/ss/TermsOfUse.aspx
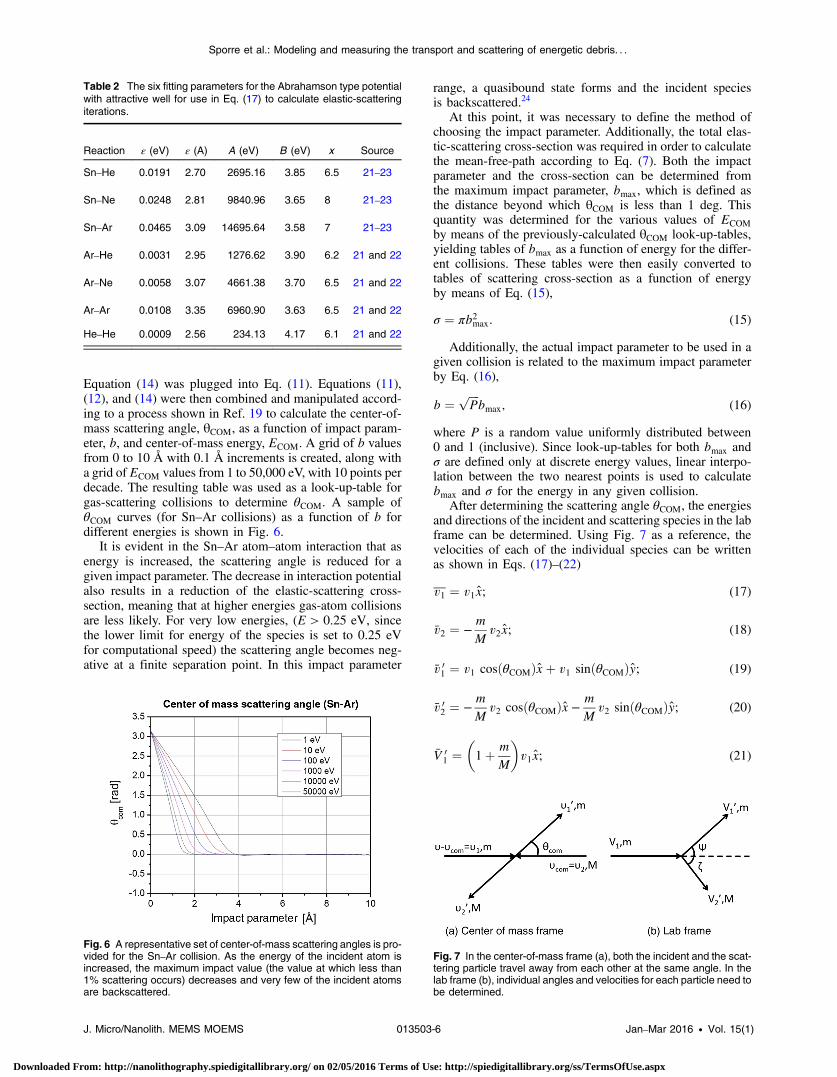
Equation (14) was plugged into Eq. (11). Equations (11),(12), and (14) were then combined and manipulated accord-ing to a process shown in Ref. 19 to calculate the center-of-mass scattering angle, θCOM, as a function of impact param-eter, b, and center-of-mass energy, ECOM. A grid of b valuesfrom 0 to 10 Å with 0.1 Å increments is created, along witha grid of ECOM values from 1 to 50,000 eV, with 10 points perdecade. The resulting table was used as a look-up-table forgas-scattering collisions to determine θCOM. A sample ofθCOM curves (for Sn–Ar collisions) as a function of b fordifferent energies is shown in Fig. 6.
It is evident in the Sn–Ar atom–atom interaction that asenergy is increased, the scattering angle is reduced for agiven impact parameter. The decrease in interaction potentialalso results in a reduction of the elastic-scattering cross-section, meaning that at higher energies gas-atom collisionsare less likely. For very low energies, (E > 0.25 eV, sincethe lower limit for energy of the species is set to 0.25 eVfor computational speed) the scattering angle becomes neg-ative at a finite separation point. In this impact parameter
range, a quasibound state forms and the incident speciesis backscattered.24
At this point, it was necessary to define the method ofchoosing the impact parameter. Additionally, the total elas-tic-scattering cross-section was required in order to calculatethe mean-free-path according to Eq. (7). Both the impactparameter and the cross-section can be determined fromthe maximum impact parameter, bmax, which is defined asthe distance beyond which θCOM is less than 1 deg. Thisquantity was determined for the various values of ECOM
by means of the previously-calculated θCOM look-up-tables,yielding tables of bmax as a function of energy for the differ-ent collisions. These tables were then easily converted totables of scattering cross-section as a function of energyby means of Eq. (15),
EQ-TARGET;temp:intralink-;e015;326;587σ ¼ πb2max: (15)
Additionally, the actual impact parameter to be used in agiven collision is related to the maximum impact parameterby Eq. (16),
EQ-TARGET;temp:intralink-;e016;326;525b ¼ffiffiffiffiP
pbmax; (16)
where P is a random value uniformly distributed between0 and 1 (inclusive). Since look-up-tables for both bmax andσ are defined only at discrete energy values, linear interpo-lation between the two nearest points is used to calculatebmax and σ for the energy in any given collision.
After determining the scattering angle θCOM, the energiesand directions of the incident and scattering species in the labframe can be determined. Using Fig. 7 as a reference, thevelocities of each of the individual species can be writtenas shown in Eqs. (17)–(22)
EQ-TARGET;temp:intralink-;e017;326;384v1 ¼ v1x; (17)
EQ-TARGET;temp:intralink-;e018;326;354v2 ¼ −mM
v2x; (18)
EQ-TARGET;temp:intralink-;e019;326;321v 01 ¼ v1 cosðθCOMÞxþ v1 sinðθCOMÞy; (19)
EQ-TARGET;temp:intralink-;e020;326;295v 02 ¼ −
mM
v2 cosðθCOMÞx −mM
v2 sinðθCOMÞy; (20)
EQ-TARGET;temp:intralink-;e021;326;262V 01 ¼
�1þ m
M
�v1x; (21)
Table 2 The six fitting parameters for the Abrahamson type potentialwith attractive well for use in Eq. (17) to calculate elastic-scatteringiterations.
Reaction ε (eV) ε (A) A (eV) B (eV) x Source
Sn–He 0.0191 2.70 2695.16 3.85 6.5 21–23
Sn–Ne 0.0248 2.81 9840.96 3.65 8 21–23
Sn–Ar 0.0465 3.09 14695.64 3.58 7 21–23
Ar–He 0.0031 2.95 1276.62 3.90 6.2 21 and 22
Ar–Ne 0.0058 3.07 4661.38 3.70 6.5 21 and 22
Ar–Ar 0.0108 3.35 6960.90 3.63 6.5 21 and 22
He–He 0.0009 2.56 234.13 4.17 6.1 21 and 22
Fig. 6 A representative set of center-of-mass scattering angles is pro-vided for the Sn–Ar collision. As the energy of the incident atom isincreased, the maximum impact value (the value at which less than1% scattering occurs) decreases and very few of the incident atomsare backscattered.
Fig. 7 In the center-of-mass frame (a), both the incident and the scat-tering particle travel away from each other at the same angle. In thelab frame (b), individual angles and velocities for each particle need tobe determined.
J. Micro/Nanolith. MEMS MOEMS 013503-6 Jan–Mar 2016 • Vol. 15(1)
Sporre et al.: Modeling and measuring the transport and scattering of energetic debris. . .
Downloaded From: http://nanolithography.spiedigitallibrary.org/ on 02/05/2016 Terms of Use: http://spiedigitallibrary.org/ss/TermsOfUse.aspx

EQ-TARGET;temp:intralink-;e022;63;741V 02 ¼
mM
½1 − cosð θCOMÞ�v1x − sinðθCOMÞv1y: (22)
If ε is the total energy of the center-of-mass frame andE the total energy of the lab frame, the energies of eachindividual species pre- and post-collision can be defined byEqs. (23) and (24),
EQ-TARGET;temp:intralink-;e023;63;677E ¼ 1
2mðV1Þ2 ¼
1
2mðV 0
1Þ2 þ1
2MðV 0
2Þ2; (23)
EQ-TARGET;temp:intralink-;e024;63;635ε ¼ 1
2mðv1Þ2 þ
1
2Mðv2Þ2 ¼
1
2mðv 0
1Þ2 þ1
2Mðv 0
2Þ2: (24)
Combining the two energy equations reveals the relation-ship, as shown in Eq. (25), between the lab frame energy andthe center-of-mass frame energy, which will always be lessthan the lab frame energy.
EQ-TARGET;temp:intralink-;e025;63;555E ¼�mþMmM
�ε: (25)
Furthermore, it is possible to define the individual ener-gies in terms of the total energies as shown in Eqs. (26)–(29).
EQ-TARGET;temp:intralink-;e026;63;488ε1 ¼ ε 01 ¼�
MmþM
�ε; (26)
EQ-TARGET;temp:intralink-;e027;63;444ε2 ¼ ε 02 ¼�
mmþM
�ε; (27)
EQ-TARGET;temp:intralink-;e028;63;405E 01 ¼
�m2 þ 2mM cosðθCOMÞ þM2
ðmþMÞ2�E; (28)
EQ-TARGET;temp:intralink-;e029;63;366E 02 ¼
2mM½1 − cosðθCOMÞ�
ðmþMÞ2E. (29)
The values of E 01 and E
02 are the postscattering energies of the
scattered species (incident and the scattering atoms). Thesevalues are needed to determine the exit velocity of the testatom in question, and the newly created scattered species inthe debris transport model. The different lab frame scatteringangles are deduced by geometry in addition to the equationsof path, and are shown in Eqs. (30) and (31).
EQ-TARGET;temp:intralink-;e030;63;249 tanðψÞ ¼ sinðθCOMÞcosðθCOMÞ þ m
M
; (30)
EQ-TARGET;temp:intralink-;e031;63;204 tanðζÞ ¼ sinðθCOMÞ1 − cosðθCOMÞ
: (31)
With the newly directed species’ energies and directionsdetermined, the last remaining step in modeling the gas-scattering collisions involves taking the direction from thexy-plane to the plane of reference where the atom is locatedin the model. The actual collision point between the two spe-cies is determined by two parameters. The first is the impactparameter, b. This defines the location along the radiuswhere the collision occurred, providing information onthe scattering angle relative to the two species. In order to
determine final directions, however, it is necessary to deter-mine the azimuthal location of the point of impact at thegiven radius b. This is done at random from a value ofð0;2πÞ. The two calculated vectors of the scattered speciesare then rotated, in the same manner as the wall-scatteringevent, until they are in the original 3-D location facingthe appropriate direction.
2.4 Sample Results
As a graphical example of the model’s capabilities, Fig. 8shows the trajectory of a 10 keV Sn atom traveling througha 10 mTorr Ar environment and the resulting interactionswith the buffer gas atoms. The evolution of the second gen-eration (the scattered species by the first test atom) as thescattered argon species travel through the chamber is shownby the branching trajectories. In this particular example,no energetic atoms reach the IF. However, it is obvious thatmany scattering events occur, and many Ar atoms are ener-gized by collisions with just one Sn pinch atom.
In order to quantify the number of energetic atoms reach-ing the IF for various pressures, buffer gas masses, and pinchgas masses, 10,000 Sn atoms were used for each case, andthe number and energies of atoms reaching the IF wererecorded. Since each pinch atom produces many energeticbuffer gas atoms, simulations were limited to the first ener-getic buffer gas generation in order to perform the simula-tions in a reasonable amount of time. For this reason andothers, it was necessary to calibrate the theoretical IF fluxresults to the experimental IF flux results. This calibrationprocess will be shown in Sec. 3.
3 Calibration to ExperimentsDue to the nature of the experimental diagnostics and com-putational limitations, a calibration factor must be deter-mined in order to accurately compare the model output toexperiments. Rather than measuring direct flux, MCPs mea-sure units of “hits.” This hit count is dependent on the energyof the incident flux. Since buffer gas atoms are energized atdifferent energies and at different locations in the chamber,each measured atom travels a different distance. This renderstime-of-flight analysis unusable, and the energies of the
Fig. 8 Shown is a 10 keV Sn atom’s path through the 10 mTorr Ar gasenvironment in the chamber. The fingers that appear are the plots ofthe secondary generation of scattered Ar atoms. No wall sputteringoccurred in this trial.
J. Micro/Nanolith. MEMS MOEMS 013503-7 Jan–Mar 2016 • Vol. 15(1)
Sporre et al.: Modeling and measuring the transport and scattering of energetic debris. . .
Downloaded From: http://nanolithography.spiedigitallibrary.org/ on 02/05/2016 Terms of Use: http://spiedigitallibrary.org/ss/TermsOfUse.aspx

measured incident atoms cannot be determined. Therefore,rather than converting the MCP hits into fluxes, the computa-tional fluxes must be converted to a hit value that would beobserved if MCPs were to measure the atoms created by themodel. This calibration process is detailed here.
First, the species of the measured atoms must be deter-mined. The MCPs have a low-end sensitivity thresholdbelow 100 eV; consequently, any impact by an atom withless than this threshold energy does not produce an electroncascade large enough to measure. Thus, background roomtemperature gas impingement cannot be measured; however,it is possible to measure the energetic atoms emanating fromthe EUV-emitting plasma. Two signals are detected. Thefirst, occurring in the first 100 μs, is difficult to preciselymeasure and is due to the arrival of the scattered high-energypinch-origin species. The second flux, beginning around250 μs after pinch formation, is due to the expansion of theenergized buffer gas in the chamber. This is known to be thebuffer gas because, as shown in Fig. 9, changing the pinchgas mass while leaving the buffer gas constant does not causea change in the arrival time of this second signal.
Having determined that the main contributor to the hitsmeasured at the IF is energized buffer gas, a calibrationmay be carried out to convert the number of modeled buffergas atoms reaching the IF to a modeled number of hits,followed by a comparison of model to experiments.
Two scaling factors caused by the computational setup arereadily apparent. First, computational atoms must be con-verted to real atoms. Due to time constraints, each iterationof the model began with 10,000 test atoms of the pinch gasspecies, which proceeded to create energetic buffer gasatoms through collisions. Thus, the modeled atoms mustbe divided by 10,000 and multiplied by the total measuredflux of energetic pinch atoms emanating from the pinch.This flux can be measured by placing MCPs on the z-axisin place of SNIFFED without the mock-up collector shellspresent. An example of this measurement, forN2, is shown inFig. 2. Second, though the actual IF had a 1-mm radius, themodeled IF was enlarged to have a 100-mm radius in order
to reduce discretization error. Accordingly, the number ofatoms reaching the modeled IF must be reduced by a ratioof the actual IF area to the modeled IF area.
In order to convert modeled atoms to hits that would beobserved with real MCPs, scaling factors derived from thenature of MCPs must also be applied. Full informationabout MCP calibration may be found in Ref. 15. To accountfor MCP mass sensitivity, the computational atoms aremultiplied by the ratio of the buffer gas mass to the massof Xe, which was the species that was used to experimentallycalibrate the MCPs. Additionally, to calculate the number ofcomputational atoms that would be detected by real MCPs,the number of computational atoms must be multipliedby the detector efficiency at the average energy of the inci-dent computational atoms. Next, the resulting number ofdetected computational atoms may be converted to computa-tional hits by dividing by the base calibration of the MCPs(∼204 atoms∕hit).
Lastly, errors are still inherent in the computationalscheme and the measurement of total flux from the pinch.The experimental measurements of the total flux, shownin Fig. 2, were taken only at a 0 deg angle from thepinch, and the angular distribution of flux was assumed tobehave like a cosine distribution; in reality, the extremelyenergetic species are forward-peaked, and the lower-energyspecies have a more uniform distribution. Since this meas-urement was used to convert computational atoms to a cor-responding number of real atoms, this induces error in thetheoretical results. Additionally, due to computational com-plexity, only one generation of scattered buffer gas was fol-lowed in the model. This causes an underestimation in thetheoretical predictions. Finally, the model used Sn pinchatoms. However, it was unknown how much of the originalflux emanating from the pinch was due to Sn and how muchwas due to the pinch feed gas.
A final calibration factor must be applied to the theoreticalpredictions to account for these errors. This factor was deter-mined by dividing the experimental hit count by the compu-tational hit count and taking an average of this quotientover the course of 10 experiments. This factor amounted to∼158. Once this one calibration factor was obtained, it wasused uniformly in the calibration of model data for allexperiments.
4 Experimental ResultsTo compare experiment to model and to analyze the proc-esses by which debris is transported to the IF, experimentswere carried out to isolate variations in energetic debris trans-port due to chamber pressure, buffer gas mass, and pinchgas mass.
4.1 Pressure
The pressure was varied from 0.3 to 22 mTorr with Ar asthe buffer gas and N2 as the pinch gas. The flow of N2
was kept constant at 100 sccm. For the higher pressures(6, 12, and 22 mTorr) the Ar flow was 1000 sccm, andpressure was varied by means of a gate valve in front ofthe pump. For the 2-mTorr case, the flow of Ar was200 sccm. For the 0.3-mTorr case, the flow of Ar was setto 0; however, a small amount of Ar was still present inthe chamber due to pumping down from a higher pressure.Results shown in Fig. 10(a) agree well with the model
Fig. 9 When the buffer gas is kept as Ar, increasing pinch gas massfrom 4 to 40 AMU serves only to increase the amount of energydeposited in the buffer gas species, due to more efficient energytransfer as the pinch gas mass approaches the buffer gas mass.The arrival time of the energetic flux peak, however, is the samefor each pinch gas species, suggesting that buffer gas is the key con-tributor to the flux arriving after 250 μs.
J. Micro/Nanolith. MEMS MOEMS 013503-8 Jan–Mar 2016 • Vol. 15(1)
Sporre et al.: Modeling and measuring the transport and scattering of energetic debris. . .
Downloaded From: http://nanolithography.spiedigitallibrary.org/ on 02/05/2016 Terms of Use: http://spiedigitallibrary.org/ss/TermsOfUse.aspx

predictions. Additionally, as shown in Fig. 10(b), the modelcan be used to analyze not just the flux but the number ofspecies arriving at the IF, as well as their incident energies.This ability lends insights that the MCPs cannot provide.
As shown in Fig. 10(a), there is an intermediate pressure(6 mTorr) at which the flux of energized buffer gas to the IFis maximized. At 0.3 mTorr, few buffer gas atoms arepresent. Additionally, the large mean-free-path causes wallcollisions to be dominant and allows most energized buffergas to collide with walls and deposit their energy there, ratherthan scattering off of other atoms and reaching the IF. Asshown in Fig. 10(b), collisionality at 2 and 6 mTorr causesboth increased energy deposition in the buffer gas andincreased scattering of buffer gas atoms, allowing them toreach the IF before colliding with a wall. However, at higherpressures, the mean-free-path becomes small enough thatmost energized Ar atoms lose their energy through gas col-lisions and are blocked from the IF. The error in the model-theory comparison in Fig. 10(a) at 12 mTorr is due to dis-cretization error in the model; only one computational atomreached the IF.
Sn deposition results are shown in Fig. 11.Both theoretical and experimental results show the same
trends: the Sn deposition at the IF is maximized at 2 mTorr,decreasing as the pressure increases to higher levels. Goodsuppression (no Sn deposition) is observed at 12 and22 mTorr. At 2 mTorr, buffer gas collisions scatter Sn debrisaway from walls and toward the IF, but there are not enoughcollisions to thermalize and block the Sn debris from the IF.At 6 mTorr and above, the model agrees with experiments;however, at the two lowest pressures, the model underesti-mates the Sn deposition. This is because the model assumesthat all Sn is coming from the pinch. However, the phenom-ena of electrode arcing and sputtering can introduce low-energy Sn that is not energized by the pinch and, conse-quently, was of too low energy to be detected by theMCPs used to calibrate the model and produce the modeledpinch atom energy distribution. Arcing is caused by spatially
nonuniform currents at low pressures. When arcing occurs, apinch is not created, and micron-sized particles are ejectedfrom the “hot spot” on the Sn electrode. At low pressures,these particles can make their way to the IF. Additionally,even when the system pinches and does not arc, Sn issputtered from the electrode by the plasma; indeed, it isthis process that introduces Sn into the pinch. However,some sputtered Sn does not make it into the pinch and insteadis simply released into the chamber with the low energiestypical of sputtered atoms. At high pressures, these unde-tected low-energy atoms are easily stopped by buffer gas;at low pressures, however, they can make their way to the IF.
Fig. 10 (a) The theoretical and experimental measurements of energetic flux at the IF are in good agree-ment as the pressure is varied from 0.3 to 22 mTorr with Ar buffer gas. At 2 and 6 mTorr, Sn collides withAr and transfers energy, sending energetic Ar through the IF. At 12 and 22 mTorr, the lowmean-free-pathinhibits the transport of energetic buffer gas to the IF. (b) The trends concerning the two different com-ponents of energetic flux (energy and number of atoms) are shown. At high pressures, the energies andnumbers of Ar atoms at the IF are low. At 2 and 6 mTorr, however, the energies and numbers are bothhigh.
Fig. 11 Theoretical and experimental Sn deposition at the IF followthe same trends with pressure. At high pressures, transport is inhib-ited. Deposition is maximized at 2 mTorr; at this pressure, buffer gasscatters Sn away from the walls and toward the IF, while the mean–free-path is not sufficiently low to inhibit the transport of this Sn to theIF. The theoretical and experimental deposition magnitudes differ atlow pressures. This is due to electrode sputtering and arcing, whichproduce low-energy Sn that is not accounted for in the energeticmodel. Pressures of 6 mTorr and above easily inhibit the transportof this low-energy Sn.
J. Micro/Nanolith. MEMS MOEMS 013503-9 Jan–Mar 2016 • Vol. 15(1)
Sporre et al.: Modeling and measuring the transport and scattering of energetic debris. . .
Downloaded From: http://nanolithography.spiedigitallibrary.org/ on 02/05/2016 Terms of Use: http://spiedigitallibrary.org/ss/TermsOfUse.aspx

4.2 Buffer Gas
With the pinch gas fixed at 100 sccm of N2 and the pressurefixed at 2 mTorr, the buffer gas was varied between He(4 AMU), Ne (20 AMU), and Ar (40 AMU). As shownin Fig. 12, the buffer gas mass plays an important role indebris transport. Figure 12(a) shows good agreementbetween experimental and theoretical flux measurements,while Fig. 12(b) provides insight into why the buffer gasmass is important.
Again, as with the pressure experiments, the experimentalresults are in good agreement with the model predictions.Figure 12(a) shows that, at 2 mTorr, the energetic buffergas flux reaching the IF rises as buffer gas mass risesfrom 4 to 40 AMU. As shown in Fig. 12(b), this phenome-non is due to an increase in buffer gas energy at 20 and 40AMU, as well as an increase in the number of species reach-ing the IF at 40 AMU. Energy transfer from the pinch gas tothe buffer gas is affected both by the similarity between themasses of the pinch gas and buffer gas. The mass-similarityfactor, γ, is given by Eq. (32), where m is the pinch gas massand M is the buffer gas mass
EQ-TARGET;temp:intralink-;e032;63;517γ ¼ 4mMðmþMÞ2 : (32)
Since the pinch atoms (Sn) have a mass of 118 AMU, γ issmall for He buffer gas but larger for Ne and largest for Ar.Since the scattering cross-section is similar for Sn collisionswith He and Ne, the change in γ is the main cause of theincrease in energetic Ne flux compared to energetic Heflux. The higher value of γ increases the energy transferto Ar, as well; however, the cross-section is also much largerfor Sn–Ar collisions. This increases the number of collisionsand, therefore, the total amount of buffer gas scattered to theIF. Thus, since Ar is subject to both increased energy transferand a larger number of collisions, the flux rises sharply whenthe buffer gas is changed from Ne to Ar.
Additionally, as shown in Fig. 13, Sn deposition at the IFexperimentally rises when the buffer gas is Ar. The deposi-tion results are in agreement with the model except for thelarge deposition rate caused by Ar buffer gas.
The reason for this error, as with the errors in Fig. 11, iselectrode sputtering and arcing, which releases low-energySn atoms and particles that are not accounted for in themodel. Ar, owing to its heavy mass, more easily sputters theSn electrode.
The traditional reasoning behind using a heavy gas (suchas Ar) as the buffer gas is the fact that such a gas will slowdown and deflect Sn debris more effectively by collidingmore frequently (due to the larger cross-section) and trans-ferring more energy to the buffer gas (due to the highermass). A system being used for EUV lithography will nothave support brackets from dummy collector shells obscur-ing the line of sight from the pinch to the IF, so the ability tocollide the high-energy Sn debris with the buffer gas atomsis important. This rationale is validated by noting that themodel predicts (at 2 mTorr) that the fractional energy dep-osition in the buffer gas (as opposed to the walls, which, in anonobscured system, could include the IF) is 43.5% for Ar,as opposed to 34.5% for Ne and 31.0% for He. However, ashas been demonstrated theoretically and experimentally inthis paper, it is not enough to simply deposit the pinch energyin the buffer gas, as this can aid the transport of low-energySn and high-energy buffer gas to the IF. As seen in Sec. 4.1,the pressure must be high enough to deter this transport.
4.3 Pinch Gas
Having gained an understanding of the transport of high-energy Sn atoms and the debris generated by collisionswith Sn atoms, a brief exploration of energetic flux dueto variations in the pinch feedstock gas was undertaken.Experimentally, the pinch gas was varied between He, Ne,and Ar at a constant pressure of 2 mTorr. The modelingwas carried out using computational pinch gas atoms rather
Fig. 12 (a) At 2 mTorr, the buffer gas mass is varied from 4 AMU (He) to 40 AMU (Ar), and the energeticflux reaching the IF increases. The model and experiments are in good agreement. (b) The model illumi-nates the reasons behind the high flux at 40 AMU. As buffer gas mass increases and becomes closer tothe mass of Sn, energy transfer from Sn to the buffer gas increases, leading the average buffer gasenergy to be greater for Ne than He and greater for Ar than Ne. Additionally, the Ar flux is alsomade large by an increase in the number of species reaching the IF. This occurs because of a largeSn–Ar interaction cross-section, which causes more Ar atoms to collide with Sn and become energized.
J. Micro/Nanolith. MEMS MOEMS 013503-10 Jan–Mar 2016 • Vol. 15(1)
Sporre et al.: Modeling and measuring the transport and scattering of energetic debris. . .
Downloaded From: http://nanolithography.spiedigitallibrary.org/ on 02/05/2016 Terms of Use: http://spiedigitallibrary.org/ss/TermsOfUse.aspx

than computational Sn atoms; the energies of these atomswere chosen according to ion energy distributions functionsmeasured for each individual pinch gas, similar to the distri-bution function for N2 in Fig. 2. It is important to notethat modern commercial EUV sources use Sn alone withouta feedstock gas, which renders feedstock gas variations
unrealistic in relation to commercial sources. Additionally,the model calibration factor of 158, calculated in Sec. 3, wasdetermined using modeled Sn atoms rather than modeledfeedstock gas atoms; this will cause magnitude errors insimulations that used modeled feedstock atoms. However,despite this, the model and experiments ought to share thesame underlying physics. Thus, variations of pinch gas wereperformed to track the physics of energy exchange and tofurther verify that the model captures the correct underlyingphysics.
Figure 14 confirms that, though the use of the Sn calibra-tion factor causes error in the magnitude of hits, both theoryand experiment show the same trends. Since the buffer gaswas Ar, energy transfer was maximized with Ar pinch gasatoms. This, combined with the large Ar–Ar cross-section,caused a high flux at the IF for Ar pinch gas relative tothe two other pinch gases.
5 ConclusionsThis investigation was performed to achieve a better under-standing of the mechanisms by which debris is transported tothe IF of an EUV light source from the energetic plasmaused to create 13.5 nm photons. It was demonstrated thatthe interactions between the pinch species and the buffergas are the primary cause of the generation of debris andhow it is distributed throughout the chamber. This has beenshown both by a Monte Carlo model and by experiments ona Z-pinch plasma source. The model has the capability topredict debris transport to the IF in any EUV source witha quantifiable energetic output.
While it is desirable to choose a buffer gas in a waythat maximizes the collision frequency and energy transferwith energetic Sn atoms in order to mitigate the effects of
Fig. 13 With the pressure held constant at 2 mTorr, theoretical andexperimental Sn deposition are in agreement for He and Ne buffergas. However, the experimental Sn deposition is much larger thanpredicted by the model. As in Fig. 11, the deposition discrepancyis due to electrode sputtering and arcing, which are more commonwith Ar buffer gas. These results, as well as those in Fig. 12, showthat a heavy buffer gas, while it can remove energy from Sn, canalso cause energetic buffer gas fluxes and increased deposition atthe IF. Pressure must be chosen carefully to reduce the transportof both Sn and energetic buffer gas without sacrificing too muchEUV transmission.
Fig. 14 (a) The pinch gas was varied between He, Ne, and Ar with Ar buffer gas at a pressure of 2 mTorr.Simulations were carried out with 10,000 atoms of each pinch gas, rather than Sn. Since the same cal-ibration factor (158) was used in these simulations as for the Sn atom simulations, error is presentbetween the model and experiments. Nevertheless, the underlying physics remains the same, andthe model and experiments thus display the same trends. As pinch gas mass is increased, the energeticflux to the IF increases, especially when Ar is the pinch gas. (b) The reason for the flux increase with pinchgas mass is shown. As the pinch gas mass is increased, it approaches the mass of the Ar buffer gas,causing greater energy transfer in collisions. While this means that it takes fewer collisions to removethe energy from a pinch atom, the cross-section also grows as the pinch atoms get larger. Thus, theincreased cross-section keeps the number of species reaching the IF from decaying as quickly astheir energy increases. In particular, energy transfer is maximized for same-species collisions (Arpinch gas with Ar buffer gas). This fact, combined with a large Ar–Ar cross-section, causes the energeticAr flux to the IF to be high.
J. Micro/Nanolith. MEMS MOEMS 013503-11 Jan–Mar 2016 • Vol. 15(1)
Sporre et al.: Modeling and measuring the transport and scattering of energetic debris. . .
Downloaded From: http://nanolithography.spiedigitallibrary.org/ on 02/05/2016 Terms of Use: http://spiedigitallibrary.org/ss/TermsOfUse.aspx

energetic Sn, this can also facilitate increased transport oflow-energy Sn atoms and energetic buffer gas atoms tothe IF if the pressure is not chosen carefully, leading topotential damage of downstream components in an EUVtool. While increasing the pressure enough can decreasedebris transport, this will need to be balanced against thepossibility of EUV absorption in a high-pressure environ-ment. Currently, industrial strategy seems to the use of veryhigh flows and pressures of H2 buffer gas, due to the EUVtransmission of H2. However, even H2 does absorb someEUV, making it imperative to use a pressure that is no higherthan necessary. The model detailed in this paper can beused to help quantify debris transport and inform sourcedevelopers as to how much buffer gas is necessary to preventdebris transport.
AcknowledgmentsThe authors would like to acknowledge the assistance ofSEMATECH Inc. in funding and contributing to the develop-ment of SNIFFED. Furthermore, part of this research wascarried out at the Frederick Seitz Materials ResearchLaboratory Central Facilities, University of Illinois, whichwas partly supported by the U.S. Department of Energyunder Grant No. DEFG02-91-ER45439.
References
1. A. A. Schafgans et al., “Performance optimization of MOPA pre-pulseLPP light source,” Proc. SPIE 9422, 94220B (2015).
2. D. T. Attwood, Soft X-Rays and Extreme Ultraviolet Radiation,Cambridge University Press, Cambridge (1999).
3. H. Maury et al., “Non-destructive X-ray study of the interphases inMo/Si and Mo/B4C/Si/B4C multilayers,” Thin Solid Films 514(1–2),278–286 (2006).
4. C. Hecquet et al., “Design, conception, and metrology of EUV mirrorsfor aggressive environments,” Proc. SPIE 6586, 65860X (2007).
5. R. A. Burdt et al., “Laser wavelength effects on the charge state resolvedion energy distributions from laser-produced Sn plasma,” J. Appl. Phys.107(4), 043303 (2010).
6. D. T. Elg et al., “Magnetic debris mitigation system for EUV sources,”J. Micro/Nanolithogr. MEMS MOEMS 14(1), 013506 (2015).
7. J. Sporre et al., “Ionic debris measurement of three extreme ultravioletsources,” J. Appl. Phys. 106(4), 043304 (2009).
8. D. N. Ruzic et al., “Reduction of ion energies from a multicomponentZ-pinch plasma,” IEEE Trans. Plasma Sci. 35(3), 606–613 (2007).
9. D. Andruczyk et al., “Energetic ion and neutral energy analyzer forextreme-ultraviolet sources,” Proc. SPIE 8322, 832237 (2012).
10. Y. Teramoto et al., “Development of Sn-fueled high power DPP EUVsource for enabling HVM,” Proc. SPIE 6517, 65173R (2007).
11. D. T. Elg et al., “Collector optic cleaning by in-situ hydrogen plasma,”Proc. SPIE 9422, 9422H (2015).
12. J. Sporre et al., “In-situ Sn contamination removal by hydrogen plasma,”Proc. SPIE 8322, 83222L (2012).
13. J. Sporre and D. N. Ruzic, “Debris transport analysis at the intermediatefocus of an extreme ultraviolet light source,” J. Micro/Nanolithogr.MEMS MOEMS 11(2), 021117 (2012).
14. K. C. Thompson et al., “Experimental test chamber design for opticsexposure testing and debris characterization of a xenon dischargeproduced plasma source for extreme ultraviolet lithography,”Microelectron. Eng. 83, 476–484 (2006).
15. E. L. Antonsen et al., “Ion debris characterization from a Z-pinchextreme ultraviolet light source,” J. Appl. Phys. 99, 063301 (2006).
16. J. R. Sporre, “Detection of energetic neutral flux emanating fromextreme ultraviolet light lithography source,” MS Thesis, Departmentof Nuclear, Plasma and Radiological Engineering, University ofIllinois at Urbana-Champaign (2010).
17. J. Greenwood, “The correct and incorrect generation of a cosine distri-bution of scattered particles for Monte-Carlo modelling of vacuumsystems,” Vacuum 67(2), 217–222 (2002).
18. J. F. Ziegler et al., SRIM–the Stopping and Range of Ions in Matter,Lulu Press Company, Morrisville, NC (2008).
19. D. N. Ruzic, “The effects of elastic scattering in neutral atom transport,”Phys. Fluids B 5(9), 3140–3147 (1993).
20. A. M. Myers et al., “Monte Carlo simulations of sputter atom transportin low-pressure sputtering: the effects of interaction potential, sputterdistribution, and system geometry,” J. Appl. Phys. 72(7), 3064–3071(1992).
21. A. A. Abrahamson, “Born-Mayer-type interatomic potential for neutralground-state atoms with Z ¼ 2 to Z ¼ 105�,” Phys. Rev. 178(1), 76–79(1969).
22. S. W. Van Sciver, Helium Cryogenics, 2nd ed., Springer, New York(2012).
23. N. Mehdipour et al., “A perturbed hard-sphere equation of state forliquid metals,” Phys. Chem. Liq. 49(3), 347–354 (2011).
24. M. S. Child, Molecular Collision Theory, Academic Press, New York(1974).
John R. Sporre is a reactive ion etching process engineer at IBMdeveloping methods for next-generation semiconductor manufactur-ing. His past areas of research have included energetic plasma ionand neutral characterization, laser-assisted plasma formation, as wellas plasma-based surface manipulation. He earned his PhD from theUniversity of Illinois at Urbana-Champaign in 2013.
Daniel T. Elg is a doctoral student at the Center for Plasma-MaterialInteractions at the University of Illinois at Urbana-Champaign. Hereceived his BS degree in electrical and computer engineering fromOlin College in 2011 and his MS degree in nuclear, plasma, and radio-logical engineering from the University of Illinois in 2013. He is a stu-dent member of SPIE. His research interests include plasma physicsand plasma processing applications.
Kishor K. Kalathiparambil received his PhD in physics from DeviAhilya University, Indore, India. Afterwards, he spent two years asa postdoctoral associate at the National Center for ScientificResearch at Aix-Marseille University, France. He is currently in histhird year of a postdoctoral research appointment at the Center forPlasma Materials Interactions at the University of Illinois at Urbana-Champaign, where he is working on developing liquid lithium-basedplasma facing components for fusion devices.
David N. Ruzic is Abel Bliss Professor of Nuclear, Plasma and Radio-logical Engineering, and director of the Center for Plasma-MaterialInteractions at the University of Illinois at Urbana-Champaign. Heis a fellow of the American Nuclear Society, the American VacuumSociety (AVS), and the Hertz Foundation. He also serves as thescientific director for the International Union of Vacuum Science,Techniques, and Applications.
J. Micro/Nanolith. MEMS MOEMS 013503-12 Jan–Mar 2016 • Vol. 15(1)
Sporre et al.: Modeling and measuring the transport and scattering of energetic debris. . .
Downloaded From: http://nanolithography.spiedigitallibrary.org/ on 02/05/2016 Terms of Use: http://spiedigitallibrary.org/ss/TermsOfUse.aspx