Embed Size (px)
Citation preview
7/25/2019 Modeling Building Classes Using Moment Matching
http://slidepdf.com/reader/full/modeling-building-classes-using-moment-matching 1/17
Modeling Building Classes Using Moment Matching
In Ho Cho,a)
M.EERI, and Keith Porter,b)
M.EERI
Large-scale earthquake risk assessment necessitates models of the seismic
performance of building classes. This work addresses how to depict a class
with only a few (index) buildings whose designs span the attributes that most
impact the seismic behavior of the class. We propose a general numerical moment
matching (MM) technique to represent those seismic attributes of index
buildings, which can then be individually analyzed by second-generation
performance-based earthquake engineering methods (PBEE-2). The results prob-
abilistically combined to model the class behavior as a whole. Thereby, the modelhonors the joint distribution of variable features within the class and propagates
all other uncertainties that PBEE-2 already recognizes. Importantly, we can
reflect and propagate with rigor the uncertain attributes of buildings within a
class, notably without resorting to standard distributions. The MM enables
PBEE-2 to rigorously capture seismic risk assessment of a building class.
[DOI: 10.1193/071712EQS239M]
INTRODUCTION
Probabilistic risk assessments of building portfolios subjected to natural hazards employ
models of the performance of asset classes, models such as vulnerability functions, fragility
functions, etc. (Asset classes are also called structure types, building types, facility types, and
perhaps others). Asset class definitions follow no uniform rule. For example, Wesson et al.
(2004) address the seismic performance of all single-family dwellings in Southern California
in the 1994 Northridge earthquake. Depending on how one counts them, HAZUS-MH uses
between 190 and 5,300 classes ( NIBS and FEMA 2003). The Global Earthquake Model
offers an innovative genetic taxonomy (Scawthorn 2013) that can classify buildings in vir-
tually unlimited ways. Each of these depicts buildings as undifferentiated specimens of
(potentially very small) classes.
Some authors create models of the fragility or vulnerability of asset classes from
analytical models of individual specimens. Depicting and propagating uncertainty in the
asset-class definition can be an important issue, potentially introducing as much performance
uncertainty as record-to-record variability or component damageability. A probabilistic
model of the asset class should reflect the variability of the seismically important features
of the class (i.e., those features that vary between assets in the class and whose variability
contributes significantly to the overall performance uncertainty). Some features are
a) Iowa State University, 326 Town, Ames, IA 50011 b) University of Colorado, 428 UCB, Boulder, CO 80309
Earthquake Spectra, Volume 32, No. 1, pages 285 – 301, February 2016; © 2016, Earthquake Engineering Research Institute
285
7/25/2019 Modeling Building Classes Using Moment Matching
http://slidepdf.com/reader/full/modeling-building-classes-using-moment-matching 2/17
convenient to simulate by Monte Carlo methods (e.g., material properties) and some are not
(e.g., number and configuration of bays and stories in a frame).
We present a procedure to select important features, perform a survey, and (the bulk of the paper) design a small sample — a few buildings — whose variability matches the survey.
To limit the number of required index buildings, we propose a sampling procedure called
moment matching. It is related to quadrature and requires designing fairly few buildings:
2n þ 1, where n is the number of the most important seismic attributes, such as degree
of vertical and plan irregularity.
PAST EFFORTS TO MODEL THE CHARACTERISTICS OF A BUILDING CLASS
Previous approaches to characterize class performance often resort to expert opinion (e.g.
ATC-13 1985) or statistical analyses of earthquake experience data (e.g., Wesson et al.
2004). In analytical performance-evaluation approaches (Czarnecki 1973, Kustu et al.
1982, Kircher et al. 1997, Porter et al. 2001 and 2002, Rossetto and Elnashai 2005), indi-
vidual assets are analyzed. Where the procedure is supposed to model a class, the model must
somehow quantify and propagate variability of important building features within the class.
For example, if the class comprises some subset of low-rise buildings (one to three stories),
then the variability in height within the class must be reflected in the uncertainty in the per-
formance of the class.
One can use census data (e.g., HAZUS-MH) or remote sensing data (e.g., Prasad et al.
2009) to quantify variability in attributes, but the question remains how to relate that variability to uncertain structural parameters such as fundamental period. Rossetto and
Elnashai (2005) use engineering principles and data to set parameters, but for a practical
limit, their application is restricted to a few tractable parameters, such as material properties
rather than design diversity (e.g., number of bays, stories, or degree of vertical and plan
irregularity).
We seek to characterize the most important features of assets within the class as uncertain
and enable one to analyze specimens by second-generation performance-based earthquake
engineering (PBEE-2) [e.g., using FEMA P-58 (ATC 2012)]. PBEE-2 propagates uncertainty
in the seismic performance of a particular, unambiguous asset in each of the four major ana-lytical stages of PBEE-2 — hazard, structural, damage, and loss-analysis stage — but not in the
asset definition (Figure 1). How can one make the asset definition also uncertain?
One could randomly sample and analyze buildings within the class. Many have used
Monte Carlo simulation or Latin hypercubes (e.g., Borzi et al. 2008). Those methods
pose several challenges. First, creating PBEE-2 structural models is time consuming. Second,
analyzing each building can be computationally demanding. Also, the random sampling
method often resorts to simplified structural analyses, such as an equivalent oscillation
system with idealized macroscopic nonlinearity. Another problem is that underlying prob-
ability density functions (PDFs) of real-world seismic features may not resemble a conve-nient parametric distribution (see Figure 2 for an example data set that shall be discussed
later). How can one represent asset classes with arbitrarily distributed features in a robust
yet simple way?
286 I. H. CHO AND K. PORTER
7/25/2019 Modeling Building Classes Using Moment Matching
http://slidepdf.com/reader/full/modeling-building-classes-using-moment-matching 3/17
PROPOSED APPLICATION OF MOMENT MATCHING
We suggest the following procedure to model uncertainty in the asset class: (1) select key
seismic features, (2) survey buildings in the class to quantify the joint distribution of those
features, (3) use MM to select sample points (attributes and weights of sample index
Height
Plan irregularity
Hazard
analysis
Structural
analysis
Damage
analysis
Loss
analysis
Asset
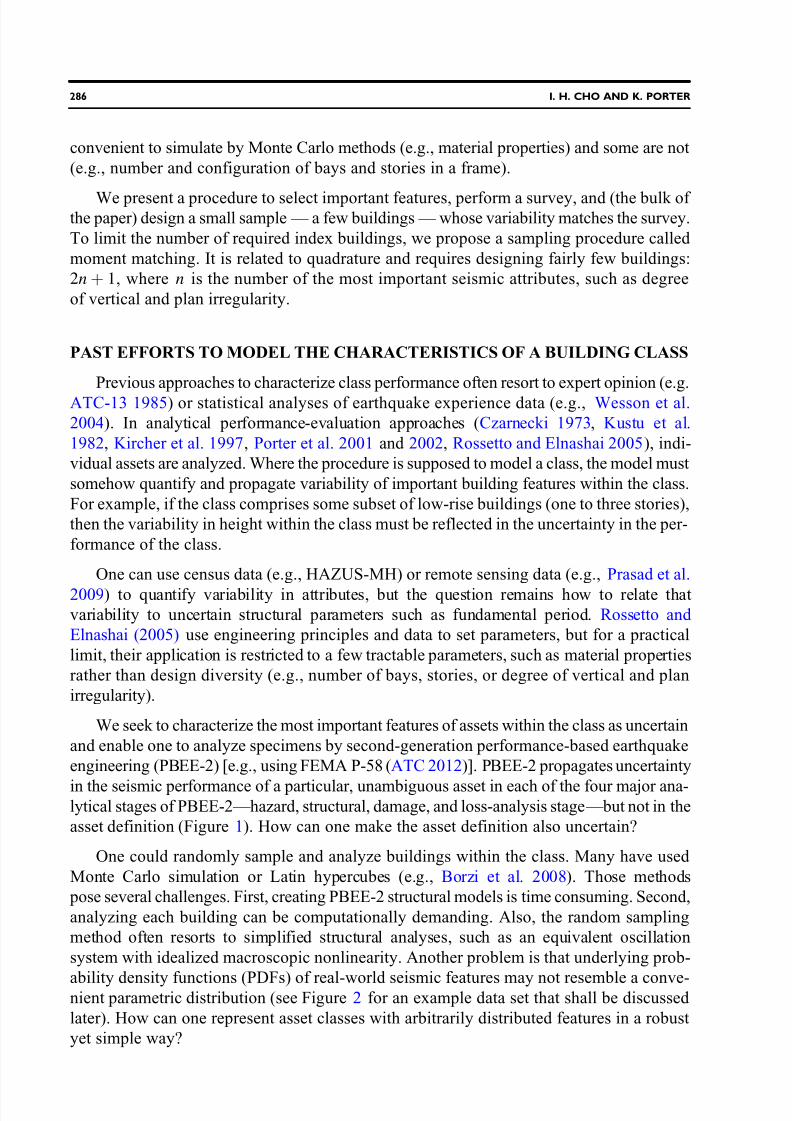
Figure 1. Illustration of PBEE-2 methodology augmented by a class-level asset definition. In the
top, four boxes represent key analytical stages. Street-level photos were obtained from authors’
field survey (aerial images from Google Earth).
Figure 2. Joint PDF plots of salient seismic features obtained from the field survey of 265 RCcommercial buildings in California. Both are far different from standard distributions.
MODELING BUILDING CLASSES USING MOMENT MATCHING 287
7/25/2019 Modeling Building Classes Using Moment Matching
http://slidepdf.com/reader/full/modeling-building-classes-using-moment-matching 4/17
buildings) to match the first several moments of the survey data, and (4) select or design
index buildings with the desired attributes. Then, these can be analyzed by PBEE-2, although
the PBEE-2 analysis is not a part of the present work. The procedure is independent of the
type of underlying PDFs — one need not assume Gaussian distributions, for example.
APPLICATION TO REINFORCED CONCRETE COMMERCIAL
BUILDING CLASS IN CALIFORNIA
We applied the procedure to commercial reinforced concrete (RC) buildings in
California. The goal of this illustrative application is to better explain the general procedure.
SELECTION AND QUANTIFICATION OF KEY SEISMIC FEATURES
It would be difficult to objectively select the most important seismic features — the oneswith the largest effect on repair cost — that vary between buildings in a class. It might require
a large number of PBEE-2 analyses. Our approach is a meta-analysis: review a number of
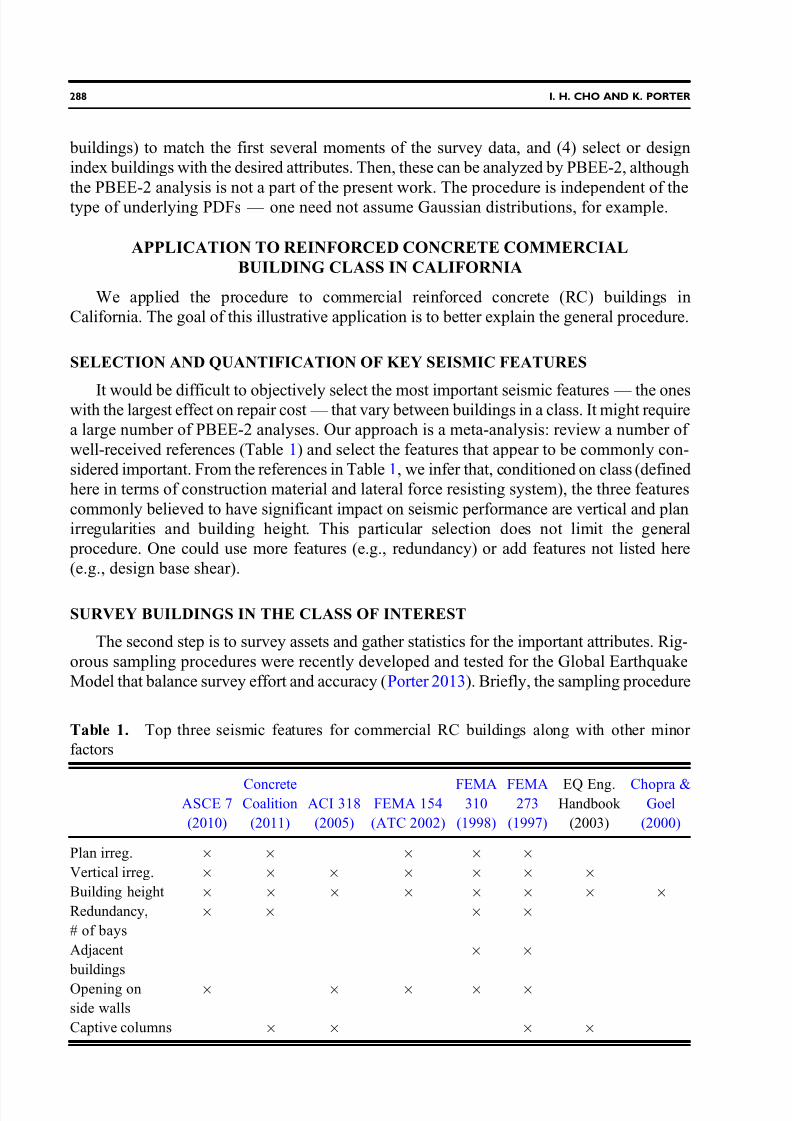
well-received references (Table 1) and select the features that appear to be commonly con-
sidered important. From the references in Table 1, we infer that, conditioned on class (defined
here in terms of construction material and lateral force resisting system), the three features
commonly believed to have significant impact on seismic performance are vertical and plan
irregularities and building height. This particular selection does not limit the general
procedure. One could use more features (e.g., redundancy) or add features not listed here
(e.g., design base shear).
SURVEY BUILDINGS IN THE CLASS OF INTEREST
The second step is to survey assets and gather statistics for the important attributes. Rig-
orous sampling procedures were recently developed and tested for the Global Earthquake
Model that balance survey effort and accuracy (Porter 2013). Briefly, the sampling procedure
Table 1. Top three seismic features for commercial RC buildings along with other minor
factors
ASCE 7
(2010)
ConcreteCoalition
(2011)
ACI 318
(2005)
FEMA 154
(ATC 2002)
FEMA310
(1998)
FEMA273
(1997)
EQ Eng.Handbook
(2003)
Chopra &Goel
(2000)
Plan irreg.
Vertical irreg.
Building height
Redundancy,
# of bays
Adjacent
buildings
Opening on
side walls
Captive columns
288 I. H. CHO AND K. PORTER
7/25/2019 Modeling Building Classes Using Moment Matching
http://slidepdf.com/reader/full/modeling-building-classes-using-moment-matching 5/17
calls for the analyst to randomly select sample city blocks in several neighborhoods with
common use and record the relevant features of the buildings on those blocks.
In our sample application, we conducted a field survey of commercial RC buildings inseveral California population centers: Los Angeles (population of 3.82 million as of 2011),
San Jose (967,000), and San Francisco (813,000). In addition, Pasadena (near Los Angeles,
2011 population of 138,000) was investigated as a proxy of smaller cities near a large one.
We focused on the downtown areas of the selected cities where old and new RC structures
can be found, thus (we hope) providing an unbiased distribution of the key features. We
emphasized all types of RC buildings lower than ∼40 stories in the chosen cities and obtained
265 samples with distinguishable key features. The full data set is presented in Cho and
Porter (2013a). With this real-world data we can now construct a few representative buildings
(denoted as index buildings hereafter), for which a robust and general mathematical tool, the
moment matching (MM) technique, will be adopted. In the following sections we expound onthe advantageous nature of MM and how to exploit the MM for arbitrary PDFs, without
resorting to standard distributions.
RECAP MOMENT MATCHING TECHNIQUE
Rosenblueth (1975) appears to be the first to outline an approach that samples over the
space of the joint distribution for the purpose of seismic risk management. He proposed two
samples per dimension in every combination, so the same size increases exponentially with
the number of features (i.e., 2n combinations of feature values for n features). Julier and
Uhlmann (2002) show how one can select a sample whose size increases linearly rather
than exponentially, and notably their method is not restricted to Gaussian distributions.The intuitive term “moment matching” was proposed by Ching et al. (2009), who applied
the reduced sigma point filter to seismic risk problems.
We depart from the work of Ching et al. (2009), but the differences and contributions of
our work should be noted. First, we suggest a general numerical tool that can tackle arbitrary
PDFs whereas they limited discussion to standard distributions. Second, our goal is to repre-
sent the diversity of a building class while theirs is efficient uncertainty propagation within
PBEE-2.
In MM, the continuous PDF of a random variable X (called X PDF hereafter) is replaced
by a discrete equivalent probability mass function (PMF) consisting of weighted delta func-
tions (here, delta function means the Dirac delta). The weights and positions of PMF are
selected such that the first few moments (mean, variance, skewness, and so on) of both
the discrete PMF and the original joint PDF are identical. In essence, the MM produces
point estimates to replace the continuous joint distribution (as done by Rosenblueth
1975). To better understand strengths of MM, it is instructive to review the underlying mathe-
matics (for details, see Ching et al. 2009).
The following discussion applies to a wide variety of problems, but the reader who wants
to think of it in the context of a loss-estimation problem can imagine a number of independent
variables X that describe the features of the assets in the class: their height, degree of planirregularity, degree of vertical irregularity, etc. We want to know Y, a vector of uncertain
measures of performance of the asset class, say repair cost, collapse probability, etc., at some
specific level of seismic excitation. The function Y ¼ gðXÞ gives that relationship; it might
MODELING BUILDING CLASSES USING MOMENT MATCHING 289
7/25/2019 Modeling Building Classes Using Moment Matching
http://slidepdf.com/reader/full/modeling-building-classes-using-moment-matching 6/17
be evaluated for a particular building specimen by PBEE-2. Now let us turn to the general
MM approach, which again is not limited to this particular application of X, Y, and gðXÞ.
We seek to estimate E ðYÞ, where Y ¼ gðXÞ, X and Y are n-dimensional random vari-ables, and E ½: is the expectation. Notably, only several moments of X are to be used for the
estimation, and the PDF of X is arbitrary for generality (not limited to Gaussian, etc.). Taking
a multivariate Taylor series expansion of gðXÞ around E ½X and then considering their expec-
tations lead to
EQ -TARGET;t em p:int r a lin k -;e1;41;548
E ½Y ¼ gð E ½XÞ |fflfflfflffl{zfflfflfflffl} 0th
þ 1
2! E
Xn
j ¼1
∂
∂ X j
ð X j E ½ X j Þ
gðXÞjX¼ E ðXÞ
|fflfflfflfflfflfflfflfflfflfflfflfflfflfflfflfflfflfflfflfflfflfflfflfflfflfflfflfflfflfflfflfflfflfflfflfflfflfflfflfflfflfflffl{zfflfflfflfflfflfflfflfflfflfflfflfflfflfflfflfflfflfflfflfflfflfflfflfflfflfflfflfflfflfflfflfflfflfflfflfflfflfflfflfflfflfflffl} 1st
þ 13! E Xn
j ¼1
∂∂ X j
ð X j E ½ X j Þ2gðXÞjX¼ E ðXÞ
|fflfflfflfflfflfflfflfflfflfflfflfflfflfflfflfflfflfflfflfflfflfflfflfflfflfflfflfflfflfflfflfflfflfflfflfflfflfflfflfflfflfflfflffl{zfflfflfflfflfflfflfflfflfflfflfflfflfflfflfflfflfflfflfflfflfflfflfflfflfflfflfflfflfflfflfflfflfflfflfflfflfflfflfflfflfflfflfflffl}
2nd
þ · · · ð1Þ
Consider the third term (i.e., second-order term) on the right-hand side (when n ¼ 2):
EQ-TARGET;t em p:int r al ink -;e2;41;429
1
3! E
ð X 1 E ½ X 1Þ2
∂2g
∂ X 21
þ ð X 2 E ½ X 2Þ2
∂2g
∂ X 22
þ 2ð X 1 E ½ X 1Þð X 2 E ½ X 2Þ ∂2g
∂ X 1∂ X 2X¼ E ðXÞ
(2)
As seen above, if we know E ½ X 2i (i.e., the moments of X PDF up to the second order),
then we can exactly estimate the E ½Y with the same second-order accuracy, and no higher
term is needed. Hence, with the first pth moments of X PDF we can obtain E ½Y of pth-order
accuracy and in the similar fashion the variance of Y (denoted by V ar ½Y) of b p∕2cth-order
accuracy (b:c means the integer part of the number). Also, in terms of computational effi-
ciency and accuracy, the MM exhibits superiority over the first-order second-moment
(FOSM), which holds emphasis on the mean and variance of the final loss ( Baker and Cornell
2003) as addressed by Ching et al. (2009).MM further manifests its power in collaboration with a point-estimation process (i.e.,
substituting weighted delta functions — point masses — for the continuous PDF of X).
With the originally continuous PDF of X, considering variability often necessitates compli-
cated numerical integration. With the equivalent discrete PMF (the weighted masses), we
merely need a weighted summation of the function of the point masses, which can be suc-
cinctly stated by
EQ-T ARGET;t em p:int r a link -;e 3;41;172 E ðYÞ ¼
ð PDF ðXÞgðXÞd X ≈
|{z} byMM Xq
i¼1 wigðχiÞ (3)
where i indicates ith delta function and q is the total number of delta functions, each of which
is represented by the location χi and weight wi.
290 I. H. CHO AND K. PORTER
7/25/2019 Modeling Building Classes Using Moment Matching
http://slidepdf.com/reader/full/modeling-building-classes-using-moment-matching 7/17
Naturally, the next question would be how to select the delta functions that exactly match
the first several moments. As mentioned by Ching et al., for general cases we need to solve
the nonlinear system of equations that can be rewritten for an arbitrary variable X
in a suc-cinct form:
EQ-TARGET;t em p:int ra link -;e4;62;591
2666664
χ 11 χ
12 … χ
1q
χ 21 χ
22 … χ
2q
..
. . .. ..
.
χ p1 χ
p2 … χ
pq
3777775
ð pqÞ
8>>><>>>:
w1
w2
..
.
wq
9>>>=>>>;
¼
8>>><>>>:
E ½ X 1 E ½ X 2
..
.
E ½ X p
9>>>=>>>;
andXqi¼1
wi ¼ 1 (4)
Thus, we have ( p þ 1) equations and 2q unknowns (i.e., q delta functions each represented by
its location χ i and weight wi). Hence, using the q delta functions, the first p ¼ ð2q 1Þmoments of the X PDF can be exactly matched. When X is an n-dimensional “independent ”
uncertain variable (the variables in X are independent of each other), with each uncertain
entity X i (i.e., X i ∈ X; i ∈ ½1; n) we need to perform the aforementioned procedure to obtain
the delta functions in the n-dimensional X space (leading to n q delta functions).
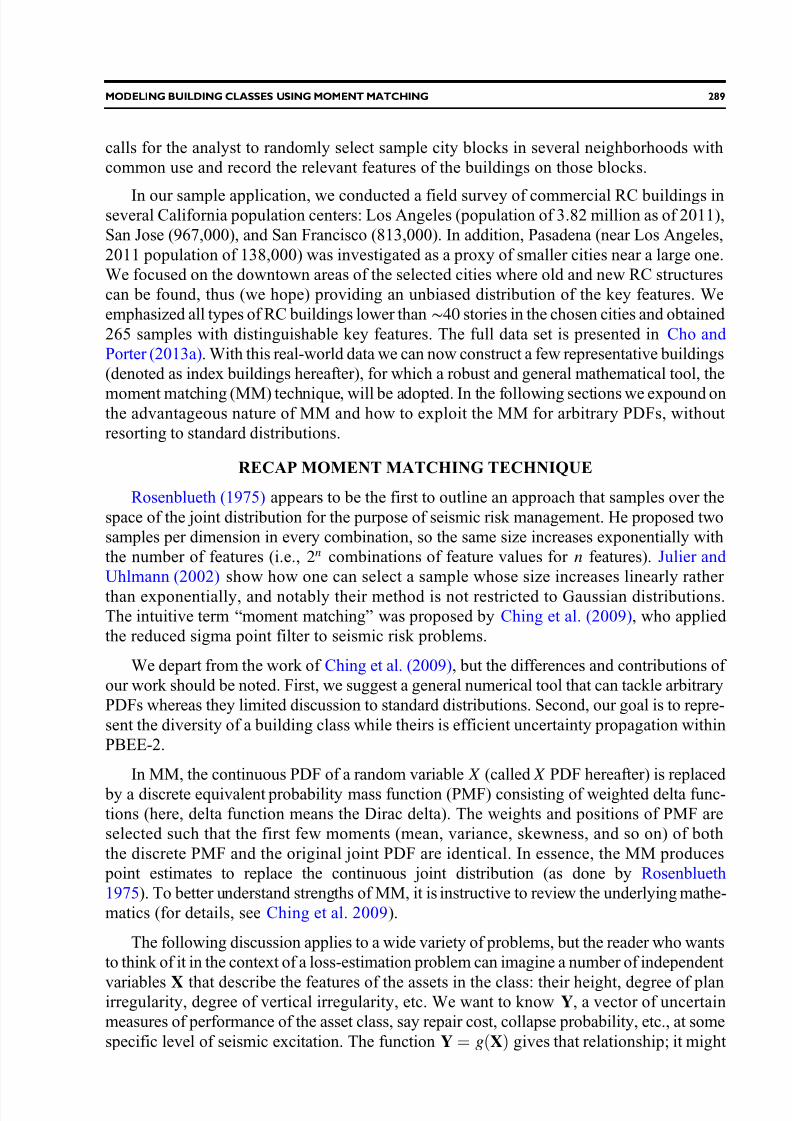
As it turns out from our case study — California commercial RC buildings — the cor-
relation coefficients among the salient seismic features are small enough that we can safely
assume that the seismic features considered herein are virtually uncorrelated and appear to be
independent (Figure 3). As pointed out by Ching et al. (2009), a special remedy exists when
the parameters in X are not independent. We will not further discuss the correlated X here; theinterested reader is referred to Ching et al. (2009) or Julier and Uhlmann (2002) for further
detail.
Ching et al. (2009) suggested three ways to attain the delta functions, which completely
matches the first p ¼ ð2q 1Þ moments: (1) solving the nonlinear system of equations;
(2) adopting the Gauss-quadrature integration points and weights, when the X PDF is in
the similar form of a standard one in reference to Hildebrand (1956) or Abramowitz and
Stegun (1972); (3) practical shortcut by assuming the locations a priori (referring to the
0
10
20
30
40
50
1.0 3.0 9.0
N u m b e r o f S t o r i e s
Log(Plan Irregularity)
1.0
1.5
2.0
2.5
3.0
3.5
1.0 2.0 4.0 8.0
V e r t i c a l I r r e g u l a r i t y
Log(Plan Irregularity)
0
10
20
30
40
50
1 2 3
N u m b e r o f S t o r i e s
Vertical Irregularity
correlation
coefficient: 0.163
correlation
coefficient: 0.033
correlation
coefficient: 0.013
Figure 3. Scatter plots of salient seismic features and correlation coefficients indicating mutual
independence. The logarithm of plan irregularity is used only for the visualization purpose.
MODELING BUILDING CLASSES USING MOMENT MATCHING 291
7/25/2019 Modeling Building Classes Using Moment Matching
http://slidepdf.com/reader/full/modeling-building-classes-using-moment-matching 8/17
most similar standard PDF) and then finding the weights by solving the now-linear system of
equations. Ching et al. (2009) focused on some well-behaved cases where standard Gauss-
quadrature can be exploited; we examine a more general case here.
FINDING DELTA FUNCTIONS USING MM
In a larger work, we present three methods to employ MM: (1) assume parametric dis-
tributions for the important attributes and use Gauss-quadrature; (2) use a numerical method
to find the MM points for each of dimension (each attribute) separately and then combine
(1-D MM); and (3) use a numerical method to find the MM points for all of the dimensions
simultaneously (multidimensional MM). Methods 2 and 3 involve direct nonlinear system
solving. In the present briefer work we focus on method 3 because of its generality, and 1-D
MM is essentially the same as the multidimensional MM.
MULTIDIMENSIONAL MM
In a larger work (Cho and Porter 2013a), we show a simple yet universal numerical
approach to obtaining three delta functions that exactly match the first five moments of
one attribute with an arbitrary distribution (i.e., not necessarily Gaussian, lognormal,
beta, etc.). We here formulate the extension to multiple dimensions. To keep the derivation
as easy to follow as possible, we focus on a three-dimensional (3-D) case with independent
variables. The case for four or another number of attributes is very similar, and, as previously
noted, one can also use MM for correlated attributes with the aid of specific mathematical
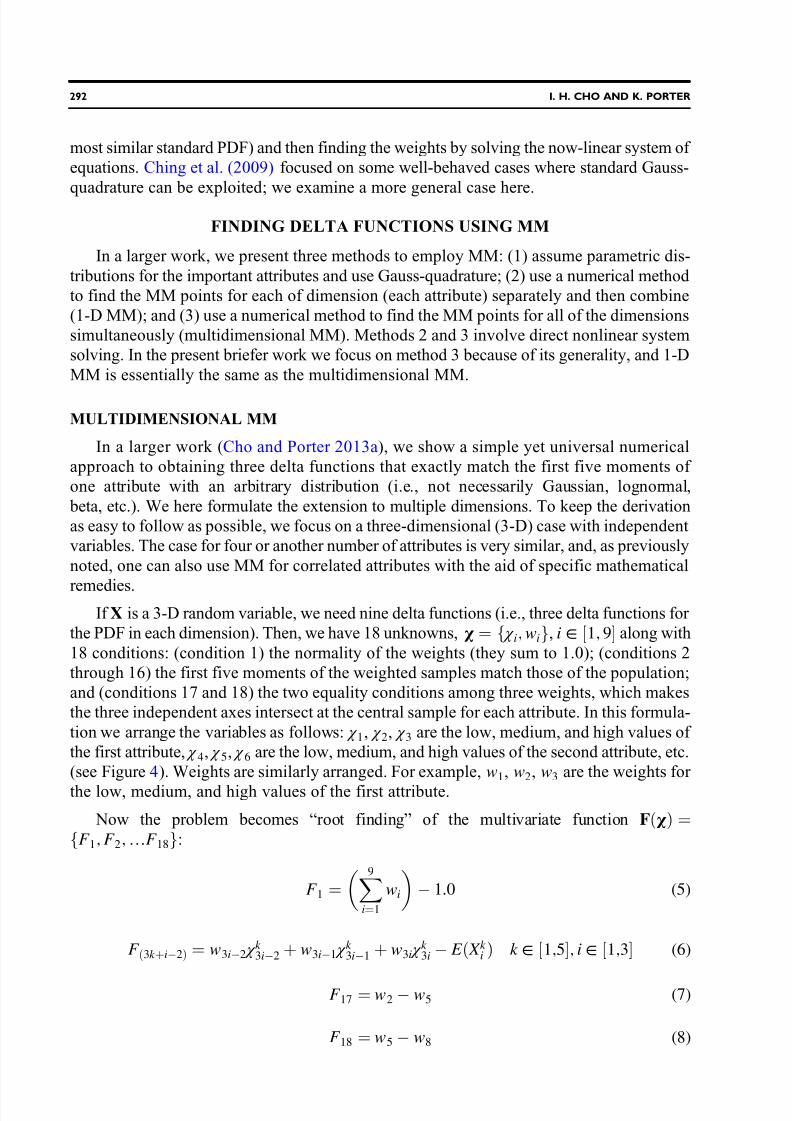
remedies.If X is a 3-D random variable, we need nine delta functions (i.e., three delta functions for
the PDF in each dimension). Then, we have 18 unknowns, χ ¼ f χ i;wig, i ∈ ½1; 9 along with
18 conditions: (condition 1) the normality of the weights (they sum to 1.0); (conditions 2
through 16) the first five moments of the weighted samples match those of the population;
and (conditions 17 and 18) the two equality conditions among three weights, which makes
the three independent axes intersect at the central sample for each attribute. In this formula-
tion we arrange the variables as follows: χ 1, χ 2, χ 3 are the low, medium, and high values of
the first attribute, χ 4, χ 5, χ 6 are the low, medium, and high values of the second attribute, etc.
(see Figure 4). Weights are similarly arranged. For example, w1, w2, w3 are the weights for
the low, medium, and high values of the first attribute.
Now the problem becomes “root finding” of the multivariate function FðχÞ ¼fF 1;F 2;…F 18g:
EQ-TARGET;t em p:int r a link -;e5;41;206F 1 ¼
X9
i¼1
wi
1.0 (5)
EQ-T ARGET;t em p:int r a link -; e6;41;154F ð3k þi2Þ ¼ w3i2 χ
k 3i2 þ w3i1 χ
k 3i1 þ w3i χ
k 3i E ð X k i Þ k ∈ ½1;5; i ∈ ½1;3 (6)
EQ-TARGET ;t em p:int r a link -;e7;41;12 6F 17 ¼ w2 w5 (7)
EQ-TARGET ;t em p:int r a link -;e8;41;99F 18 ¼ w5 w8 (8)
292 I. H. CHO AND K. PORTER
7/25/2019 Modeling Building Classes Using Moment Matching
http://slidepdf.com/reader/full/modeling-building-classes-using-moment-matching 9/17
7/25/2019 Modeling Building Classes Using Moment Matching
http://slidepdf.com/reader/full/modeling-building-classes-using-moment-matching 10/17
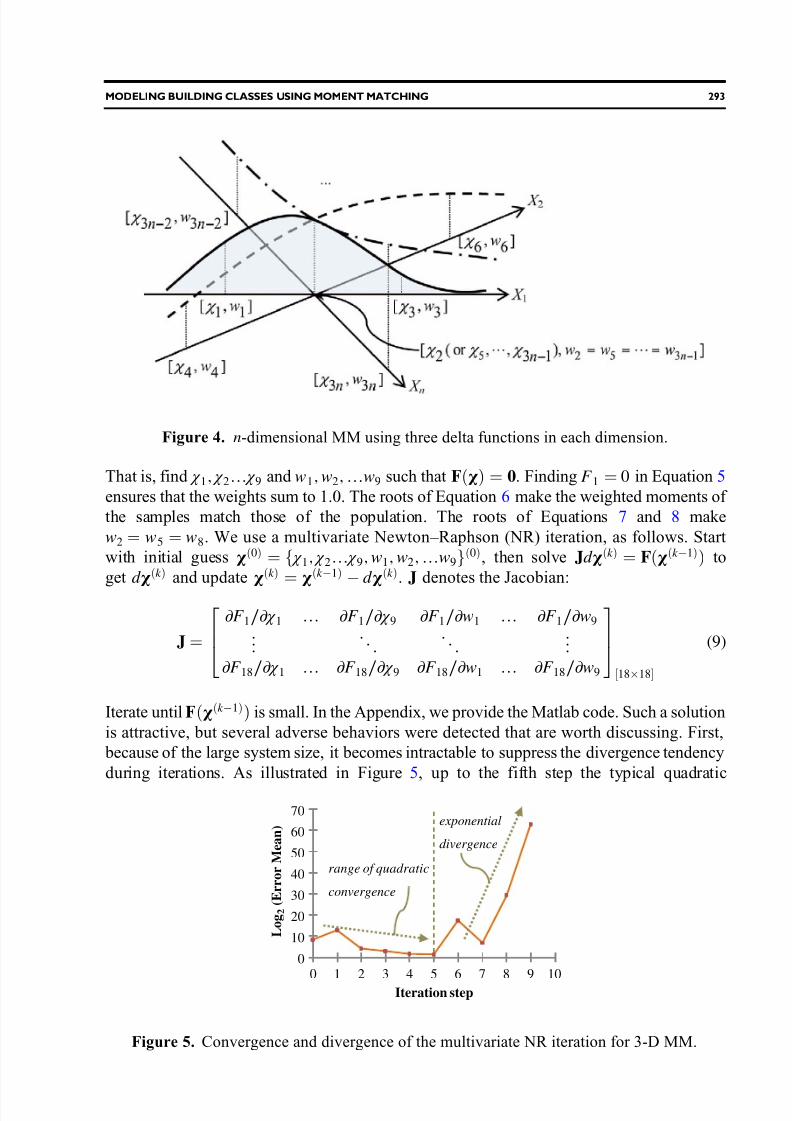
convergence rate of the multivariate NR iteration is apparent. However, considering the fifth
power of the location terms in Equation 6, a slight change to them appears to severely disturb
the stability of the equilibrium, satisfied at the fifth iteration. Once the instability emerges, the
error grows exponentially. Thus, given intuitively reasonable initial values, prudent abortion
of the iteration appears necessary to obtain an acceptably accurate solution. That is, the ana-
lyst should carefully monitor the calculation and stop it when FðχÞ becomes small.
Second, the 3-D MM method often produces nonpositive location values in positively
valued variables during iteration (negative stories, for example). This behavior is commonly
found in many tests using reliable tools such as Matlab or Mathematica. It is well known that
negative weights can emerge during the application of MM technique and are acceptable
(Ching et al. 2009). However, a nonpositive location (e.g., number of stories) has no practical
interpretation. Additional constraints can be imposed to obtain positive locations, but in
many tests of our sample application, such automatic remedies often caused divergence problems.
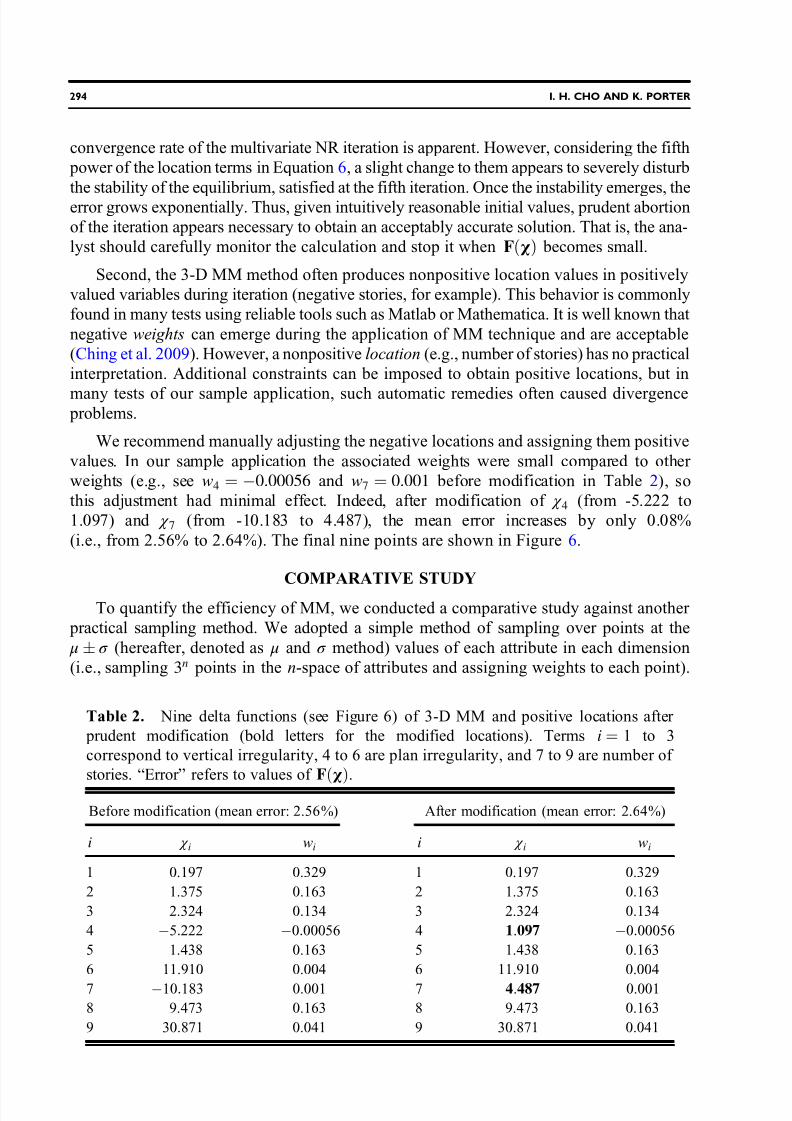
We recommend manually adjusting the negative locations and assigning them positive
values. In our sample application the associated weights were small compared to other
weights (e.g., see w4 ¼ 0.00056 and w7 ¼ 0.001 before modification in Table 2), so
this adjustment had minimal effect. Indeed, after modification of χ 4 (from -5.222 to
1.097) and χ 7 (from -10.183 to 4.487), the mean error increases by only 0.08%
(i.e., from 2.56% to 2.64%). The final nine points are shown in Figure 6.
COMPARATIVE STUDY
To quantify the efficiency of MM, we conducted a comparative study against another
practical sampling method. We adopted a simple method of sampling over points at the
μ σ (hereafter, denoted as μ and σ method) values of each attribute in each dimension
(i.e., sampling 3n points in the n-space of attributes and assigning weights to each point).
Table 2. Nine delta functions (see Figure 6) of 3-D MM and positive locations after
prudent modification (bold letters for the modified locations). Terms i ¼ 1 to 3
correspond to vertical irregularity, 4 to 6 are plan irregularity, and 7 to 9 are number of
stories. “Error ” refers to values of FðχÞ.
Before modification (mean error: 2.56%) After modification (mean error: 2.64%)
i χ i wi i χ i wi
1 0.197 0.329 1 0.197 0.329
2 1.375 0.163 2 1.375 0.163
3 2.324 0.134 3 2.324 0.134
4 5.222 0.00056 4 1:097 0.00056
5 1.438 0.163 5 1.438 0.163
6 11.910 0.004 6 11.910 0.004
7 10.183 0.001 7 4:
487 0.001
8 9.473 0.163 8 9.473 0.163
9 30.871 0.041 9 30.871 0.041
294 I. H. CHO AND K. PORTER
7/25/2019 Modeling Building Classes Using Moment Matching
http://slidepdf.com/reader/full/modeling-building-classes-using-moment-matching 11/17
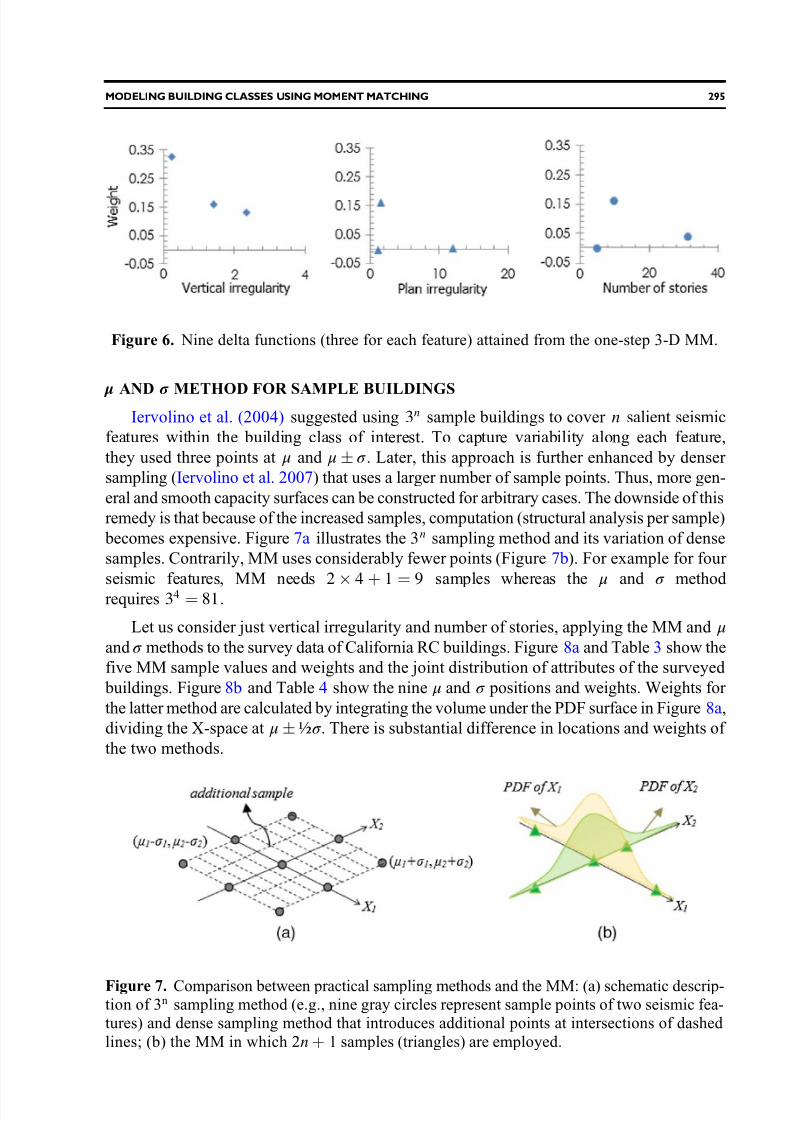
μ AND σ METHOD FOR SAMPLE BUILDINGSIervolino et al. (2004) suggested using 3n sample buildings to cover n salient seismic
features within the building class of interest. To capture variability along each feature,
they used three points at μ and μ σ . Later, this approach is further enhanced by denser
sampling (Iervolino et al. 2007) that uses a larger number of sample points. Thus, more gen-
eral and smooth capacity surfaces can be constructed for arbitrary cases. The downside of this
remedy is that because of the increased samples, computation (structural analysis per sample)
becomes expensive. Figure 7a illustrates the 3n sampling method and its variation of dense
samples. Contrarily, MM uses considerably fewer points (Figure 7b). For example for four
seismic features, MM needs 2 4 þ 1 ¼ 9 samples whereas the μ and σ method
requires 34 ¼ 81.
Let us consider just vertical irregularity and number of stories, applying the MM and μ
and σ methods to the survey data of California RC buildings. Figure 8a and Table 3 show the
five MM sample values and weights and the joint distribution of attributes of the surveyed
buildings. Figure 8b and Table 4 show the nine μ and σ positions and weights. Weights for
the latter method are calculated by integrating the volume under the PDF surface in Figure 8a,
dividing the X-space at μ ½σ . There is substantial difference in locations and weights of
the two methods.
Figure 6. Nine delta functions (three for each feature) attained from the one-step 3-D MM.
Figure 7. Comparison between practical sampling methods and the MM: (a) schematic descrip-tion of 3n sampling method (e.g., nine gray circles represent sample points of two seismic fea-tures) and dense sampling method that introduces additional points at intersections of dashed
lines; (b) the MM in which 2n þ 1 samples (triangles) are employed.
MODELING BUILDING CLASSES USING MOMENT MATCHING 295
7/25/2019 Modeling Building Classes Using Moment Matching
http://slidepdf.com/reader/full/modeling-building-classes-using-moment-matching 12/17
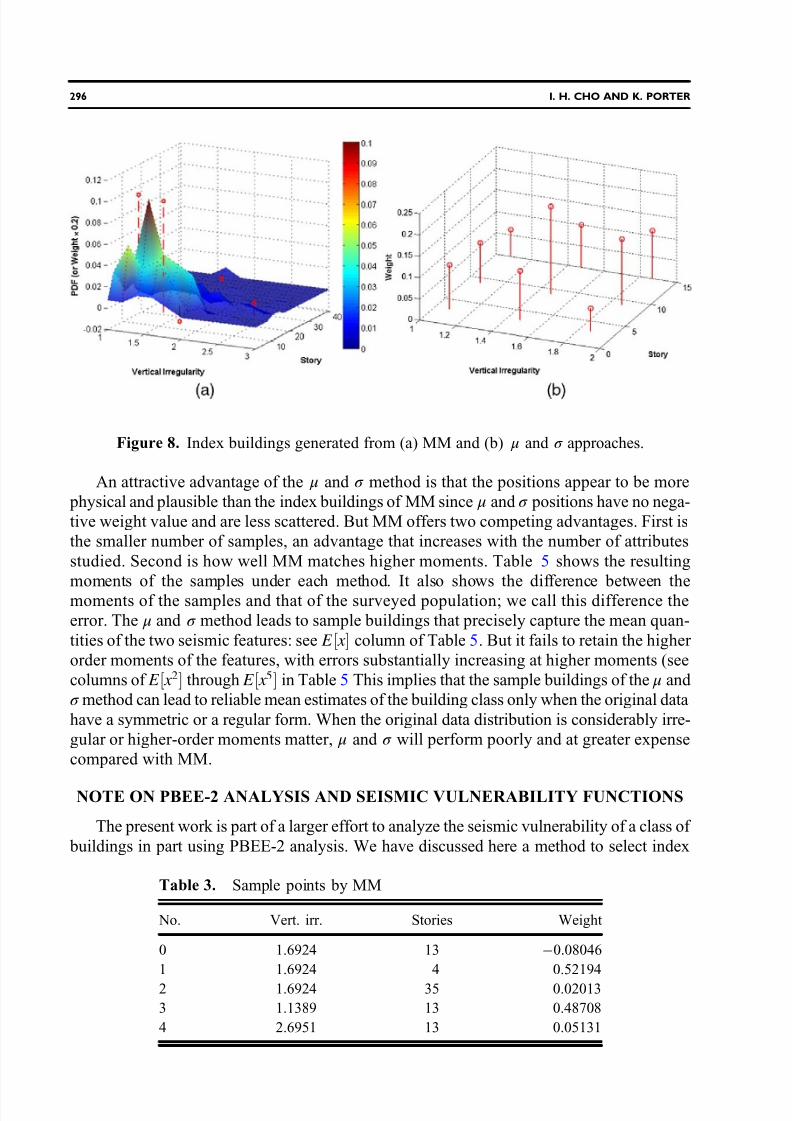
An attractive advantage of the μ and σ method is that the positions appear to be more
physical and plausible than the index buildings of MM since μ and σ positions have no nega-
tive weight value and are less scattered. But MM offers two competing advantages. First is
the smaller number of samples, an advantage that increases with the number of attributes
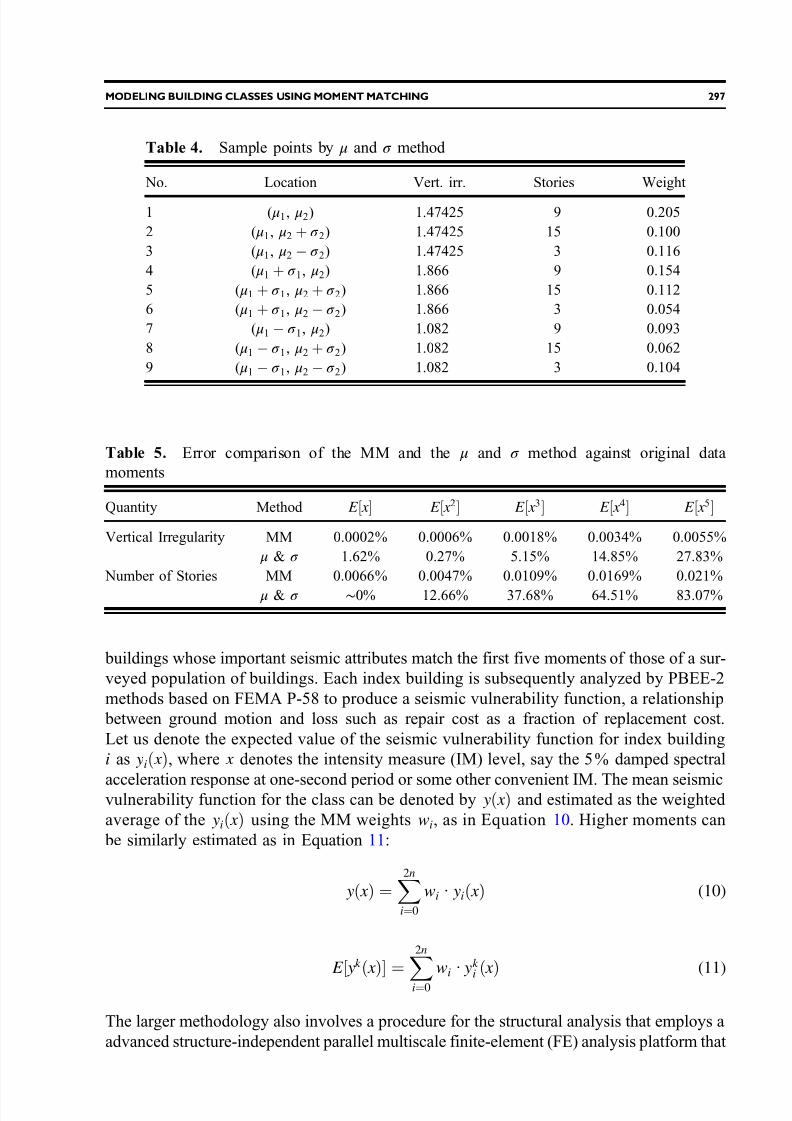
studied. Second is how well MM matches higher moments. Table 5 shows the resulting
moments of the samples under each method. It also shows the difference between the
moments of the samples and that of the surveyed population; we call this difference the
error. The μ and σ method leads to sample buildings that precisely capture the mean quan-
tities of the two seismic features: see E ½ x column of Table 5. But it fails to retain the higher
order moments of the features, with errors substantially increasing at higher moments (see
columns of E ½ x 2 through E ½ x 5 in Table 5 This implies that the sample buildings of the μ and
σ method can lead to reliable mean estimates of the building class only when the original data
have a symmetric or a regular form. When the original data distribution is considerably irre-
gular or higher-order moments matter, μ and σ will perform poorly and at greater expense
compared with MM.
NOTE ON PBEE-2 ANALYSIS AND SEISMIC VULNERABILITY FUNCTIONS
The present work is part of a larger effort to analyze the seismic vulnerability of a class of
buildings in part using PBEE-2 analysis. We have discussed here a method to select index
Figure 8. Index buildings generated from (a) MM and (b) μ and σ approaches.
Table 3. Sample points by MM
No. Vert. irr. Stories Weight
0 1.6924 13 0.08046
1 1.6924 4 0.52194
2 1.6924 35 0.02013
3 1.1389 13 0.48708
4 2.6951 13 0.05131
296 I. H. CHO AND K. PORTER
7/25/2019 Modeling Building Classes Using Moment Matching
http://slidepdf.com/reader/full/modeling-building-classes-using-moment-matching 13/17
buildings whose important seismic attributes match the first five moments of those of a sur-
veyed population of buildings. Each index building is subsequently analyzed by PBEE-2
methods based on FEMA P-58 to produce a seismic vulnerability function, a relationship
between ground motion and loss such as repair cost as a fraction of replacement cost.
Let us denote the expected value of the seismic vulnerability function for index building
i as yið x Þ, where x denotes the intensity measure (IM) level, say the 5% damped spectral
acceleration response at one-second period or some other convenient IM. The mean seismicvulnerability function for the class can be denoted by yð x Þ and estimated as the weighted
average of the yið x Þ using the MM weights wi, as in Equation 10. Higher moments can
be similarly estimated as in Equation 11:
EQ -TARGET;t em p:int r a lin k -;e10;62;202 yð x Þ ¼X2n
i¼0
wi · yið x Þ (10)
EQ-T ARGET;t em p:int r a link -; e11;62;150 E ½ yk ð x Þ ¼ X2n
i¼0
wi · yk i ð x Þ (11)
The larger methodology also involves a procedure for the structural analysis that employs a
advanced structure-independent parallel multiscale finite-element (FE) analysis platform that
Table 4. Sample points by μ and σ method
No. Location Vert. irr. Stories Weight
1 ( μ1, μ2) 1.47425 9 0.205
2 ( μ1, μ2 þ σ 2) 1.47425 15 0.100
3 ( μ1, μ2 σ 2) 1.47425 3 0.116
4 ( μ1 þ σ 1, μ2) 1.866 9 0.154
5 ( μ1 þ σ 1, μ2 þ σ 2) 1.866 15 0.112
6 ( μ1 þ σ 1, μ2 σ 2) 1.866 3 0.054
7 ( μ1 σ 1, μ2) 1.082 9 0.093
8 ( μ1 σ 1, μ2 þ σ 2) 1.082 15 0.062
9 ( μ1 σ 1, μ2 σ 2) 1.082 3 0.104
Table 5. Error comparison of the MM and the μ and σ method against original data
moments
Quantity Method E ½ x E ½ x 2 E ½ x 3 E ½ x 4 E ½ x 5
Vertical Irregularity MM 0.0002% 0.0006% 0.0018% 0.0034% 0.0055%
μ & σ 1.62% 0.27% 5.15% 14.85% 27.83%
Number of Stories MM 0.0066% 0.0047% 0.0109% 0.0169% 0.021%
μ & σ ∼0% 12.66% 37.68% 64.51% 83.07%
MODELING BUILDING CLASSES USING MOMENT MATCHING 297
7/25/2019 Modeling Building Classes Using Moment Matching
http://slidepdf.com/reader/full/modeling-building-classes-using-moment-matching 14/17
requires only the building geometry and two generic material parameters (see Cho and Porter
2013b). It can explicitly capture multidirectional cracks, crushing, progressive bar buckling,
nonlinear shear, and localized damage (Cho 2013). Owing to these multidisciplinaryadvances, in the future class-level loss estimations we will be able to reflect building-specific
characteristics such as construction era and so on, without resorting to idealized models. This
advance in structural analyses in conjunction with a few index buildings of MM is significant
since by doing so we can accurately consider the construction era, which substantially affects
reinforcement detailing as well as the largely fluctuating design base shear. It should be noted
that when the MM numerically generates an unrealistic index building, a simple intuitive
adjustment of the seismic feature is recommended as addressed before. Still, even in
such a rare case, we can rigorously control the error.
CONCLUSIONS
We show how one can characterize an asset class with a sample set of index buildings for
purposes of societal loss modeling. The sample set is selected to represent the probabilistic
variability in a few important seismic attributes that vary between buildings in the class. The
attributes can have arbitrary probability distributions (i.e., not necessarily Gaussian, lognor-
mal, etc.) and can be correlated. Doing so extends PBEE-2 by treating the asset definition as
uncertain, just as PBEE-2 currently quantifies and propagates uncertainties in hazard, struc-
tural response, damage, and loss.
The procedure begins by identifying the features that matter most. We selected three
top features by a meta-analysis (i.e., by seeking those features that many respected sources
commonly considered important). Here we chose vertical and plan irregularities and build-
ing height, although the use of other features would be straightforward since the meth-
odology is not limited by which features or how many are believed to contribute most to
the variability of the performance of the class. The analyst then performs a field survey to
quantify the joint distribution of the attributes in the class. We carried out a field survey
of 265 California commercial RC buildings and determined the joint distribution of the
selected features.
One then selects index buildings with particular values of each attribute and a weight for
each index buildings so that the weighted samples represent the population of the asset class.The method employs moment matching: a sampling strategy in which the sample values and
weights are selected so that the first several moments of the weighted samples match those of
the surveyed population. Even with correlated attributes, one can select 2n þ 1 samples to
match the first five moments of the population, where n is the number of attributes of interest.
Other methods that sample over the joint attribute space tend to require a number of samples
that increases exponentially with n.
In a larger work we offer three procedures to select sample positions and weights, includ-
ing one where the attributes have an approximately parametric distribution. Here we present
only one of these three methods. It uses a multivariate Newton –
Raphson iteration to select positions and weights for all the attributes simultaneously and allows the attributes to have an
arbitrary, nonparametric distribution. The method exhibits strong sensitivity to initial con-
ditions and has convergence problems, but we offer practical remedies.
298 I. H. CHO AND K. PORTER
7/25/2019 Modeling Building Classes Using Moment Matching
http://slidepdf.com/reader/full/modeling-building-classes-using-moment-matching 15/17
As shown in the practical application and a comparative study against a practical sam-
pling method (using μ and μ σ points), a small number of 2n þ 1 index buildings proved
sufficient to rigorously mimic the statistics of the original data. Being capable of tackling
arbitrary PDFs and also achieving both accuracy and computational efficiency, we can now
proceed toward large-scale loss estimation with no restrictions of region, building classes,
and associated PDFs.
ACKNOWLEDGMENTS
This research is funded by the Willis Research Network and the Global Earthquake
Model, whose support is gratefully acknowledged.
APPENDIX
Please refer to the online version of this paper to access the supplemental material.
REFERENCES
Abramowitz, M., and Stegun, I. A. (eds.), 1972. Handbook of Mathematical Functions with Formulas, Graphs, and Mathematical Tables, 9th printing, Dover, NY.
ACI Committee 318, 2005. Building Code Requirements for Structural Concrete (ACI 318-05)
and Commentary (ACI 318R-05), American Concrete Institute, Detroit, MI.
Applied Technology Council (ATC), 2005. Guidelines for Seismic Performance Assessment of
Buildings 25%Complete Draft , Department of Homeland Security, Washington, D.C., 161 pp.
Applied Technology Council (ATC), 2002. FEMA 154: Rapid Visual Screening of Buildings for Potential Hazards: A Handbook , Second Edition, Federal Emergency Manage-ment Agency, Washington, D.C., available at http://www.fema.gov/plan/prevent/earthquake/
pdf/fema-154.pdf .
Applied Technology Council (ATC), 2012. ATC-58: Guidelines for Seismic Performance Assess-
ment of Buildings, 100% Draft , Redwood City, CA.
Applied Technology Council (ATC), 1985. Earthquake Damage Evaluation Data for California
(ATC-13), Applied Technology Council, Redwood City, CA.
ASCE 7-10, 2010. Minimum Design Loads for Buildings and Other Structures , American Society
of Civil Engineering, Reston, VA.
Baker, J. W., and Cornell, C. A., 2003. Uncertainty Specification and Propagation for Loss Estimation Using FOSM Methods, PEER-2003/07, Pacific Earthquake Engineering ResearchCenter, University of California, Berkeley, 89 pp.
Borzi, B., Pinho, R., and Crowley, H., 2008. Simplified pushover-based vulnerability analysis for large-scale assessment of RC buildings, Engineering Structures 30, 804 – 820.
Ching, J., Porter, K. A., and Beck, J. L., 2009. Propagating uncertainties for loss estimation in performance-based earthquake engineering using moment matching, Structure and Infrastruc-ture Engineering 5, 245 – 262.
Cho, I., 2013. Virtual earthquake engineering laboratory for capturing nonlinear shear, localized damage, and progressive buckling of bar, Earthquake Spectra 29, 103 – 126.
Cho, I., and Porter, K. A., 2013. Three Techniques for Modeling Building Classes Using Moment Matching , SESM 13-01, Structural Engineering and Structural Mechanics Program, Depart-ment of Civil Environmental and Architectural Engineering, University of Colorado Boulder,
available at http://www.sparisk.com/pubs/Cho-2013-SESM-building-classes.pdf .
MODELING BUILDING CLASSES USING MOMENT MATCHING 299
7/25/2019 Modeling Building Classes Using Moment Matching
http://slidepdf.com/reader/full/modeling-building-classes-using-moment-matching 16/17
Cho, I., and Porter, K. A., 2013b. Structure-independent parallel platform for nonlinear analysesof general real-scale RC structures under cyclic loading, Journal of Structural Engineering
[DOI: 10.1061/(ASCE)ST.1943-541X.0000871].
Chopra, A. N., and Goel, R. K., 2000. Building period formulas for estimating seismic displace-ments, Earthquake Spectra 16, 533 – 536.
Concrete Coalition, 2011. The Concrete Coalition and the California Inventory Project: An Esti-
mate of the Number of Pre-1980 Concrete Buildings in the State, a project of EERI, PEER, and ATC.
Czarnecki, R. M., 1973. Earthquake Damage to Tall Buildings, Structures Publication 359,Massachusetts Institute of Technology, Cambridge, MA.
Federal Emergency Management Agency, 1998. FEMA 310: Handbook for Seismic Evaluation
of Existing Buildings – A Prestandard , ASCE, Washington, D.C.
Federal Emergency Management Agency, 1997. NEHRP Guidelines for the Seismic Rehabilita-tion of Buildings, FEMA-273, Washington, D. C.
Guevara, L. T., and García, L. E., 2005. The captive- and short-column effects, EarthquakeSpectra 21, 141 – 160.
Hildebrand, F. B., 1956. Introduction to Numerical Analysis, McGraw-Hill, New York.
Iervolino, I., Fabbrocino, G., and Manfredi, G., 2004. Fragility of standard industrialstructures by a response surface based method, Journal of Earthquake Engineering 8,
927 – 945.
Iervolino, I., Manfredi, G., Polese, M., Verderame, G. M., and Fabbrocino, G., 2007. Seismic risk
of R.C. building classes, Engineering Structures 29, 813 – 820.
Julier, S. J., and Uhlmann, J. K., 2002. Reduced sigma point filters for the propagation of means and covariances through nonlinear transformations, in Proceedings American Control Conference, 8-10 May, 2002, Anchorage, Alaska.
Kircher, C. A., Reitherman, R. K., Whitman, R. V., and Arnold, C., 1997. Estimation of earth-quake losses to buildings, Earthquake Spectra 13, 703 – 720.
Kustu, O., Miller, D. D., and Brokken, S. T., 1982. Development of Damage Functions for Highrise Building Components, U.S. Department of Energy, URS/John A Blume & Associ-
ates, San Francisco, CA.
National Institute of Building Sciences and Federal Emergency Management Agency (NIBS and
FEMA), 2003. Multi-hazard Loss Estimation Methodology, Earthquake Model, HAZUS®MH
Technical Manual , Federal Emergency Management Agency, Washington, D. C.Porter, K., 2009. Cracking an open safe: HAZUS vulnerability functions in terms of structure-
independent spectral acceleration, Earthquake Spectra 25, 361 – 378.
Porter, K., 2013. A field sampling strategy for estimating a building inventory, inventory datacollection tools, Global Earthquake Model , available at http://nexus.globalquakemodel.org.
Porter, K. A., Beck, J. L., and Shaikhutdinov, R. V., 2002. Sensitivity of building loss estimates tomajor uncertain variables, Earthquake Spectra 18, 719 – 744.
Porter, K. A., Kiremidjian, A. S., and LeGrue, J. S., 2001. Assembly-based vulnerability of build-ings and its use in performance evaluation, Earthquake Spectra 17, 291 – 312.
Prasad, J. S. R., Singh, Y., Kaynia, A. M., and Lindholm, C., 2009. Socioeconomic clustering in
seismic risk assessment of urban housing stock, Earthquake Spectra 25, 619 – 641.Rosenblueth, E., 1975. Point estimates for probability moments. P. Natl. Acad. Sci. 72,
3812 – 3814.
300 I. H. CHO AND K. PORTER

7/25/2019 Modeling Building Classes Using Moment Matching
http://slidepdf.com/reader/full/modeling-building-classes-using-moment-matching 17/17
Rossetto, T., and Elnashai, A., 2005. A new analytical procedure for the derivation of displacement-based vulnerability curves for populations of RC structures, Engineering Structures 27, 397 – 409.
Scawthorn, B. S. C., Charleson, A. W., Allen, L., Greene, M., and Silva, J. V., 2013. GEM Build-ing Taxonomy Version 2.0, GEM Foundation.
Wesson, R. L., Perkins, D. M., Leyendecker, E. V., Roth, Jr., R. J., and Petersen, M. D., 2004.
Losses to single-family housing from ground motions in the 1994 Northridge, California,earthquake, Earthquake Spectra 20, 1021 – 1045.
(Received 27 September 2012; accepted 10 November 2013)
MODELING BUILDING CLASSES USING MOMENT MATCHING 301


![HOWELLMultiple Choice Questions and Extended Matching … · 2010. 1. 12. · Extended matching questions [EMQ] At the moment they are used mainly in numerical or medical exams but](https://img.pdfslide.net/doc/110x75/612f8b3c1ecc5158694383e9/howellmultiple-choice-questions-and-extended-matching-2010-1-12-extended-matching.jpg)