Embed Size (px)
Citation preview
ORIGINAL PAPER
Modeling determinants of urban growth in Dongguan, China:a spatial logistic approach
Felix H. F. Liao • Y. H. Dennis Wei
Published online: 28 September 2012
� Springer-Verlag 2012
Abstract This paper examines spatial variations of urban
growth patterns in Chinese cities through a case study of
Dongguan, a rapidly industrializing city characterized by a
bottom-up pattern of development based on townships.
We have employed both non-spatial and spatial logistic
regression models to analyze urban land conversion. The
non-spatial logistic regression has found the significance of
accessibility, neighborhood conditions and socioeconomic
factors for urban development. The logistic regression with
spatially expanded coefficients significantly improves the
orthodoxy logistic regression with lower levels of spatial
autocorrelation of residuals and better goodness-of-fit.
More importantly, the spatial logistic model reveals the
spatially varying relationship between urban growth and
its underlying factors, particularly the local influence of
environment protection and urban development policies.
The results of the spatial logistic model also provide clear
clues for assessing environmental risks to take the local
contexts into account.
Keywords Urban growth � Spatially non-stationary
relationship � Spatial expansion � Dongguan � Urban
development policies � Environmental risk assessment
1 Introduction
By 2012, over half of the population (51.3 %) in China live in
urban areas (Page et al. 2012). This is the first time that more
people live in cities than in rural areas in this country. The
unprecedented urbanization in China, however, has given rise
to the enormous loss of agricultural land (Yeh and Li 1998)
and landscape fragmentation (Sui and Zeng 2001). Urban
expansion also imposes challenges for environmental sus-
tainability such as water pollution and degeneration of land
ecological security (Hu et al. 2005; Su et al. 2011). With the
advances of spatial analysis, geographic information system
(GIS), and remote sensing techniques, extensive efforts have
been made to analyze the complex spatial patterns of urban
landscape changes and to understand the underlying factors
with spatially explicit models (Gao and Li 2011; Luo and
Wei 2009; Su et al. 2012). Evidence has shown that applying
spatial statistical models to urban expansion not only con-
tributes to the understanding of the complex urbanization
process (Luo and Wei 2009), but also offers more valuable
information for environmental risk assessment, mainly by
taking into account the spatially non-stationary relationship
between urban landscape transformation and its neighbor-
hood ecological environment (Gao and Li 2011).
A wide range of factors underlying the urban growth in
Chinese cities have been identified and studied. On one hand,
social scientists attempted to explore the driving forces of
urban growth from institutional and political economic
perspectives (Ding and Lichtenberg 2011; Yang and Wang
2008). They have found that urban development in China has
been shaped by a triple-process transformation of glob-
alization, decentralization, and marketization (Wei 2005).
Scholars also argue that the growth of Chinese cities is a path-
dependent trajectory influenced by the legacy of socialist
political and planning systems (Lin 2006; Wei 2012). On the
An earlier version of this paper was presented at the GIScience 2012
conference, Columbus, Ohio, September 18–21, 2012.
F. H. F. Liao (&)
Department of Geography, University of Utah, Salt Lake City,
UT 84112-9155, USA
e-mail: [email protected]
Y. H. D. Wei
Department of Geography and Institute of Public and
International Affairs, University of Utah, Salt Lake City,
UT 84112-9155, USA
e-mail: [email protected]
123
Stoch Environ Res Risk Assess (2014) 28:801–816
DOI 10.1007/s00477-012-0620-y
other hand, GIS scientists and landscape ecologists have
improved our understanding of urban growth in China
through landscape ecology methods, GIS modeling, and
simulation techniques (Yu and Ng 2007; Li and Yeh 2002;
Yue et al. 2010). Specifically, some GIS specialists have
applied simulation techniques, represented by multi-agent
model and cellular automata (CA), to predict urban devel-
opment patterns (Li and Yeh 2002; Xie et al. 2007). How-
ever, most of these models deemphasize the socioeconomic
factors and institutional and political contexts of China’s
urban development; the models also tend to focus on the
prediction of urban growth in the future and technological
methods. As argued by Luo and Wei (2009), these models
have limited ability to explain the mechanisms and the
diverse patterns of urban development in Chinese cities.
Through a case study of Dongguan, a city in South China,
this paper aims to achieve three research objectives. First, by
using spatial expansion method, this paper provides an
efficient and computationally less expensive way to model
the spatially varying relationship between urban growth and
its underlying factors (Luo and Wei 2009; Su et al. 2012).
Second, as the recent research on China mainly focuses on
the largest cities, the case study of Dongguan, a second-tier
city, also aims to emphasize the diverse urban growth pat-
terns in a different regional setting. More importantly, the
analysis of the results, supported by in-depth knowledge of
local institutions and fieldworks, attempts to highlight that
integrating remotely sensing data with socioeconomic fac-
tors and local institutions (policies) is necessary for a better
understanding of the complex urbanization process in China.
Third, since the late 1990s, in response to challenges arising
from environmental degradation, the city government in
Dongguan has put more efforts to better protect the envi-
ronment and promote a compact and sustainable urban
development (Hu et al. 2005; Lin 2006). This research also
provides an exploratory tool to assess the efficacy of these
new urban development and environment protection policies
based on a spatially explicit model and recent remotely
sensing and GIS data. The paper is organized as follows:
after a brief introduction of the study area and data, we will
introduce a spatial logistic regression model; we then apply
both non-spatial and spatial logistic regression methods to
model urban growth in Dongguan from 1988 to 2006; the
last section presents our conclusion and discussion.
2 Study area, data and methods
2.1 Study area
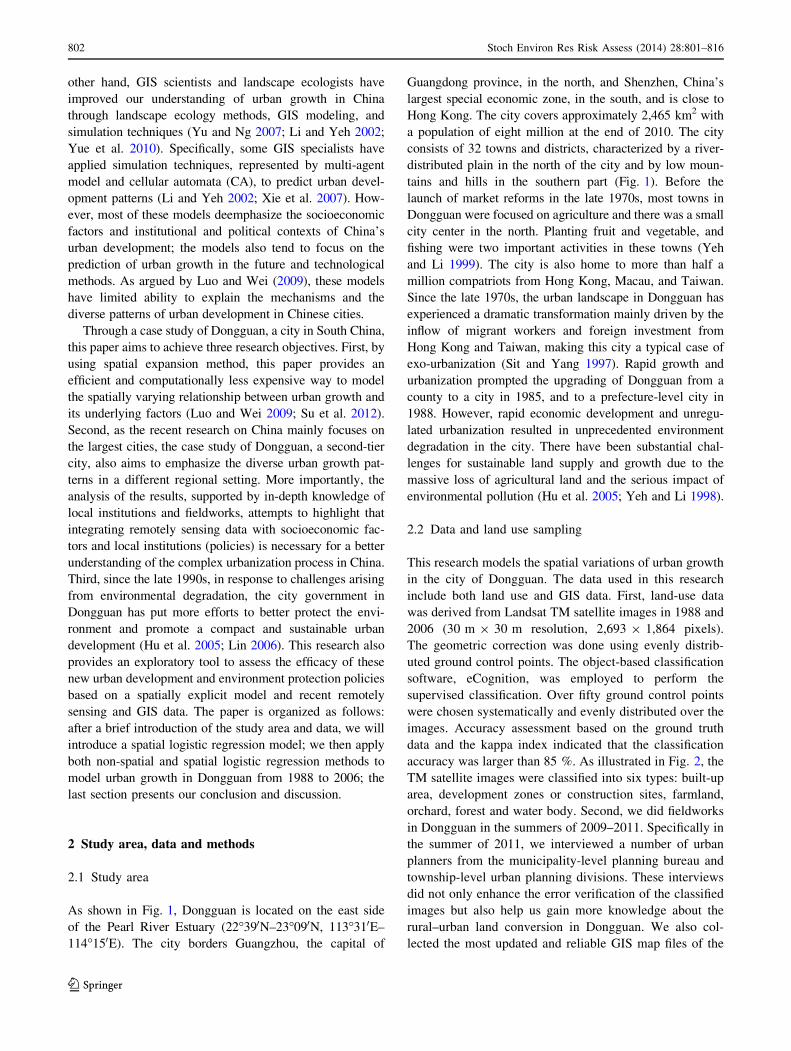
As shown in Fig. 1, Dongguan is located on the east side
of the Pearl River Estuary (22�390N–23�090N, 113�310E–
114�150E). The city borders Guangzhou, the capital of
Guangdong province, in the north, and Shenzhen, China’s
largest special economic zone, in the south, and is close to
Hong Kong. The city covers approximately 2,465 km2 with
a population of eight million at the end of 2010. The city
consists of 32 towns and districts, characterized by a river-
distributed plain in the north of the city and by low moun-
tains and hills in the southern part (Fig. 1). Before the
launch of market reforms in the late 1970s, most towns in
Dongguan were focused on agriculture and there was a small
city center in the north. Planting fruit and vegetable, and
fishing were two important activities in these towns (Yeh
and Li 1999). The city is also home to more than half a
million compatriots from Hong Kong, Macau, and Taiwan.
Since the late 1970s, the urban landscape in Dongguan has
experienced a dramatic transformation mainly driven by the
inflow of migrant workers and foreign investment from
Hong Kong and Taiwan, making this city a typical case of
exo-urbanization (Sit and Yang 1997). Rapid growth and
urbanization prompted the upgrading of Dongguan from a
county to a city in 1985, and to a prefecture-level city in
1988. However, rapid economic development and unregu-
lated urbanization resulted in unprecedented environment
degradation in the city. There have been substantial chal-
lenges for sustainable land supply and growth due to the
massive loss of agricultural land and the serious impact of
environmental pollution (Hu et al. 2005; Yeh and Li 1998).
2.2 Data and land use sampling
This research models the spatial variations of urban growth
in the city of Dongguan. The data used in this research
include both land use and GIS data. First, land-use data
was derived from Landsat TM satellite images in 1988 and
2006 (30 m 9 30 m resolution, 2,693 9 1,864 pixels).
The geometric correction was done using evenly distrib-
uted ground control points. The object-based classification
software, eCognition, was employed to perform the
supervised classification. Over fifty ground control points
were chosen systematically and evenly distributed over the
images. Accuracy assessment based on the ground truth
data and the kappa index indicated that the classification
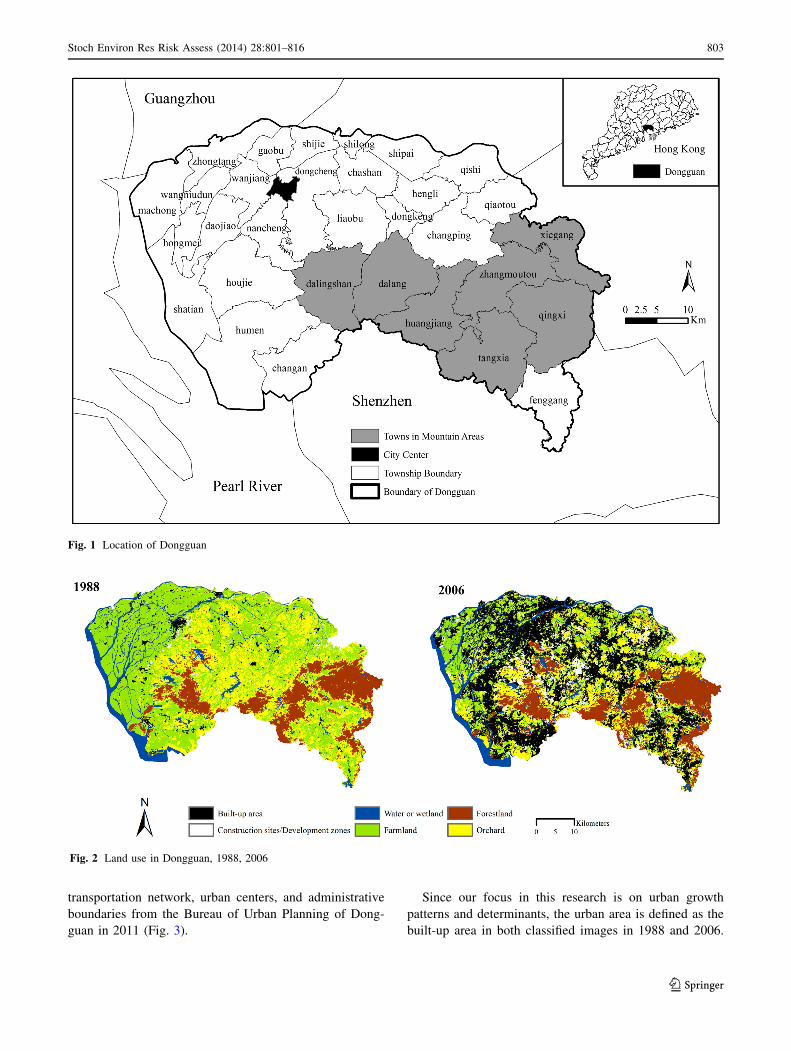
accuracy was larger than 85 %. As illustrated in Fig. 2, the
TM satellite images were classified into six types: built-up
area, development zones or construction sites, farmland,
orchard, forest and water body. Second, we did fieldworks
in Dongguan in the summers of 2009–2011. Specifically in
the summer of 2011, we interviewed a number of urban
planners from the municipality-level planning bureau and
township-level urban planning divisions. These interviews
did not only enhance the error verification of the classified
images but also help us gain more knowledge about the
rural–urban land conversion in Dongguan. We also col-
lected the most updated and reliable GIS map files of the
802 Stoch Environ Res Risk Assess (2014) 28:801–816
123
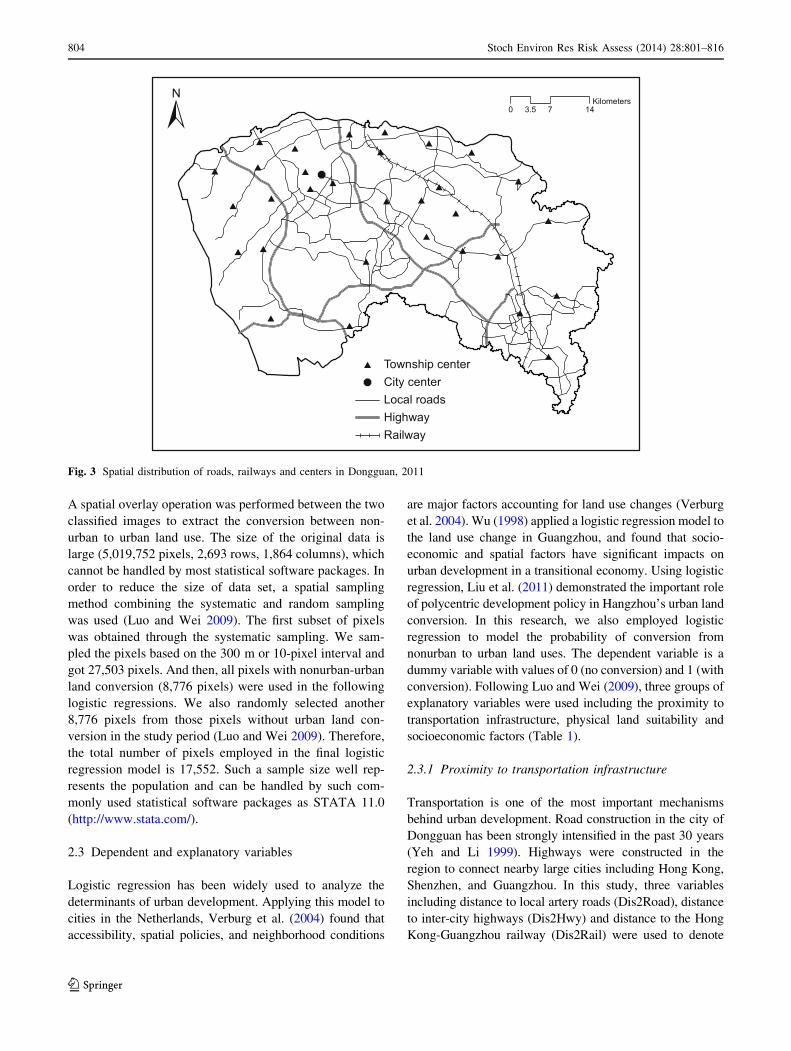
transportation network, urban centers, and administrative
boundaries from the Bureau of Urban Planning of Dong-
guan in 2011 (Fig. 3).
Since our focus in this research is on urban growth
patterns and determinants, the urban area is defined as the
built-up area in both classified images in 1988 and 2006.
Fig. 1 Location of Dongguan
Fig. 2 Land use in Dongguan, 1988, 2006
Stoch Environ Res Risk Assess (2014) 28:801–816 803
123
A spatial overlay operation was performed between the two
classified images to extract the conversion between non-
urban to urban land use. The size of the original data is
large (5,019,752 pixels, 2,693 rows, 1,864 columns), which
cannot be handled by most statistical software packages. In
order to reduce the size of data set, a spatial sampling
method combining the systematic and random sampling
was used (Luo and Wei 2009). The first subset of pixels
was obtained through the systematic sampling. We sam-
pled the pixels based on the 300 m or 10-pixel interval and
got 27,503 pixels. And then, all pixels with nonurban-urban
land conversion (8,776 pixels) were used in the following
logistic regressions. We also randomly selected another
8,776 pixels from those pixels without urban land con-
version in the study period (Luo and Wei 2009). Therefore,
the total number of pixels employed in the final logistic
regression model is 17,552. Such a sample size well rep-
resents the population and can be handled by such com-
monly used statistical software packages as STATA 11.0
(http://www.stata.com/).
2.3 Dependent and explanatory variables
Logistic regression has been widely used to analyze the
determinants of urban development. Applying this model to
cities in the Netherlands, Verburg et al. (2004) found that
accessibility, spatial policies, and neighborhood conditions
are major factors accounting for land use changes (Verburg
et al. 2004). Wu (1998) applied a logistic regression model to
the land use change in Guangzhou, and found that socio-
economic and spatial factors have significant impacts on
urban development in a transitional economy. Using logistic
regression, Liu et al. (2011) demonstrated the important role
of polycentric development policy in Hangzhou’s urban land
conversion. In this research, we also employed logistic
regression to model the probability of conversion from
nonurban to urban land uses. The dependent variable is a
dummy variable with values of 0 (no conversion) and 1 (with
conversion). Following Luo and Wei (2009), three groups of
explanatory variables were used including the proximity to
transportation infrastructure, physical land suitability and
socioeconomic factors (Table 1).
2.3.1 Proximity to transportation infrastructure
Transportation is one of the most important mechanisms
behind urban development. Road construction in the city of
Dongguan has been strongly intensified in the past 30 years
(Yeh and Li 1999). Highways were constructed in the
region to connect nearby large cities including Hong Kong,
Shenzhen, and Guangzhou. In this study, three variables
including distance to local artery roads (Dis2Road), distance
to inter-city highways (Dis2Hwy) and distance to the Hong
Kong-Guangzhou railway (Dis2Rail) were used to denote
Fig. 3 Spatial distribution of roads, railways and centers in Dongguan, 2011
804 Stoch Environ Res Risk Assess (2014) 28:801–816
123
the accessibility of a sample point. To obtain values of
proximity variables for each sampled pixel, the Euclidean
Distance tool in ArcGIS 10.0 was used to generate the
distance raster surfaces and then these pixel values were
extracted to sample points.
2.3.2 Physical conditions
As land use land cover change is also closely related to
the neighborhood physical land-use conditions (Cheng and
Masser 2003; Luo and Wei 2009), we employed several
neighborhood variables encompassing density of farmland
(DenFarm), density of water body (DenWater), density of
forestland (DenForest) and density of orchard land (DenOr-
chard) as the proxy of land-use conditions. They can indicate
the availability of land or neighbor environmental conditions.
The neighborhood was defined as a circle of 480 m radius.
This discretion was based on the consideration of distance
decay effect and drew upon the experience of other scholars
(Cheng and Masser 2003; Luo and Wei 2009; Verburg et al.
2004). We calculated the neighbor densities using the zonal
statistics tool in ArcGIS 10.0. We also extracted slope
information (Slope) from a 90 m 9 90 m digital elevation
model (DEM) for all sample points, so as to measure the
topographical suitability for urban development.
2.3.3 Socioeconomic factors
Research on urban growth place more emphasis on accessi-
bility and physical conditions, which are necessary condi-
tions. Scholars have increasingly recognized socioeconomic
factors as sufficient drivers of urban expansion (Seto and
Kaufmann 2003). Our selection of socioeconomic factors
was guided by the theoretical development in economic
geography and urban economics, especially agglomeration,
network, and institution (policy) (Luo and Wei 2009; Wei
and Gu 2010). We selected four variables to represent the
influence of socioeconomic factors on urban growth. We
measured the urban agglomeration effect by the distance to
the city center (Dis2CBD) and the distance to the nearest
sub-center (or the nearest township center, Dis2TC) (Jacobs
1969). We selected the density of built-up area and the
density of development zones/construction sites in the
neighborhood to measure the effects of industrial agglomer-
ation economies (Krugman 1991) and policies. In particular,
the construction of development zones, noted as ‘‘develop-
ment zone fever,’’ is one of the most important policies to
promote urban expansion in China (Yang and Wang 2008).
We computed the neighborhood indices, DenDevZone and
DenUrban, by measuring the densities of urban built-up area
and development-zone land within a distance of 480 m from
the central cell. Last, we performed a correlation analysis for
the explanatory variables. The results show no pair of vari-
ables has a significant linear correlation, which ensure the
afterwards regression analysis will not have the problem of
multicollinearity.
2.4 Logistic regression and expansion method
We applied the logistic regression to model the urban land
transition. This method is widely employed to examine the
determinants of rural–urban land conversion in Chinese
cities (e.g. Wu 1998; Luo and Wei 2009; Liu et al. 2011).
The logistic regression takes the following form:
log it Yð Þ ¼ b0 þXn
i¼1
bixi ð1Þ
where xi are explanatory variables, and logit (Y) is a linear
combination function of the explanatory variables.
Parameters bi are the regression coefficients to be
estimated. The logit (Y) can be transformed back to the
probability that (Y = 1):
P Y ¼ 1ð Þ ¼exp b0 þ
Pni¼1 bixi
� �
1þ exp b0 þPn
i¼1 bixi
� � ð2Þ
The typical logistic model above could effectively
explain the determinants of urban land conversion.
However, the potential spatially non-stationary process of
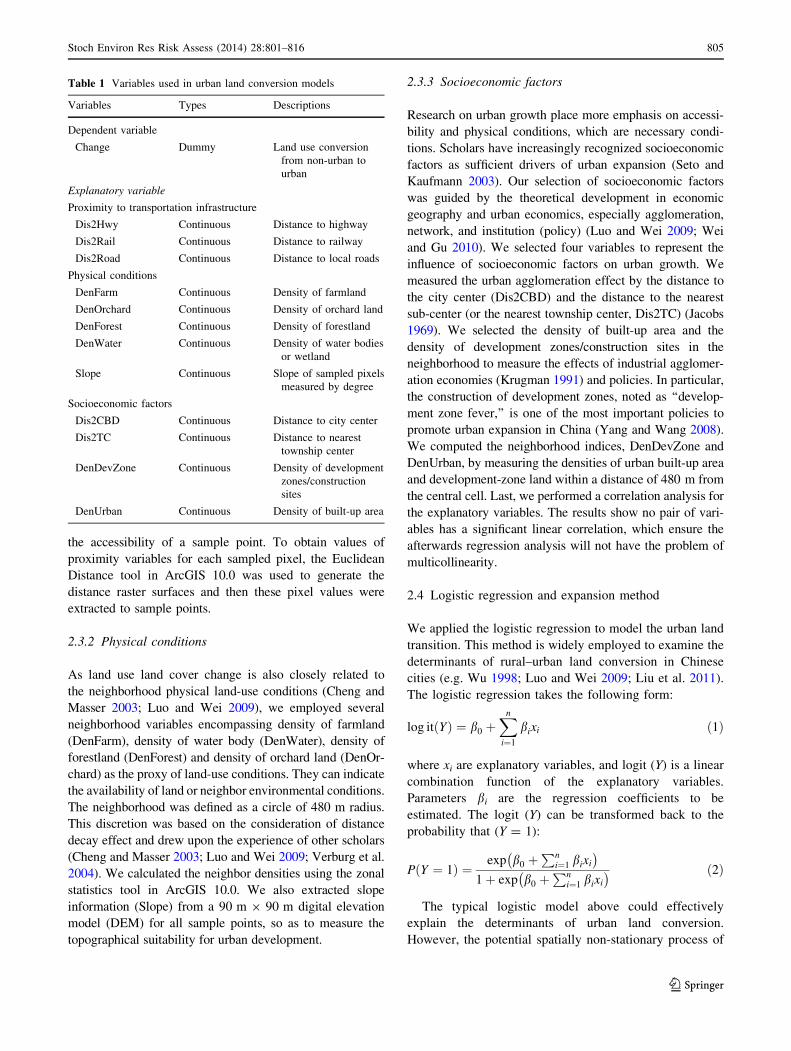
Table 1 Variables used in urban land conversion models
Variables Types Descriptions
Dependent variable
Change Dummy Land use conversion
from non-urban to
urban
Explanatory variable
Proximity to transportation infrastructure
Dis2Hwy Continuous Distance to highway
Dis2Rail Continuous Distance to railway
Dis2Road Continuous Distance to local roads
Physical conditions
DenFarm Continuous Density of farmland
DenOrchard Continuous Density of orchard land
DenForest Continuous Density of forestland
DenWater Continuous Density of water bodies
or wetland
Slope Continuous Slope of sampled pixels
measured by degree
Socioeconomic factors
Dis2CBD Continuous Distance to city center
Dis2TC Continuous Distance to nearest
township center
DenDevZone Continuous Density of development
zones/construction
sites
DenUrban Continuous Density of built-up area
Stoch Environ Res Risk Assess (2014) 28:801–816 805
123
urban growth remains unknown. A few methods have been
applied to model the spatially non-stationary process,
which mainly include multi-level modeling (Duncan and
Jones 2000) and geographically weighted regression
(GWR) (Fotheringham et al. 2002).
The multilevel modeling approach particularly deals
with the discrete spatial heterogeneity of geographical
phenomenon (Anselin 1988). This approach is constrained
by the arbitrary discretion of spatial hierarchy. It is more
applicable when the spatial hierarchy of the data is known.
However, in this research, we have limited information
about the hierarchical structure of the probability of urban
land conversion. Therefore, a multilevel approach was not
applied.
A second alternative, GWR focuses on the continuous
spatial heterogeneity (Fotheringham et al. 2002). It has also
been used to model the rural–urban land conversion in
Chinese cities (Luo and Wei 2009; Su et al. 2012). For
example, Luo and Wei (2009) employed a logistic GWR to
model land development in the city of Nanjing. Su et al.
(2012) employed GWR to analyze the spatially varying
relationship between urbanization and agricultural land-
scape patterns. However, the method of GWR is less
applicable in this research for a number of reasons. First,
the logistic GWR is computationally expensive (Luo and
Wei 2009). The normal process of such a huge sample
(17,552 observations) has high computation demand for
normal desktop computers and made the logistic GWR
hard to use in this research. Second, the results of the GWR
approach are highly sensitive to kernel bandwidth of
weight determination. Different bandwidths may result in
different coefficient surfaces (Su et al. 2012). Adaptive
bandwidth was an important improvement, but it made the
logistic GWR more computationally demanding. Third and
more importantly, recent research efforts have pointed out
that GWR performs well for interpolation and prediction
(Harris et al. 2011) but may generate spurious coefficient
surfaces for statistical inferences and policy implications
(Paez et al. 2011; Wheeler and Tiefelsdorf 2005; Wheeler
2009). Given the controversy about whether the GWR
approach is appropriated for making inference about the
spatially non-stationary process (Paez et al. 2011), we
elected to use the spatial expansion method to provide a
computationally less expensive and more efficient way to
explore spatially varying relationships in the context of
large sample size.
The spatial expansion method was proposed by Casetti
(1972). The expansion method is a spatial analytical tool
attempting to integrate contextual variations (Paez et al.
2010). The model reflects variations over space as an
expansion of deterministic coefficients. The initial model is
based on the original logistic regression:
log it Yð Þ ¼ CþXn
i¼1
bixi ð3Þ
in which C is constant, bt is the parameter for the individual
explanatory variable xi. However, in the orthodoxy logistic
regression model, the relationship between dependent and
independent variables is based on an underlying assumption
that the bi coefficients are the same for all the observations
involved; in other words, the model is stable across space
(Casetti 2010; Fan 1994). This assumption is problematic
because of spatial heterogeneity (Anselin 1988). A simple
way to model spatially varying relationships is to trans-
form the vector bi in Eq. (3) into a set of expansion
coefficients in relation to contextual variations. For example,
the parameters of the initial model can be further developed
by means of a polynomial expansion of a suitable degree,
using the co-ordinates (l, m) of each location to take the
effect of local context into account. Suppose the spatial trend
in the relationship between urban land conversion and its
explanatory variables in the initial model with respect to the
co-ordinates lk; vkð Þ takes the following forms:
bki ¼ c0
i þ c1i lk þ c2
i vk ð4Þ
where k is the location subindex defined by the lk and mk.
The component of the location-specific coefficient is a
combination of a region-wide (i.e. spatially constant)
coefficient c0i and other coefficients associated with the
coordinates lk (easting) and mk (northing) in a polynomial
equation (see Eq. 4). Therefore, the model incorporates both
spatially constant coefficients and the coefficients that
represent a spatially varying relationship specific to each
location (Roorda et al. 2010). In this research, the expansion
was based on the employment of the coordinates using a
cubic trend. We tested the higher-order polynomial
expansion and the new interaction terms were mostly
insignificant (Fan 1994). The results indicated that a cubic
function was appropriate. The spatially varying coefficients
were expanded in the following way to produce a spatial
drift of a cubic function of coordinates (see Eq. 5).
bki ¼ c0
i þ c1i lk þ c2
i l2k þ c3
i l3k þ c4
i vk þ c5i lkvk þ c6
i l2kvk
�
þc7i l
3kvk þ c8
i v2k þ c9
i lkv2k þ c10
i l2kv2
k þ c11i l3
kv2k þ c12
i v3k
þc13i lkv3
k þ c14i l2
kv3k þ c15
i l3kv3
kÞð5Þ
It is noted that all coordinates have been adjusted to a
one-unit square (see Eqs. 6 and 7). We took the maximum
extent of the coordinates of sample points and divided the
difference of every co-ordinate and the minimum co-
ordinate value in the corresponding axis by this extent
(Paez et al. 2010).
806 Stoch Environ Res Risk Assess (2014) 28:801–816
123
l�i ¼li �min lið Þ
max lð Þ �min lð Þ ð6Þ
v�i ¼vi �min við Þ
max vð Þ �min vð Þ ð7Þ
3 Results
3.1 Non-spatial logistic regression model
The fast economic development in Dongguan has resulted
in dramatic urban expansion and massive loss of agricul-
tural land in the city. We found that the urban area
increased by 1,181 % from 67 km2 in 1988 to 853 km2 in
2006. Farmland and orchard land are two dominating
sources of newly developed urban areas. Between 1988 and
2006, nearly half of the farmland (46.7 %) and one third of
the orchard land (31.6 %) in 1988 were converted into
urban area. This suggests that the urban land development
in Dongguan has caused a substantial loss of agricultural
land and imposed more challenges for environmental sus-
tainability (Yeh and Li 1999).
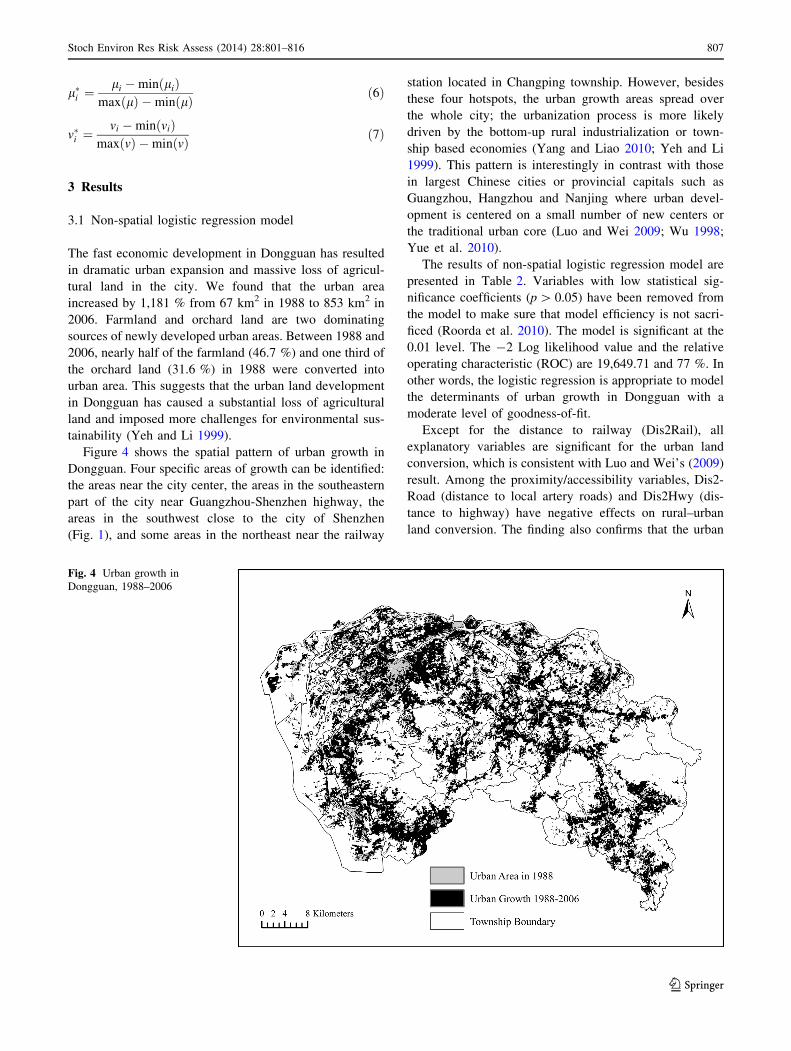
Figure 4 shows the spatial pattern of urban growth in
Dongguan. Four specific areas of growth can be identified:
the areas near the city center, the areas in the southeastern
part of the city near Guangzhou-Shenzhen highway, the
areas in the southwest close to the city of Shenzhen
(Fig. 1), and some areas in the northeast near the railway
station located in Changping township. However, besides
these four hotspots, the urban growth areas spread over
the whole city; the urbanization process is more likely
driven by the bottom-up rural industrialization or town-
ship based economies (Yang and Liao 2010; Yeh and Li
1999). This pattern is interestingly in contrast with those
in largest Chinese cities or provincial capitals such as
Guangzhou, Hangzhou and Nanjing where urban devel-
opment is centered on a small number of new centers or
the traditional urban core (Luo and Wei 2009; Wu 1998;
Yue et al. 2010).
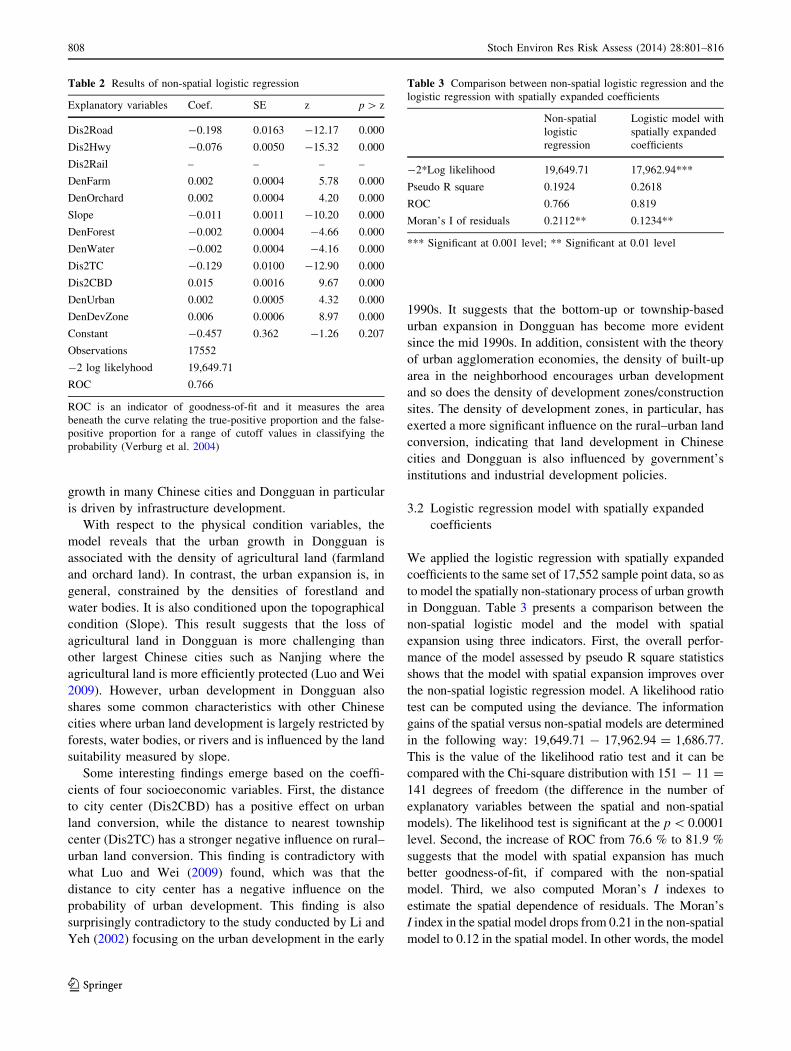
The results of non-spatial logistic regression model are
presented in Table 2. Variables with low statistical sig-
nificance coefficients (p [ 0.05) have been removed from
the model to make sure that model efficiency is not sacri-
ficed (Roorda et al. 2010). The model is significant at the
0.01 level. The -2 Log likelihood value and the relative
operating characteristic (ROC) are 19,649.71 and 77 %. In
other words, the logistic regression is appropriate to model
the determinants of urban growth in Dongguan with a
moderate level of goodness-of-fit.
Except for the distance to railway (Dis2Rail), all
explanatory variables are significant for the urban land
conversion, which is consistent with Luo and Wei’s (2009)
result. Among the proximity/accessibility variables, Dis2-
Road (distance to local artery roads) and Dis2Hwy (dis-
tance to highway) have negative effects on rural–urban
land conversion. The finding also confirms that the urban
Fig. 4 Urban growth in
Dongguan, 1988–2006
Stoch Environ Res Risk Assess (2014) 28:801–816 807
123
growth in many Chinese cities and Dongguan in particular
is driven by infrastructure development.
With respect to the physical condition variables, the
model reveals that the urban growth in Dongguan is
associated with the density of agricultural land (farmland
and orchard land). In contrast, the urban expansion is, in
general, constrained by the densities of forestland and
water bodies. It is also conditioned upon the topographical
condition (Slope). This result suggests that the loss of
agricultural land in Dongguan is more challenging than
other largest Chinese cities such as Nanjing where the
agricultural land is more efficiently protected (Luo and Wei
2009). However, urban development in Dongguan also
shares some common characteristics with other Chinese
cities where urban land development is largely restricted by
forests, water bodies, or rivers and is influenced by the land
suitability measured by slope.
Some interesting findings emerge based on the coeffi-
cients of four socioeconomic variables. First, the distance
to city center (Dis2CBD) has a positive effect on urban
land conversion, while the distance to nearest township
center (Dis2TC) has a stronger negative influence on rural–
urban land conversion. This finding is contradictory with
what Luo and Wei (2009) found, which was that the
distance to city center has a negative influence on the
probability of urban development. This finding is also
surprisingly contradictory to the study conducted by Li and
Yeh (2002) focusing on the urban development in the early
1990s. It suggests that the bottom-up or township-based
urban expansion in Dongguan has become more evident
since the mid 1990s. In addition, consistent with the theory
of urban agglomeration economies, the density of built-up
area in the neighborhood encourages urban development
and so does the density of development zones/construction
sites. The density of development zones, in particular, has
exerted a more significant influence on the rural–urban land
conversion, indicating that land development in Chinese
cities and Dongguan is also influenced by government’s
institutions and industrial development policies.
3.2 Logistic regression model with spatially expanded
coefficients
We applied the logistic regression with spatially expanded
coefficients to the same set of 17,552 sample point data, so as
to model the spatially non-stationary process of urban growth
in Dongguan. Table 3 presents a comparison between the
non-spatial logistic model and the model with spatial
expansion using three indicators. First, the overall perfor-
mance of the model assessed by pseudo R square statistics
shows that the model with spatial expansion improves over
the non-spatial logistic regression model. A likelihood ratio
test can be computed using the deviance. The information
gains of the spatial versus non-spatial models are determined
in the following way: 19,649.71 - 17,962.94 = 1,686.77.
This is the value of the likelihood ratio test and it can be
compared with the Chi-square distribution with 151 - 11 =
141 degrees of freedom (the difference in the number of
explanatory variables between the spatial and non-spatial
models). The likelihood test is significant at the p \ 0.0001
level. Second, the increase of ROC from 76.6 % to 81.9 %
suggests that the model with spatial expansion has much
better goodness-of-fit, if compared with the non-spatial
model. Third, we also computed Moran’s I indexes to
estimate the spatial dependence of residuals. The Moran’s
I index in the spatial model drops from 0.21 in the non-spatial
model to 0.12 in the spatial model. In other words, the model
Table 2 Results of non-spatial logistic regression
Explanatory variables Coef. SE z p [ z
Dis2Road -0.198 0.0163 -12.17 0.000
Dis2Hwy -0.076 0.0050 -15.32 0.000
Dis2Rail – – – –
DenFarm 0.002 0.0004 5.78 0.000
DenOrchard 0.002 0.0004 4.20 0.000
Slope -0.011 0.0011 -10.20 0.000
DenForest -0.002 0.0004 -4.66 0.000
DenWater -0.002 0.0004 -4.16 0.000
Dis2TC -0.129 0.0100 -12.90 0.000
Dis2CBD 0.015 0.0016 9.67 0.000
DenUrban 0.002 0.0005 4.32 0.000
DenDevZone 0.006 0.0006 8.97 0.000
Constant -0.457 0.362 -1.26 0.207
Observations 17552
-2 log likelyhood 19,649.71
ROC 0.766
ROC is an indicator of goodness-of-fit and it measures the area
beneath the curve relating the true-positive proportion and the false-
positive proportion for a range of cutoff values in classifying the
probability (Verburg et al. 2004)
Table 3 Comparison between non-spatial logistic regression and the
logistic regression with spatially expanded coefficients
Non-spatial
logistic
regression
Logistic model with
spatially expanded
coefficients
-2*Log likelihood 19,649.71 17,962.94***
Pseudo R square 0.1924 0.2618
ROC 0.766 0.819
Moran’s I of residuals 0.2112** 0.1234**
*** Significant at 0.001 level; ** Significant at 0.01 level
808 Stoch Environ Res Risk Assess (2014) 28:801–816
123
Ta
ble
4R
esu
lts
of
spat
iall
yex
pan
ded
coef
fici
ents
Co
nst
ant
ll2
l3
mlm
l2m
l3m
m2m2
lm2
l2m2
l3m3
m3l
m3l
2m3
l3
Dis
2H
wy
–-
18
.20
47
.34
-3
0.8
8-
12
.91
16
6.0
6-
35
7.3
82
13
.80
30
.16
-3
24
.53
66
1.7
9-
37
8.9
5-
16
.90
17
8.1
5-
35
7.4
82
00
.65
pv
alu
e–
0.0
00
0.0
01
0.0
04
0.0
00
0.0
00
0.0
00
0.0
04
0.0
00
0.0
00
0.0
02
0.0
11
0.0
04
0.0
01
0.0
05
0.0
28
Dis
2R
ail
-9
.09
53
.06
-9
1.8
74
8.3
15
2.9
6-
30
0.3
65
03
.70
-2
51
.51
-9
5.6
25
40
.76
-8
96
.25
43
1.5
65
4.1
6-
31
0.0
25
16
.03
-2
45
.92
pv
alu
e0
.00
00
.00
00
.00
00
.00
00
.00
00
.00
00
.00
00
.00
00
.00
00
.00
00
.00
00
.00
10
.00
00
.00
00
.00
00
.00
1
Dis
2R
oad
13
.44
-5
0.6
54
2.6
2–
-6
7.2
42
38
.28
-2
05
.90
–1
05
.74
-3
76
.09
35
7.1
9-
22
.24
-5
1.7
11
80
.77
-1
70
.50
–
pv
alu
e0
.00
00
.00
00
.00
0–
0.0
00
0.0
00
0.0
00
–0
.00
00
.00
10
.00
00
.00
00
.00
00
.00
40
.00
5–
Dis
2C
BD
0.1
0–
––
-0
.31
0.2
2–
––
––
––
––
–
pv
alu
e0
.01
3–
––
0.0
01
0.0
36
––
––
––
––
––
Dis
2T
C1
4.5
3-
98
.45
18
3.3
1-
10
1.8
2-
73
.14
50
0.2
6-
92
7.0
15
08
.31
11
5.8
0-
79
7.2
51
,47
1.0
3-
80
2.7
3-
58
.93
40
8.9
3-
75
9.6
74
19
.99
pv
alu
e0
.00
00
.00
00
.00
00
.00
00
.00
00
.00
00
.00
00
.00
00
.00
00
.00
00
.00
00
.00
10
.00
10
.00
00
.00
10
.00
4
Den
Urb
an0
.08
-0
.34
0.2
9–
-0
.39
1.1
3–
-1
.02
0.7
0-
1.8
7–
1.7
5-
0.3
90
.99
–-
0.9
5
pv
alu
e0
.00
00
.00
00
.00
0–
0.0
00
0.0
00
–0
.00
00
.00
00
.00
0–
0.0
01
0.0
00
0.0
01
–0
.01
2
Den
Dev
Zo
ne
–0
.28
-0
.25
–-
0.1
3–
-2
.70
2.9
60
.23
-0
.82
7.6
6-
7.6
3–
–-
3.8
14
.18
pv
alu
e–
0.0
00
0.0
06
–0
.00
0–
0.0
00
0.0
00
0.0
00
0.0
00
0.0
00
0.0
00
––
0.0
00
0.0
01
Den
Far
m0
.08
-0
.29
0.2
4-
0.5
92
.42
-2
.56
0.6
01
.27
-5
.70
7.4
1-
2.8
3-
0.8
13
.89
-5
.68
2.5
8
pv
alu
e0
.00
00
.00
00
.00
00
.00
00
.00
00
.00
00
.02
40
.00
00
.00
00
.00
00
.00
10
.00
00
.00
00
.00
00
.00
0
Den
Fo
rest
-0
.01
––
–0
.07
-0
.40
0.8
0-
0.5
0–
––
–-
0.2
41
.30
-2
.24
1.2
1
pv
alu
e0
.01
20
––
–0
.00
30
0.0
02
00
.00
10
0.0
00
0–
––
–0
.02
10
0.0
22
00
.02
80
0.0
38
0
Den
Orc
har
d0
.04
–-
0.3
70
.36
-0
.30
–2
.57
-2
.56
0.5
7–
-4
.89
4.9
1-
0.3
2–
2.7
8-
2.8
2
pv
alu
e0
.00
0–
0.0
00
0.0
00
0.0
00
–0
.00
00
.00
00
.00
0–
0.0
00
0.0
00
0.0
00
–0
.00
00
.00
0
Den
Wat
er0
.07
-0
.25
0.1
91
.13
1.2
9-
0.5
6-
2.9
62
.42
-6
.37
–9
.68
-4
.91
-0
.85
4.6
4-
7.8
54
.41
pv
alu
e0
.00
10
.00
60
.01
80
.01
90
.00
00
.00
00
.00
00
.00
00
.00
0–
0.0
00
0.0
02
0.0
00
0.0
00
0.0
00
0.0
00
Slo
pe
-0
.82
5.5
8-
9.7
15
.02
4.1
2-
26
.93
44
.02
-2
1.3
4-
5.7
13
4.0
1-
48
.30
19
.41
2.3
0-
11
.14
9.7
3–
pv
alu
e0
.00
00
.00
00
.00
00
.00
00
.00
00
.00
00
.00
00
.00
00
.00
00
.00
00
.00
00
.00
00
.00
80
.00
30
.00
4–
Stoch Environ Res Risk Assess (2014) 28:801–816 809
123
with spatial expansion has remarkably reduced the spatial
autocorrelation of residuals and generated less spatially cor-
related errors (Luo et al. 2008).
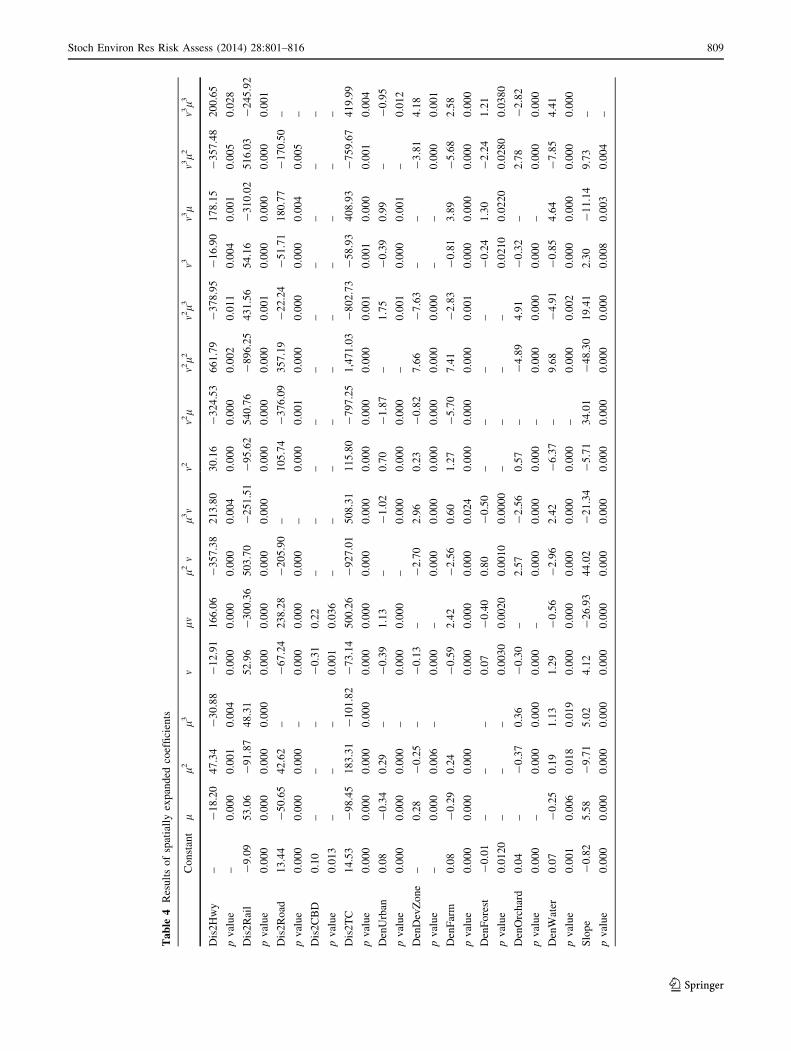
As shown in Table 4, in the spatial expansion model, the
coefficient of each explanatory variable is expanded into a
polynomial function of the coordinates (l, m) and can be
evaluated at various locations to generate spatially varying
coefficients. For example, the coefficient of Dis2Hwy in
the non-spatial logistic model is -0.076 while in the spatial
model, the coefficient is a function of the adjusted coor-
dinates (l, m), taking the following form:
dDis2Hwy ¼� 18:20 � lþ 47:34 � l2 þ �30:88ð Þ � l3
þ �12:91ð Þ � vþ 166:06 � uv
þ �357:38ð Þ � u2vþ 213:80 � u3v
þ 30:16 � v2 þ �324:53ð Þ � v2uþ 661:79 � v2u2
þ �378:95ð Þ � v2u3 þ �16:90ð Þ � v3
þ 178:15 � v3uþ �357:48ð Þ � v3u2
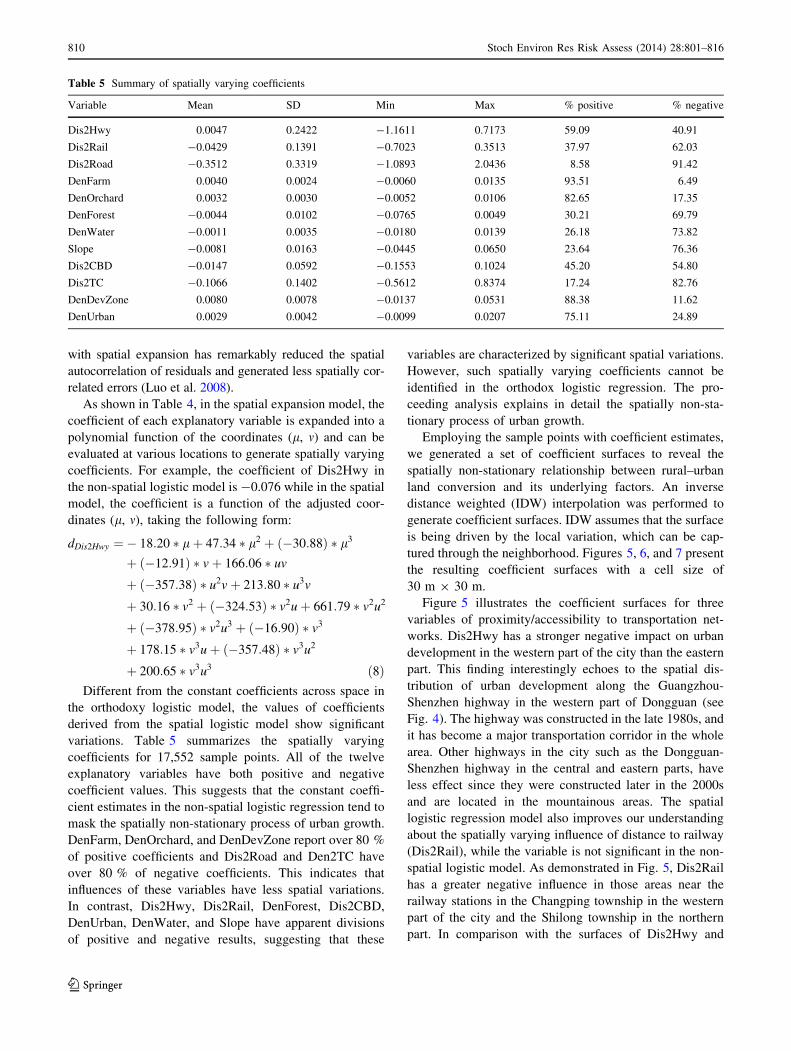
þ 200:65 � v3u3 ð8ÞDifferent from the constant coefficients across space in
the orthodoxy logistic model, the values of coefficients
derived from the spatial logistic model show significant
variations. Table 5 summarizes the spatially varying
coefficients for 17,552 sample points. All of the twelve
explanatory variables have both positive and negative
coefficient values. This suggests that the constant coeffi-
cient estimates in the non-spatial logistic regression tend to
mask the spatially non-stationary process of urban growth.
DenFarm, DenOrchard, and DenDevZone report over 80 %
of positive coefficients and Dis2Road and Den2TC have
over 80 % of negative coefficients. This indicates that
influences of these variables have less spatial variations.
In contrast, Dis2Hwy, Dis2Rail, DenForest, Dis2CBD,
DenUrban, DenWater, and Slope have apparent divisions
of positive and negative results, suggesting that these
variables are characterized by significant spatial variations.
However, such spatially varying coefficients cannot be
identified in the orthodox logistic regression. The pro-
ceeding analysis explains in detail the spatially non-sta-
tionary process of urban growth.
Employing the sample points with coefficient estimates,
we generated a set of coefficient surfaces to reveal the
spatially non-stationary relationship between rural–urban
land conversion and its underlying factors. An inverse
distance weighted (IDW) interpolation was performed to
generate coefficient surfaces. IDW assumes that the surface
is being driven by the local variation, which can be cap-
tured through the neighborhood. Figures 5, 6, and 7 present
the resulting coefficient surfaces with a cell size of
30 m 9 30 m.
Figure 5 illustrates the coefficient surfaces for three
variables of proximity/accessibility to transportation net-
works. Dis2Hwy has a stronger negative impact on urban
development in the western part of the city than the eastern
part. This finding interestingly echoes to the spatial dis-
tribution of urban development along the Guangzhou-
Shenzhen highway in the western part of Dongguan (see
Fig. 4). The highway was constructed in the late 1980s, and
it has become a major transportation corridor in the whole
area. Other highways in the city such as the Dongguan-
Shenzhen highway in the central and eastern parts, have
less effect since they were constructed later in the 2000s
and are located in the mountainous areas. The spatial
logistic regression model also improves our understanding
about the spatially varying influence of distance to railway
(Dis2Rail), while the variable is not significant in the non-
spatial logistic model. As demonstrated in Fig. 5, Dis2Rail
has a greater negative influence in those areas near the
railway stations in the Changping township in the western
part of the city and the Shilong township in the northern
part. In comparison with the surfaces of Dis2Hwy and
Table 5 Summary of spatially varying coefficients
Variable Mean SD Min Max % positive % negative
Dis2Hwy 0.0047 0.2422 -1.1611 0.7173 59.09 40.91
Dis2Rail -0.0429 0.1391 -0.7023 0.3513 37.97 62.03
Dis2Road -0.3512 0.3319 -1.0893 2.0436 8.58 91.42
DenFarm 0.0040 0.0024 -0.0060 0.0135 93.51 6.49
DenOrchard 0.0032 0.0030 -0.0052 0.0106 82.65 17.35
DenForest -0.0044 0.0102 -0.0765 0.0049 30.21 69.79
DenWater -0.0011 0.0035 -0.0180 0.0139 26.18 73.82
Slope -0.0081 0.0163 -0.0445 0.0650 23.64 76.36
Dis2CBD -0.0147 0.0592 -0.1553 0.1024 45.20 54.80
Dis2TC -0.1066 0.1402 -0.5612 0.8374 17.24 82.76
DenDevZone 0.0080 0.0078 -0.0137 0.0531 88.38 11.62
DenUrban 0.0029 0.0042 -0.0099 0.0207 75.11 24.89
810 Stoch Environ Res Risk Assess (2014) 28:801–816
123
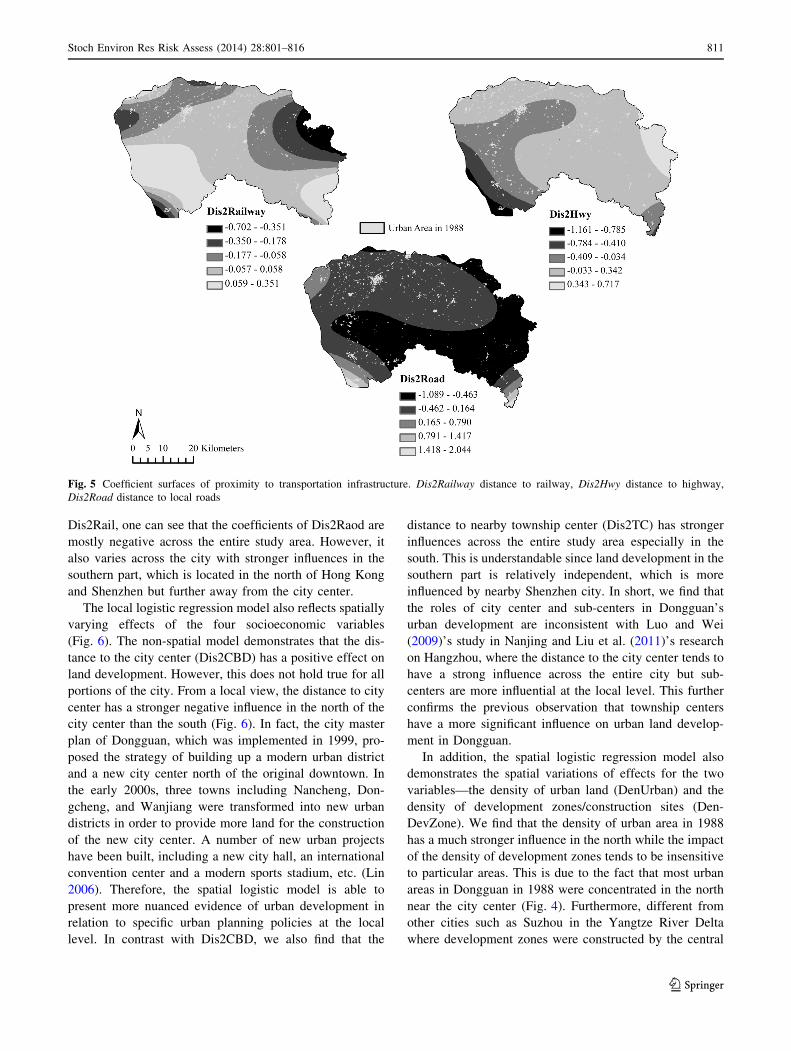
Dis2Rail, one can see that the coefficients of Dis2Raod are
mostly negative across the entire study area. However, it
also varies across the city with stronger influences in the
southern part, which is located in the north of Hong Kong
and Shenzhen but further away from the city center.
The local logistic regression model also reflects spatially
varying effects of the four socioeconomic variables
(Fig. 6). The non-spatial model demonstrates that the dis-
tance to the city center (Dis2CBD) has a positive effect on
land development. However, this does not hold true for all
portions of the city. From a local view, the distance to city
center has a stronger negative influence in the north of the
city center than the south (Fig. 6). In fact, the city master
plan of Dongguan, which was implemented in 1999, pro-
posed the strategy of building up a modern urban district
and a new city center north of the original downtown. In
the early 2000s, three towns including Nancheng, Don-
gcheng, and Wanjiang were transformed into new urban
districts in order to provide more land for the construction
of the new city center. A number of new urban projects
have been built, including a new city hall, an international
convention center and a modern sports stadium, etc. (Lin
2006). Therefore, the spatial logistic model is able to
present more nuanced evidence of urban development in
relation to specific urban planning policies at the local
level. In contrast with Dis2CBD, we also find that the
distance to nearby township center (Dis2TC) has stronger
influences across the entire study area especially in the
south. This is understandable since land development in the
southern part is relatively independent, which is more
influenced by nearby Shenzhen city. In short, we find that
the roles of city center and sub-centers in Dongguan’s
urban development are inconsistent with Luo and Wei
(2009)’s study in Nanjing and Liu et al. (2011)’s research
on Hangzhou, where the distance to the city center tends to
have a strong influence across the entire city but sub-
centers are more influential at the local level. This further
confirms the previous observation that township centers
have a more significant influence on urban land develop-
ment in Dongguan.
In addition, the spatial logistic regression model also
demonstrates the spatial variations of effects for the two
variables—the density of urban land (DenUrban) and the
density of development zones/construction sites (Den-
DevZone). We find that the density of urban area in 1988
has a much stronger influence in the north while the impact
of the density of development zones tends to be insensitive
to particular areas. This is due to the fact that most urban
areas in Dongguan in 1988 were concentrated in the north
near the city center (Fig. 4). Furthermore, different from
other cities such as Suzhou in the Yangtze River Delta
where development zones were constructed by the central
Fig. 5 Coefficient surfaces of proximity to transportation infrastructure. Dis2Railway distance to railway, Dis2Hwy distance to highway,
Dis2Road distance to local roads
Stoch Environ Res Risk Assess (2014) 28:801–816 811
123
and municipality level governments (Wei et al. 2009),
development zones in Dongguan were built mostly by
township and village level governments. As a result, the
spatial distribution of development zones in Dongguan is
more disperse and relatively small in size (Yang 2009),
giving rise to a less apparent spatially varying influence
across the study area.
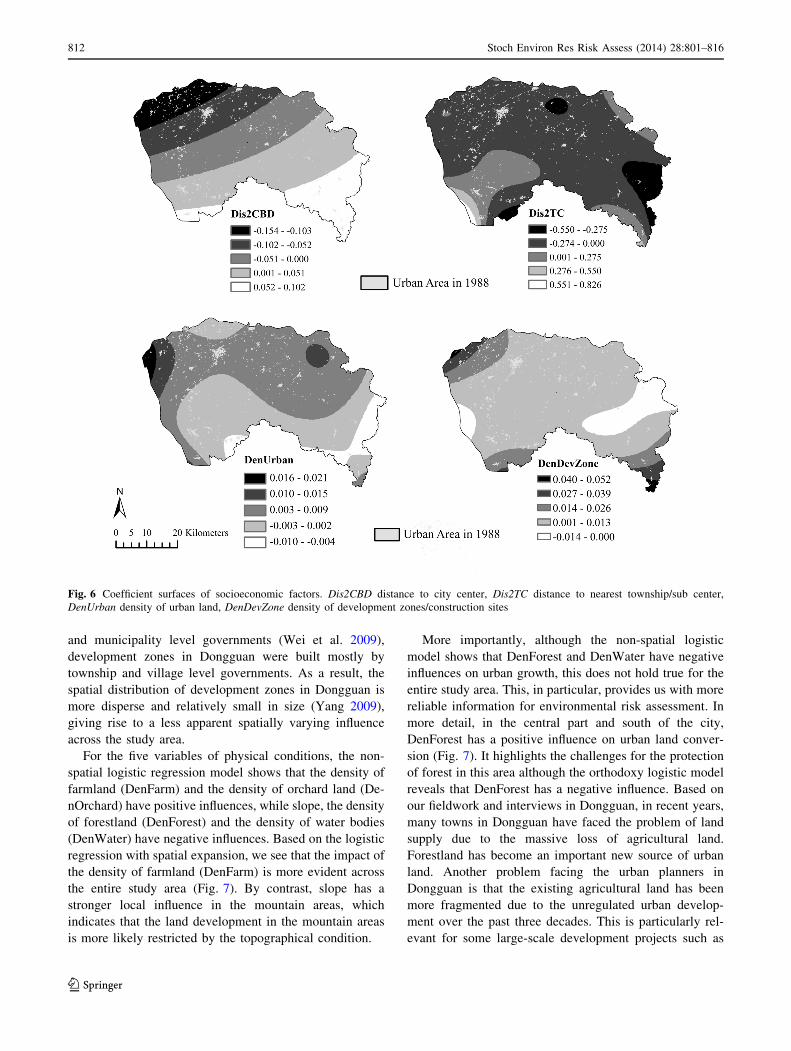
For the five variables of physical conditions, the non-
spatial logistic regression model shows that the density of
farmland (DenFarm) and the density of orchard land (De-
nOrchard) have positive influences, while slope, the density
of forestland (DenForest) and the density of water bodies
(DenWater) have negative influences. Based on the logistic
regression with spatial expansion, we see that the impact of
the density of farmland (DenFarm) is more evident across
the entire study area (Fig. 7). By contrast, slope has a
stronger local influence in the mountain areas, which
indicates that the land development in the mountain areas
is more likely restricted by the topographical condition.
More importantly, although the non-spatial logistic
model shows that DenForest and DenWater have negative
influences on urban growth, this does not hold true for the
entire study area. This, in particular, provides us with more
reliable information for environmental risk assessment. In
more detail, in the central part and south of the city,
DenForest has a positive influence on urban land conver-
sion (Fig. 7). It highlights the challenges for the protection
of forest in this area although the orthodoxy logistic model
reveals that DenForest has a negative influence. Based on
our fieldwork and interviews in Dongguan, in recent years,
many towns in Dongguan have faced the problem of land
supply due to the massive loss of agricultural land.
Forestland has become an important new source of urban
land. Another problem facing the urban planners in
Dongguan is that the existing agricultural land has been
more fragmented due to the unregulated urban develop-
ment over the past three decades. This is particularly rel-
evant for some large-scale development projects such as
Fig. 6 Coefficient surfaces of socioeconomic factors. Dis2CBD distance to city center, Dis2TC distance to nearest township/sub center,
DenUrban density of urban land, DenDevZone density of development zones/construction sites
812 Stoch Environ Res Risk Assess (2014) 28:801–816
123
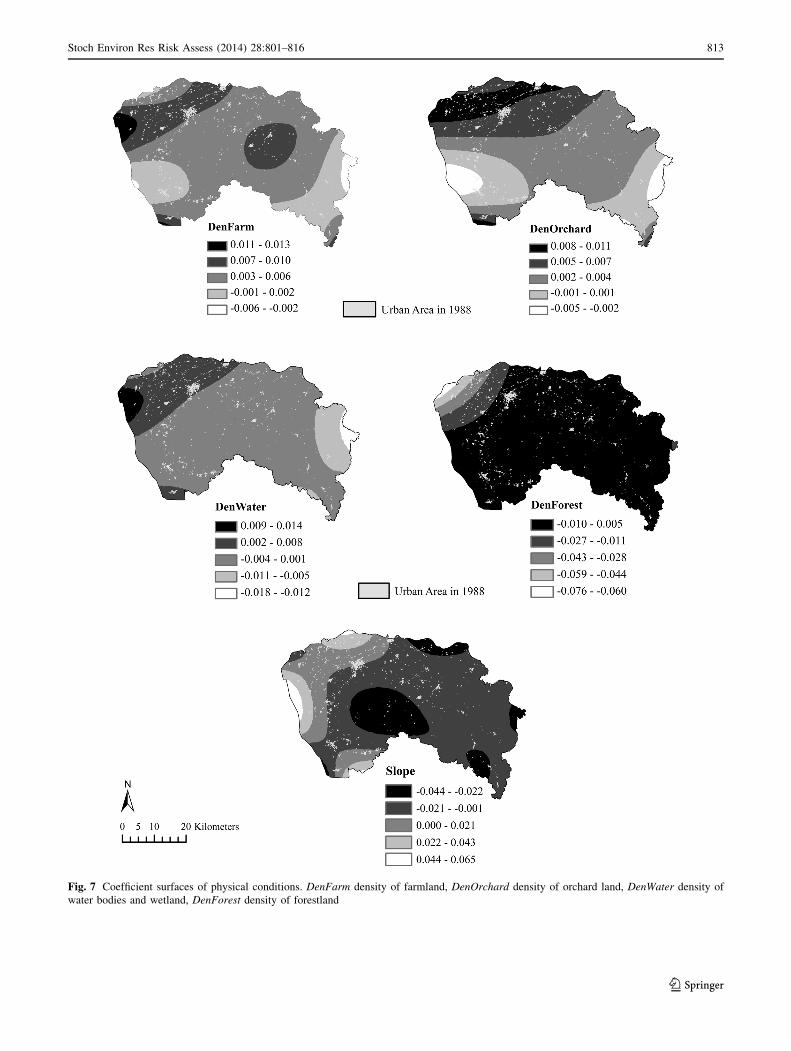
Fig. 7 Coefficient surfaces of physical conditions. DenFarm density of farmland, DenOrchard density of orchard land, DenWater density of
water bodies and wetland, DenForest density of forestland
Stoch Environ Res Risk Assess (2014) 28:801–816 813
123
Songsanhu industrial park in the central part of the city and
the ‘‘ecological industrial park’’ in the northeastern part. In
order to provide sufficient land for these projects, many
forests that are not as fragmented as the existing agricul-
tural land and are more suitable for large-size industrial
parks have been converted into urban areas.
Similarly, as indicated in the non-spatial logistic
model, urban development is constrained by water bodies.
However, drawing upon the spatial logistic model, this
inference is problematic. DenWater only shows a strong
negative impact on the urban growth in areas near the
Dongjian River mainly because the Dongjian River is the
source of drinking water for people living in Hong Kong
and Shenzhen and therefore is more strictly protected
(Hu et al. 2005). In contrast, for rivers and lakes close to
the city center in the north, DenWater has a strong
positive influence on urban growth, indicating water
bodies in these areas are not strictly protected. This
finding is consistent with Hu et al. (2005)’s research on
the spatial pattern of water pollution in Dongguan. They
found that rivers and lakes in the northeastern part of
Dongguan have been encroached and heavily polluted due
to the concentration of polluting industries in nearby
towns such as Macong and Zhongtang (Yang and Liao
2010). In summary, some challenges of environmental
sustainability are more likely masked by the non-spatial
model, while the spatial logistic model is able to provide
an exploratory tool for the purpose of environment risk
assessment, mainly by identifying spatially varying rela-
tionships between urban land development and neighbor-
hood ecological environment.
4 Conclusions
This paper has investigated the spatial patterns of urban
growth and its underlying factors in the city of Dongguan,
China. We have contributed to the research on urban
development in Chinese cities by analyzing the unique
bottom-up township-based urban growth pattern in Dong-
guan. We have found that the city of Dongguan has faced
substantial challenges of environmental sustainability
arising from the loss of agricultural land. Recent years have
witnessed more governmental efforts towards a compact
and sustainable urban development (Lin 2006). However,
as evidenced in this research, the effect of these policies is
very limited.
We also developed a spatial logistic regression model
to explore spatially varying relationships between urban
development and its underlying factors in Dongguan from
1988 to 2006. We have confirmed the importance of the
spatially non-stationary process in determining land use
changes. Furthermore, our model incorporates both
physical and socioeconomic factors in analyzing urban
land expansion, guided by theoretical development in
economic geography and urban economics. The analysis
of results is further supported by the fieldwork and is
associated with the local institutional contexts and urban
development as well as environment protection policies.
This approach, as shown in this research, is of particular
importance for the research on urban development in
China where the urban land development is being hosted
in a transitional economy and thus characterized by
instability, diversity and dynamic spatial variety (Wei
2012).
Using the orthodoxy logistic regression model, we have
demonstrated that distances to local roads and township
centers have the strongest negative effects on rural–urban
land conversion in Dongguan. However, the distance to the
city center has a positive influence. The case study of
Dongguan indicates the bottom-up process of development
where small towns play a significant role. Our study
therefore suggests the complexity of urban development in
different contexts and the diversity of urban growth pat-
terns in Chinese cities.
The logistic model with spatially expanded coefficients
has significantly improved the non-spatial logistic regres-
sion model with better goodness-of-fit. It also reduced the
spatial dependence of residuals. More importantly, the
spatial logistic model allows the coefficients of explanatory
variables to vary across space and clearly highlights the
impact of underlying factors at the local level. On one
hand, we have found that the spatial variation of urban
growth in Dongguan is highly sensitive to urban develop-
ment policies and regional setting. The distance to the city
center has a strong local impact on urban development in
the north of the city where a new city center is being built.
In contrast, the distance to nearby township center is more
influential across the entire study area following the path-
dependent bottom-up urbanization pattern. On the other
hand, we also revealed that the spatial logistic regression
approach not only contributes to the understanding of
urban growth process but also provides an exploratory tool
for assessing environmental risks arising from urban
expansion. For example, in the non-spatial logistic model,
densities of water bodies and forestland have negative
influences on rural–urban land conversion. However,
drawing upon the spatial logistic model, their effects are
contingent upon local conditions and environment protec-
tion policies—in the northwestern and central portions,
more water bodies and forests have danger of being con-
verted into urban land.
Finally, from a technical perspective, spatial expansion,
if compared with other methods such as GWR, provides a
computationally less expensive and more efficient way to
model the spatially varying relationship in the context of
814 Stoch Environ Res Risk Assess (2014) 28:801–816
123
large sample size. This is particularly relevant to some
rapidly industrializing Chinese cities such as Dongguan
where urban development is not compact and urban
expansion is broader in scope. In addition, recent literature
has pointed out the limitation of GWR and the problematic
coefficient surfaces resulting from the routine GWR algo-
rithm (Paez et al. 2011; Wheeler and Tiefelsdorf 2005).
There is a need to further compare GWR and the spatial
expansion model as well as other spatially varying coeffi-
cient models (Waller et al. 2007), which can help us to
learn more about the advantages and disadvantages of
different spatial statistical methods.
Acknowledgements We wish to thank two anonymous reviewers
and thank Dr. Steven Farber at the University of Utah for his valuable
comments and suggestions in spatial statistics. We would also like to
acknowledge the funding of the Lincoln Institute of Land Policy
(CYW010511), the Natural Science Foundation of China (41028001),
and the University of Utah Funding Incentive Seed Grant (51003414).
References
Anselin L (1988) Spatial econometrics: methods and models. Kluwer
Academic Publishers, Dordrecht
Casetti E (1972) Generating models by the expansion method:
applications to geographical research. Geogr Anal 4:81–91
Casetti E (2010) Expansion method, dependency, and multimodeling.
In: Fischer MM, Getis A (eds) Handbook of applied spatial
analysis. Springer, Heidelberg, pp 487–505
Cheng J, Masser I (2003) Modelling urban growth patterns: a
multiscale perspective. Environ Plan A 35:679–704
Ding C, Lichtenberg E (2011) Land and urban economic growth in
China. J Reg Sci 51:299–317
Duncan C, Jones K (2000) Using multilevel models to model
heterogeneity: potential and pitfalls. Geogr Anal 32:279–305
Fan CC (1994) The temporal and spatial dynamics of income and
population growth in Ohio, 1950–1990. Reg Stud 28:241–258
Fotheringham AS, Brunsdon C, Charlton M (2002) Geographically
weighted regression: the analysis of spatially varying relation-
ships. Wiley, Chichester
Gao J, Li S (2011) Detecting spatially non-stationary and scale-
dependent relationships between urban landscape fragmentation
and related factors using Geographically Weighted Regression.
Appl Geogr 31:292–302
Harris P, Brunsdon C, Fotheringham AS (2011) Links, comparisons
and extensions of the geographically weighted regression model
when used as a spatial predictor. Stoch Environ Res Risk Assess
25:123–138
Hu Z, Kuang Y, Wu Z, Liu C, Huang N, Zhu Z, Luo W, Ouyang T
(2005) Environmental quality and its impact on the local
economy: a case study from Dongguan, South China. Int J
Sustain Dev World Ecol 12:291–299
Jacobs J (1969) The economy of cities. Vintage, New York
Krugman P (1991) Increasing returns and economic geography.
J Political Econ 99:483–499
Li X, Yeh AGO (2002) Neural-network-based cellular automata for
simulating multiple land use changes using GIS. Int J Geogr Inf
Sci 16:323–343
Lin GCS (2006) Peri-urbanism in globalizing China: a study of new
urbanism in Dongguan. Eurasian Geogr Econ 47:28–53
Liu Y, Yue W, Fan P (2011) Spatial determinants of urban land
conversion in large Chinese cities: a case of Hangzhou. Environ
Plan B Plan Des 38:706–725
Luo J, Wei YHD (2009) Modeling spatial variations of urban growth
patterns in Chinese cities: the case of Nanjing. Landsc Urban
Plan 91:51–64
Luo J, Yu D, Xin M (2008) Modeling urban growth using GIS and
remote sensing. GIScience Remote Sens 45:426–442
Paez A, Mercado RG, Farber S, Morency C, Roorda M (2010)
Relative accessibility deprivation indicators for urban settings:
definitions and application to food deserts in montreal. Urban
Stud 47:1415–1438
Paez A, Farber S, Wheeler D (2011) A simulation-based study of
geographically weighted regression as a method for investi-
gating spatially varying relationships. Environ Plan A 43:
2992–3010
Page J, Davis B, Areddy J (2012) China turns predominantly urban.
Wall Str J. http://online.wsj.com/article/SB10001424052970
203735304577166652002366514.html. Accessed 24 Aug 2012
Roorda MJ, Paez A, Morency C, Mercado R, Farber S (2010) Trip
generation of vulnerable populations in three Canadian cities: a
spatial ordered probit approach. Transportation 37:525–548
Seto KC, Kaufmann RK (2003) Modeling the drivers of urban land
use change in the Pearl River Delta, China: integrating remote
sensing with socioeconomic data. Land Econ 79:106–121
Sit VFS, Yang C (1997) Foreign-investment-induced exo-urbanisa-
tion in the Pearl River Delta, China. Urban Stud 34:647–677
Su S, Li D, Yu X, Zhang Z, Zhang Q, Xiao R, Zhi J, Wu J (2011)
Assessing land ecological security in Shanghai (China) based
on catastrophe theory. Stoch Env Res Risk Assess 25:
737–746
Su S, Xiao R, Zhang Y (2012) Multi-scale analysis of spatially
varying relationships between agricultural landscape patterns
and urbanization using geographically weighted regression. Appl
Geogr 32:360–375
Sui DZ, Zeng H (2001) Modeling the dynamics of landscape structure
in Asia’s emerging desakota regions: a case study in Shenzhen.
Landsc Urban Plan 53:37–52
Verburg PH, Ritsema van Eck JR, de Nijs TCM, Dijst MJ, Schot P
(2004) Determinants of land-use change patterns in the Nether-
lands. Environ Plan B Plan Des 31:125–150
Waller L, Zhu L, Gotway C, Gorman D, Gruenewald P (2007)
Quantifying geographic variations in associations between
alcohol distribution and violence: a comparison of geographi-
cally weighted regression and spatially varying coefficient
models. Stoch Env Res Risk Assess 21:573–588
Wei YHD (2005) Planning Chinese cities: the limits of transitional
institutions. Urban Geogr 26:200–221
Wei YHD (2012) Restructuring for growth in urban China: transi-
tional institutions, urban development, and spatial transforma-
tion. Habitat Int 36:396–405
Wei YHD, Gu C (2010) Industrial development and spatial structure
in Changzhou City, China: the restructuring of the Sunan model.
Urban Geogr 31:321–347
Wei YHD, Lu Y, Chen W (2009) Globalizing regional development
in Sunan, China: does Suzhou Industrial Park fit a Neo-
Marshallian district model? Reg Stud 43:409–427
Wheeler DC (2009) Simultaneous coefficient penalization and model
selection in geographically weighted regression: the geograph-
ically weighted lasso. Environ Plan A 41:722–742
Wheeler D, Tiefelsdorf M (2005) Multicollinearity and correlation
among local regression coefficients in geographically weighted
regression. J Geogr Syst 7:161–187
Wu F (1998) Polycentric urban development and land-use change in a
transitional economy: the case of Guangzhou. Environ Plan A
30:1077–1100
Stoch Environ Res Risk Assess (2014) 28:801–816 815
123

Xie Y, Batty M, Zhao K (2007) Simulating emergent urban form
using agent-based modeling: Desakota in the Suzhou-Wuxian
Region in China. Ann Assoc Am Geogr 97:477–495
Yang C (2009) Strategic coupling of regional development in global
production networks: redistribution of Taiwanese personal
computer investment from the Pearl River Delta to the Yangtze
River Delta, China. Reg Stud 43:385–407
Yang C, Liao H (2010) Industrial agglomeration of Hong Kong and
Taiwanese manufacturing investment in China: a town-level
analysis in Dongguan. Ann Reg Sci 45:487–517
Yang DYR, Wang HK (2008) Dilemmas of local governance under
the development zone fever in China: a case study of the Suzhou
Region. Urban Stud 45:1037–1054
Yeh AGO, Li X (1998) Sustainable land development model for rapid
growth areas using GIS. Int J Geogr Inf Sci 12:169–189
Yeh AGO, Li X (1999) Economic development and agricultural land
loss in the Pearl River Delta, China. Habitat Int 23:373–390
Yu XJ, Ng CN (2007) Spatial and temporal dynamics of urban sprawl
along two urban-rural transects: a case study of Guangzhou,
China. Landsc Urban Plan 79:96–109
Yue W, Liu Y, Fan P (2010) Polycentric urban development: the case
of Hangzhou. Environ Plan A 42:563–577
816 Stoch Environ Res Risk Assess (2014) 28:801–816
123