Embed Size (px)
Citation preview

Modeling the Fate and Transport of Nutrients Using DSM2: Calibration/Validation Report Executive Summary November 2011
Prepared For: State Water Contractors State and Federal Contractors Water Agency Sacramento, CA 95814
Contact: Paul Hutton Senior Engineer Metropolitan Water District 916-650-2620
Prepared By: Contact: Resource Management Associates Marianne Guerin 4171 Suisun Valley Road, Suite J 707-864-2950 Fairfield, CA 94534

i
Table of Contents Table of Contents .......................................................................................................................... i
Figures .......................................................................................................................................... ii
Tables ........................................................................................................................................... ii
1. Executive Summary ............................................................................................................. 1
1.1 Summary – Objectives and Proposed Applications (Section 2) ...................................... 1
1.2 Summary – Background, Model Configuration, and Nutrient Model Conceptualization (Sections 3 through 5) ................................................................................................................. 1
1.3 Summary – Data (Sections 6 - 8) ..................................................................................... 3
1.4 Boundary Conditions (Section 9) ..................................................................................... 4
1.5 Summary – Calibration and Validation (Sections 10 – 12) ............................................. 5
Calibration Process .................................................................................................................. 5
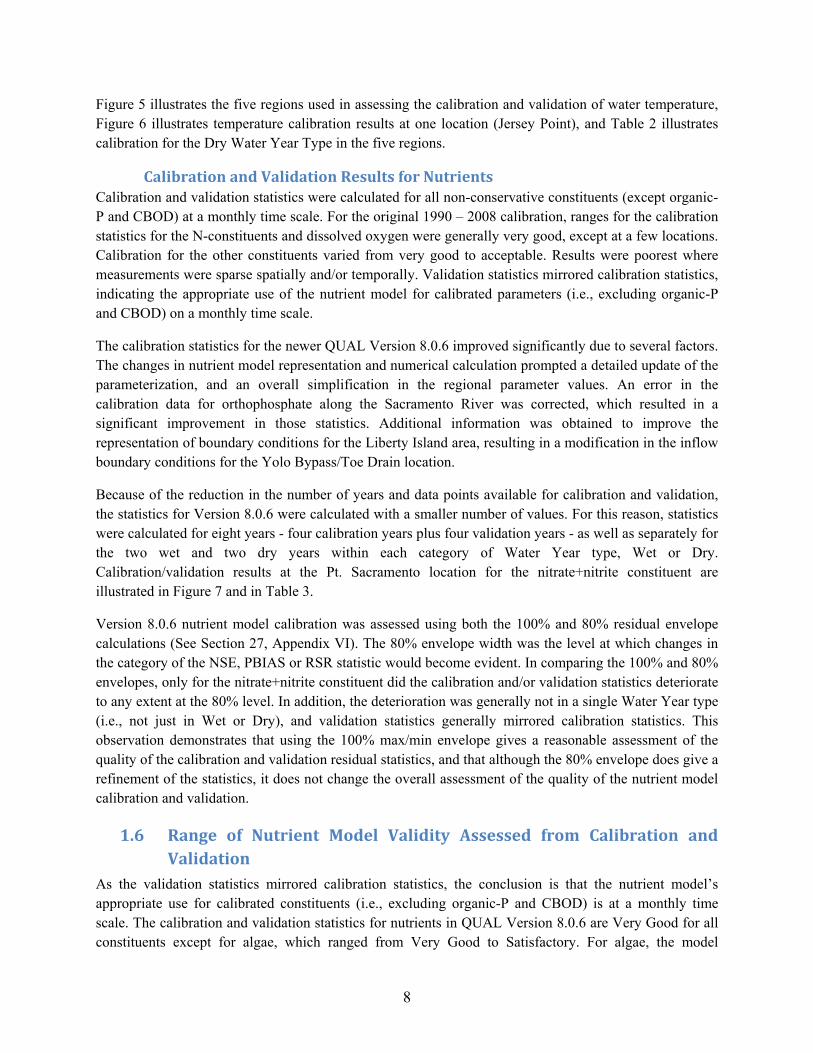
Calibration and Validation results for Water Temperature ..................................................... 7
Calibration and Validation Results for Nutrients .................................................................... 8
1.6 Range of Nutrient Model Validity Assessed from Calibration and Validation ............... 8
1.7 Summary – Simulation Results (Sections 16 to 18) ......................................................... 9
1.8 Summary – Monitoring Program (Section 21) ................................................................. 9
1.9 Summary – Model Adequacy and Suggested Improvements (Section 19) .................... 10
2. References .......................................................................................................................... 21

ii
Figures Figure 1 Channels (red), reservoirs (blue numbers), and nodes (black) in the DSM2 model grid........................................................................................................................................................ 12
Figure 2 Approximate location of the model inflow boundaries and the stage boundary is at Martinez (blue stars). Export locations are indicated by red stars. ............................................... 13
Figure 3 Approximate locations of effluent boundary conditions for waste water treatment plants considered in this report. ............................................................................................................... 14
Figure 4 The interactions among the main constituents, and external influences (an adaptation from original DWR references). Water temperature (blue region) influences reaction rates, denoted by arrows. ........................................................................................................................ 15
Figure 5 Five regions were used in the calibration and validation of water temperature. ............ 17
Figure 6 Hourly calibration results for water temperature at RSAN018, Jersey Point. Blue line is hourly data, red line is the modeled hourly result averaged from 15-minute model output. ........ 18
Figure 7 NO3 + NO2 calibration results at Pt. Sacramento – data points are located at blue symbols, monthly modeled maximum and minimum are denoted by solid red lines. .................. 20
Tables Table 1 Categories used to rate the quality of the nutrient calibration/validation. ....................... 16
Table 2 Comparison of Calibration and Validation statistics for Dry Water Years. .................... 19
Table 3 Model calibration/validation statistics at Pt. Sacramento for NO3 + NO2 for the entire modeled period (“All”); Calibration for Dry Years (2001, 2002) and Wet Years (2000, 2003); and Validation for Dry Years (2007, 2008) and Wet Years (2005, 2006). ................................... 20

iii
PREFACE
During the course of the revision of this document, the model grid (representing the Delta) for DSM2 was revised substantially, requiring a “mini-recalibration” of the hydrodynamics module, HYDRO, after the initial DRAFT calibration documentation was written. The DSM2-QUAL nutrient model formulation and numerical solution were also revised several times, with the changes incorporated in the current Version 8.0.6 of DSM2. As a consequence of these revisions, the QUAL nutrient model was recalibrated several times after the initial DRAFT documentation was written, creating a quandary in how to organize the final document.
To this end, three separate documents were created: (1) a stand-alone expanded Executive Summary document; (2) a Main document, containing the expanded Executive Summary, the entire text written for the project, and a detailed Appendix that includes calibration information only for the latest revision of the QUAL nutrient model (Version 8.0.6); and, (3) a separate document containing only DSM2 Version 6 nutrient model calibration information, comprised of a series of appendices, Appendix II – Appendix V, containing the details of the Version 6 nutrient model calibration which are no longer relevant as this version has been superseded.
This document is the first set of documentation, which contains solely the expanded Executive Summary section. The expanded Executive Summary was created to summarize the available documentation. Both old and new calibration information have been included in the Main document – it should be clear from context which calibration is being referred to. The first Appendix, Appendix I, was expanded to include details on the most recent recalibration of the QUAL nutrient model. The Main document contains all of documentation except for the details of the calibration of the old version of DSM2, Version 6. The details of this previous calibration, Version 6, of the DSM2 nutrient model are contained in the third set of documentation.
QUAL’s conceptual model for nutrient dynamics is a mixed model, with greater detail in some aspects of nutrient dynamics than in others. On the plus side, this results in a relatively simple nutrient model and, except for one constituent, there is generally at least some data available for setting or estimating boundary conditions. On the negative side, there are processes that would have been valuable to include, such as more complete representation of sediment interactions.
However, the ultimate determination of the application of the model to the Delta is data availability – this limits the useful extent of model complexity. In other words, if there is no data with which to either check the models results or to develop parameters for specific reactions, then that reaction will not increase the accuracy of the overall model results.

1
1. Executive Summary
Resource Management Associates (RMA) was contracted by the State Water Contractors (SWC) and the State and Federal Contractors Water Agency (SFCWA) to model nutrient dynamics in the Sacramento-San Joaquin Delta (Delta) using the Delta Simulation Model-2 (DSM2) water quality module, DSM2-QUAL (QUAL). Because of the length and complexity of the documentation for this project, the Executive Summary section has been expanded to include an extensive summary of information contained in major subsections of the Main document. This document only contains the Executive Summary section - the Main document containing detailed results is available on request. The text of this Executive Summary includes information on the sections of the Main document where supporting detail is found.
1.1 Summary – Objectives and Proposed Applications (Section 2) The main goals of the project were to: calibrate and validate QUAL for temperature and nutrients for the period 1990 – 20081; develop a prioritized monitoring program to fill data gaps and improve the understanding of nutrient dynamics in the Delta; and, critique QUAL’s existing nutrient and temperature model formulation and suggest improvements. As the intended applications spurring development of the QUAL nutrient model focus on ammonia dynamics along the Sacramento River, this document also has a focus on ammonia including hypothetical model scenarios and sensitivity analyses focusing on nitrogen-containing constituents (see: Discussion Section 20). However, model calibration and data-gathering efforts did not focus on any particular constituent, and each constituent represented in the conceptual model was calibrated to the extent possible given the constraints in data availability and project budget.
At present, the potential applications of the nutrient model are focused on inter-comparison of hypothetical scenarios developed with monthly boundary conditions. The source of hydrodynamic model input for these scenarios will most likely be from CalSim II. The CalSim model was developed by the California Department of Water Resources (DWR) to simulate California State Water Project (SWP) and Federal Central Valley Project (CVP) operations in planning studies that simulate operation of California’s reservoirs and water delivery system. Most projects using CalSim II Planning models use a comparative analysis approach2. In this approach, the model is run twice, once with conditions representing a baseline and another time with some specific changes to assess the change in modeled outcome due to the given change in model input configuration. The assumption is that, while the model might not produce results reflecting these changes with absolute certainty, it nevertheless produces a reasonably reliable estimate of the relative change in outcome.
1.2 Summary – Background, Model Configuration, and Nutrient Model Conceptualization (Sections 3 through 5)
The implementation of the DSM2 modules HYDRO and QUAL for hydrodynamics and water quality, respectively, discussed in this report extends the standard configuration of the DSM2 “Historical Model”,
1 The Version 8 implementation runs from 2000 -2008 – the superseded Version 6 implementation runs 1990 -2008. 22003, http://sacramentoriverportal.org/modeling/CALSIM-Review.pdf

2
which simulates historical conditions in the Delta from 1990 – 20083, by including effluent flows and constituent concentrations from most of the wastewater treatment plants (WWTPs) with outfalls in DSM2’s model domain in the Delta (see: Figure 1, Figure 2, Figure 3). Although the volume of these effluent inflows is small in comparison with other inflows to the Delta (for example ~3 % by volume on the Sacramento River near Threemile Slough), they are important sources of the nutrients modeled in QUAL. This project builds on the previous calibration and applications of the QUAL nutrient model by the Delta Modeling Section (DMS) of the Department of Water Resources (DWR), which focused on dissolved oxygen (DO) in the San Joaquin River for the period 1996 - 2000 (Rajbhandari, 2001). Using this DWR nutrient model calibration as a basis, this project’s effort for DSM2 Version 6 extended the calibration to the entire Delta and the time frame to the period covered by the DSM2 Historical model at the initiation of the project, 1990 - 2008.
The QUAL nutrient model has equations for nine non-conservative constituents – ammonia, nitrate, nitrite, organic-N (organic-Nitrogen), orthophosphate, organic-P (organic-Phosphorus), DO, algae (a conceptual simplification for total phytoplankton biomass), and carbonaceous biochemical oxygen demand (CBOD) – salinity modeled as a conservative constituent (EC, electrical conductivity), and temperature (see: Figure 4). Calculations from the DSM2 hydrodynamic model of the Delta, DSM2-HYDRO supply the velocity field used to model the transport of these constituents. Note that the hydrodynamics in HYDRO were calibrated prior to their use in this project, and there is an explicit assumption that HYDRO’s calibration is sufficient for project purposes. In addition, the calibration of QUAL’s salinity model is also viewed as sufficient. In both cases, the calibration was accomplished under the supervision of DWR’s DMS.
During the term of this project, a new version (Version 8) of the DSM2 suite of modules was introduced. Although it did not officially replace the prior Version 6 implementation of DSM2 until late in 2009, the Version 8 implementation was also used in this project. One major change in DSM2 Version 8 was the introduction of a new “Liberty Island” reservoir in the model grid to simulate the permanent flooding of Liberty Island in 1998.
The Main report includes documentation on the calibration of the two versions of the DSM2 nutrient model used for this project – DSM2 Version 6 calibration spans the years 1990 - 2008 and the DSM2 Version 8.0.6 calibration spans the years 2000 – 2008. In Version 8.0.6, the most recent version as of the date of this document, QUAL includes several modifications that improved or corrected the formulation of nutrient dynamics in QUAL - these are discussed at the DWR-DMS website4. Calibration statistics and reference plots are included in Appendices II - V for Version 6 of QUAL and at the end of Appendix I for Version 8.0.6.
Because of the focus on ammonia in the applications discussed in this project, terminology needs to be set to avoid confusion - the following terminology will be used: the term “ammonia” will refer to the combined amount of the two chemical species in solution NH3 (aq) and NH4
+. Where important for clarity, or where there is a need to discuss the distinct species, the terms ammonia or unionized ammonia
3 Historical modeling available for the original contract ended in 2008. The Historical model is updated regularly so there are more recent versions of the flow and salinity simulations available. 4http://baydeltaoffice.water.ca.gov/modeling/deltamodeling/models/dsm2/dsm2.cfm

3
are used to refer to NH3 (aq) and the terms “ammonium” or “ammonium ion” are used to refer to NH4+.
The reason for this choice of terminology is discussed in Section 5.1.
1.3 Summary – Data (Sections 6 8) This project required the collection and synthesis of the large quantity of data needed to set the nutrient model boundary conditions (river, effluent, and stage) over the 19 year time span, 1990 – 2008, and to calibrate and validate the model calculations for each of the constituents conceptualized in QUAL to drive nutrient dynamics in the Delta. In addition, data was required to set meteorological boundary conditions. Salinity and flow boundary conditions at the river inflow boundaries and water elevation data for the stage boundary at Martinez were developed for the Historical model by DWR’s DMS but supplemented where necessary for this project.
The description of the data acquired for the project, the methodology for transforming the data into boundary conditions suitable for model application, and summaries of data usage thus comprise a substantial portion of the documentation, as the quality of the model calibration and the potential types of application are determined in large part by the availability and quality of the data. The adequacy of the conceptual model to simulate nutrients dynamics is a function both of the model itself and of the data available to inform and constrain model boundaries and the parameters in the underlying equations.
Data gathered from source agencies and individuals for setting boundary conditions and for use in calibration and validation were evaluated for quality and accuracy and suspicious data were removed. Constituent concentration data were originally reported in a variety of measurement units depending on data source, so reported concentrations were converted to units of mg L-1, the measurement unit used in QUAL, in terms of the molecular weight the atom characterizing the chemical species (e.g., mg L-1 PO4-P).
In some locations in the Delta, measurements were available from more than one agency. For example, at Rio Vista on the Sacramento River, the USGS and state agencies collected grab sample measurements for chlorophyll-a. Although the samples were not collected on the same date, comparisons in trends and magnitudes of data between agency datasets gave confidence in the quality of the data. Gaps in data used for developing time series of boundary conditions were filled where necessary, but gaps were not filled in time series of data used for calibration and validation. Specific methodologies for assessing the quality of the data and filling data gaps are covered in Sections 7.4 and 25.4.
Most effluent data only covered recent years (after 2000), while spatial and temporal coverage for in-Delta nutrient measurements was greatest 1990 – 1995. Flow data and constituent concentrations were not always available for individual WWTPs, and none of the WWTPs had effluent concentration data available for the modeled constituents over the entire modeled time span (1990 – 2008). Several methods were used to fill in missing effluent data, for example, by setting constituent concentrations at regulatory limits set by the Central Valley Regional Water Quality Control Board.
Most in-Delta nutrient data came from grab samples collected irregularly at monthly or, at most, bi-monthly intervals, while regular time series of water temperature and meteorological data was available hourly to daily. Water temperature and meteorological data had good spatial and temporal coverage over much of the modeled time span, 1990 - 2008. Dissolved oxygen data was also available as regular time series at the hourly to daily time scale at a number of locations.

4
Measurement data gathered by the Environmental Monitoring Program (EMP) was used preferentially over other data sources at similar locations because: long time series of data were available from EMP at or near most boundaries and at several in-Delta locations; the EMP data was consistent with measurements from other data sources such as the USGS; the data was gathered by a single organization using well-documented methodologies; and, ancillary data documentation (metadata) was readily available.
1.4 Boundary Conditions (Section 9) The values used to set boundary conditions were dictated by the availability and quality of data. Except for effluent boundaries, boundary conditions for HYDRO and concentrations of salinity (as EC) in QUAL were accepted as presented in DWR’s Historical model.
Meteorological data is set at hourly intervals in the model. Meteorological data is applied globally in QUAL, although it was evident that two regions (at a minimum) would be preferable. No single location had a complete set of boundary conditions for the entire modeled period, 1990 – 2008. Therefore, meteorological boundary condition data was compiled from several locations, although the Stockton and Brentwood locations supplied most of the data.
A model sensitivity analysis on meteorological boundary conditions showed that modeled water temperature was most sensitive to the value set for wind speed, so considerable effort was taken to set wind boundary conditions.
Daily or hourly time series of water temperature data were available through the IEP and CDEC data bases for many of the modeled years at or near the boundaries for the Sacramento and San Joaquin Rivers, and at Martinez. Boundary inflow temperatures prepared for the Sacramento boundary were used at the Mokelumne and Cosumnes River boundaries, while the San Joaquin River temperature was used both at Vernalis and at the Calaveras River boundary. The Yolo Bypass boundary was synthesized.
Where possible, the nutrient model boundaries, with the exception of DO, were set using DWR’s EMP data which was available at approximately monthly to bi-monthly intervals. Data were processed to yield a regular time series, typically monthly or daily. Although the main model boundaries did not necessarily coincide with data measurement locations, approximations were made using nearby downstream measurements to account for the dynamics that occurred between the nearby points and the model boundary. The approximation was generally made by applying a constant factor (less than 1.0) to the available concentration time series, and possibly also a time shift, to obtain calibration at the downstream measurement location. The main model boundaries generally had enough data to produce time series for the constituents with the highest concentrations. DO measurements were available at or near the main flow boundaries as hourly or daily time series.
Data were gathered from a variety of sources for setting boundary conditions at WWTP effluent locations and processed to yield daily, bi-weekly or monthly values to use as boundary conditions. When data gaps appeared in time series data, either average values or data synthesized by Water Year type were used to fill the gaps.

5
1.5 Summary – Calibration and Validation (Sections 10 – 12)
Calibration Process In this document we assume the simple definition that calibration is the process of adjusting a set of model parameters so that model agreement with respect to a set of experimental data is maximized (Trucano et al., 2005). Similarly, validation is the quantification of the predictive ability of the model through comparison with a set of experimental data (Trucano et al., 2005). These definitions assume that a set of criteria for assessing the goodness-of-fit of the model to the data has been selected. For our purposes, the general methodology discussed in Moriasi (2007) was employed for this assessment. A set of statistics were calculated separately for calibration and validation for all available data of sufficient quality - detailed statistics are discussed in the text and documented more thoroughly in the Appendices.
The statistics used to assess model calibration and validation at each Delta location were calculated from model residuals – a residual is the difference between a data value and the corresponding calculated model value (i.e., data - model). Several statistics were calculated, but only three statistical measures were used as measures of the quality of the calibration and validation – Nash-Sutcliffe Efficiency (NSE), RMSE-Standard deviation Ratio (RSR), and Percent Bias (PBIAS). These three statistics give an overall view of the quality of the calibration (Moriasi et al., 2007).
At each location where calibration data was available, model statistics were calculated and ranked categorically as Very Good, Good, Satisfactory or Unsatisfactory using ranges for model calibration performance ratings for the NSE, RSR and PBIAS statistics (Moriasi et.al., 2007). Water temperature and nutrient calibration were considered separately, and the methodology for calculating calibration statistics was different due to the large difference in the availability of data both for setting boundary conditions and for calibration and validation. In order to ascertain that model calibration and validation were sufficient for both low and high inflow conditions, statistics were calculated by Water Year (WY) Type.
Subsequent to the original calibration for this project (for the modeled period 1990 – 2008), several changes were made to DSM2. As mentioned above, in DSM2 Version 8 a new “Liberty Island” reservoir was added to the model grid to simulate the permanent flooding of Liberty Island in 1998. The Version 8 Historical model used in this document is simulated using the time frame from 2000 to 2008. In QUAL Version 8 (and modifications to Version 8), DWR-DMS: (1) corrected an error in the formulation for the ammonia constituent; (2) the numerical formulation for calculating source terms was changed; and, (3) the formulation for mixing in dead end sloughs and other locations with zero upstream flow was improved. These changes in QUAL were significant enough to require recalibration of nutrient model parameters - water temperature was not recalibrated.
The original calibration process (for Version 6) began by calibrating the temperature model which is independent of the nutrients as it relies only on meteorological data, water temperature boundary conditions and model output from HYDRO in its calculations. Meteorological data is currently applied globally in QUAL, however, the calibration process identified that a minimum of two meteorological regions are suggested in order to improve water temperature calibration and validation statistics. Implementing this capability would require changes in the computer code used in QUAL calculations.
Once the temperature model was considered calibrated and the predictive value of the model was assessed by validation statistics, the nutrient model calibration process began by subdividing the model domain

6
into five regions with broadly similar physical characteristics and/or that are influenced by similar sources of water and nutrients. Open water areas, conceptualized as fully-mixed reservoirs in DSM2, were considered as a group. Calibration proceeded iteratively, by changing parameter values regionally and then comparing model results with calibration data. In the latter stages of iteration, calibration statistics were calculated and some parameters changes were implemented locally within regions and within reservoirs. Once parameter changes became insignificant in terms of changes to calibration statistics, validation statistics were calculated.
Due to budgetary limitations, the parameter range for sediment oxygen demand (SOD) originally used by Rajbhandari (2000, 2001) in calibrating the QUAL nutrient model for DO along the San Joaquin River was accepted as given although the parameter range was outside standard literature ranges. Using this approach, only minor parameter changes were needed along the San Joaquin River, which significantly reduced the effort needed to calibrate the entire Delta, i.e., the model domain for this project.
Several regions in the model domain were lacking nutrient data. At river boundaries where there were few or no measurements, boundary conditions were set at reasonable levels to obtain calibration at downstream locations or by synthesizing time series using the available data at these locations. There was no data available within the Delta for calibrating the organic-P constituent and only a few data points along the San Joaquin River for calibrating CBOD. Therefore, neither organic-P nor CBOD are considered calibrated.
Calibration was obtained by varying the minimal numbers of sensitive parameters needed to obtain an acceptable level of accuracy, as assessed by the set of calibration statistics. A sensitive parameter in the context of this report is one where +/- 10% changes in the parameter produced measureable changes in concentration of at least one constituent. Due to time and budgetary constraints, although parameter sensitivity was assessed iteratively at the early stages of nutrient model calibration, the results were not formally documented.
Numerical statistics were calculated for the residuals for each constituent at each available location. Categorical ranges for NSE, PBIAS and RSR – Very Good, Good, Satisfactory and Unsatisfactory - were modified from ranges discussed in Moriasi (2007) and used to assess the quality of the calibration and predictive value of the validation. In order to ascertain that model calibration and validation were sufficient for both low and high inflow conditions, calibration and validation were considered separately by Water Year (WY) Type.
Water temperature statistics were assessed hourly on an annual basis using five hydrological Water Year types from critically dry to wet, and splitting the Delta into five regions in which to asses the statistics (statistics were also calculated at each location within each region). Nutrient statistics were also assessed annually. For the original 1990 – 2008 calibration of QUAL Version 6, calibration and validation statistics were assessed using the five Water Year types, while the subsequent Version 8.0.6 statistics were assessed by grouping Water Years into dry and wet year types due to the reduced quantity of data available for calculations.
Both graphical and statistical model evaluation techniques were used in the analysis of calibration and validation results. Different techniques and strategies were used for temperature calibration and validation than for the nutrient model, as the data availability was very different between the two. In either case –

7
nutrients or water temperature – calibration was carried out “by hand”, as funding was not sufficient to employ software to automate the calibration.
The combined effects of nutrient data variability between agencies and sparse measurement intervals, generally monthly, meant that some measure of uncertainty needed to be included in assessing the quality of model calibration and validation. For example, the monthly nutrient boundary conditions and in-Delta measurements were not all collected at time intervals to allow the direct comparison between a model calculation and a data value at a calibration location made during that month. As a consequence, there was a mismatch between the timing of the boundary condition and the timing of the downstream data. The variability between measurement data sets from different agencies indicated that daily fluctuations, tidal influences and extreme events could influence the measurement.
To capture this variability for nutrient model calibration, an “envelope” of model values was used to incorporate these different sources of uncertainty (see Sections 11.3 and 12.5.3). The maximum and minimum monthly values of 15 minute model output were calculated to create the upper and lower bounds of the envelope, respectively. At a given location, if the calibration data fell within that max/min envelope, then the residual was calculated as zero. Values falling outside of the envelope were calculated as residuals using the either the maximum of the envelope (data higher than maximum value) or the minimum value of the envelope (data less than the minimum value) for that month. In a refinement of this methodology, the width of the envelope was reduced in (down to 95%, 90%, 80% and 75% of the original envelope width) for comparison using the Version 8.0.6 calibration for the years 2000 - 2008.
Ranges for model calibration performance ratings for the NSE, RSR and PBIAS statistics under monthly time steps are given in (Moriasi et al. 2007). Following those general guide lines, a water temperature calibration is viewed as “Very Good” for the NSE statistic if NSE is greater than 0.75. Similarly, a PBIAS value less than +/-(10 – 25)% (depending on category such as streamflow, sediment or N,P constituent) and a RSR value less than 0.50 are rated “Very Good”.
Statistical ranges were modified for the nutrient model calibration and validation - they are shown in Table 1. The PBIAS ranges are specific to N- and P-nutrients, but the ranges for RSR and NSE are not constituent-specific in the general performance ratings presented in Moriasi (2007) and thus would be quite strict if applied to constituent calibration/validation statistics. To accommodate this observation somewhat, the NSE range for “Satisfactory” was extended to all positive values in Table 1. The range for RSR was not altered, so can be considered very strict when applied to nutrient model calibration and validation.
Calibration and Validation results for Water Temperature Evaluation of the three statistics - NSE, RSR and PBIAS - indicates that the water temperature model calibration is generally ranked Very Good when considered for the Delta as a whole, although the quality differs by region and location within each of the five regions. Modeled water temperature in the south Delta was generally biased low in the summer months, while modeled water temperature along the Sacramento River was consistent with measurement data. Validation statistics for water temperature are consistent with the use of the model on a daily to hourly time scale.
8
Figure 5 illustrates the five regions used in assessing the calibration and validation of water temperature, Figure 6 illustrates temperature calibration results at one location (Jersey Point), and Table 2 illustrates calibration for the Dry Water Year Type in the five regions.
Calibration and Validation Results for Nutrients Calibration and validation statistics were calculated for all non-conservative constituents (except organic-P and CBOD) at a monthly time scale. For the original 1990 – 2008 calibration, ranges for the calibration statistics for the N-constituents and dissolved oxygen were generally very good, except at a few locations. Calibration for the other constituents varied from very good to acceptable. Results were poorest where measurements were sparse spatially and/or temporally. Validation statistics mirrored calibration statistics, indicating the appropriate use of the nutrient model for calibrated parameters (i.e., excluding organic-P and CBOD) on a monthly time scale.
The calibration statistics for the newer QUAL Version 8.0.6 improved significantly due to several factors. The changes in nutrient model representation and numerical calculation prompted a detailed update of the parameterization, and an overall simplification in the regional parameter values. An error in the calibration data for orthophosphate along the Sacramento River was corrected, which resulted in a significant improvement in those statistics. Additional information was obtained to improve the representation of boundary conditions for the Liberty Island area, resulting in a modification in the inflow boundary conditions for the Yolo Bypass/Toe Drain location.
Because of the reduction in the number of years and data points available for calibration and validation, the statistics for Version 8.0.6 were calculated with a smaller number of values. For this reason, statistics were calculated for eight years - four calibration years plus four validation years - as well as separately for the two wet and two dry years within each category of Water Year type, Wet or Dry. Calibration/validation results at the Pt. Sacramento location for the nitrate+nitrite constituent are illustrated in Figure 7 and in Table 3.
Version 8.0.6 nutrient model calibration was assessed using both the 100% and 80% residual envelope calculations (See Section 27, Appendix VI). The 80% envelope width was the level at which changes in the category of the NSE, PBIAS or RSR statistic would become evident. In comparing the 100% and 80% envelopes, only for the nitrate+nitrite constituent did the calibration and/or validation statistics deteriorate to any extent at the 80% level. In addition, the deterioration was generally not in a single Water Year type (i.e., not just in Wet or Dry), and validation statistics generally mirrored calibration statistics. This observation demonstrates that using the 100% max/min envelope gives a reasonable assessment of the quality of the calibration and validation residual statistics, and that although the 80% envelope does give a refinement of the statistics, it does not change the overall assessment of the quality of the nutrient model calibration and validation.
1.6 Range of Nutrient Model Validity Assessed from Calibration and Validation
As the validation statistics mirrored calibration statistics, the conclusion is that the nutrient model’s appropriate use for calibrated constituents (i.e., excluding organic-P and CBOD) is at a monthly time scale. The calibration and validation statistics for nutrients in QUAL Version 8.0.6 are Very Good for all constituents except for algae, which ranged from Very Good to Satisfactory. For algae, the model

9
generally missed peak values in the Delta during algal blooms, which is not surprising given the monthly time scale of boundary conditions.
The nutrient model in DSM2-QUAL has a simple conceptual formulation that proved sufficient for the task of modeling the entire Delta with output averaged on a monthly basis using data collected for this project. This claim is supported with goodness-of-fit assessed by the calibration statistics, and with the predictive ability of the model affirmed by the validation statistics (Larsen, 1997; Gilroy and McCuen, 2011; Friedel, 2006; Schoups et al., 2008).
1.7 Summary – Simulation Results (Sections 16 to 18) The inclusion of new flow data available 2004 - 2008 at the Lisbon Toe Drain had a noticeable influence on nutrient dynamics and on volumetric contributions around Rio Vista and at downstream locations. Inclusion of a flooded Liberty Island in the DSM2 grid generally resulted in increased algal biomass at downstream locations and decreased concentrations of N-constituents.
Several scenarios were developed to test model sensitivity to changes (increases or decreases) in the concentration of N-constituents – changes to DICU, changes to Sacramento or San Joaquin boundary, and Sac Regional or Stockton WWTP. These scenarios generally changed the concentration of all of the N-constituents by +/- 20%. In addition, a scenario was defined that changed Sac Regional’s wastewater treatment process to nitrification. The sensitivity results test the response of the model to changes in the suite of N-constituents and are presented as percent difference from Base scenario, i.e., the Historical model.
Generally, increases and decreases in N-constituent concentrations were mirrored in percent change in monthly concentrations - i.e., increases and decreases were generally of the same magnitude within 1 – 2 %, the only difference being the difference in sign. As the N-constituents were all varied at once, it is difficult to separate out specific effects. Downstream of the Sacramento and San Joaquin boundaries, nitrification was evident in the change in nitrite concentration as that N-constituent wasn’t varied. In general, increasing N-constituents resulted in increased algal biomass, while decreasing N-constituents resulted in a decrease in algal biomass.
The scenario developed to test the downstream consequences for Delta nutrient dynamics of a change to a nitrification wastewater treatment process at Sacramento Regional WWTP presented a complicated picture of the dynamics resulting from the change in the effluent boundary. As expected, there is a large decrease in ammonia – there is also a substantial increase in nitrate concentrations at all downstream locations, although this happens mainly in the winter months. Many of the detailed changes for other constituents can be linked to the decrease in ammonia in the effluent – for example, algal growth decreased as there was less ammonia available for algal growth.
1.8 Summary – Monitoring Program (Section 21) Although the currently available data was sufficient to develop a nutrient model focusing on ammonia dynamics, as demonstrated by the calibration and validation statistics, the existing monitoring programs should be improved to improve the spatial and temporal resolution of the calibration and, particularly with respect to organic-P and CBOD, to improve confidence in the calibration. The model constituent organic-P is not measured and carbonaceous biochemical oxygen demand (CBOD) was only measured

10
historically in a few locations along the San Joaquin R. Some regions of the model do not have any coverage, and some areas have marginal coverage. The Yolo/Cache Slough area and portions of the eastern Delta need regular measurement locations as there are currently none. Suisun Marsh and the central Delta need additional measurement locations, as most of the data that is currently available ends in 1995.
The measurement time frame for the monitoring program will dictate the accuracy of the modeled constituents, so measurements need to be taken at a time scale commensurate with the quality of the desired results. Ancillary measurements should be taken along with the main constituents at infrequent intervals. For example, measurements to distinguish between dominant algal species and bacteria would help clarify the nutrient dynamics, and would inform the setting of model parameters QUAL. Finally, sediments should be sampled to help analyze possible contributions to nutrient dynamics from resident algae or macrophytes and the potential for sediment to release and/or sequester orthophosphate, ammonia, nitrite and nitrate.
1.9 Summary – Model Adequacy and Suggested Improvements (Section 19)
Several improvements are suggested for the conceptual model in QUAL. To improve calibration of water temperature, meteorological inputs need to be set on a regional basis to allow for variations across the model domain – this option is not currently available as meteorology is set globally. One improvement in the model that would help clarify nutrient dynamics for ammonia is the inclusion of a refined level of state variables at the base of the food web – for example, additional algal species and more than one species of bacteria – would increase the ability to capture the consumption and production of N-constituents at the expense of additional data gathering requirements. However, an improved formulation and additional data acquisition would address the central questions of this study on the role of ammonia in nutrient dynamics, and if high concentrations are suppressing algal growth.
The model formulation proved inadequate to capture the effect of clams (Corbula and Corbicula). There are several possible approaches for improving the conceptual model to capture their effects on the food web, although these changes would require substantial revision to the computer code. The most difficult area to improve in the model is the treatment of organic materials, where any change would require a major overhaul of the conceptual model and the computer code. Refining the model sufficiently to attain a set of state variables that each observe a mass balance criterion and that can describe both the water column, pelagic and benthic interactions is an ideal goal, but would require a rewrite of the entire model.
One of the great strengths of the water temperature and nutrient formulations in QUAL is their simplicity. Because there are invariably constituent concentrations missing at boundaries and within the model domain in nutrient models, as was the case in the Delta over this long time frame, it was still possible to produce a satisfactorily calibrated model. In addition, the lack of regular time series of measurements was not insurmountable – model calibration was generally good at a monthly time scale despite having some locations and times without sufficient data.
Increasing the complexity of the model might increase its ability to model a specific situation, but the increase in the number of required parameters will necessarily result in greater uncertainty in the model results unless accompanied by a supporting data framework. The ability to forecast Delta conditions could
11
decline due to the greater level of uncertainty. The strategy adopted for the QUAL nutrient model calibration - minimizing the reaction rates that are varied by selecting the most sensitive parameters - generally will result in a model with better predictive power as it avoids over-fitting which reduces predictive ability of the calibrated model (Larsen, 1997; Gilroy and McCuen, 2011; Friedel, 2006; Schoups et al., 2008; Fischer et al., 2009; Leangruxa et al., 2004).

12
Figure 1 Channels (red), reservoirs (blue numbers), and nodes (black) in the DSM2 model grid.
1.
4.
3.
5.
2.
1. Franks Tract2. Bethel island3. Mildred Island4. Discovery Bay5. Clifton Court Forebay

13
Figure 2 Approximate location of the model inflow boundaries and the stage boundary is at Martinez (blue stars). Export locations are indicated by red stars.

14
Figure 3 Approximate locations of effluent boundary conditions for waste water treatment plants considered in this report.
Martinez &Tesoro
Refineries
Fairfield-Suisun
Valero
Woodland &Davis
(not included)
Sacramento
Lodi
Stockton
Manteca
Tracy
MountainHouse
DiscoveryBay
DeltaDiablo
CCCSD
EffluentBoundary Conditions
Locations approximate

15
Figure 4 The interactions among the main constituents, and external influences (an adaptation from original DWR references). Water temperature (blue region) influences reaction rates, denoted by arrows.
Atmosphere ‐ Exchange Heat and O2,
Pressure Influences DO Saturation in WaterWater –Dep
th In
flue
nces Sed
imen
t NH3an
d O2Dynam
ics, Algal Settling
Sediment –Supplies Dissolved‐P, NH3 to Water
Receives Algae, CBOD, Organic‐N; Uses O2
Chlorophyll‐a (Algae)
Organic‐N
NH3
NO2
NO3
CBOD
Organic‐P
Dissolved‐P
DissolvedOxygen
Growth+Photosyn
Benthic Source, Demand
Mortality
OxidationSettling
Bacterial Decay
Respiration

16
Table 1 Categories used to rate the quality of the nutrient calibration/validation.
Performance Rating RSR NSE PBIAS (%)
Very Good 0.00 ≤ RSR ≤ 0.50 0.75 < NSE ≤ 1.00 PBIAS < +/- 25
Good 0.50 < RSR ≤ 0.60 0.65 < NSE ≤ 0.75 +/- 25 ≤ PBIAS < +/- 40
Satisfactory 0.60 < RSR ≤ 0.70 0.00 ≤ NSE ≤ 0.65 +/- 40 ≤ PBIAS < +/- 70
Unsatisfactory RSR > 0.7 NSE < 0.0 PBIAS ≥ +/- 70

17
Figure 5 Five regions were used in the calibration and validation of water temperature.
S. Delta Region
Yolo/Cache
Temperature Regions
Suisun Marsh
San Joaquin
Sacramento

18
Figure 6 Hourly calibration results for water temperature at RSAN018, Jersey Point. Blue line is hourly data, red line is the modeled hourly result averaged from 15-minute model output.
2005 2006 2007 2008
Tem
p (
C)
5
10
15
20
25
Jersey Pt. Hourly Temp. Data Jersey Pt. Model Hourly Avg. Temp

19
Table 2 Comparison of Calibration and Validation statistics for Dry Water Years.
CalibrationDry Mean_Residual StDev_Residual NSE_stat MSE_stat RMSE_stat PBIAS_stat RSR_stat Mean_data StDev_data
SJRAverage 0.32 1.04 0.96 1.58 1.17 1.84 0.22 16.67 5.17
Max 1.43 1.45 0.97 4.13 2.03 8.10 0.34 17.64 5.97
Min ‐0.24 0.80 0.94 0.64 0.80 ‐1.45 0.16 16.33 4.62
SACAverage ‐0.01 0.83 0.97 0.78 0.87 ‐0.07 0.17 16.18 5.02
Max 0.42 1.07 0.98 1.17 1.08 2.58 0.22 16.37 5.41
Min ‐0.41 0.66 0.96 0.54 0.74 ‐2.61 0.14 15.84 4.63
S DeltaAverage 1.07 1.31 0.95 2.89 1.69 6.14 0.29 17.48 5.82
Max 1.28 1.34 0.95 3.42 1.85 7.27 0.32 17.56 5.83
Min 0.87 1.27 0.95 2.37 1.54 5.00 0.26 17.39 5.81
Cache SlValue ‐0.55 1.22 0.95 1.80 1.34 ‐3.46 0.25 15.98 5.42
Suisun MarshValue 0.15 1.04 0.92 1.10 1.05 1.14 0.28 13.26 3.78
ValidationDry Mean_Residual StDev_Residual NSE_stat MSE_stat RMSE_stat PBIAS_stat RSR_stat Mean_data StDev_data
SJRAverage 0.53 1.13 0.95 1.91 1.34 2.97 0.26 17.22 5.11
Max 1.25 1.59 0.98 3.30 1.82 6.90 0.31 18.11 5.94
Min ‐0.24 0.79 0.92 0.63 0.79 ‐1.45 0.15 16.45 4.28
SACAverage ‐0.11 0.85 0.89 1.23 1.03 ‐0.60 0.31 15.80 4.55
Max 1.19 1.30 0.99 3.84 1.96 9.45 1.59 17.68 5.54
Min ‐1.77 0.46 ‐0.05 0.24 0.49 ‐12.79 0.09 9.29 0.71
S DeltaAverage 0.61 1.19 0.95 2.02 1.40 3.42 0.26 17.61 5.48
Max 1.12 1.27 0.96 2.82 1.68 6.32 0.30 18.01 5.85
Min ‐0.06 1.09 0.94 1.35 1.16 ‐0.33 0.21 16.74 5.27
Cache SlValue ‐0.59 1.38 0.91 2.33 1.52 ‐3.58 0.31 16.54 4.87
Suisun Marsh ‐0.14 1.28 0.92 1.70 1.29 ‐0.86 0.28 16.37 4.59
Value

20
Figure 7 NO3 + NO2 calibration results at Pt. Sacramento – data points are located at blue symbols, monthly modeled maximum and minimum are denoted by solid red lines.
Table 3 Model calibration/validation statistics at Pt. Sacramento for NO3 + NO2 for the entire modeled period (“All”); Calibration for Dry Years (2001, 2002) and Wet Years (2000, 2003); and Validation for Dry Years (2007, 2008) and Wet Years (2005, 2006).
NSE PBIAS Bias RSRALL VG VG Overestimate VG
Dry WY Calibration VG VG Overestimate VGWet WY Calibration VG VG Underestimate VGDry WY Validation G VG Overestimate SWet WY Validation VG VG Underestimate VG

21
2. References
Firiedel, M.J. 2008. Predictive streamflow uncertainty in relation to calibration-constraint information, and model bias. International J. of River Basin Management. Volume 4:2, 109 – 123.
Fischer, C. S. Kralisch, P. Krause, M. Fink, W.-A. Flugel. 2009. Calibration of hydrologic model parameters with the JAMS framework. (Conference Proceedings) MODSIM Congress. Cairns, Australia.
Gilory, K.L. R.H. McCuren. 2011 The effect of hydrologic model development and calibration complexity on prediction accuracy. Int. J. Hydrology Science and Technology. Vol.1, No.’s 1 / 2.
Larsen, T. 1997. Some remarks on the calibration and validation of numerical water quality models. (Conference Proceedings) First International Conference on Measuring and Modeling Environmental Pollution. Madrid, Spain.
Leangruxa, P., K-J. Hesse, R. Mayerle. 2004. Calibration of a water quality model for the nutrient distribution in the Meldorf Bight, Germany. (Conference Proceedings) Coastal Engineering 2004.
Moriasi, D.N., J.G. Arnold, M.W. Van Liew, R.L. Bingner, R.D. Harmel, and T.L. Vieth. 2007. Model evaluation guidelines for systematic quantification of accuracy in watershed simulations. Transactions of the ASABE. Vol. 50(3).
Rajbhandari, H. 2001. California Department of Water Resources: 2001 Annual Progress Report, Chap 6: Dissolved Oxygen and Temperature Modeling Using DSM2.
Rajbhandari, H. 2000. California Department of Water Resources: 2000 Annual Progress Report, Chap 9: Dissolved Oxygen Modeling Using DSM2-QUAL.
Schoups, G., N.C. van der Giesen, H.H.G. Savneijie.2008. Model complexity control for hydrologic prediction. Water Res. Res. Vol. 44
Trucano, T.G., L.P. Swiler, T. Igusa, W.L. Oberkampf, M. Pilch. 2005. Calibration, validation and sensitivity analysis: What’s what. Reliability Engr. & Sys. Safety. Vol. 91: 1331-1357.