Embed Size (px)
Citation preview
Madrid
May 2017

CONSTANCIA REGISTRAL DEL TRIBUNAL DEL ACTO DE LA DEFENSA DE TESIS DOCTORAL
TÍTULO: Modeling Tools for Planning and Operation of DERs and their Impact in Microgrids and Centralized Resources. AUTOR: Francisco María Martín Martínez
DIRECTOR: Prof. Dr. Álvaro Sánchez Miralles y
Prof. Dr. Michel Rivier Abbad
TUTOR-PONENTE:
DEPARTAMENTO: Instituto de investigación Tecnológica (IIT) FACULTAD O ESCUELA: Escuela Técnica Superior de Ingeniería (ICAI) Miembros del tribunal Calificador:
PRESIDENTE: Firma:
VOCAL: Firma:
VOCAL: Firma:
VOCAL: Firma:
SECRETARIO: Firma:
Fecha de lectura:
Calificación


To all the people that
have supported,
support
and will support
me


This dissertation represents the end of a stage in my life. I hope that in the next steps, I will enjoy as much as the experience lived here during this four years. During this period that I have spent working on this thesis, I have grown up as a person and professional thanks to the people who have been with me during this, sometimes long, way.
First, I would like to thank Álvaro Sánchez Miralles and Michel Rivier Abbad, my supervisors for their great advices and support. With your guidance, I have become a PhD. You could always count on me for whatever you may need.
In addition, I would want to express my gratitude to the Institute for Research in Technology (IIT) as institution where I have been for six years and its group of talented people. I would recommend IIT to other students and professionals anywhere I will be.
I would like to give special thanks to my peers at the Intelligent Systems Area (ASI) and some other people that wants to belong to our area with whom I have shared so many moments solving matlab and gams codes after lunch and who have been essential to make this period easier. In particular, I would like to mention Jaime, Miguel, Santiago, Antonio, Ignacio, Rodrigo, Peyman, José, Christian, Salvador, Carles and Guillermo.
I am also grateful to all the people at the Electrical, Electronics and Telecommunication Engineering and Naval Architecture Department (DITEN) in Savona for having embraced me so warmly during my three-month stay and to the friends I made there for making me feel like at home.
Last but not least, I could not finish this acknowledgment without thanking my parents that have made this possible.
I am absolutely convinced that I have missed out many other people who would have deserved being cited. To all of you, wherever you are, thank you, gracie y gracias.

Modeling Tools for Planning and Operation of DERs and their Impact in Microgrids and Centralized Resources. ix
ABSTRACT.............................................................................................................................................XVII
RESUMEN .............................................................................................................................................. XIX
1. INTRODUCTION .................................................................................................................................. 21
1.1 Current trends and motivation .......................................................................................................... 21 1.2 Thesis objectives and methodology ................................................................................................... 24 1.3 Dissertation outline ............................................................................................................................ 26
2. GENERAL REVIEW OF THE MICROGRID CONCEPT................................................................................ 29
2.1 Introduction ....................................................................................................................................... 29 2.2 Structure and Architecture of a MG ................................................................................................... 31 2.3 Physical Layer ..................................................................................................................................... 33 2.4 Communication Layer ........................................................................................................................ 37 2.5 Intelligence Layer ............................................................................................................................... 42
2.5.1 Main Characteristics of MGs: ..................................................................................................... 42 2.5.2 Architectures .............................................................................................................................. 43 2.5.3 Optimal planning of distributed resources and operation in grid connected mode .................. 44 2.5.4 Optimal isolated operation ........................................................................................................ 44 2.5.5 Demand Response ...................................................................................................................... 45 2.5.6 Stability Control .......................................................................................................................... 46 2.5.7 Aggregation ................................................................................................................................ 48
2.5.7.1 EV fleets .............................................................................................................................................. 48 2.5.7.2 VPP ...................................................................................................................................................... 48
2.6 Business Models Layer ....................................................................................................................... 49 2.7 Microgrids in the world ...................................................................................................................... 53 2.8 Critical analysis on Microgrids ............................................................................................................ 53 2.9 Conclusion .......................................................................................................................................... 55
3. BUILDING: INVESTMENT, OPERATION AND REAL TIME MANAGEMENT OF DERS TO MEET THERMAL AND ELECTRICITY CONSUMPTION NEEDS .................................................................................................... 59
3.1 Introduction ....................................................................................................................................... 60 3.2 Modeling DERs’ deployment in building considering electrical and thermal requirements without
thermal inertias ............................................................................................................................................. 62 3.2.1 Model Structure ......................................................................................................................... 63 3.2.2 Mathematical formulation ......................................................................................................... 63 3.2.3 Analyzing the DERs’ behavior throughout the optimization of a real Microgrid ....................... 70
3.3 Modeling buildings’ heating behavior ................................................................................................ 76 3.3.1 Model Description ...................................................................................................................... 77 3.3.2 Mathematical formulation ......................................................................................................... 78 3.3.3 Thermal parameters – a model to estimate them ..................................................................... 80 3.3.4 Fitting parameters in buildings and sensitivity analysis ............................................................. 81 3.3.5 Analyzing advantages of including the heating model to optimize energy consumption of a
building ..................................................................................................................................................... 85 3.4 Real Time Operation model ............................................................................................................... 91 3.5 Conclusion .......................................................................................................................................... 93
4. PLANNING AND OPERATION OF ISOLATED MICROGRIDS .................................................................... 95
x Francisco Martín Martínez
4.1 Introduction ........................................................................................................................................ 96 4.2 Isolated Microgrid .............................................................................................................................. 98
4.2.1 Model Description ...................................................................................................................... 98 4.2.2 Market Equilibrium and Single-Level expansion models .......................................................... 103 4.2.3 Mathematical formulation for isolated Microgrids .................................................................. 104
4.3 Analyzing the effect of the conjectural parameter in a small MG .................................................... 106 4.4 Analyzing the operation in a real isolated Microgrid ....................................................................... 114 4.5 Conclusion ........................................................................................................................................ 117
5. INTEGRATION OF DERS IN POWER SYSTEMS. .................................................................................... 119
5.1 Introduction ...................................................................................................................................... 120 5.2 Factors considered in the model. ..................................................................................................... 124 5.3 Modeling the Power System ............................................................................................................ 126
5.3.1 Model Description and explanation of the model. ................................................................... 127 5.3.2 Mathematical formulation........................................................................................................ 131
5.4 Application of the model for analyzing technology impacts in the electric Spanish system. ........... 137 5.5 Conclusion ........................................................................................................................................ 146
6. CONCLUSIONS, CONTRIBUTIONS AND FUTURE WORK ...................................................................... 149
6.1 Summary ........................................................................................................................................... 149 6.2 Conclusions ....................................................................................................................................... 152 6.3 Original Contributions ...................................................................................................................... 155 6.4 Future Work ..................................................................................................................................... 156
A. APPENDIX: MICROGRIDS TESTBEDS ............................................................................................. 159
B. APPENDIX: FITTING TEMPERATURE PARAMETERS ....................................................................... 163
2.1 First stage: Select the initial parameters values ............................................................................... 163 2.2 Second stage: Select the initial parameters values .......................................................................... 164
C. APPENDIX: KKT CONDITIONS FOR ISOLATED GRIDS ..................................................................... 166
REFERENCES ......................................................................................................................................... 169
Modeling Tools for Planning and Operation of DERs and their Impact in Microgrids and Centralized Resources. xi
Figure 1.1 Thesis parts ........................................................................................................................................ 25
Figure 1.2 Parts in which the dissetation is divided ........................................................................................... 27
Figure 2.1: Distribution Network with the Microgrid Model .............................................................................. 30
Figure 2.2: Vision of the MG by CERTS [6] .......................................................................................................... 31
Figure 2.3: Vision of the MG by the MICROGRID Project [11] ............................................................................ 31
Figure 2.4: Physical structure of the smart electric power grids ....................................................................... 32
Figure 2.5: Communication Area Networks in the Microgrids concept ............................................................. 38
Figure 2.7: Control levels [95–98] ...................................................................................................................... 47
Figure 2.8: Differences between VPP and MG [77] ............................................................................................ 49
Figure 2.9: Options for business models ............................................................................................................ 50
Figure 3.1 Base optimization model ................................................................................................................... 63
Figure 3.2 SPM in Savona Campus, given by the author of [144] ...................................................................... 71
Figure 3.3 Data monitored by the SCADA of the SPM, adapted from [172] ...................................................... 72
Figure 3.4 Representative profiles of the Savona Campus thermal and electrical demands ............................. 72
Figure 3.5 Electrical operational profiles for current capacities installed in the Campus (Op (CS) scenario) .... 74
Figure 3.6 Shares of thermal and electrical energy production for the Op(CS) scenario ................................... 75
Figure 3.7 Optimal DER capacities to install in the scenarios of the grid-connected mode case ....................... 75
Figure 3.8 Annual operating costs including maintenance for the scenarios of the grid-connected mode case ............................................................................................................................................................................ 76
Figure 3.9 Model with temperature inertias ...................................................................................................... 77
Figure 3.10 Equivalent electric circuit to represent indoor temperature behavior ........................................... 78
Figure 3.11 Fitting temperature parameters algorithm ..................................................................................... 80
Figure 3.12 Original Data .................................................................................................................................... 81
Figure 3.13: Comfort data from original data set and its components .............................................................. 81
Figure 3.14: Profiles of temperature .................................................................................................................. 82
Figure 3.15 Fitting temperature ......................................................................................................................... 82
Figure 3.16 Fitting consumption ......................................................................................................................... 83
Figure 3.17 Fitting reference temperatures ....................................................................................................... 83
Figure 3.18 Variation in cost and energy consumption regarding thermal parameters .................................... 84
Figure 3.19 Consumption profiles regarding tau. ............................................................................................... 84
Figure 3.20 Results using temperature references ............................................................................................ 85
Figure 3.21 Consumption profiles of the seventh day for different scenarios ................................................... 90
Figure 3.22 Real-time operation diagram .......................................................................................................... 92
Figure 3.23: Heating parameter equivalences ................................................................................................... 94
Figure 4.1: Operation schemes of MGs divided in physical elements, management systems and business actors ................................................................................................................................................................ 100
Figure 4.2 Market flow between agents .......................................................................................................... 101
Figure 4.3 Inputs and outputs of the optimization problem ............................................................................ 103
Figure 4.4: Single-level investment equilibrium representation ...................................................................... 103
xii Francisco Martín Martínez
Figure 4.5: Average outdoor temperatures in Madrid obtained from [233] .................................................... 106
Figure 4.6: Normalized winter electric profiles applied for months from [31] ........................... 106
Figure 4.7: Monthly demand evolution (DEMMONTHm) along the year [31] ................................................... 107
Figure 4.8: Normalized summer electric profiles applied for months from [31] ....................... 107
Figure 4.9 Impact on PV and Batteries installation of the conjecture θi .......................................................... 109
Figure 4.10 Consumption profile of house 1 in month 2 at base case scenario. energySold, SOC, Solar production, heat pumps variables, spillage and diesel production remain at zero all the time ...................... 111
Figure 4.11 Consumption profile of house 1 in month 7 at Scenario I. energySold, soc, Solar production, spillage, tempHp and diesel production remain at zero all the time................................................................ 111
Figure 4.12 Consumption profile of house 6 in month 7 at Scenario II. energySold, tempHP and diesel production remain at zero all the time ............................................................................................................. 112
Figure 4.13 Consumption profile of house 6 in month 7 at Scenario III. energySold, tempHP, soc and diesel production remain at zero all the time ............................................................................................................. 112
Figure 4.14 Consumption profile of house 6 in month 2 at Scenario III. energySold, inputAC, soc and diesel production remain at zero all the time ............................................................................................................. 112
Figure 4.15 Consumption profile of house 1 in month 7 at Scenario IV ........................................................... 113
Figure 4.16 Temperatures House 1 Scenario I .................................................................................................. 114
Figure 4.17 Detail of operation in isolated mode with PV limitations of the Pl(all DER) scenario from the grid connected case ................................................................................................................................................. 116
Figure 5.1: Block diagram of the model ............................................................................................................ 128
Figure 5.2: Inputs and Outputs of the optimization model .............................................................................. 129
Figure 5.3: Case study considered for Spain ..................................................................................................... 138
Figure 5.4: Load duration curves (for a month in the top and for the year in the bottom) with network losses and thermal demand ........................................................................................................................................ 141
Figure 5.5: Installed Capacities of case study ................................................................................................... 145
Modeling Tools for Planning and Operation of DERs and their Impact in Microgrids and Centralized Resources. xiii
Table 1: Main benefits and drawback of using DC instead of AC ....................................................................... 34
Table 2: Hybrid Energy System Configurations from [24] .................................................................................. 35
Table 3: DC voltage levels in the literature ........................................................................................................ 36
Table 4: Technology Review adapted from [27] ................................................................................................. 37
Table 5: Communication Protocols: Main Uses and Characteristics [35,37,41,232] .......................................... 41
Table 6: Services in each level ............................................................................................................................ 42
Table 7: Differences between centralized and decentralized controls .............................................................. 44
Table 8: Types of DR ........................................................................................................................................... 46
Table 9: Future MG operation and structure ..................................................................................................... 54
Table 10 Gaps in the state of the art .................................................................................................................. 57
Table 11 DER parameters ................................................................................................................................... 73
Table 12 Scenarios for grid-connected mode ..................................................................................................... 74
Table 13 Real energy bill vs. Operation results of the Op(CS) scenario ............................................................. 74
Table 14: Thermal Parameters ........................................................................................................................... 83
Table 15: Building’s Characteristics .................................................................................................................... 86
Table 16: DER’s estimations ............................................................................................................................... 86
Table 17: Price definition .................................................................................................................................... 87
Table 18: Price used in each scenario ................................................................................................................. 87
Table 19: Electrical kWh consumed.................................................................................................................... 88
Table 20: Costs of Operation, Investment and Maintenance ............................................................................. 88
Table 21: Building Characteristics in investment scenarios ............................................................................... 89
Table 22 Scalar Values ...................................................................................................................................... 108
Table 23 Parameters Values I ........................................................................................................................... 108
Table 24 Parameters Values II .......................................................................................................................... 108
Table 25 Scenarios’ definition .......................................................................................................................... 108
Table 26 Costs per Agent (USD in 20 years) ..................................................................................................... 111
Table 27 Installed peak of PV (kW) and capacity of ES (kWh) .......................................................................... 113
Table 28 Electrical/thermal demand and assignment of resources per building ............................................. 115
Table 29 Capacities installed without HPs ........................................................................................................ 116
Table 30 Capacities installed with HPs ............................................................................................................. 116
Table 31: Comparison with other models ........................................................................................................ 127
Table 32: Case studies definition ...................................................................................................................... 139
Table 33: Parameters for central plants considered [211–213] ....................................................................... 139
Table 34: Parameters for DER considered [211,215] ....................................................................................... 139
Table 35: General Parameters .......................................................................................................................... 140
Table 36: Current Capacities of centralized generators for scenario A. ........................................................... 140
Table 37: Capacities of DER for the current situation ...................................................................................... 142
Table 38: Scenarios for case study B ................................................................................................................ 143
xiv Francisco Martín Martínez
Table 39: Installed Capacities of case study B................................................................................................... 143
Table 40: Effects of Gas, DR and Tariffs ............................................................................................................ 144
Table 41: Costs for case study B ....................................................................................................................... 144
Table 42: Effects of price variations of PV and ES ............................................................................................. 145
Table 43: Effect of DEMSHIFT parameter ......................................................................................................... 146
Table 44: List of equations per model .............................................................................................................. 152
Table 45: Main Microgrids around the world ................................................................................................... 159
Modeling Tools for Planning and Operation of DERs and their Impact in Microgrids and Centralized Resources. xv
AMS Aggregated Management System BMS Building Management System CCGT Combined Cycle Gas Turbine CERTS Consortium for Electric Reliability Technology Solutions CHP Combined Heat and Power CCHP Combined Cooling Heat and Power DHW Domestic Hot Water DISCO Distribution Company DER Distributed Energy Resource DG Distributed Generation DMS Distribution Management System DNI Direct Normal Irradiation DR Demand Response DRP Demand Response Program DSO Distribution System Operator EB Energy Box which manages the energy of an agent EMO Electric Market Operator EMS Energy Management System ER Electric Radiator ES Energy Storage ESP Energy Service Provider EV Electric Vehicle HP Air source Heat Pump ICT Information and Communications Technologies MAS Multi-Agent System MCP Mixed Complementarity Problem MG Microgrid MGCC Microgrid Central Controller MGMS Microgrid Management System MGO Microgrid Operator PROSUMER Consumers that can produce and sell energy PV Photovoltaic Solar Panels PVT Hybrid solar panels RES Renewable Energy Sources RNM Reference Network Model ROM Reliability and Operational Model TC Thermal collectors TMS Transmission Management System TSO Transmission System Operator

xvi Francisco Martín Martínez
V2G Vehicle to Grid VPP Virtual Power Plant
Modeling Tools for Planning and Operation of DERs and their Impact in Microgrids and Centralized Resources. xvii
Recent years have seen a great leap forward towards distributed energy resources (DERs), including electricity distributed generation and storage, and it is just a matter of time that they become a regular part of our systems. The deployment of these new devices is encouraged in order to reduce climate change effects (together with renewable plants), to enhance resiliency, to reduce transmission and distribution network investment needs and network losses, and to increase efficiency. Distributed generation has also led to the appearance of new, conceptually speaking, electricity business models still barely deployed in current systems. These innovative ways of managing distributed networks range from the Microgrids and Virtual Power Plants concepts to the deployment of new distributed services like Aggregations of energy resources or Electric Vehicle fleets.
This work contributes to the analysis of the deployment of DERs by means of the development of mathematical models (implemented as software tools) designed to address three important DERs’ issues.
The first one concerns the optimal deployment of DERs at building level taking into account both electricity and thermal energy building requirements. This model is the core of any of the models developed in this thesis. Modeling in detail both the buildings electricity and thermal demand behaviors, and the economic and physical characteristics of the different DERs involved is of paramount importance to properly address the capabilities and efficiency of DERs’ solutions. In particular, modeling the temperature behavior of the building taking into account the thermal inertia of the building, the outside temperature, and the possibility to choose among electricity fed heat pumps, exposed to an hourly price of electricity or gas fed boilers, exposed to a daily constant price of gas, or modeling the demand shifting capabilities of the electricity consumption, may be very relevant to decide the more appropriate mix of DER’s technologies to be deployed at building level. Such a mathematical model is presented and several studies conducted to understand the role played by the heating consumptions and its demand response capabilities.
The second one concerns the optimal deployment of DERs at Microgrid (MG) level. First, an exhaustive state of the art review on MGs has been conducted, classified by functional layers, from the physical layer at the bottom up to the business models layer at the top. Then, a mathematical model has been designed to represent the optimal DERs’ investment and economic operation for an isolated MG, built as aggregation of individual buildings with their own DER’s deployment, where the figure of an Aggregator is in charge of managing the MG and has also the option to invest on common shared generation devices such as diesel generators. In particular, a local market conducted by the Aggregator, as proposed by some reports and literature, has been simulated to manage the energy exchanges among building owners within the MG. An equilibrium model has been adopted to allow analyzing the possible effects of strategic behaviors in a market of such small size. The load-frequency and voltage control related issues have not been considered.
Abstract
xviii Francisco Martín Martínez
The third one concerns the optimal deployment of DERs at power system level. A mathematical model has been designed to properly address studies on the efficiency of DERs’ deployment versus centralized generation based deployment. Although DERs’ deployment may be seen attractive from an end consumers point of view due to the specific regulation in place (tariffs design, incentives, charges…), it is not clear if it is an efficient option from the whole system point of view. A neutral regulation model for both the DER facilities and the centralized generation power plants has been developed taking into account the main factors that may affect the optimal solution as for instance economies of scale on investment and maintenance costs, the network investment and network losses impact (in a simplified way) or the electricity and thermal demand response capabilities of end-users. Besides, a modeling of the impact of applying electricity tariffs to recover bulk power system regulated stranded cost, has also been considered, as an additional option.
Keywords: Microgrid; Communication Protocols; Microgrid Testbeds; Aggregation Types; Business models; Distributed Energy Resources; Demand Response; Energy Management; Building Thermal Model; Energy Storage; Microgrid Isolated Operation; Microgrid Local Market; Centralized Generation.
Modeling Tools for Planning and Operation of DERs and their Impact in Microgrids and Centralized Resources. xix
En los últimos años se ha dado un gran paso hacia los recursos energéticos distribuidos (DER), incluyendo la generación y el almacenamiento de electricidad distribuida, y es sólo cuestión de tiempo que se conviertan en parte regular de nuestros sistemas. El despliegue de estos nuevos dispositivos se ha fomentado con el fin de reducir los efectos del cambio climático (junto con el de las centrales renovables), mejorar la resiliencia, reducir las necesidades de inversión en la red de transporte y distribución y las pérdidas en la red, y aumentar la eficiencia del sistema. La generación distribuida también ha llevado a la aparición de nuevos modelos de negocio, conceptualmente hablando, y que todavía apenas han sido implementados en los sistemas actuales. Estas formas innovadoras de gestión de redes distribuidas abarcan desde los conceptos de Microredes y Virtual Power Plants hasta el despliegue de nuevos servicios distribuidos como agregaciones de recursos energéticos o flotas de Vehículos Eléctricos.
Este trabajo contribuye al análisis del despliegue de DERs mediante el desarrollo de modelos matemáticos (implementados como herramientas de software), los cuales han sido diseñados para abordar tres temas importantes sobre los DERs.
El primero se refiere al despliegue óptimo de DERs a nivel de edificios teniendo en cuenta tanto las necesidades de electricidad como las de generación de energía térmica. Este modelo supone el núcleo de cualquiera de los modelos desarrollados en esta tesis. El modelado en detalle de los comportamientos eléctricos y térmicos de los edificios, así como las características económicas y físicas de los diferentes DER involucrados es de suma importancia para abordar adecuadamente las capacidades y la eficiencia de los DER. En particular, el modelado del comportamiento térmico del edificio teniendo en cuenta su inercia térmica, la temperatura exterior y la posibilidad de elegir entre bombas de calor alimentadas con electricidad o calderas alimentadas con gas según el precio horario de la electricidad y el precio del gas, o modelar las capacidades de cambio de la demanda eléctrica, puede ser muy relevante para decidir la combinación más apropiada de DER que se desplegarán a nivel de edificios. Se presenta un modelo matemático de este tipo y se realizan varios estudios para comprender el papel desempeñado por cada uno de los factores involucrados y su relevancia.
El segundo tema se refiere al despliegue óptimo de DERs a nivel de Microred (MG). En primer lugar, se ha llevado a cabo una revisión exhaustiva del estado del arte de las MGs, clasificada por capas funcionales, desde la capa física en la parte inferior hasta la capa de modelos de negocio en la parte superior. A continuación, se ha diseñado un modelo matemático para representar la inversión y la operación económica óptima de los DERs en el caso de una MG aislada, construida como agregación de edificios individuales con su propio despliegue de DERs, donde la figura de un Agregador es la encargada de administrar la MG y que tiene también la opción de invertir en dispositivos de generación compartidos como generadores diesel. En particular, se ha simulado un mercado local dirigido por el Agregador, tal como lo proponen algunos informes y publicaciones, para gestionar los
Resumen
xx Francisco Martín Martínez
intercambios de energía entre los propietarios de edificios dentro de dicha MG. Se ha adoptado un modelo de equilibrio que permite analizar los posibles efectos de comportamientos estratégicos en un mercado de tan pequeño tamaño. No se han tenido en cuenta los problemas relacionados con la regulación de frecuencia de carga y el control de la tensión.
El tercer tema se refiere al despliegue óptimo de DERs a nivel del sistema de energía. Se ha diseñado un modelo matemático para abordar adecuadamente los estudios sobre la eficiencia del despliegue de los DERs frente la implementación basada en la generación centralizada. Aunque el despliegue de DERs puede resultar atractivo desde el punto de vista del consumidor final debido a la regulación específica en vigor (diseño de tarifas, incentivos, tarifas...), no está claro si es una opción eficiente desde el punto de vista del sistema completo. Se ha elaborado un modelo con regulación imparcial entre las instalaciones DER y las centrales de generación centralizada teniendo en cuenta los principales factores que pueden afectar a la solución óptima, como por ejemplo las economías de escala en los costes de inversión y mantenimiento, las pérdidas de energía, la capacidad de respuesta de la demanda eléctrica y térmica de los usuarios finales. Además, se ha considerado, como opción adicional, una modelización del impacto de la aplicación de las tarifas eléctricas para la recuperación de los costes regulados del sistema.
Palabras clave: Microred; Protocolos de Comunicaciones; Microredes Reales; Tipos de agregación; Modelos de negocios; Recursos Energéticos Distribuidos; Respuesta de la demanda; Gestión energética; Modelo térmico del edificio; Almacenamiento Térmico; Operación de redes aisladas; Mercados Locales; Generación Centralizada.
Modeling Tools for Planning and Operation of DERs and their Impact in Microgrids and Centralized Resources. 21
“Big things have small beginnings, sir”
Lawrence of Arabia 1962
This first chapter introduces the reasoning behind this thesis as well as its main aims. In addition, it provides the reader with a general overview of the organization and the outline of the dissertation in order to make it easier to follow.
1.1 Current trends and motivation
The thesis is motivated by the increase use of new Distributed Energy Resources (DERs) in electricity distribution networks. Deployment of DERs has triggered several new research lines regarding electric power systems that range from technical topics such as stability related issues, to management and business model related topics. This thesis tries to contribute to this research area by developing an advanced modeling tool aiming at analyzing the optimal investment and operation of DERs in buildings and isolated grids. Besides, an adapted version of that model has also been developed to address analyses related to optimal DERs’ deployment and operation in power systems.
During last decades, several factors such as the environmental concerns, the technological evolution and the economic improvements have promoted the development and adoption of DERs in the electrical power delivery. End-users are becoming active participants using demand response (DR) programs thanks to the current deployment of Energy Management Systems (EMS) and Smart Meters. Indeed, DERs can reduce the net thermal or electric consumption by themselves or by exploiting existing synergies among gas, air conditioning and electricity to be globally more efficient. In fact, DR programs, energy storages (ESs) and Electric Vehicles (EVs) can also deliver ancillary services to increase the operation efficiency of the electricity system. Thus, the aggregation of loads and DERs will be crucial to take full advantage of these improvements.
Substantial changes with respect to current distribution networks will be carried out to converge to the Smart Grids concept. This concept is defined as an electricity grid that will deliver electricity from suppliers to consumers using information and communication technologies (ICT) to control and protect the operation of these networks. The purpose of
Chapter 1. Introduction
22 Francisco Martín Martínez
the Smart Grids is to have lower CO2 emissions and better efficiencies with higher penetration of renewable resources.
The development of DERs such as Distributed Generation (DG), ES or DR, together with the deployment of ICT, is fostering the development of new distributed resource-based systems that look for improving efficiency and engaging end-users. New business models are appearing including, for instance, Microgrids (MGs), Virtual Power Plants (VPPs), aggregation of dispersed loads or EV fleets.
The deployment of these kind of distributed electricity supply models and their relevance in the future cannot be properly analyzed and discussed without been aware of the increasing role of environmental sustainability and energy efficiency in current energy policies. In particular, three aspects of these policies should be highlighted as strong driver forces towards a more distributed approach of electricity supply. Firstly, the use of generation technologies with low carbon emissions and high efficiency rates is encouraged in order to fight against the climate change. Secondly, domestic self-consumption is promoted to reduce the impact on the environment and to improve the resiliency of the system against weather phenomena or other uncertainties. Finally, many developing countries may resort on distributed supply solutions to provide electricity access to the population that still do not have this access (around 1.2 billion of inhabitants over the world). Therefore, environment, efficiency, and resiliency and universal electricity access in remote areas are the main becoming priorities in developed and developing countries, and distributed electricity supply models may play a central role to tackle these issues.
There is still a lot of work to do to clearly assess the advantages and disadvantages of the different approaches that can be adopted. For instance, MGs based schemes (a distributed electricity supply scheme based on the interaction of myriads of MG, either interconnected or isolated if necessary, based on a distributed ownership of DERs) seem to offer the best solution regarding resiliency and electrification of rural areas, although their overall technical and economic benefits need to be further discussed. Indeed, this kind of approach requires decentralized controls and new business models to be develop to cope for instance with the system and MG energy balancing or with the organization of the MG internal energy exchanges (a local energy price clearing process may be one possible approach for MGs operating on isolated mode). However, other solutions like the VPP approach (aggregation of physically dispersed DER facilities within a power system) or other kinds of aggregation schemes may behave better, at least from an efficiency point of view, since they fit better with centralized generation schemes that benefit from economies of scale on their installation cost when they are compared with their related DERs option.
In this context, this thesis focuses on MGs. In a wide context, an electrical system made up of several MGs able to operate either connected under normal operation conditions or in isolated mode if a disturbance or any other contingencies happens in the main system, may be an attractive solution to address at the same time resiliency and efficiency objectives. In this way, each MG could supply its own demand guaranteeing the supply, even disconnected from the main system, and under normal conditions, MGs would behave as VPPs from the generation side and as an aggregation of loads from the consumption point of view in order to improve system efficiency.
1.2. Thesis objectives and methodology
Modeling Tools for Planning and Operation of DERs and their Impact in Microgrids and Centralized Resources. 23
This is why MGs are currently a trending topic. Many studies are being issued related to DERs’ deployment in MGs ranging from physical issues to new business model strategies. This thesis addresses the deployment of DERs in MGs and what are their impacts on centralized resources. More precisely it focuses on developing a mathematical model to support analyses of the optimal deployment and operation of DERs. Firstly, within a building subject to electrical and gas tariffs and secondly in isolated MGs. The first one can also be used to study connected MGs. A detailed representation of the behavior of DERs and consumers’ electrical and thermal energy needs is formulated in order to ensure rigorous outcomes. Finally, the thesis develops a model based on the previous ones to address analyses related to optimal DERs’ deployment and operation in power systems, since they can be affected by the operation of centralized generation. Therefore, the thesis presents models to study the impact of DERs’ deployment in current and future power systems.
To complete the contextualization of this thesis it is important to highlight the relevant role that new agents such as aggregators or consumers will certainly play in these new distributed supply schemes. Retailers would not be any more only energy sellers since they would need to offer to their clients, different services such as energy management or aggregation. Also end-users will leave their passive role towards a more active role (including consumption and generation sides) becoming a new figure often called prosumers (some authors even use the name “prosumage” to highlight the storage role they will also play). Therefore, these new agents will have among other, the following new responsibilities:
Prosumers: End-users which are able to generate their own electric energy to supply its demand. They need to interact with distribution system operator (DSOs) and aggregators in order to control the operation of their generation.
Aggregator: This agent represents several consumers or prosumer and it is able to participate in the wholesale electricity market. It could also exchange information with prosumers to offer ancillary services to DSOs or to modify the behavior of several of them in order to achieve better results thanks to the optimization of the bids done in the market [1].
Within this context, this thesis pays special attention to properly model the capabilities of the consumers to install DERs and to manage its electricity and thermal energy consumption needs. In particular, the thermal component of the consumer energy needs is explicitly modeled, and the thermal inertia of buildings incorporated as it may play a relevant role in the optimal choice of DERs’ deployment.
To end up the context of the thesis, it is to be said that the thesis addresses the investment (installation) and hourly operation of DERs, but not other issues related to the participation of DERs in ancillary services, neither the study of real-time performance of a MG in terms of stability or voltage related issues. Nevertheless the thesis does present a real-life implementation of the kind of on-line operation decisions represented in the mathematical model proposed in the thesis, to show its actual applicability.
Chapter 1. Introduction
24 Francisco Martín Martínez
1.2 Thesis objectives and methodology
This PhD aims at providing models to help decision making processes in the optimization of the installation and operation of distributed energy resources within different grids. These grids could be connected or isolated Microgrids in distribution networks or the whole system. Models allow optimizing the investment (installation) and operation of DERs with an accurate representation of both DERs’ operation characteristics and consumer electricity and thermal energy needs. This thesis has enhanced current models by considering the indoor temperature behavior of a house and developing models for studying the behavior of DERs in MGs and electrical systems.
The goal of these models is contributing to address important questions related to the future configuration of power systems such as:
How the potential interactions between thermal and electric energy (exploiting any kind of synergy among them) can impact DERs’ deployment in distributed systems?
Which is the optimal mix of DERs for a particular set of prosumers at MG level?
How should DERs be operated in isolated systems to optimize its costs?
What is the optimal DERs’ mix at Microgrid and system level? What are the impacts of DERs on traditional technologies?
Which should be the more efficient balance between centralized generation and DG for electricity supply? Which factors (economic, technical, regulatory, etc.) may affect the more such comparison?
The thesis proposes models specifically designed to address these questions and provides some preliminary insights to them by running several case studies, although more studies using these models (with much emphasis and effort in polishing input data and out of the scope of this thesis) will be required to come up with conclusive, robust enough, answers to those questions.
The main goal can be divided in the following partial goals for which the author claims this thesis contributes to:
1. Define the MG concept with a comprehensive and exhaustive literature review of MGs. The review is organized attending to different functional layers and provides useful insights on the current situation of MGs. The review addresses all possible fields where a MG is involved in order to get insights of the requirements and current trends of this new method of operating distribution networks. This literature review on MGs embraces more aspects than those actually addressed in the thesis, such as those related to the physical and communications layers or those related to technical real-time operation issues (i.e. voltage and frequency regulation or ancillary services provision). However, the author found a large dispersion of terms and concepts related to MGs in the literature that an exhaustive review of the MG concept was deemed necessary to properly address the topics of the thesis.
2. Developing a model able to optimize the integration of DERs taking into account the operational and investment cost, the users’ and DERS’ characteristics, the regulatory constraints and the environmental conditions. Properly assessing
1.2. Thesis objectives and methodology
Modeling Tools for Planning and Operation of DERs and their Impact in Microgrids and Centralized Resources. 25
integration of DERs requires the definition of individual operation constraints per each type of DER to represent its operation characteristics.
3. Integrate a physical model for the indoor temperature dynamics. This allows building a consumer model able to consider both thermal and electric consumption demands to exploit possible synergies among them, taking into account users’ characteristics and preferences, and outside temperature conditions.
4. Developing a framework for managing and settling energy exchanges between participants in an isolated MG, based on local distributed electricity markets. Developing a model to simulate the optimally economic and electric flows in isolated energy systems when they use the local market approach is considered, in order to explore the validity of it. This model is general enough in order to take into account different levels of competition among agents when the local markets and MGs are fully deployed.
5. Developing a model to support analyses of strategic decisions regarding DERs’ deployment in power systems at a country level, with a special focus on the balance between centralized and distributed resources investments.
Thus, this thesis presents economic and technical models for assessing DERs adoption and real time operation. These models plan DERs by minimizing the total investment and operation costs of prosumers. To perform the computation, the system takes into account the regulatory parameters of the region and the environmental variables that affect the DER’s performance (e.g. the solar irradiation or the rainfall). The outputs include the optimal DER technological mix (the selected technologies and their installed capacities) for the final user, and the optimal operation schedule of these technologies to maximize users’ profits, either individually or aggregated.
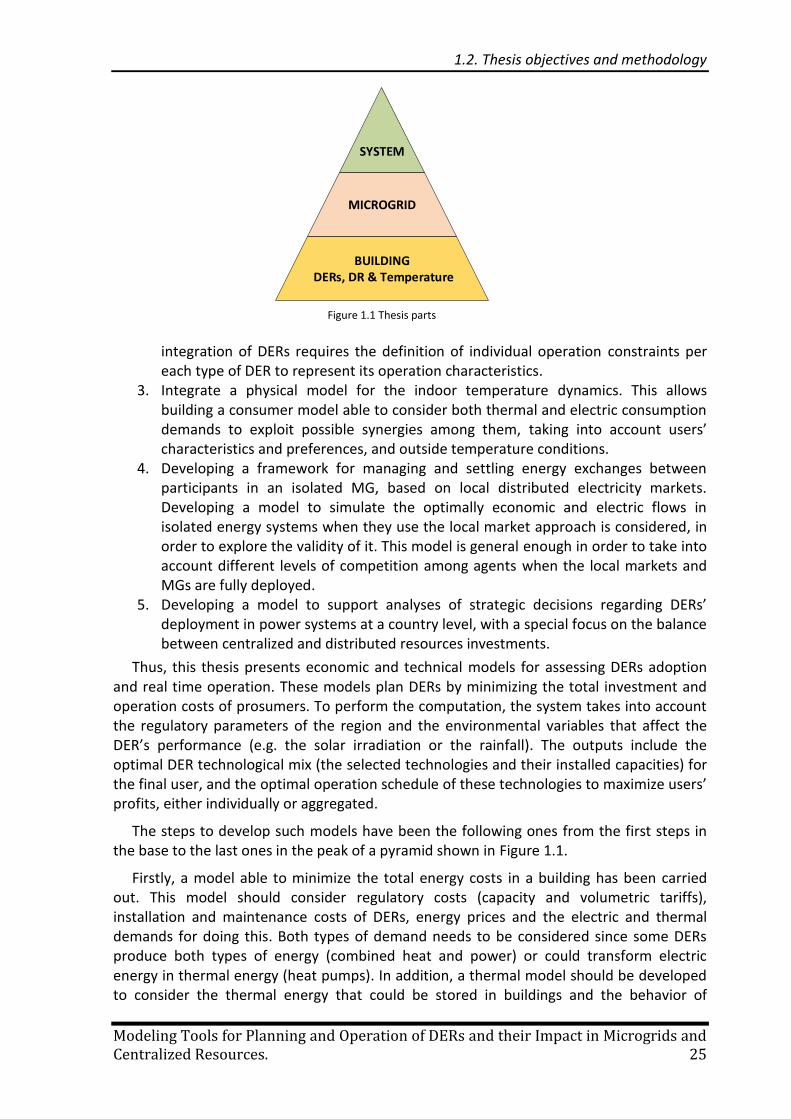
The steps to develop such models have been the following ones from the first steps in the base to the last ones in the peak of a pyramid shown in Figure 1.1.
Firstly, a model able to minimize the total energy costs in a building has been carried out. This model should consider regulatory costs (capacity and volumetric tariffs), installation and maintenance costs of DERs, energy prices and the electric and thermal demands for doing this. Both types of demand needs to be considered since some DERs produce both types of energy (combined heat and power) or could transform electric energy in thermal energy (heat pumps). In addition, a thermal model should be developed to consider the thermal energy that could be stored in buildings and the behavior of
SYSTEM
MICROGRID
BUILDING DERs, DR & Temperature
Figure 1.1 Thesis parts
Chapter 1. Introduction
26 Francisco Martín Martínez
outdoor temperatures since heating systems represents a 70% of the total energy consumption in a residential house. This model is implemented in a real building energy management system (EMS) where not only a planning model is needed, but also a real time model and communication framework with a database has been implemented.
Afterwards, the behavior of an isolated MG composed of some buildings with an internal market approach to manage energy exchanges is investigated in order to cover the gap discovered in the literature review. In this model, a case study is developed in order to discover how buildings’ decisions can affect each other. Finally, adding centralized generation to the previous model allows studying the deployment of DERs in a power system, in particular the cross relationships among different technologies and the factors that, because of their relevance, need to be taken into account when centralized and distributed generation are faced. Lastly, in the last period of the thesis several case studies have been carried out with real data obtained from external projects and from real experiences.
1.3 Dissertation outline
The dissertation consists of six chapters including this first introductory one. To begin with, in order to help putting the thesis in context, Chapter 2 provides an extensive review that covers most of the existing literature related to the MG concept. As explained previously, this review embraces more aspects than those actually addressed in the thesis, but contributes clarifying the MG concept used in the thesis.
Three chapters, starting from Chapter 3, deal with the models developed in this thesis. Given that it is an incremental process, each chapter builds up on the previous one and, consequently, the basic equations are fully detailed in Chapter 3 whereas only changes or new equations are explained in Chapters 4 and 5.
These chapters are all organized in the same manner with the intention of maintaining the scheme of a technical paper, the most common and familiar scientific communication format. Owing to this layout of the information, the dissertation should be read from beginning to end since Chapters 4 and 5 are based on Chapter 3. These core chapters have the following structure:
• First, a brief introduction to situate the chapter in the context of the thesis. The related studies (a literature review for the main topic developed in the chapter) are put forward and explained in brief, highlighting the key points to the comprehension of the chapter developments.
• Second, the model is explained and justified. A theoretical background is provided, if necessary, along with practical implementation considerations.
• Then, different case studies are carried out to validate the model and to contribute to the questions presented above.
• Finally, the main conclusions that can be drawn are summarized trying to highlight the contributions made in each chapter.
1.3. Dissertation outline
Modeling Tools for Planning and Operation of DERs and their Impact in Microgrids and Centralized Resources. 27
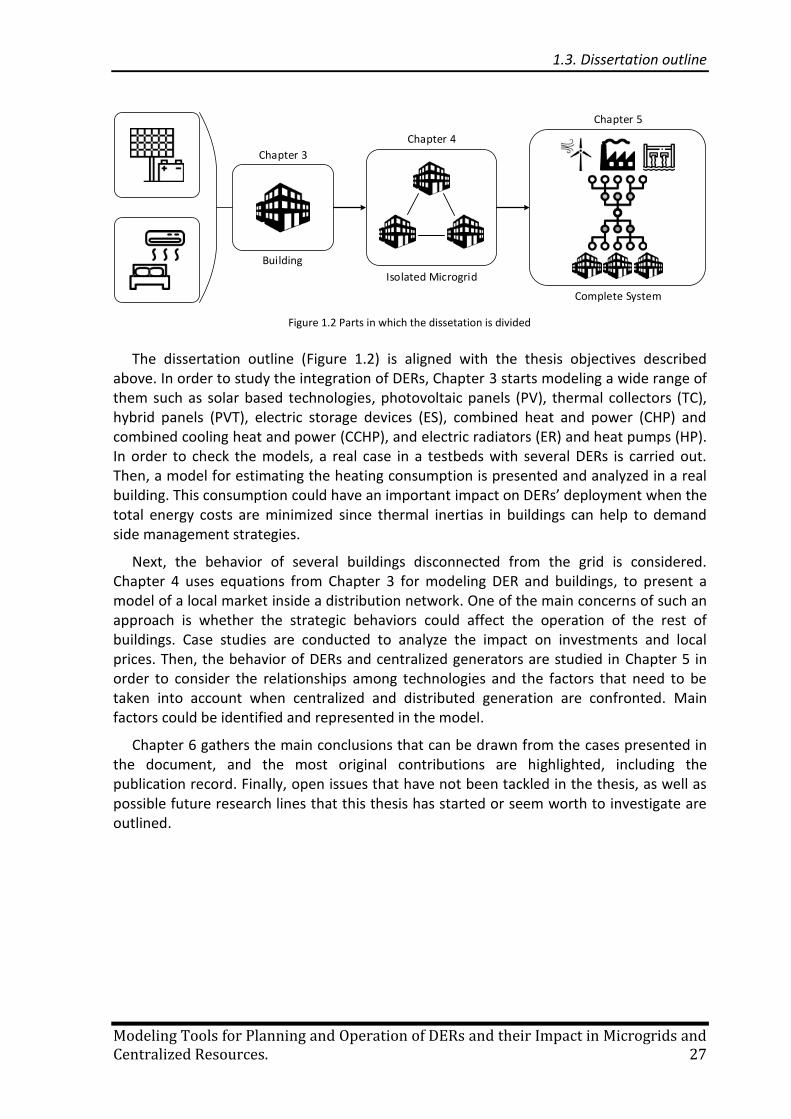
The dissertation outline (Figure 1.2) is aligned with the thesis objectives described above. In order to study the integration of DERs, Chapter 3 starts modeling a wide range of them such as solar based technologies, photovoltaic panels (PV), thermal collectors (TC), hybrid panels (PVT), electric storage devices (ES), combined heat and power (CHP) and combined cooling heat and power (CCHP), and electric radiators (ER) and heat pumps (HP). In order to check the models, a real case in a testbeds with several DERs is carried out. Then, a model for estimating the heating consumption is presented and analyzed in a real building. This consumption could have an important impact on DERs’ deployment when the total energy costs are minimized since thermal inertias in buildings can help to demand side management strategies.
Next, the behavior of several buildings disconnected from the grid is considered. Chapter 4 uses equations from Chapter 3 for modeling DER and buildings, to present a model of a local market inside a distribution network. One of the main concerns of such an approach is whether the strategic behaviors could affect the operation of the rest of buildings. Case studies are conducted to analyze the impact on investments and local prices. Then, the behavior of DERs and centralized generators are studied in Chapter 5 in order to consider the relationships among technologies and the factors that need to be taken into account when centralized and distributed generation are confronted. Main factors could be identified and represented in the model.
Chapter 6 gathers the main conclusions that can be drawn from the cases presented in the document, and the most original contributions are highlighted, including the publication record. Finally, open issues that have not been tackled in the thesis, as well as possible future research lines that this thesis has started or seem worth to investigate are outlined.
Chapter 3
Chapter 4
Chapter 5
Building
Isolated Microgrid
Complete System
Figure 1.2 Parts in which the dissetation is divided

Modeling Tools for Planning and Operation of DERs and their Impact in Microgrids and Centralized Resources. 29
Research is to see what everybody else has seen,
and to think what nobody else has thought.
Albert Szent-Gyorgyi
This chapter provides an introductory overview of the Microgrid concept. After some general definitions, the chapter identifies the different concepts related to Microgrids in the literature, and makes use of them as well as of the different layers involved in a Microgrid (from the physical layer on the bottom up to business model layer on the top) to provide a comprehensive and exhaustive classification and review of MG related issues. This review embraces some topics not directly related to the ones tackled in the thesis, such as those related to the physical and communications layers or those related to technical real-time operation issues (i.e. voltage and frequency regulation). However, the author found a large dispersion of terms and concepts related to MGs in the literature that an exhaustive review of the MG concept was necessary to establish a clear definition of how this thesis addresses the Microgrid concept. The content of this chapter is an updated version of the journal article [2].
2.1 Introduction
Nowadays, RESs, DGs and ESs are being deployed in power systems leading, among others, to significant changes in the way distribution networks are currently operated, closely linked to the future Smart Grids [3].
Policies in many countries are encouraging the deployment of these new DERs with the objectives of minimizing environmental impact and supply costs, and increasing system efficiency, reliability and resilience. This, together with the fast development of ICT, is fostering the study and appearance of more decentralized business models to efficiently manage DERs which range from the MG and VPPs concepts to the deployment of new distributed services like aggregations of energy resources or EV fleets. These new business
Chapter 2. General review of the Microgrid concept
30 Francisco Martín Martínez
models seek to provide value to generators, grid operators, end-users and electricity market [4,5].
There is still a lot of work to do to clearly assess the advantages and disadvantages of the different approaches that can be adopted. Fully MGs based schemes seem to offer the best solution regarding resiliency, although their overall technical benefits need still to be further discussed. Indeed this kind of approach requires decentralized controls and new business models able to cope for instance with system balancing and energy prices clearing processes. Other solutions like VPP or other kinds of aggregation seems to behave better for efficiency objectives since they fit better with centralized generation schemes that benefit from economies of scale.
To better understand how and how much MGs could contribute to a more sustainable electricity delivery in the future, and the role they may play in the new decentralized paradigm of power systems, this chapter addresses a deep technical literature review related to MGs. MG is a concept still not fully clearly defined. Indeed different authors refer to it in distinct ways. MG is usually defined as a cluster of micro-generators, storage systems and loads operating as a single system [6], although formal definitions differ in the literature regarding sizes, resources and functionalities. This concept of MG was set by the Consortium for Electric Reliability Technology Solutions (CERTS) in the USA and it was defined as “an aggregation of loads and microsources operating as a single system providing both power and heat” [6]. However, in the EU approach, see for instance the European MICROGRIDS project, a MG is defined as “a Low Voltage distribution network comprising various DG, storage devices and controllable loads that can operate interconnected or isolated from the main distribution grids” [7].
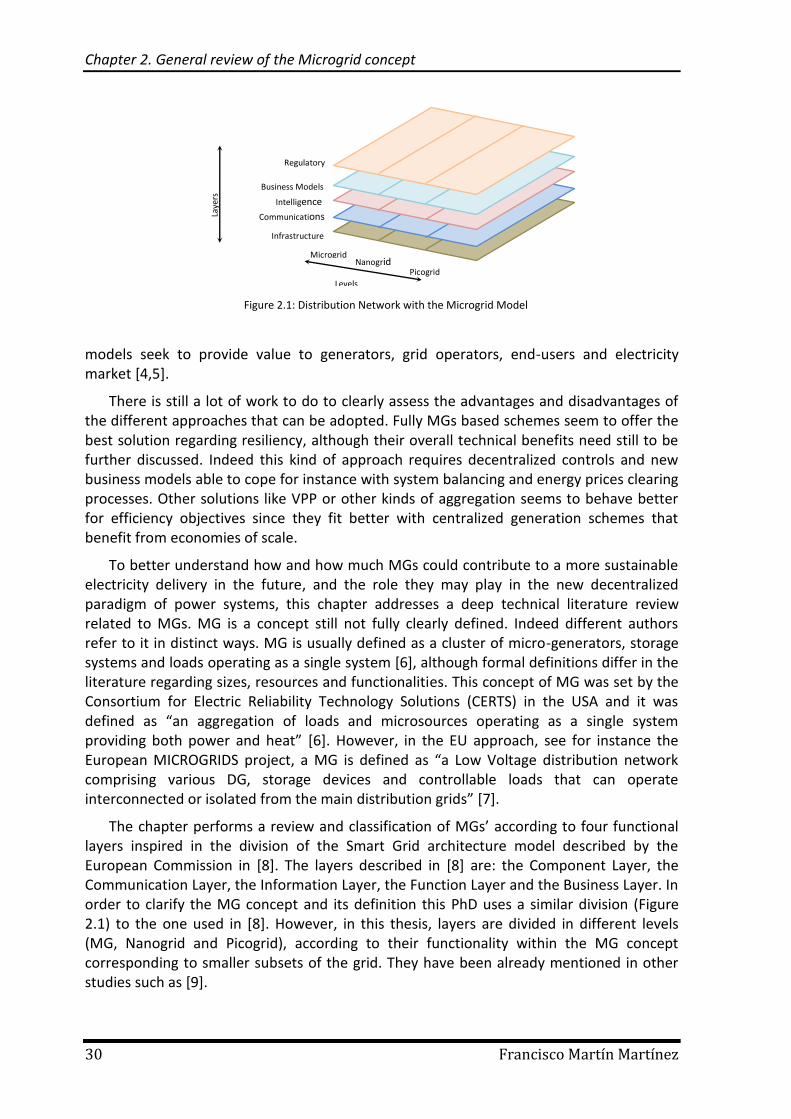
The chapter performs a review and classification of MGs’ according to four functional layers inspired in the division of the Smart Grid architecture model described by the European Commission in [8]. The layers described in [8] are: the Component Layer, the Communication Layer, the Information Layer, the Function Layer and the Business Layer. In order to clarify the MG concept and its definition this PhD uses a similar division (Figure 2.1) to the one used in [8]. However, in this thesis, layers are divided in different levels (MG, Nanogrid and Picogrid), according to their functionality within the MG concept corresponding to smaller subsets of the grid. They have been already mentioned in other studies such as [9].
Regulatory
Framework Business Models
Intelligence
Infrastructure
Microgrid Nanogrid
Picogrid Levels
Laye
rs
Communications
Figure 2.1: Distribution Network with the Microgrid Model
2.2. Structure and Architecture of a MG
Modeling Tools for Planning and Operation of DERs and their Impact in Microgrids and Centralized Resources. 31
This chapter is organized as follows: Section 2.2 proposes a hierarchical organizational scheme of the MGs with a clear distinction of the Microgrid, Nanogrid and Picogrid concepts involved. Section 2.3 focuses on the first layer and performs a review of converters, types of loads and generation technologies currently used in MGs. Section 2.4 presents the communication layer with a review of the main protocols used or proposed so far to exchange signals, orders, and information. Section 0 deals with the intelligence layer, with a review of the ways of aggregating DERs and the modes of operation of a MG. Section 2.6 discusses the future business models concerning MGs proposed so far. Section 2.7 includes an exhaustive review of the MG experiences around the world. Finally, Section 2.8 ends with a brief discussion of the current issues related to MG to be addressed by researchers and the final conclusions.
2.2 Structure and Architecture of a MG
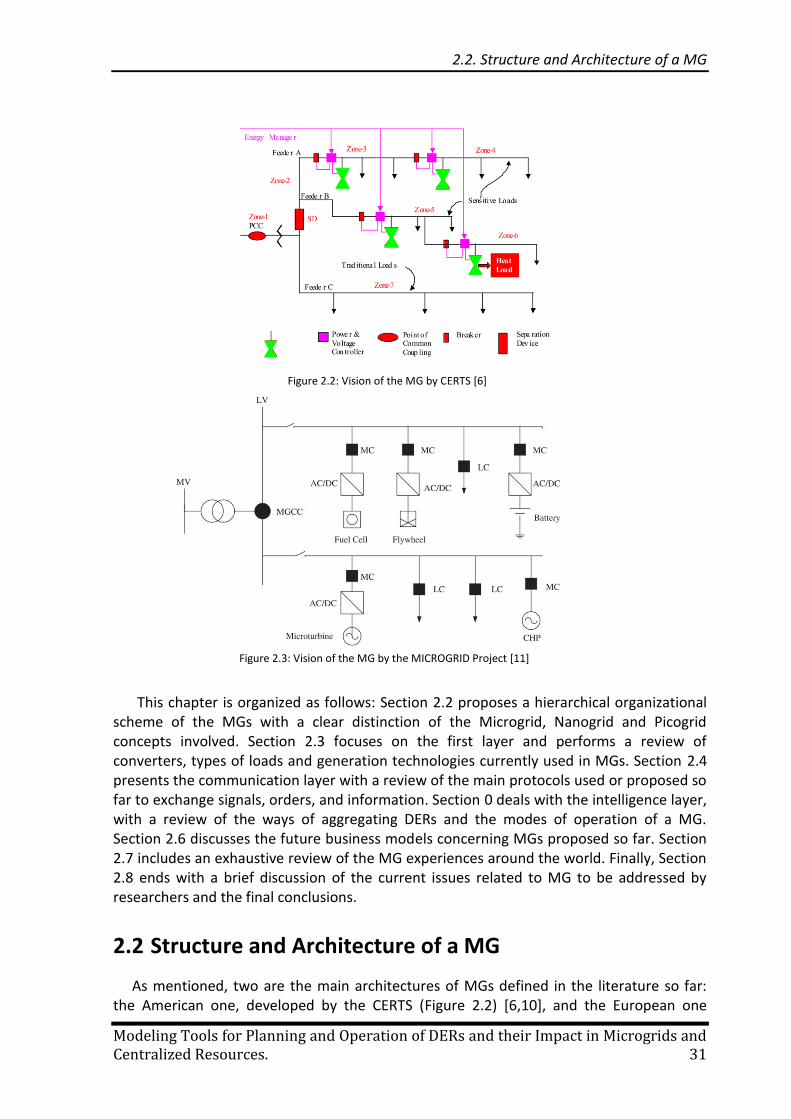
As mentioned, two are the main architectures of MGs defined in the literature so far: the American one, developed by the CERTS (Figure 2.2) [6,10], and the European one
Figure 2.2: Vision of the MG by CERTS [6]
Figure 2.3: Vision of the MG by the MICROGRID Project [11]
Chapter 2. General review of the Microgrid concept
32 Francisco Martín Martínez
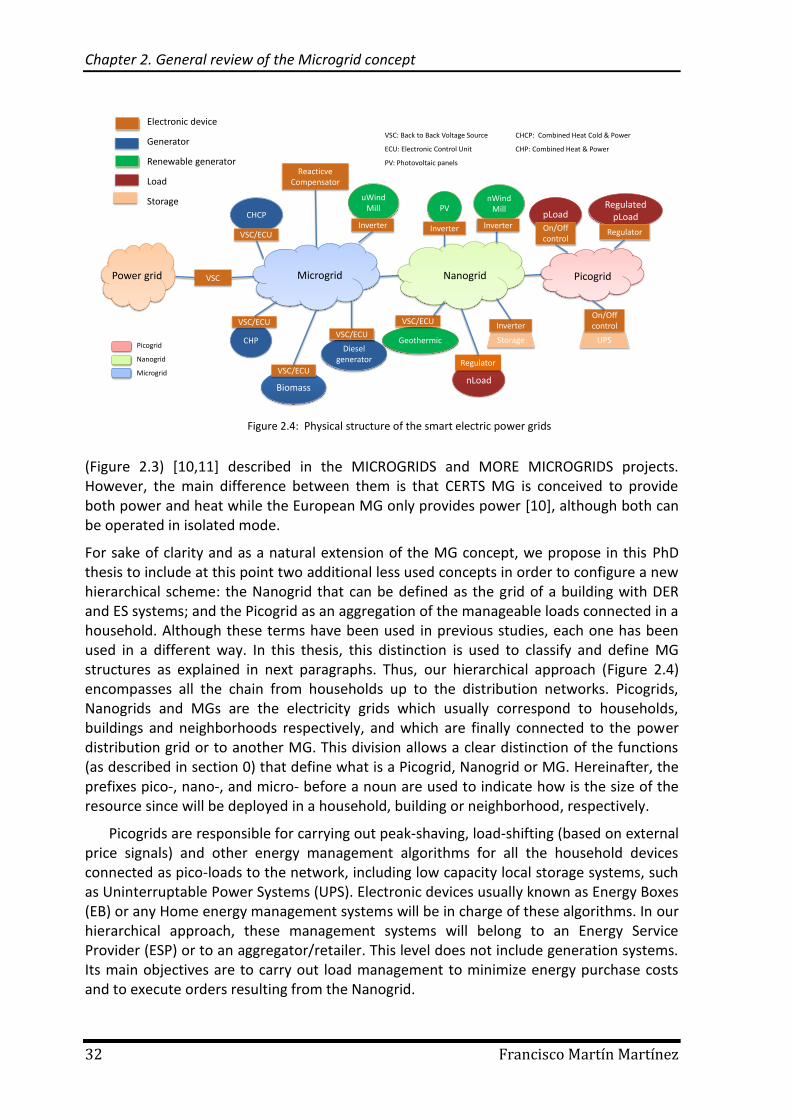
(Figure 2.3) [10,11] described in the MICROGRIDS and MORE MICROGRIDS projects. However, the main difference between them is that CERTS MG is conceived to provide both power and heat while the European MG only provides power [10], although both can be operated in isolated mode.
For sake of clarity and as a natural extension of the MG concept, we propose in this PhD thesis to include at this point two additional less used concepts in order to configure a new hierarchical scheme: the Nanogrid that can be defined as the grid of a building with DER and ES systems; and the Picogrid as an aggregation of the manageable loads connected in a household. Although these terms have been used in previous studies, each one has been used in a different way. In this thesis, this distinction is used to classify and define MG structures as explained in next paragraphs. Thus, our hierarchical approach (Figure 2.4) encompasses all the chain from households up to the distribution networks. Picogrids, Nanogrids and MGs are the electricity grids which usually correspond to households, buildings and neighborhoods respectively, and which are finally connected to the power distribution grid or to another MG. This division allows a clear distinction of the functions (as described in section 0) that define what is a Picogrid, Nanogrid or MG. Hereinafter, the prefixes pico-, nano-, and micro- before a noun are used to indicate how is the size of the resource since will be deployed in a household, building or neighborhood, respectively.
Picogrids are responsible for carrying out peak-shaving, load-shifting (based on external price signals) and other energy management algorithms for all the household devices connected as pico-loads to the network, including low capacity local storage systems, such as Uninterruptable Power Systems (UPS). Electronic devices usually known as Energy Boxes (EB) or any Home energy management systems will be in charge of these algorithms. In our hierarchical approach, these management systems will belong to an Energy Service Provider (ESP) or to an aggregator/retailer. This level does not include generation systems. Its main objectives are to carry out load management to minimize energy purchase costs and to execute orders resulting from the Nanogrid.
PVnWind
Mill
Storage
Inverter
CHCP
uWindMill
CHP
Biomass
Dieselgenerator
Geothermic
VSC
ReacticveCompensator
VSC/ECU
RegulatedpLoad
UPS
pLoad
RegulatorOn/Off control
On/Off control
InverterInverterInverter
VSC/ECU
VSC/ECU
VSC/ECU
VSC/ECU
Microgrid Nanogrid
nLoad
Regulator
PicogridPower grid
VSC: Back to Back Voltage Source
ECU: Electronic Control Unit
PV: Photovoltaic panels
CHCP: Combined Heat Cold & Power
CHP: Combined Heat & Power
Picogrid
Nanogrid
Microgrid
Electronic device
Generator
Renewable generator
Load
Storage
Figure 2.4: Physical structure of the smart electric power grids
2.3. Physical Layer
Modeling Tools for Planning and Operation of DERs and their Impact in Microgrids and Centralized Resources. 33
Nanogrids are in charge of controlling nano-generation (nano-wind turbines and photovoltaic panels), nano-loads and Picogrids. Nanogrids may also include ES, for example batteries from EVs parked in a building. For this reason, Nanogrids not only will use peak-shaving, load-shifting (based on price signals and ES operation) and other energy management algorithms in order to manage its loads, but also will help to maximize DERs’ integration. They will use Building Management System (BMS) from an ESP or aggregator/retailer to carry out their services.
Finally, the third level in the grid hierarchy is the Microgrid. Microgrids control Nanogrids and micro-generation (micro-wind turbines, biomass boilers, combined cooling heat and power). Microgrids may be either directly connected to the electricity distribution power network, at least at one connection point, or connected to another MG. Their main functions are to maximize DERs’ integration and to assure the isolated operation of the system when it is required. For these reasons, there will be two systems in this network: a MG Management System (MGMS) from the DSO or a distribution company (DISCO) whose main function is to guarantee stability and security in the network and an Aggregated Management System (AMS) owned by an ESP or aggregator/retailer which is in charge of the energy and economic exchanges of the MG and providing energy efficiency services.
This proposed hierarchical structure will serve as reference also to the review process performed in next sections for each one of the functional layers (Figure 2.1).
2.3 Physical Layer
This layer contains all physical elements that take part in a MG (or in a Smart Grid in a wider sense): loads, distributed generators such as photovoltaic systems (PV) or Wind turbines, ESs (EVs or batteries) and power electronic systems. This section performs a review and analysis of technologies involved in MG (DG, ES, EV) according to the literature, and studies the differences between DC and AC usage in lower voltage networks.
As shown in Figure 2.4, electronic power systems are required in order to obtain a plug-and-play functionality of all the devices connected to the different levels of the MG. MGs need to change their operating mode between grid-connected and island modes and new DERs need this plug-and-play ability in order to be connected without creating instabilities in the system. Therefore, electronic power systems are used in the connection point between MG and the power grid (using a “back to back Voltage Source Converter”, VSC), and in the connection points of DERs to the Nanogrid or loads to the Picogrid [12](using VSC or “Electronic Control Unit”, ECU). For instance, Solar Arrays and Electric Batteries need these inverters in order to obtain the required frequency and amplitude. These converters are conventionally single- or three-phase, two stage bidirectional converters made up of a VSC (AC to DC stage) and a buck or buck-boost choppers (DC-DC stage) [13–15].
Some DERs such as PVs or ESs produce DC current, and many appliances or household devices consume DC current. Therefore, the use of DC technology in the home areas could be a promising solution, leading several studies to investigate control methods and appropriate voltage levels of DC in households [16](no voltage standard levels of DC have been set up to now). An important initiative in that direction is the IEEE Standards
Chapter 2. General review of the Microgrid concept
34 Francisco Martín Martínez
Association, which did a Call for Participation about DC in the Home launched in November 2013 in order to establish a business case and standard voltage levels for DC [17]. Thus, it could be more feasible to find a DC bus in the Picogrids and Nanogrids than in a MG as suggested by [9,18]. This fact is due to the bigger size of the MG which complicates the security requirements of DC. However, DC in distribution networks is studied in [19] and it concludes that AC grids are outperformed by DC grids in large distribution systems, particularly with high DG penetration. Reference [9] proposes an architecture of an electric power system similar to the one suggested in this work. Its system is called Intergrid and it is made of a mix of Picogrids, AC- or DC-Nanogrids, MGs and Megagrids (they use this term to refer to the existing grid) that can operate alone, being hierarchically interconnected. In[18], the authors describe DC and AC MGs and which are the links between them in their hierarchical approach.
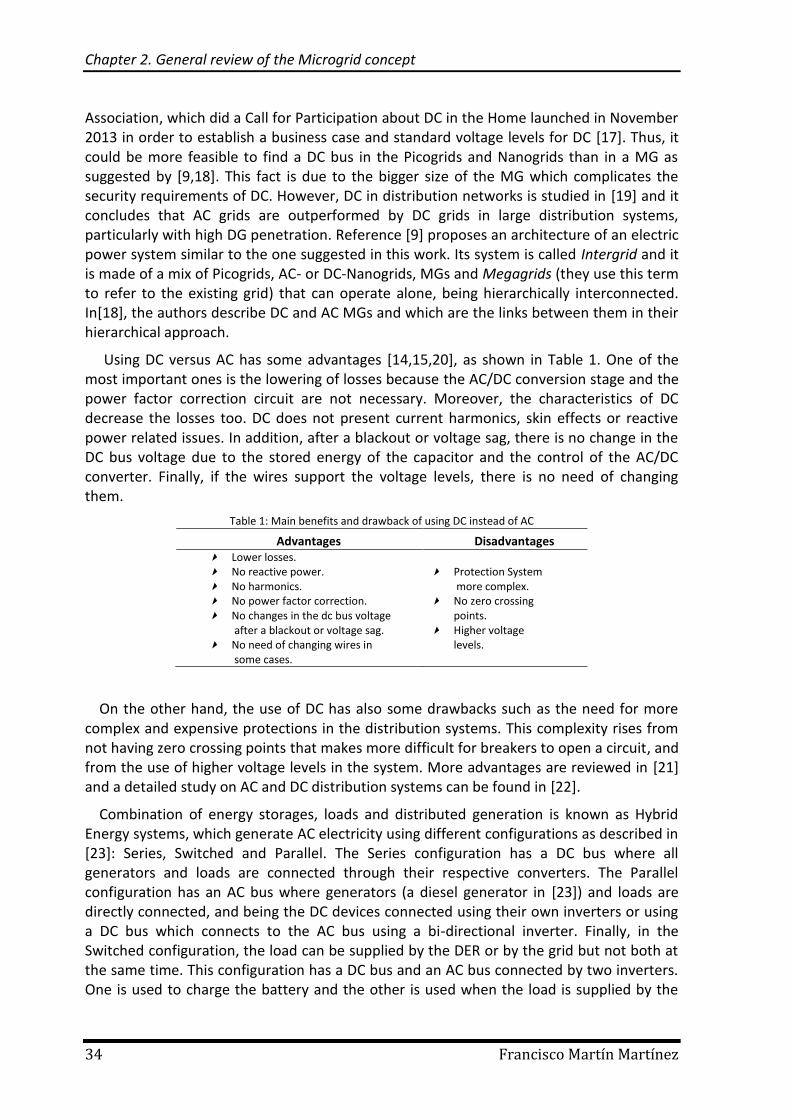
Using DC versus AC has some advantages [14,15,20], as shown in Table 1. One of the most important ones is the lowering of losses because the AC/DC conversion stage and the power factor correction circuit are not necessary. Moreover, the characteristics of DC decrease the losses too. DC does not present current harmonics, skin effects or reactive power related issues. In addition, after a blackout or voltage sag, there is no change in the DC bus voltage due to the stored energy of the capacitor and the control of the AC/DC converter. Finally, if the wires support the voltage levels, there is no need of changing them.
On the other hand, the use of DC has also some drawbacks such as the need for more complex and expensive protections in the distribution systems. This complexity rises from not having zero crossing points that makes more difficult for breakers to open a circuit, and from the use of higher voltage levels in the system. More advantages are reviewed in [21] and a detailed study on AC and DC distribution systems can be found in [22].
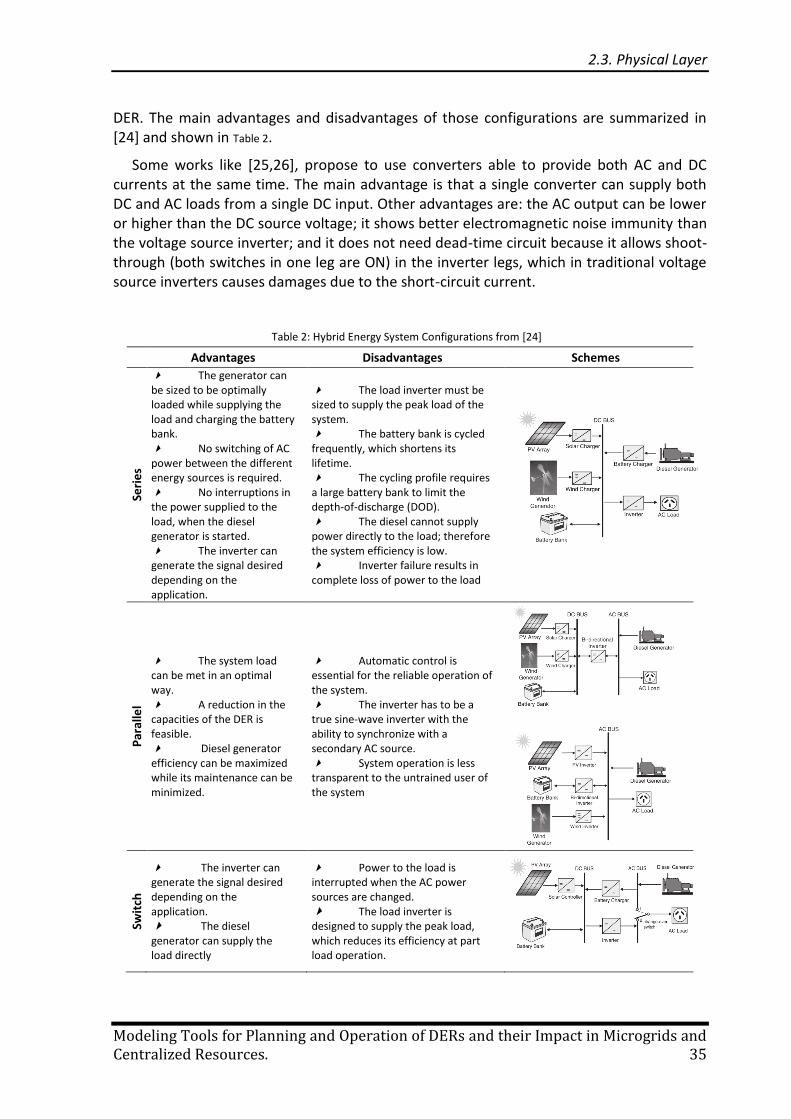
Combination of energy storages, loads and distributed generation is known as Hybrid Energy systems, which generate AC electricity using different configurations as described in [23]: Series, Switched and Parallel. The Series configuration has a DC bus where all generators and loads are connected through their respective converters. The Parallel configuration has an AC bus where generators (a diesel generator in [23]) and loads are directly connected, and being the DC devices connected using their own inverters or using a DC bus which connects to the AC bus using a bi-directional inverter. Finally, in the Switched configuration, the load can be supplied by the DER or by the grid but not both at the same time. This configuration has a DC bus and an AC bus connected by two inverters. One is used to charge the battery and the other is used when the load is supplied by the
Table 1: Main benefits and drawback of using DC instead of AC
Advantages Disadvantages Lower losses. No reactive power. No harmonics. No power factor correction. No changes in the dc bus voltage
after a blackout or voltage sag. No need of changing wires in
some cases.
Protection System more complex.
No zero crossing points.
Higher voltage levels.
2.3. Physical Layer
Modeling Tools for Planning and Operation of DERs and their Impact in Microgrids and Centralized Resources. 35
DER. The main advantages and disadvantages of those configurations are summarized in [24] and shown in Table 2.
Some works like [25,26], propose to use converters able to provide both AC and DC currents at the same time. The main advantage is that a single converter can supply both DC and AC loads from a single DC input. Other advantages are: the AC output can be lower or higher than the DC source voltage; it shows better electromagnetic noise immunity than the voltage source inverter; and it does not need dead-time circuit because it allows shoot-through (both switches in one leg are ON) in the inverter legs, which in traditional voltage source inverters causes damages due to the short-circuit current.
Table 2: Hybrid Energy System Configurations from [24]
Advantages Disadvantages Schemes
Seri
es
The generator can be sized to be optimally loaded while supplying the load and charging the battery bank. No switching of AC power between the different energy sources is required. No interruptions in the power supplied to the load, when the diesel generator is started. The inverter can generate the signal desired depending on the application.
The load inverter must be sized to supply the peak load of the system. The battery bank is cycled frequently, which shortens its lifetime. The cycling profile requires a large battery bank to limit the depth-of-discharge (DOD). The diesel cannot supply power directly to the load; therefore the system efficiency is low. Inverter failure results in complete loss of power to the load
Par
alle
l
The system load can be met in an optimal way. A reduction in the capacities of the DER is feasible. Diesel generator efficiency can be maximized while its maintenance can be minimized.
Automatic control is essential for the reliable operation of the system. The inverter has to be a true sine-wave inverter with the ability to synchronize with a secondary AC source. System operation is less transparent to the untrained user of the system
Swit
ch
The inverter can generate the signal desired depending on the application. The diesel generator can supply the load directly
Power to the load is interrupted when the AC power sources are changed. The load inverter is designed to supply the peak load, which reduces its efficiency at part load operation.
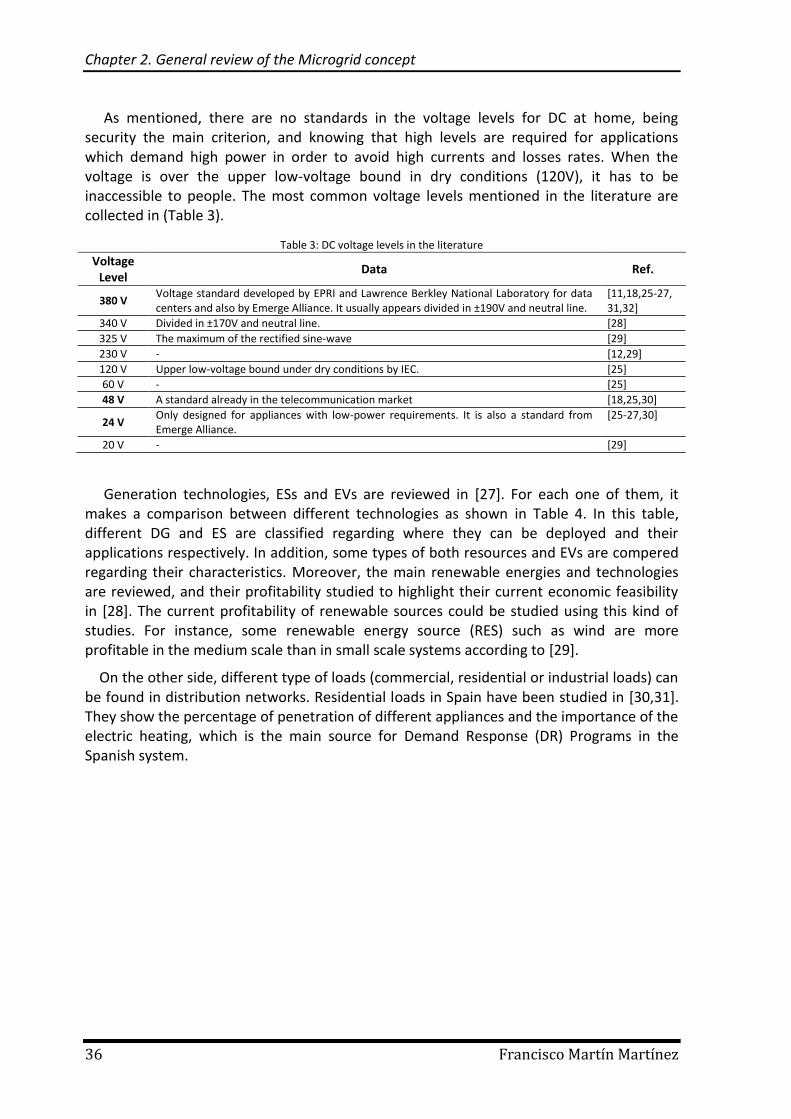
Chapter 2. General review of the Microgrid concept
36 Francisco Martín Martínez
As mentioned, there are no standards in the voltage levels for DC at home, being security the main criterion, and knowing that high levels are required for applications which demand high power in order to avoid high currents and losses rates. When the voltage is over the upper low-voltage bound in dry conditions (120V), it has to be inaccessible to people. The most common voltage levels mentioned in the literature are collected in (Table 3).
Generation technologies, ESs and EVs are reviewed in [27]. For each one of them, it makes a comparison between different technologies as shown in Table 4. In this table, different DG and ES are classified regarding where they can be deployed and their applications respectively. In addition, some types of both resources and EVs are compered regarding their characteristics. Moreover, the main renewable energies and technologies are reviewed, and their profitability studied to highlight their current economic feasibility in [28]. The current profitability of renewable sources could be studied using this kind of studies. For instance, some renewable energy source (RES) such as wind are more profitable in the medium scale than in small scale systems according to [29].
On the other side, different type of loads (commercial, residential or industrial loads) can be found in distribution networks. Residential loads in Spain have been studied in [30,31]. They show the percentage of penetration of different appliances and the importance of the electric heating, which is the main source for Demand Response (DR) Programs in the Spanish system.
Table 3: DC voltage levels in the literature
Voltage Level
Data Ref.
380 V Voltage standard developed by EPRI and Lawrence Berkley National Laboratory for data centers and also by Emerge Alliance. It usually appears divided in ±190V and neutral line.
[11,18,25-27, 31,32]
340 V Divided in ±170V and neutral line. [28]
325 V The maximum of the rectified sine-wave [29]
230 V - [12,29]
120 V Upper low-voltage bound under dry conditions by IEC. [25]
60 V - [25]
48 V A standard already in the telecommunication market [18,25,30]
24 V Only designed for appliances with low-power requirements. It is also a standard from Emerge Alliance.
[25-27,30]
20 V - [29]
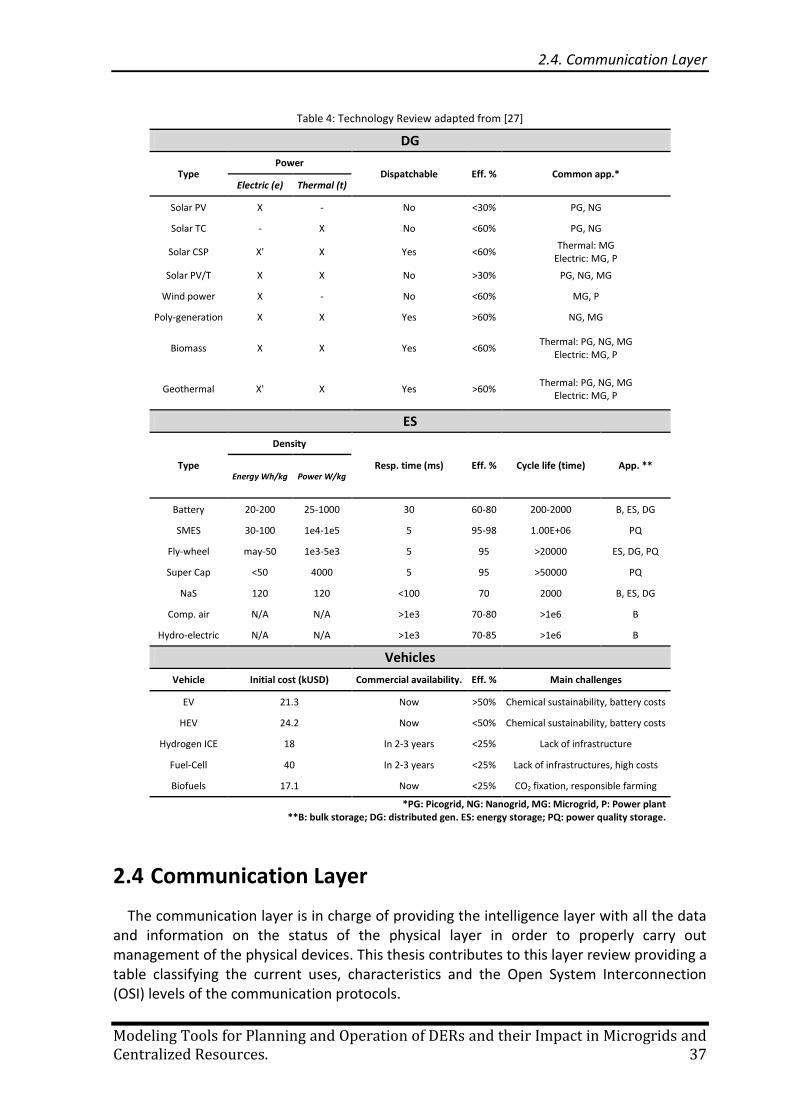
2.4. Communication Layer
Modeling Tools for Planning and Operation of DERs and their Impact in Microgrids and Centralized Resources. 37
Table 4: Technology Review adapted from [27]
DG
Type Power
Dispatchable Eff. % Common app.* Electric (e) Thermal (t)
Solar PV X - No <30% PG, NG
Solar TC - X No <60% PG, NG
Solar CSP X' X Yes <60% Thermal: MG
Electric: MG, P
Solar PV/T X X No >30% PG, NG, MG
Wind power X - No <60% MG, P
Poly-generation X X Yes >60% NG, MG
Biomass X X Yes <60% Thermal: PG, NG, MG
Electric: MG, P
Geothermal X' X Yes >60% Thermal: PG, NG, MG
Electric: MG, P
ES
Type
Density
Resp. time (ms) Eff. % Cycle life (time) App. ** Energy Wh/kg Power W/kg
Battery 20-200 25-1000 30 60-80 200-2000 B, ES, DG
SMES 30-100 1e4-1e5 5 95-98 1.00E+06 PQ
Fly-wheel may-50 1e3-5e3 5 95 >20000 ES, DG, PQ
Super Cap <50 4000 5 95 >50000 PQ
NaS 120 120 <100 70 2000 B, ES, DG
Comp. air N/A N/A >1e3 70-80 >1e6 B
Hydro-electric N/A N/A >1e3 70-85 >1e6 B
Vehicles
Vehicle Initial cost (kUSD) Commercial availability. Eff. % Main challenges
EV 21.3 Now >50% Chemical sustainability, battery costs
HEV 24.2 Now <50% Chemical sustainability, battery costs
Hydrogen ICE 18 In 2-3 years <25% Lack of infrastructure
Fuel-Cell 40 In 2-3 years <25% Lack of infrastructures, high costs
Biofuels 17.1 Now <25% CO2 fixation, responsible farming
*PG: Picogrid, NG: Nanogrid, MG: Microgrid, P: Power plant **B: bulk storage; DG: distributed gen. ES: energy storage; PQ: power quality storage.
2.4 Communication Layer
The communication layer is in charge of providing the intelligence layer with all the data and information on the status of the physical layer in order to properly carry out management of the physical devices. This thesis contributes to this layer review providing a table classifying the current uses, characteristics and the Open System Interconnection (OSI) levels of the communication protocols.
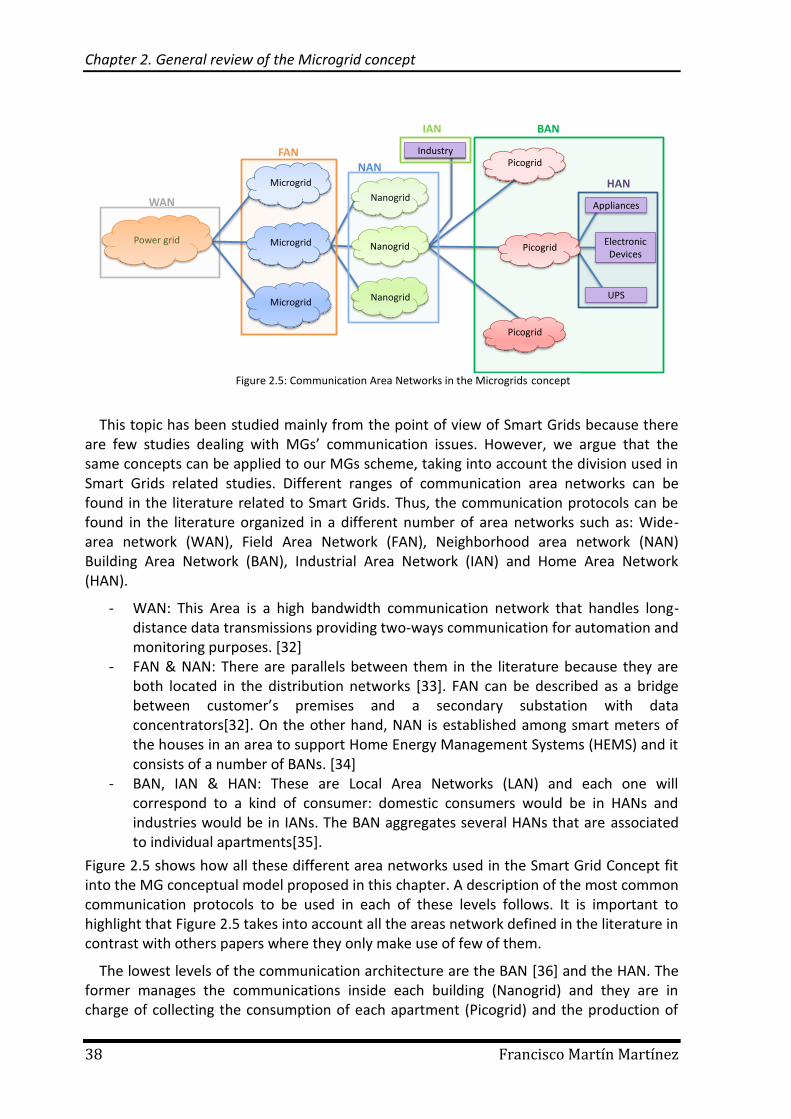
Chapter 2. General review of the Microgrid concept
38 Francisco Martín Martínez
This topic has been studied mainly from the point of view of Smart Grids because there are few studies dealing with MGs’ communication issues. However, we argue that the same concepts can be applied to our MGs scheme, taking into account the division used in Smart Grids related studies. Different ranges of communication area networks can be found in the literature related to Smart Grids. Thus, the communication protocols can be found in the literature organized in a different number of area networks such as: Wide-area network (WAN), Field Area Network (FAN), Neighborhood area network (NAN) Building Area Network (BAN), Industrial Area Network (IAN) and Home Area Network (HAN).
- WAN: This Area is a high bandwidth communication network that handles long-distance data transmissions providing two-ways communication for automation and monitoring purposes. [32]
- FAN & NAN: There are parallels between them in the literature because they are both located in the distribution networks [33]. FAN can be described as a bridge between customer’s premises and a secondary substation with data concentrators[32]. On the other hand, NAN is established among smart meters of the houses in an area to support Home Energy Management Systems (HEMS) and it consists of a number of BANs. [34]
- BAN, IAN & HAN: These are Local Area Networks (LAN) and each one will correspond to a kind of consumer: domestic consumers would be in HANs and industries would be in IANs. The BAN aggregates several HANs that are associated to individual apartments[35].
Figure 2.5 shows how all these different area networks used in the Smart Grid Concept fit into the MG conceptual model proposed in this chapter. A description of the most common communication protocols to be used in each of these levels follows. It is important to highlight that Figure 2.5 takes into account all the areas network defined in the literature in contrast with others papers where they only make use of few of them.
The lowest levels of the communication architecture are the BAN [36] and the HAN. The former manages the communications inside each building (Nanogrid) and they are in charge of collecting the consumption of each apartment (Picogrid) and the production of
Nanogrid
NanogridWAN
FANNAN
IAN BAN
HAN
IndustryPicogrid
Picogrid
Picogrid
UPS
Appliances
ElectronicDevices
NanogridPower grid Microgrid
Microgrid
Microgrid
Figure 2.5: Communication Area Networks in the Microgrids concept
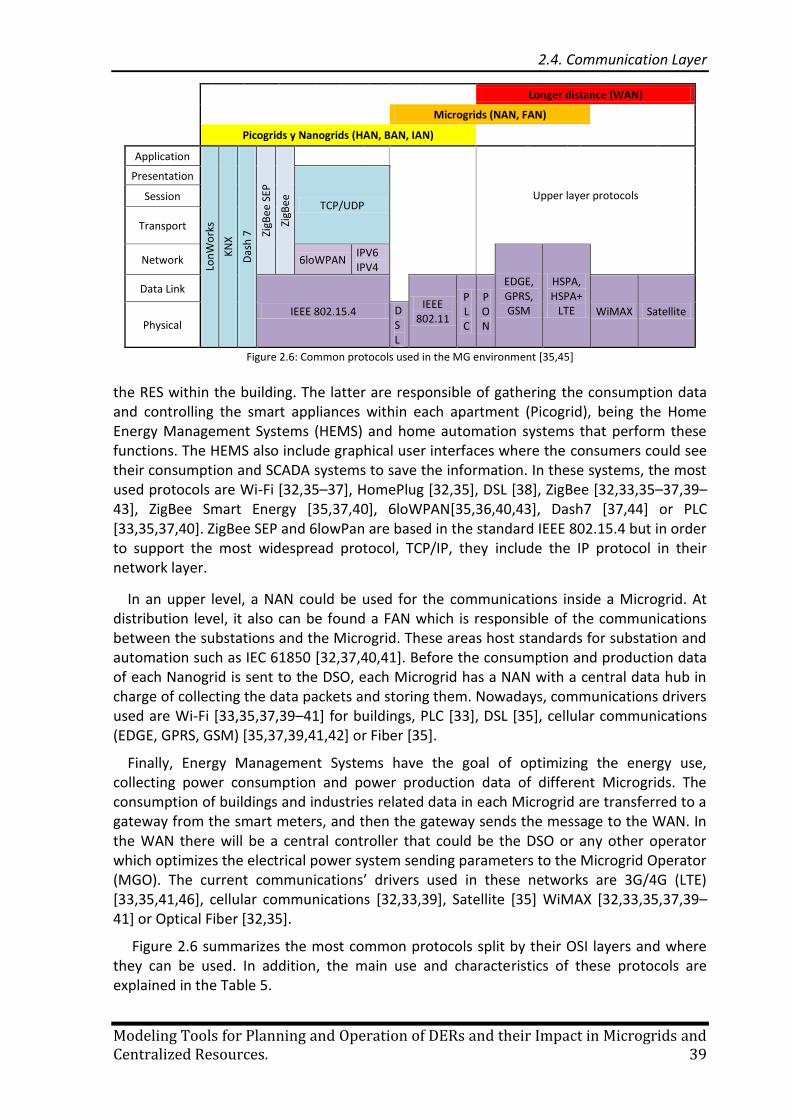
2.4. Communication Layer
Modeling Tools for Planning and Operation of DERs and their Impact in Microgrids and Centralized Resources. 39
the RES within the building. The latter are responsible of gathering the consumption data and controlling the smart appliances within each apartment (Picogrid), being the Home Energy Management Systems (HEMS) and home automation systems that perform these functions. The HEMS also include graphical user interfaces where the consumers could see their consumption and SCADA systems to save the information. In these systems, the most used protocols are Wi-Fi [32,35–37], HomePlug [32,35], DSL [38], ZigBee [32,33,35–37,39–43], ZigBee Smart Energy [35,37,40], 6loWPAN[35,36,40,43], Dash7 [37,44] or PLC [33,35,37,40]. ZigBee SEP and 6lowPan are based in the standard IEEE 802.15.4 but in order to support the most widespread protocol, TCP/IP, they include the IP protocol in their network layer.
In an upper level, a NAN could be used for the communications inside a Microgrid. At distribution level, it also can be found a FAN which is responsible of the communications between the substations and the Microgrid. These areas host standards for substation and automation such as IEC 61850 [32,37,40,41]. Before the consumption and production data of each Nanogrid is sent to the DSO, each Microgrid has a NAN with a central data hub in charge of collecting the data packets and storing them. Nowadays, communications drivers used are Wi-Fi [33,35,37,39–41] for buildings, PLC [33], DSL [35], cellular communications (EDGE, GPRS, GSM) [35,37,39,41,42] or Fiber [35].
Finally, Energy Management Systems have the goal of optimizing the energy use, collecting power consumption and power production data of different Microgrids. The consumption of buildings and industries related data in each Microgrid are transferred to a gateway from the smart meters, and then the gateway sends the message to the WAN. In the WAN there will be a central controller that could be the DSO or any other operator which optimizes the electrical power system sending parameters to the Microgrid Operator (MGO). The current communications’ drivers used in these networks are 3G/4G (LTE) [33,35,41,46], cellular communications [32,33,39], Satellite [35] WiMAX [32,33,35,37,39–41] or Optical Fiber [32,35].
Figure 2.6 summarizes the most common protocols split by their OSI layers and where they can be used. In addition, the main use and characteristics of these protocols are explained in the Table 5.
Longer distance (WAN)
Microgrids (NAN, FAN)
Picogrids y Nanogrids (HAN, BAN, IAN)
Application
Lon
Wo
rks
KN
X
Das
h 7
ZigB
ee S
EP
ZigB
ee
Upper layer protocols
Presentation
TCP/UDP Session
Transport
Network 6loWPAN IPV6 IPV4
EDGE, GPRS, GSM
HSPA, HSPA+
LTE
Data Link
IEEE 802.15.4
IEEE
802.11
PLC
PON
WiMAX Satellite Physical
DSL
Figure 2.6: Common protocols used in the MG environment [35,45]
Chapter 2. General review of the Microgrid concept
40 Francisco Martín Martínez
As shown in Table 5, there are various protocols and standards that can be used for carrying out the same work. Furthermore, the amount of protocols and standards are continuously increasing with new ones, like the ISA 100 Committee which seeks to offer standards for implementing wireless systems in the automation and control environment [47]. So, there is a strong requirement for all gateways used among the different area networks to be compatible with different standards and protocols.
The interoperability between different ways of communication will allow various different systems (HEMS, smart meters…) to share the required Smart Grid information. The open platform OGEMA (Open Gateway Energy Management Alliance) is an example of this approach at the households’ level. OGEMA was created in order to use different protocols in the same software [48]. Similarly, an ARTEMIS project known as SOFIA has the objective of connecting the physical layer with the intelligence layer maintaining interoperability between different entities [49]. In the same way, the concept of Internet of Things is being used [43], where all the devices are connected to the Internet with a unique IP and they can share data between them.
Other companies have developed their own protocols such as IBM which has implemented the MQTT protocol [50]. The purpose of MQTT is to be an open protocol in order to be used in smart energy meters, industrial control systems, sensors and any device able to communicate messages. In that sense, IBM has developed an event management system called Intelligent Operations Center (IOC) that uses this protocol to extend its range. However, there are also public initiatives such as FIWARE [51] from the European union which is a middleware platform in order to develop different applications that can use different protocols underneath.
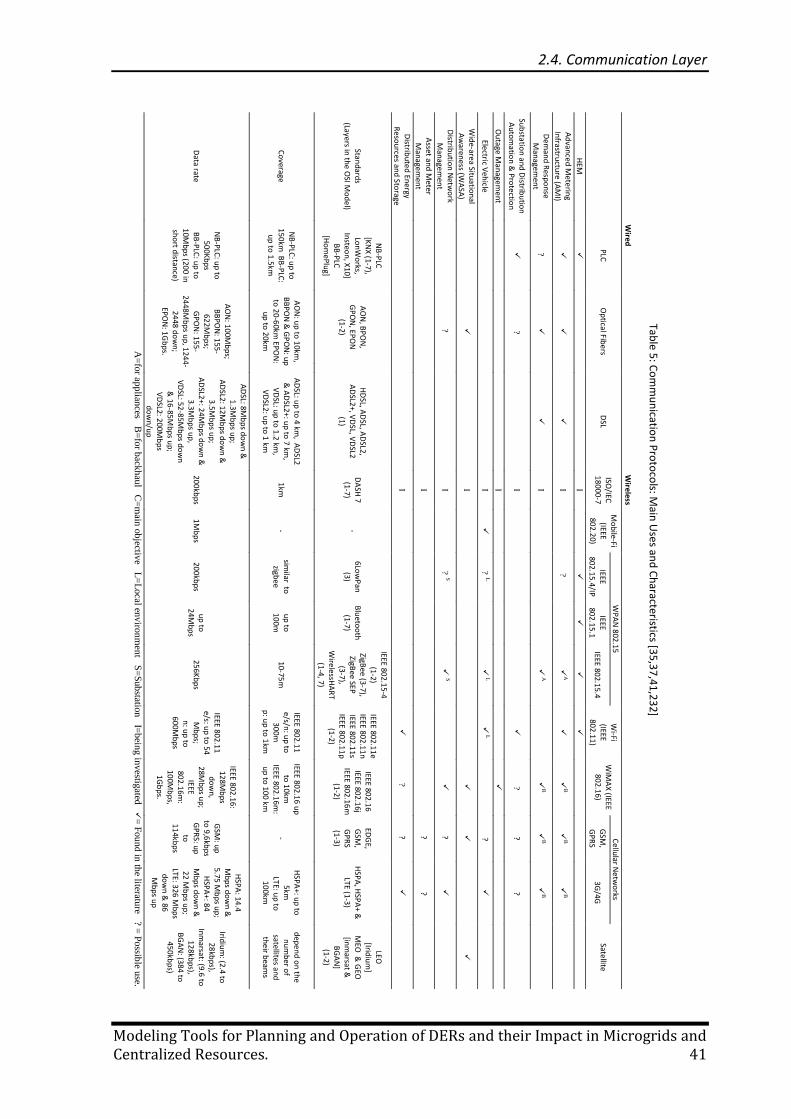
2.4. Communication Layer
Modeling Tools for Planning and Operation of DERs and their Impact in Microgrids and Centralized Resources. 41
W
ired
Wireless
P
LC
Op
tical Fibe
rs D
SL ISO
/IEC
1800
0-7
Mo
bile
-Fi (IEEE
802.2
0)
WP
AN
802.15
W
i-Fi (IEEE
802.1
1)
WiM
AX
(IEEE 80
2.16)
Cellu
lar Ne
two
rks
Satellite
IEEE 80
2.15.4/IP
IEEE
802.1
5.1
IEEE 802.1
5.4
GSM
, G
PR
S 3G
/4G
HEM
I
Ad
vance
d M
eterin
g In
frastructu
re (AM
I)
I
?
A
B
B
B
Dem
and
Resp
on
se M
anage
men
t ?
I
A
B
B
B
Sub
station
and
Distrib
utio
n
Au
tom
ation
& P
rotectio
n
?
I
?
? ?
Ou
tage Man
agem
en
t
I
Electric Veh
icle
I
? L
L
L
?
Wid
e-area Situ
ation
al A
waren
ess (WA
SA)
I
Distrib
utio
n N
etwo
rk M
anage
men
t
?
I
? S
S
?
Asset an
d M
eter M
anage
men
t
I
?
?
Distrib
ute
d En
ergy
Reso
urces an
d Sto
rage
I
?
?
Stand
ards
(Layers in th
e O
SI Mo
de
l)
NB
-PLC
[K
NX
(1-7), Lo
nW
orks,
Insteo
n, X
10] B
B-P
LC
[Ho
meP
lug]
AO
N, B
PO
N,
GP
ON
, EPO
N
(1-2)
HD
SL, AD
SL, AD
SL2, A
DSL2+, V
DSL, V
DSL2
(1)
DA
SH 7
(1-7) -
6Low
Pan
(3)
Blu
etoo
th
(1-7)
IEEE 802.1
5-4
(1-2)
ZigBee
(3-7),
ZigBee
SEP
(3-7), W
irelessHA
RT
(1-4, 7)
IEEE 802.1
1e IEEE 80
2.11
n
IEEE 802.1
1s IEEE 80
2.11
p
(1-2)
IEEE 802.1
6 IEEE 80
2.16j
IEEE 802.1
6m
(1-2)
EDG
E, G
SM,
GP
RS
(1-3)
HSP
A, H
SPA
+ &
LTE (1-3)
LEO
[Iridiu
m]
MEO
& G
EO
[inm
arsat &
BG
AN
] (1-2)
Co
verage
NB
-PLC
: up
to
150km
BB
-PLC
: u
p to
1.5km
AO
N: u
p to
10km
, B
BP
ON
& G
PO
N: u
p
to 2
0-6
0km EP
ON
: u
p to
20km
AD
SL: up
to 4
km, A
DSL2
& A
DSL2+: u
p to
7 km,
VD
SL: up
to 1.2 km
, V
DSL2: u
p to
1 km
1km
- sim
ilar to
zigbee
u
p to
10
0m
10-75m
IEEE 802.1
1
e/s/n: u
p to
30
0m
p: u
p to
1km
IEEE 802.1
6 up
to
10km
IEEE 80
2.16
m:
up
to 10
0 km
-
HSP
A+: u
p to
5km
LTE: u
p to
10
0km
dep
en
d o
n th
e n
um
ber o
f satellites an
d
the
ir beam
s
Data rate
NB
-PLC
: up
to
500K
bp
s B
B-P
LC: u
p to
10M
bp
s (200 in
sh
ort d
istance)
AO
N: 1
00M
bp
s; B
BP
ON
: 155
-62
2Mb
ps;
GP
ON
: 155
-24
48Mb
ps u
p, 1
244
-24
48 do
wn
; EP
ON
: 1Gb
ps.
AD
SL: 8Mb
ps d
ow
n &
1.3M
bp
s up
; A
DSL2: 12M
bp
s do
wn
&
3.5Mb
ps u
p;
AD
SL2+: 24M
bp
s do
wn
&
3.3Mb
ps u
p,
VD
SL: 52-85M
bp
s do
wn
&
16-85M
bp
s up
; V
DSL2: 2
00Mb
ps
do
wn
/up
200kb
ps
1Mb
ps
200kb
ps
up
to
24Mb
ps
256K
bp
s
IEEE 802.1
1
e/s: up
to 54
Mb
ps;
n: u
p to
60
0Mb
ps
IEEE 802.1
6: 12
8Mb
ps
do
wn
, 28M
bp
s up
; IEEE
802.1
6m:
100M
bp
s, 1G
bp
s.
GSM
: up
to
9,6
kbp
s G
PR
S: up
to
11
4kbp
s
HSP
A: 14.4
Mb
ps d
ow
n &
5.75
Mb
ps u
p;
HSP
A+: 84
Mb
ps d
ow
n &
22 M
bp
s up
; LTE: 3
26 Mb
ps
do
wn
& 86
Mb
ps u
p
Iridiu
m: (2.4 to
28
kbp
s), In
marsat: (9.6 to
12
8kbp
s), B
GA
N: (384 to
45
0kbp
s)
A=
for ap
plian
ces B=
for b
ackh
aul C
=m
ain o
bjectiv
e L=
Local en
viro
nm
ent S
=S
ub
station
I=b
eing in
vestig
ated
= F
ou
nd
in th
e literature ? =
Possib
le use.
Table 5
: Co
mm
un
ication
Pro
toco
ls: Main
Uses an
d C
haracteristics [3
5,3
7,4
1,2
32
]
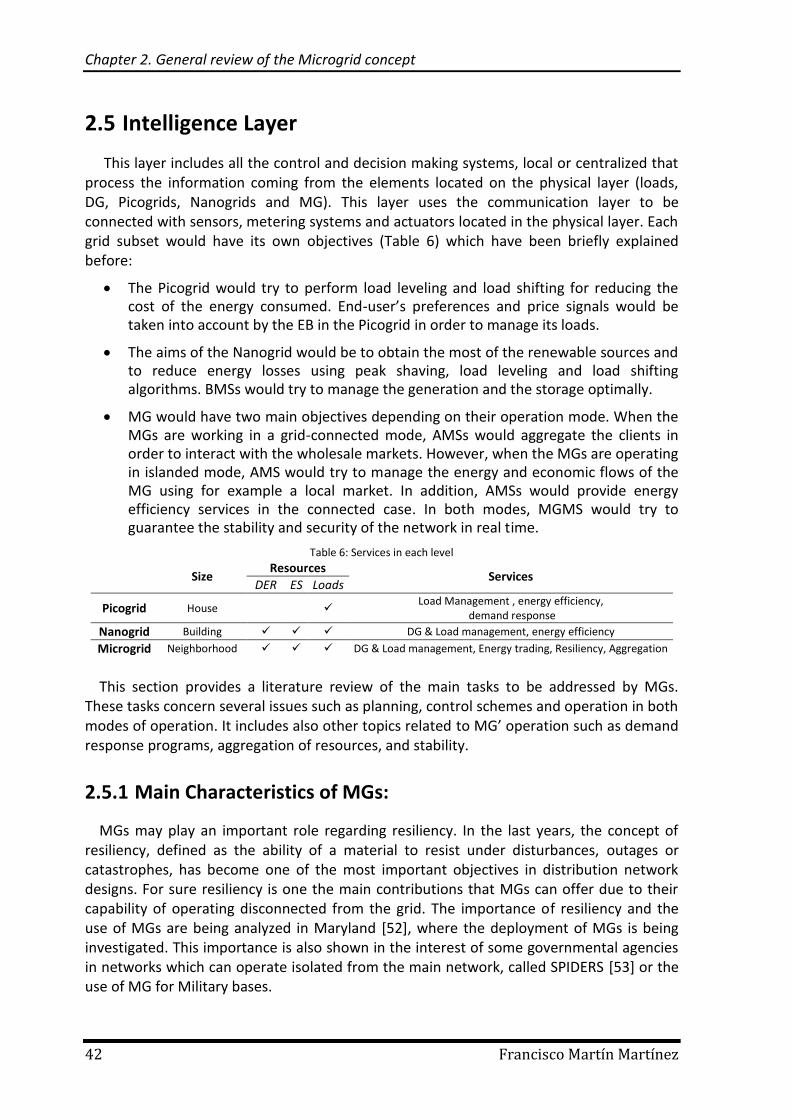
Chapter 2. General review of the Microgrid concept
42 Francisco Martín Martínez
2.5 Intelligence Layer
This layer includes all the control and decision making systems, local or centralized that process the information coming from the elements located on the physical layer (loads, DG, Picogrids, Nanogrids and MG). This layer uses the communication layer to be connected with sensors, metering systems and actuators located in the physical layer. Each grid subset would have its own objectives (Table 6) which have been briefly explained before:
The Picogrid would try to perform load leveling and load shifting for reducing the cost of the energy consumed. End-user’s preferences and price signals would be taken into account by the EB in the Picogrid in order to manage its loads.
The aims of the Nanogrid would be to obtain the most of the renewable sources and to reduce energy losses using peak shaving, load leveling and load shifting algorithms. BMSs would try to manage the generation and the storage optimally.
MG would have two main objectives depending on their operation mode. When the MGs are working in a grid-connected mode, AMSs would aggregate the clients in order to interact with the wholesale markets. However, when the MGs are operating in islanded mode, AMS would try to manage the energy and economic flows of the MG using for example a local market. In addition, AMSs would provide energy efficiency services in the connected case. In both modes, MGMS would try to guarantee the stability and security of the network in real time.
Table 6: Services in each level
Size Resources
Services
DER ES Loads
Picogrid House
Load Management , energy efficiency,
demand response
Nanogrid Building DG & Load management, energy efficiency
Microgrid Neighborhood DG & Load management, Energy trading, Resiliency, Aggregation
This section provides a literature review of the main tasks to be addressed by MGs. These tasks concern several issues such as planning, control schemes and operation in both modes of operation. It includes also other topics related to MG’ operation such as demand response programs, aggregation of resources, and stability.
2.5.1 Main Characteristics of MGs:
MGs may play an important role regarding resiliency. In the last years, the concept of resiliency, defined as the ability of a material to resist under disturbances, outages or catastrophes, has become one of the most important objectives in distribution network designs. For sure resiliency is one the main contributions that MGs can offer due to their capability of operating disconnected from the grid. The importance of resiliency and the use of MGs are being analyzed in Maryland [52], where the deployment of MGs is being investigated. This importance is also shown in the interest of some governmental agencies in networks which can operate isolated from the main network, called SPIDERS [53] or the use of MG for Military bases.
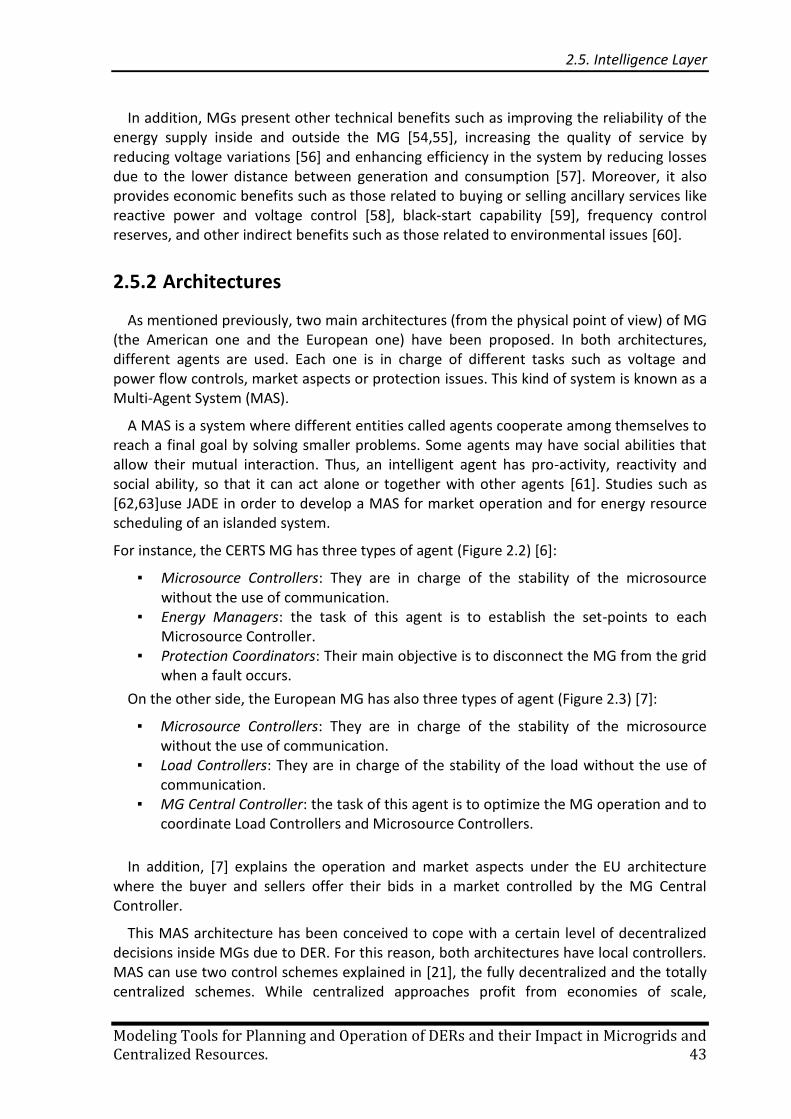
2.5. Intelligence Layer
Modeling Tools for Planning and Operation of DERs and their Impact in Microgrids and Centralized Resources. 43
In addition, MGs present other technical benefits such as improving the reliability of the energy supply inside and outside the MG [54,55], increasing the quality of service by reducing voltage variations [56] and enhancing efficiency in the system by reducing losses due to the lower distance between generation and consumption [57]. Moreover, it also provides economic benefits such as those related to buying or selling ancillary services like reactive power and voltage control [58], black-start capability [59], frequency control reserves, and other indirect benefits such as those related to environmental issues [60].
2.5.2 Architectures
As mentioned previously, two main architectures (from the physical point of view) of MG (the American one and the European one) have been proposed. In both architectures, different agents are used. Each one is in charge of different tasks such as voltage and power flow controls, market aspects or protection issues. This kind of system is known as a Multi-Agent System (MAS).
A MAS is a system where different entities called agents cooperate among themselves to reach a final goal by solving smaller problems. Some agents may have social abilities that allow their mutual interaction. Thus, an intelligent agent has pro-activity, reactivity and social ability, so that it can act alone or together with other agents [61]. Studies such as [62,63]use JADE in order to develop a MAS for market operation and for energy resource scheduling of an islanded system.
For instance, the CERTS MG has three types of agent (Figure 2.2) [6]:
▪ Microsource Controllers: They are in charge of the stability of the microsource without the use of communication.
▪ Energy Managers: the task of this agent is to establish the set-points to each Microsource Controller.
▪ Protection Coordinators: Their main objective is to disconnect the MG from the grid when a fault occurs.
On the other side, the European MG has also three types of agent (Figure 2.3) [7]:
▪ Microsource Controllers: They are in charge of the stability of the microsource without the use of communication.
▪ Load Controllers: They are in charge of the stability of the load without the use of communication.
▪ MG Central Controller: the task of this agent is to optimize the MG operation and to coordinate Load Controllers and Microsource Controllers.
In addition, [7] explains the operation and market aspects under the EU architecture where the buyer and sellers offer their bids in a market controlled by the MG Central Controller.
This MAS architecture has been conceived to cope with a certain level of decentralized decisions inside MGs due to DER. For this reason, both architectures have local controllers. MAS can use two control schemes explained in [21], the fully decentralized and the totally centralized schemes. While centralized approaches profit from economies of scale,
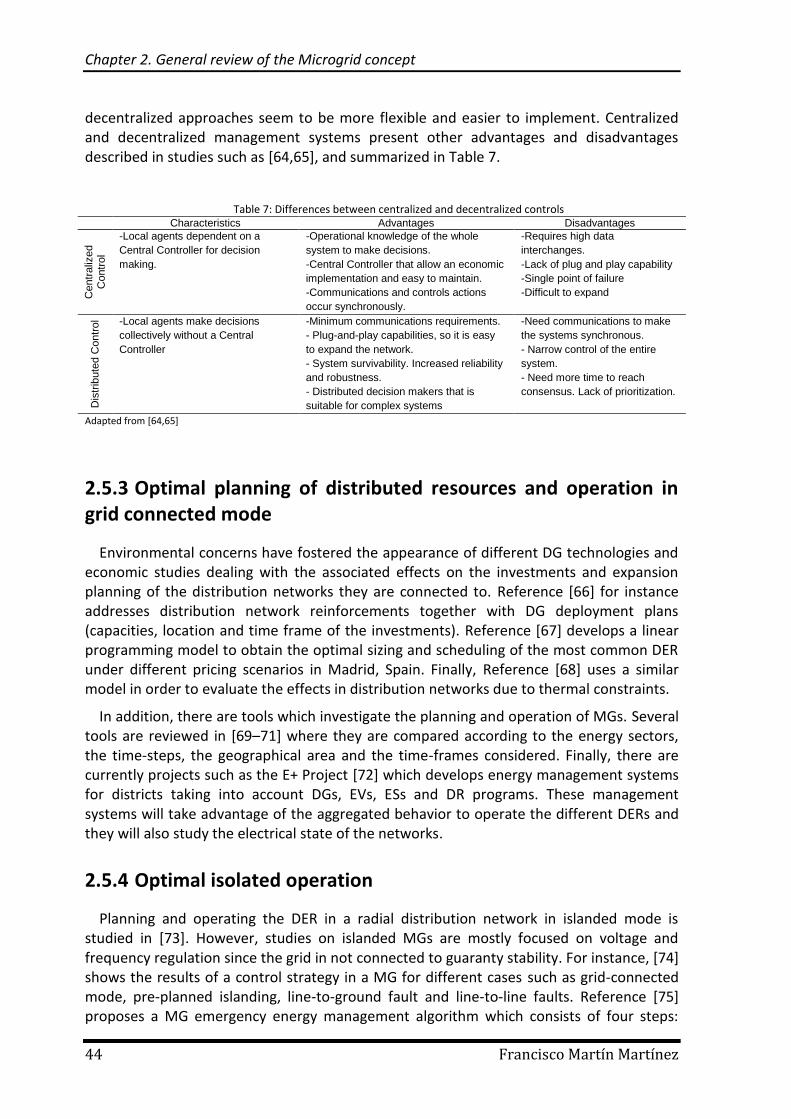
Chapter 2. General review of the Microgrid concept
44 Francisco Martín Martínez
decentralized approaches seem to be more flexible and easier to implement. Centralized and decentralized management systems present other advantages and disadvantages described in studies such as [64,65], and summarized in Table 7.
Table 7: Differences between centralized and decentralized controls
Characteristics Advantages Disadvantages
Centr
aliz
ed
Contr
ol
-Local agents dependent on a
Central Controller for decision
making.
-Operational knowledge of the whole
system to make decisions.
-Central Controller that allow an economic
implementation and easy to maintain.
-Communications and controls actions
occur synchronously.
-Requires high data
interchanges.
-Lack of plug and play capability
-Single point of failure
-Difficult to expand
Dis
trib
ute
d C
ontr
ol -Local agents make decisions
collectively without a Central
Controller
-Minimum communications requirements.
- Plug-and-play capabilities, so it is easy
to expand the network.
- System survivability. Increased reliability
and robustness.
- Distributed decision makers that is
suitable for complex systems
-Need communications to make
the systems synchronous.
- Narrow control of the entire
system.
- Need more time to reach
consensus. Lack of prioritization.
Adapted from [64,65]
2.5.3 Optimal planning of distributed resources and operation in grid connected mode
Environmental concerns have fostered the appearance of different DG technologies and economic studies dealing with the associated effects on the investments and expansion planning of the distribution networks they are connected to. Reference [66] for instance addresses distribution network reinforcements together with DG deployment plans (capacities, location and time frame of the investments). Reference [67] develops a linear programming model to obtain the optimal sizing and scheduling of the most common DER under different pricing scenarios in Madrid, Spain. Finally, Reference [68] uses a similar model in order to evaluate the effects in distribution networks due to thermal constraints.
In addition, there are tools which investigate the planning and operation of MGs. Several tools are reviewed in [69–71] where they are compared according to the energy sectors, the time-steps, the geographical area and the time-frames considered. Finally, there are currently projects such as the E+ Project [72] which develops energy management systems for districts taking into account DGs, EVs, ESs and DR programs. These management systems will take advantage of the aggregated behavior to operate the different DERs and they will also study the electrical state of the networks.
2.5.4 Optimal isolated operation
Planning and operating the DER in a radial distribution network in islanded mode is studied in [73]. However, studies on islanded MGs are mostly focused on voltage and frequency regulation since the grid in not connected to guaranty stability. For instance, [74] shows the results of a control strategy in a MG for different cases such as grid-connected mode, pre-planned islanding, line-to-ground fault and line-to-line faults. Reference [75] proposes a MG emergency energy management algorithm which consists of four steps:
2.5. Intelligence Layer
Modeling Tools for Planning and Operation of DERs and their Impact in Microgrids and Centralized Resources. 45
characterizing the current operating state, determining the power of the disturbance, determining the amount of load to be shed and evaluating the security of the MG during the emergency state.
Some of the projects like MICROGRID describe their algorithms and strategies in the deliverables corresponding to Work Package B (WPB), WPC and WPD [76]. These deliverables include the algorithms for all agents and algorithms of the islanded mode. Furthermore, the MORE MICROGRID project, see especially WPG [77] studies the operation of MGs in both modes and they find out that a local market offers a chance for trading between DG and end consumers. Some mathematical models (crisp or fuzzy linear models) developed under this project and related to markets’ operation are described in [78].
Although this project mentions the idea of local markets and some initiatives are starting to use this approach, it is not clear in the literature how the units’ production is going to be set in the isolated mode (see Chapter 4). For instance, in [79] DERs in a MG act as VPP and they belong to the same owner who uses priorities to set their operation. Another example is found in [63] where the islanded system is made up of several loads and three MGs that participate in the local wholesale electricity market.
2.5.5 Demand Response
The concept of demand response can be useful for a MG in order to manage the loads and to distribute the consumption among hours. In grid-connected mode, DR is used to achieve economic benefits whereas in islanded mode is useful mainly for security of supply motives.
DR is defined in the literature [80–82] as any way to inform the end-consumer about their energy usage in order to encourage them to modify it, in response to changes in prices either due to some contingence or to high wholesale market prices. Reference [83] concludes that DR will lead to 202 TWh of annual savings, 100 million tons/year of CO2 emissions reduction, avoid €50bn of investment and provokes an annual electricity bill savings of €25bn by 2020 in Europe. Finally, an analysis under different test systems and penetration levels of DR resources (loads that compete side by side with supply- side resources in the wholesale market) is done in [84] in order to study the economic and emission impacts of DR resources curtailments.
The costs and benefits of DR are studied in the literature. They are classified per activity in the power system (generation, transmission, distribution and consumers) in [85]. The main implementations of DR in USA, China and Europe are reviewed in [86] where the costs and benefits are divided in seven final categories depending if they are investment costs or operating costs.
As reviewed in [85] there are different criteria for classifying DR programs (DRP) (see Table 8): the final purpose (reliability and/or economics) [82], the trigger factor (incentive or price based) [87], the origin of the signal (system-led or market-led) [88], the type of signal (load or price response), the motivation method (incentive- or time- based) [81] and the type of control (direct or passive load control) [5]. In the FERC survey [81] fifteen DRP are identified, classified in Incentive-Based Programs, Time Based Programs, and other categories.
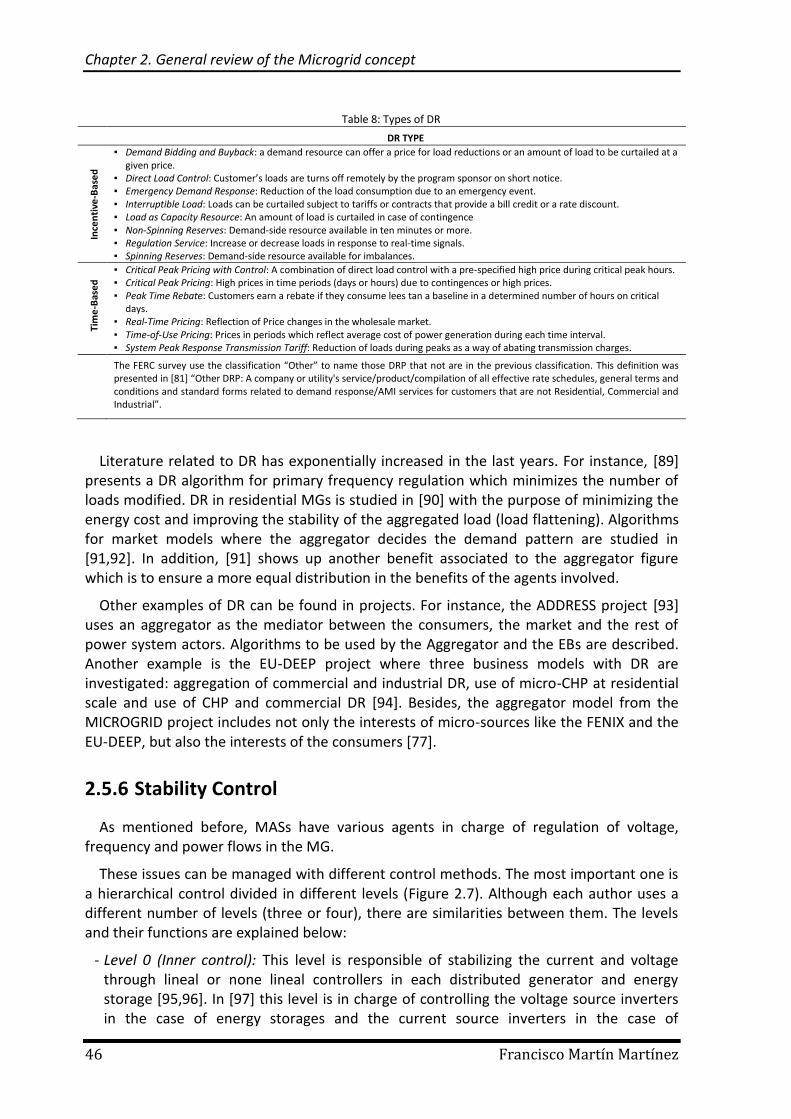
Chapter 2. General review of the Microgrid concept
46 Francisco Martín Martínez
Table 8: Types of DR
DR TYPE
Ince
nti
ve-B
ase
d
▪ Demand Bidding and Buyback: a demand resource can offer a price for load reductions or an amount of load to be curtailed at a given price.
▪ Direct Load Control: Customer’s loads are turns off remotely by the program sponsor on short notice. ▪ Emergency Demand Response: Reduction of the load consumption due to an emergency event. ▪ Interruptible Load: Loads can be curtailed subject to tariffs or contracts that provide a bill credit or a rate discount. ▪ Load as Capacity Resource: An amount of load is curtailed in case of contingence ▪ Non-Spinning Reserves: Demand-side resource available in ten minutes or more. ▪ Regulation Service: Increase or decrease loads in response to real-time signals. ▪ Spinning Reserves: Demand-side resource available for imbalances.
Tim
e-B
ase
d
▪ Critical Peak Pricing with Control: A combination of direct load control with a pre-specified high price during critical peak hours. ▪ Critical Peak Pricing: High prices in time periods (days or hours) due to contingences or high prices. ▪ Peak Time Rebate: Customers earn a rebate if they consume lees tan a baseline in a determined number of hours on critical
days. ▪ Real-Time Pricing: Reflection of Price changes in the wholesale market. ▪ Time-of-Use Pricing: Prices in periods which reflect average cost of power generation during each time interval. ▪ System Peak Response Transmission Tariff: Reduction of loads during peaks as a way of abating transmission charges.
The FERC survey use the classification “Other” to name those DRP that not are in the previous classification. This definition was presented in [81] “Other DRP: A company or utility's service/product/compilation of all effective rate schedules, general terms and conditions and standard forms related to demand response/AMI services for customers that are not Residential, Commercial and Industrial”.
Literature related to DR has exponentially increased in the last years. For instance, [89] presents a DR algorithm for primary frequency regulation which minimizes the number of loads modified. DR in residential MGs is studied in [90] with the purpose of minimizing the energy cost and improving the stability of the aggregated load (load flattening). Algorithms for market models where the aggregator decides the demand pattern are studied in [91,92]. In addition, [91] shows up another benefit associated to the aggregator figure which is to ensure a more equal distribution in the benefits of the agents involved.
Other examples of DR can be found in projects. For instance, the ADDRESS project [93] uses an aggregator as the mediator between the consumers, the market and the rest of power system actors. Algorithms to be used by the Aggregator and the EBs are described. Another example is the EU-DEEP project where three business models with DR are investigated: aggregation of commercial and industrial DR, use of micro-CHP at residential scale and use of CHP and commercial DR [94]. Besides, the aggregator model from the MICROGRID project includes not only the interests of micro-sources like the FENIX and the EU-DEEP, but also the interests of the consumers [77].
2.5.6 Stability Control
As mentioned before, MASs have various agents in charge of regulation of voltage, frequency and power flows in the MG.
These issues can be managed with different control methods. The most important one is a hierarchical control divided in different levels (Figure 2.7). Although each author uses a different number of levels (three or four), there are similarities between them. The levels and their functions are explained below:
- Level 0 (Inner control): This level is responsible of stabilizing the current and voltage through lineal or none lineal controllers in each distributed generator and energy storage [95,96]. In [97] this level is in charge of controlling the voltage source inverters in the case of energy storages and the current source inverters in the case of
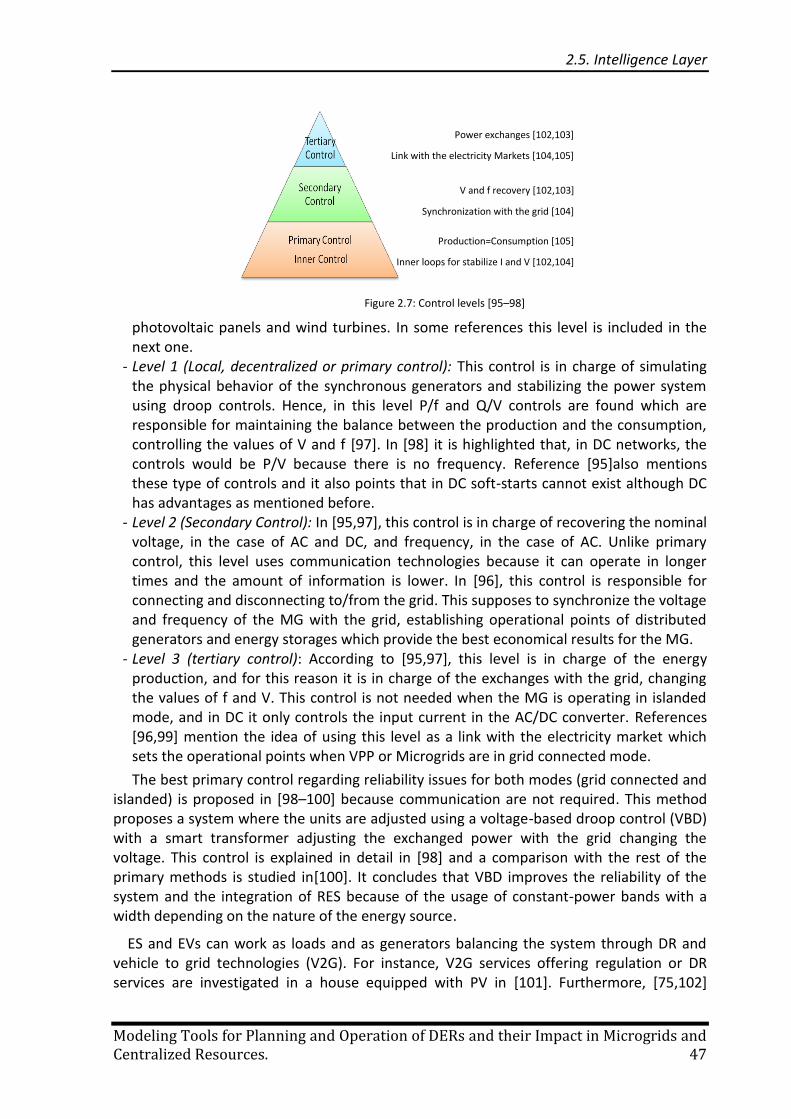
2.5. Intelligence Layer
Modeling Tools for Planning and Operation of DERs and their Impact in Microgrids and Centralized Resources. 47
photovoltaic panels and wind turbines. In some references this level is included in the next one.
- Level 1 (Local, decentralized or primary control): This control is in charge of simulating the physical behavior of the synchronous generators and stabilizing the power system using droop controls. Hence, in this level P/f and Q/V controls are found which are responsible for maintaining the balance between the production and the consumption, controlling the values of V and f [97]. In [98] it is highlighted that, in DC networks, the controls would be P/V because there is no frequency. Reference [95]also mentions these type of controls and it also points that in DC soft-starts cannot exist although DC has advantages as mentioned before.
- Level 2 (Secondary Control): In [95,97], this control is in charge of recovering the nominal voltage, in the case of AC and DC, and frequency, in the case of AC. Unlike primary control, this level uses communication technologies because it can operate in longer times and the amount of information is lower. In [96], this control is responsible for connecting and disconnecting to/from the grid. This supposes to synchronize the voltage and frequency of the MG with the grid, establishing operational points of distributed generators and energy storages which provide the best economical results for the MG.
- Level 3 (tertiary control): According to [95,97], this level is in charge of the energy production, and for this reason it is in charge of the exchanges with the grid, changing the values of f and V. This control is not needed when the MG is operating in islanded mode, and in DC it only controls the input current in the AC/DC converter. References [96,99] mention the idea of using this level as a link with the electricity market which sets the operational points when VPP or Microgrids are in grid connected mode.
The best primary control regarding reliability issues for both modes (grid connected and islanded) is proposed in [98–100] because communication are not required. This method proposes a system where the units are adjusted using a voltage-based droop control (VBD) with a smart transformer adjusting the exchanged power with the grid changing the voltage. This control is explained in detail in [98] and a comparison with the rest of the primary methods is studied in[100]. It concludes that VBD improves the reliability of the system and the integration of RES because of the usage of constant-power bands with a width depending on the nature of the energy source.
ES and EVs can work as loads and as generators balancing the system through DR and vehicle to grid technologies (V2G). For instance, V2G services offering regulation or DR services are investigated in a house equipped with PV in [101]. Furthermore, [75,102]
Power exchanges [102,103]
Link with the electricity Markets [104,105]
V and f recovery [102,103]
Synchronization with the grid [104]
Production=Consumption [105]
Inner loops for stabilize I and V [102,104]
Figure 2.7: Control levels [95–98]
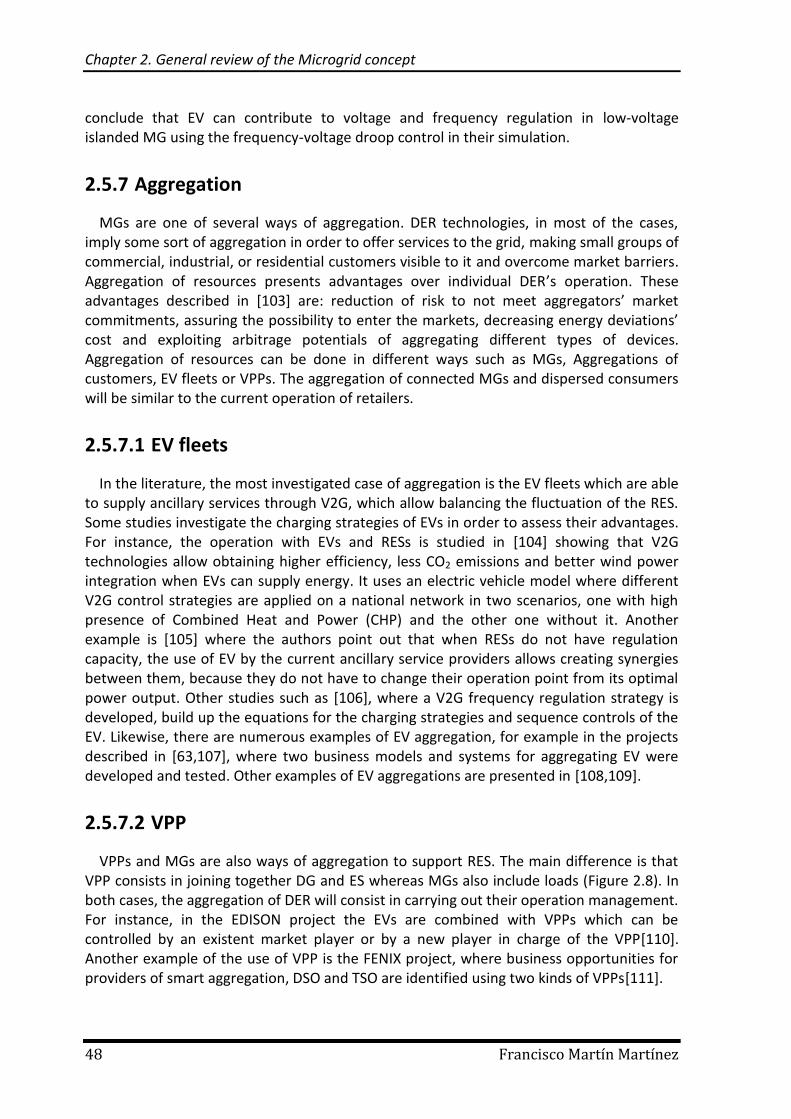
Chapter 2. General review of the Microgrid concept
48 Francisco Martín Martínez
conclude that EV can contribute to voltage and frequency regulation in low-voltage islanded MG using the frequency-voltage droop control in their simulation.
2.5.7 Aggregation
MGs are one of several ways of aggregation. DER technologies, in most of the cases, imply some sort of aggregation in order to offer services to the grid, making small groups of commercial, industrial, or residential customers visible to it and overcome market barriers. Aggregation of resources presents advantages over individual DER’s operation. These advantages described in [103] are: reduction of risk to not meet aggregators’ market commitments, assuring the possibility to enter the markets, decreasing energy deviations’ cost and exploiting arbitrage potentials of aggregating different types of devices. Aggregation of resources can be done in different ways such as MGs, Aggregations of customers, EV fleets or VPPs. The aggregation of connected MGs and dispersed consumers will be similar to the current operation of retailers.
2.5.7.1 EV fleets
In the literature, the most investigated case of aggregation is the EV fleets which are able to supply ancillary services through V2G, which allow balancing the fluctuation of the RES. Some studies investigate the charging strategies of EVs in order to assess their advantages. For instance, the operation with EVs and RESs is studied in [104] showing that V2G technologies allow obtaining higher efficiency, less CO2 emissions and better wind power integration when EVs can supply energy. It uses an electric vehicle model where different V2G control strategies are applied on a national network in two scenarios, one with high presence of Combined Heat and Power (CHP) and the other one without it. Another example is [105] where the authors point out that when RESs do not have regulation capacity, the use of EV by the current ancillary service providers allows creating synergies between them, because they do not have to change their operation point from its optimal power output. Other studies such as [106], where a V2G frequency regulation strategy is developed, build up the equations for the charging strategies and sequence controls of the EV. Likewise, there are numerous examples of EV aggregation, for example in the projects described in [63,107], where two business models and systems for aggregating EV were developed and tested. Other examples of EV aggregations are presented in [108,109].
2.5.7.2 VPP
VPPs and MGs are also ways of aggregation to support RES. The main difference is that VPP consists in joining together DG and ES whereas MGs also include loads (Figure 2.8). In both cases, the aggregation of DER will consist in carrying out their operation management. For instance, in the EDISON project the EVs are combined with VPPs which can be controlled by an existent market player or by a new player in charge of the VPP[110]. Another example of the use of VPP is the FENIX project, where business opportunities for providers of smart aggregation, DSO and TSO are identified using two kinds of VPPs[111].
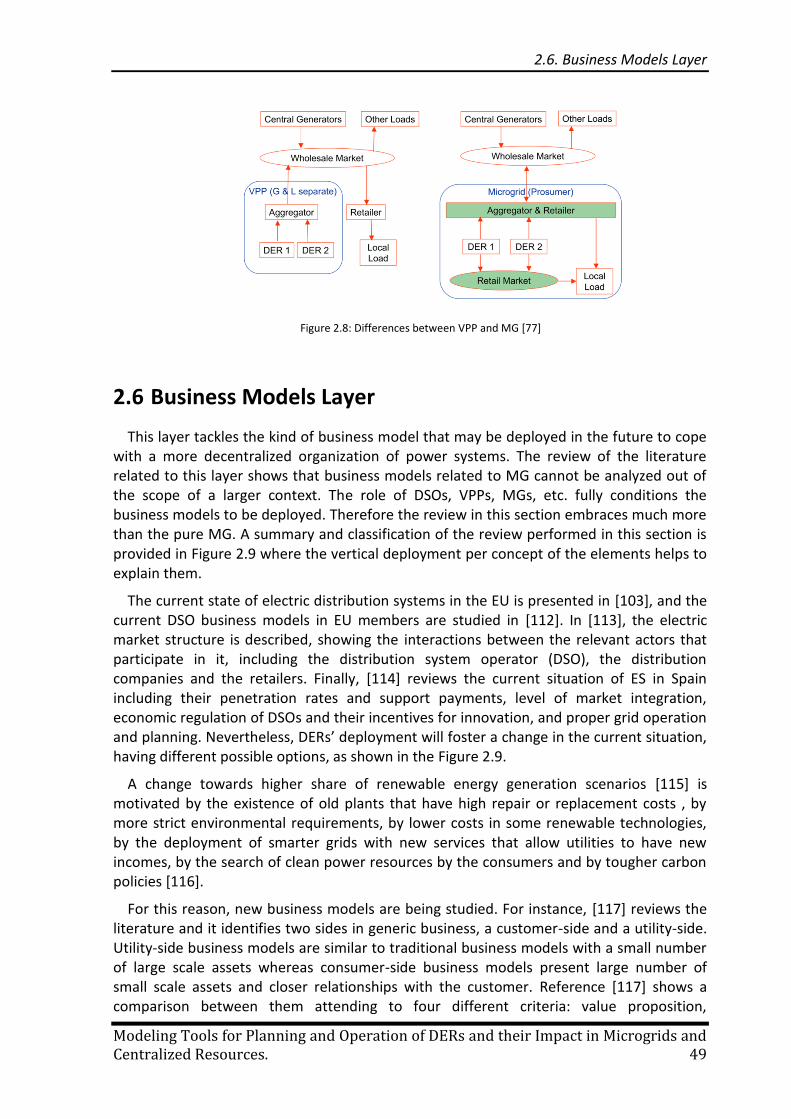
2.6. Business Models Layer
Modeling Tools for Planning and Operation of DERs and their Impact in Microgrids and Centralized Resources. 49
2.6 Business Models Layer
This layer tackles the kind of business model that may be deployed in the future to cope with a more decentralized organization of power systems. The review of the literature related to this layer shows that business models related to MG cannot be analyzed out of the scope of a larger context. The role of DSOs, VPPs, MGs, etc. fully conditions the business models to be deployed. Therefore the review in this section embraces much more than the pure MG. A summary and classification of the review performed in this section is provided in Figure 2.9 where the vertical deployment per concept of the elements helps to explain them.
The current state of electric distribution systems in the EU is presented in [103], and the current DSO business models in EU members are studied in [112]. In [113], the electric market structure is described, showing the interactions between the relevant actors that participate in it, including the distribution system operator (DSO), the distribution companies and the retailers. Finally, [114] reviews the current situation of ES in Spain including their penetration rates and support payments, level of market integration, economic regulation of DSOs and their incentives for innovation, and proper grid operation and planning. Nevertheless, DERs’ deployment will foster a change in the current situation, having different possible options, as shown in the Figure 2.9.
A change towards higher share of renewable energy generation scenarios [115] is motivated by the existence of old plants that have high repair or replacement costs , by more strict environmental requirements, by lower costs in some renewable technologies, by the deployment of smarter grids with new services that allow utilities to have new incomes, by the search of clean power resources by the consumers and by tougher carbon policies [116].
For this reason, new business models are being studied. For instance, [117] reviews the literature and it identifies two sides in generic business, a customer-side and a utility-side. Utility-side business models are similar to traditional business models with a small number of large scale assets whereas consumer-side business models present large number of small scale assets and closer relationships with the customer. Reference [117] shows a comparison between them attending to four different criteria: value proposition,
Figure 2.8: Differences between VPP and MG [77]
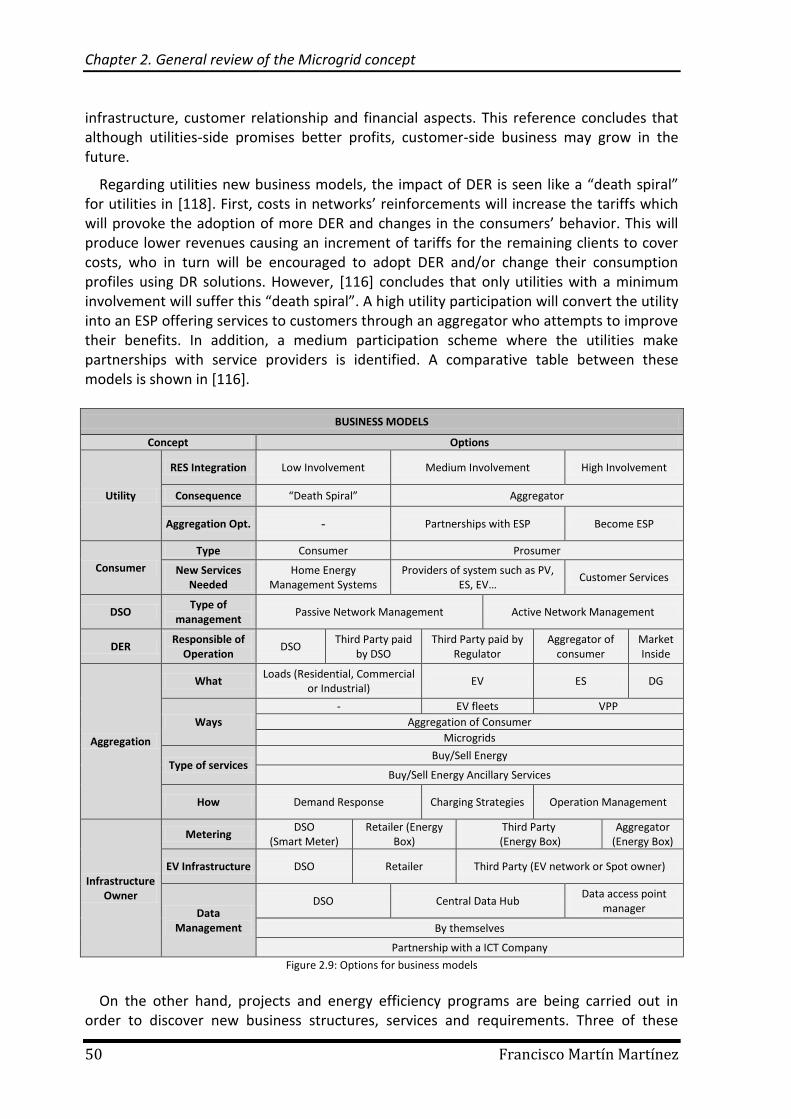
Chapter 2. General review of the Microgrid concept
50 Francisco Martín Martínez
infrastructure, customer relationship and financial aspects. This reference concludes that although utilities-side promises better profits, customer-side business may grow in the future.
Regarding utilities new business models, the impact of DER is seen like a “death spiral” for utilities in [118]. First, costs in networks’ reinforcements will increase the tariffs which will provoke the adoption of more DER and changes in the consumers’ behavior. This will produce lower revenues causing an increment of tariffs for the remaining clients to cover costs, who in turn will be encouraged to adopt DER and/or change their consumption profiles using DR solutions. However, [116] concludes that only utilities with a minimum involvement will suffer this “death spiral”. A high utility participation will convert the utility into an ESP offering services to customers through an aggregator who attempts to improve their benefits. In addition, a medium participation scheme where the utilities make partnerships with service providers is identified. A comparative table between these models is shown in [116].
On the other hand, projects and energy efficiency programs are being carried out in order to discover new business structures, services and requirements. Three of these
BUSINESS MODELS
Concept Options
Utility
RES Integration Low Involvement Medium Involvement High Involvement
Consequence “Death Spiral” Aggregator
Aggregation Opt. - Partnerships with ESP Become ESP
Consumer
Type Consumer Prosumer
New Services Needed
Home Energy Management Systems
Providers of system such as PV, ES, EV…
Customer Services
DSO Type of
management Passive Network Management Active Network Management
DER Responsible of
Operation DSO
Third Party paid by DSO
Third Party paid by Regulator
Aggregator of consumer
Market Inside
Aggregation
What Loads (Residential, Commercial
or Industrial) EV ES DG
Ways
- EV fleets VPP
Aggregation of Consumer
Microgrids
Type of services Buy/Sell Energy
Buy/Sell Energy Ancillary Services
How Demand Response Charging Strategies Operation Management
Infrastructure Owner
Metering DSO
(Smart Meter) Retailer (Energy
Box) Third Party
(Energy Box) Aggregator
(Energy Box)
EV Infrastructure DSO Retailer Third Party (EV network or Spot owner)
Data Management
DSO Central Data Hub Data access point manager
By themselves
Partnership with a ICT Company
Figure 2.9: Options for business models
2.6. Business Models Layer
Modeling Tools for Planning and Operation of DERs and their Impact in Microgrids and Centralized Resources. 51
projects are described in [119] where the importance of giving information to the consumer is highlighted. Offering services and incentives to motivate changes in the consumption patterns of the consumers improves the amount of energy savings. In [120] different business models for DG are investigated such as: aggregation of DG, small-scale hydro plants, distributed balancing services and active networks management (ANM).
ANM is discussed in some projects related to the business model of the DSO. For instance, DSO will have two business models depending on the type of management applied according to DG-GRID project: an ANM and a passive network management. The main difference is that in the active approach, there are ancillary services traded between DSO and the rest of players (DER aggregator, DG, large and small consumers) [112]. In the ADINE project, technical solutions are established in real environments to make ANM possible [121] and in the Grid4EU project, European DSOs try to solve how they can manage electricity production and consumption in order to integrate large amount of renewable energy, and how to transform the consumer into an active participant [122]. On the other hand, threats to the current business model of DSO and energy suppliers are explained in [113] from DISPOWER Project. In addition, DER ownership is also linked with the DSO in studies such as [123] where three ways of managing DER are presented. The first one consists of DERs owned and operated by the DSO. In the second and third case DERs are independent, but in the second one the payments are done by the DSO whereas in the third one they are done by the regulator.
In addition to DSO models, there are more options of new business models. For instance, three different business models are proposed in [77,124], which belong to the MORE MICROGRID project. The first model is a DSO monopoly, which is also responsible for the retailer functions and DERs’ operations. The second model is a prosumer consortium model, similar to the aggregation of consumers found in the literature, where consumers minimize their costs by exporting or changing their consumption. This last model is rejected by the DSO which will obtain lower benefits. Finally, the third model is a market inside the MG, where a Microgrid Central Controller (MGCC) is in charge of local balancing, exporting and importing. This last model assures a similar distribution of benefits between all the agents involved.
The market approach in MV and LV networks inside a MG is investigated in other reports of the MICROGRID and MORE MICROGRIDS projects [76]. In [76] two policies are described. The first one consists in satisfying the local energy demand using its local production without exporting power to the upstream distribution grid, behavior known as “good citizen”. In the second one, the behavior is known as “ideal citizen“, and the MGCC takes part in the market between MGs buying and selling power in order to maximize their revenues, so the MG could be seen as a VPP to the MV feeder. In this project, there are two kinds of bids: loads are divided into low and high priority and users offer low priority loads to be shed in the next operational periods.
Other studies related to the market at the district level can be found in the NOBEL project [125], whose objective is to improve the energy management in the neighborhoods. Reference [126] explains DR for prosumers offering three possible scenarios: bilateral contracts between DSO and prosumers, local markets among prosumers which are considered as prosumers’ VPP, and a combination of these two
Chapter 2. General review of the Microgrid concept
52 Francisco Martín Martínez
models and energy management systems. In [127] software-agents are investigated in order to make forward bilateral contracts in a multi-agent electricity market.
Business models with EV are also investigated in the literature. In [128,129] two business models and systems for aggregating EV were developed and tested. Both models are described in [107]. In the former, the aggregator has a contract with the EV driver to manage battery and the business model resembles the mobile-phone business. A control center for the aggregator and the embedded system installed in each EV was developed. On the contrary, in the latter, the aggregator has a contract with the charging post owner and the business model is based more on current practices in the electricity-supply business. In this case, a control center for the aggregator and the embedded system installed in the charging post has been developed. Both control centers optimize the profit of the involved agents taking into account energy and ancillary markets, customer preferences and minimizing battery degradation [130]. New agents will be needed in order to carry out these business models. For instance, two new agents in charge of the EV infrastructure and providing services are studied in [131].
Related to the future business models different issues have to be solved. For instance, who will be the owner of the smart meters? Who will be in charge of the management of the data? Who will be the owner of the EV infrastructure? In [103], the advantages of the ownership of the Advanced Metering Infrastructure (AMI) by the DSO or by the retailer are discussed. In [132], the owner of this infrastructure is the DSO, although in other papers, the smart meters belong to the aggregator [91]. Three models for the management of data are also mentioned in [103]. The data could be owned by the DSO or a regulated central data hub or a data access point manager from a third party. The management can be done individually by themselves or by making a joint venture with ICT companies, like it is proposed in[133]. A table with the relations between ICT providers and Telecommunication Companies is presented in [134] where different data handling models are described.
In addition, [103] proposes four market models for the owners of the EV infrastructure that can be either the DSO, the retailer or a third operator (who has its own EV charging network or who is the owner of the parking spot). Moreover, the location where the EV can be charged is discussed in [131] where different charging modes such as EV Home charging, public charging and dedicated charging stations are presented. Furthermore, in [135] from the Berkeley Lab., three different business models for EV storages are presented. In two of them the EV storage is integrated in the building energy management systems whereas in the third case EV storage provides regulation reserve independently from the building to the grid.
After studying the current trends in business models, the upcoming of utilities offering services such as selling solar panels or HEMS can be foreseen. In addition, when the consumers become prosumers with these services, they will be more active, and when the networks become smarter with AMI and energy management systems, the aggregation of end-users will be inevitable. Moreover, depending on the country and the importance given to resiliency, MG could appear as the solution to these purposes, aggregation and resiliency.
2.7. Microgrids in the world
Modeling Tools for Planning and Operation of DERs and their Impact in Microgrids and Centralized Resources. 53
2.7 Microgrids in the world
Several real MG and MG testbeds are being deployed around the world. Table 45 in the appendix A summarizes all the MG experiences found in the literature survey, classifying them according to the kind of DG and ES they have deployed, the kind of load involved, the type of control used and whether they work under an AC or DC scheme. To the authors’ best knowledge, no similar MGs testbeds table review has been yet published in the literature with this level of detail and broadness.
As mentioned, some organizations [21] are carrying out MGs by their own such as CERTS in the US, NEDO in Japan, and MICROGRIDS and MORE MICROGRIDS projects in Europe. The majority of the MGs deployed have one of the following purposes:
- Giving access to electricity by themselves: Remote areas, where it is difficult to connect with the main grid finds MG as an interesting option. Some examples could be: All the MGs in Africa (Akkan, Diakha Medina, Lucingweni [136,137]) or remote area communities which work in isolated mode (Agria pig farm in Kozuf, Macedonia [76]). Furthermore, the isolated mode allows islands to be autonomous.
- Developing studies: Many projects use their own MGs to study control schemes (centralized versus decentralized), communication protocols, P/f and Q/V droop controls such as MORE MICROGRIDS project [76] or DISPOWER project [138]. In addition many universities [21] (Manchester, Leuven, Santa Clara, San Diego [139], Howard, Hefei University) and technological institutes (Illinois Institute of Technology [140]) have also developed their own MG to carry out experiments while they are self-producers.
- Improving the security in case of wars or disasters: 40 Military bases in the US are operating as MGs and the department of defense is investigating the deployment of small MGs in hot spots [141]. This interest in MGs has grown in the US after Hurricanes Katrina and Sandy which causes large periods without energy.
2.8 Critical analysis on Microgrids
At this point, MGs have been analyzed and classified from four different points of view (physical layer, communication layer, intelligence layer and business model layer) and worldwide examples have been detailed in Appendix A. Finally, in this section, a final brief analysis is performed in order to highlight, for each layer, the important points to be addressed in the future and how authors forecast the MG deployment in each later is done in Table 9.
- Nowadays, the physical layer has been extensively studied being few the new inputs to be expected. The huge amount of testbeds and real MGs already deployed proves that there are no relevant technological problems to overcome. However, one important decision to be taken regarding future distribution networks is the Standard Voltage in which DC networks will be deployed in households and buildings. Figure 4 and Table 6 show which elements (generators, loads and power electronics devices) and which services corresponds to each grid. For these reasons,
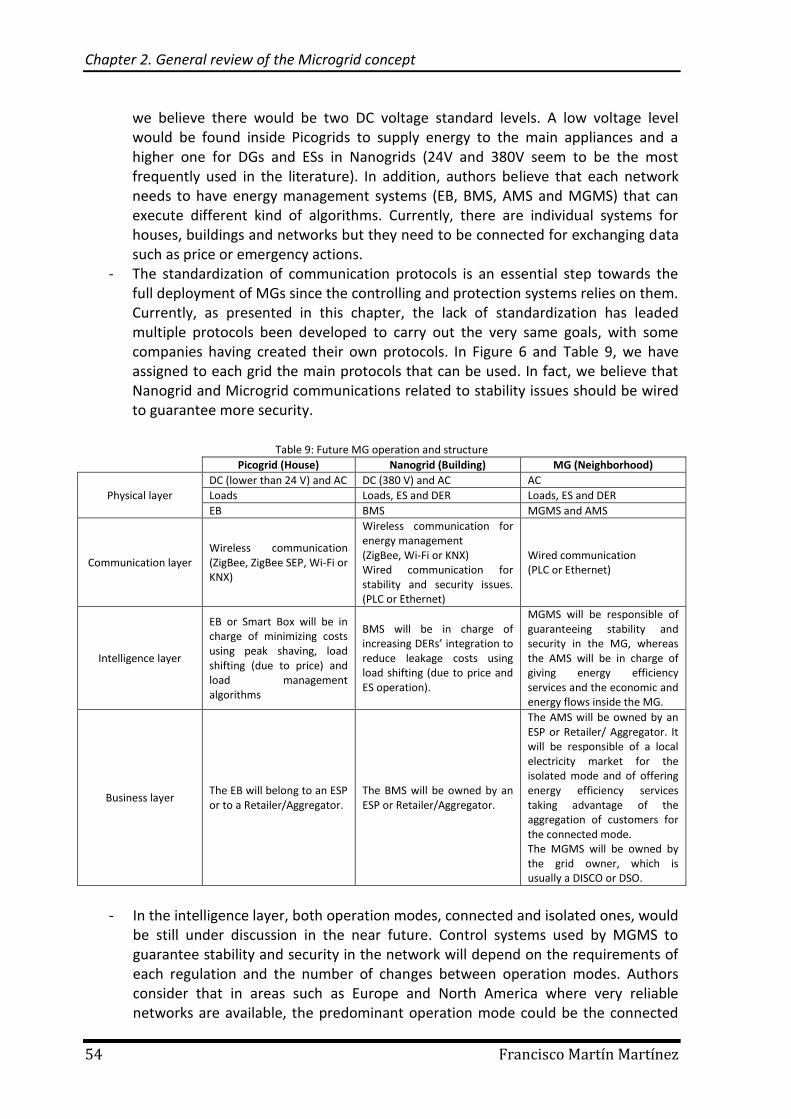
Chapter 2. General review of the Microgrid concept
54 Francisco Martín Martínez
we believe there would be two DC voltage standard levels. A low voltage level would be found inside Picogrids to supply energy to the main appliances and a higher one for DGs and ESs in Nanogrids (24V and 380V seem to be the most frequently used in the literature). In addition, authors believe that each network needs to have energy management systems (EB, BMS, AMS and MGMS) that can execute different kind of algorithms. Currently, there are individual systems for houses, buildings and networks but they need to be connected for exchanging data such as price or emergency actions.
- The standardization of communication protocols is an essential step towards the full deployment of MGs since the controlling and protection systems relies on them. Currently, as presented in this chapter, the lack of standardization has leaded multiple protocols been developed to carry out the very same goals, with some companies having created their own protocols. In Figure 6 and Table 9, we have assigned to each grid the main protocols that can be used. In fact, we believe that Nanogrid and Microgrid communications related to stability issues should be wired to guarantee more security.
Table 9: Future MG operation and structure
Picogrid (House) Nanogrid (Building) MG (Neighborhood)
Physical layer
DC (lower than 24 V) and AC DC (380 V) and AC AC
Loads Loads, ES and DER Loads, ES and DER
EB BMS MGMS and AMS
Communication layer Wireless communication (ZigBee, ZigBee SEP, Wi-Fi or KNX)
Wireless communication for energy management (ZigBee, Wi-Fi or KNX) Wired communication for stability and security issues. (PLC or Ethernet)
Wired communication (PLC or Ethernet)
Intelligence layer
EB or Smart Box will be in charge of minimizing costs using peak shaving, load shifting (due to price) and load management algorithms
BMS will be in charge of increasing DERs’ integration to reduce leakage costs using load shifting (due to price and ES operation).
MGMS will be responsible of guaranteeing stability and security in the MG, whereas the AMS will be in charge of giving energy efficiency services and the economic and energy flows inside the MG.
Business layer The EB will belong to an ESP or to a Retailer/Aggregator.
The BMS will be owned by an ESP or Retailer/Aggregator.
The AMS will be owned by an ESP or Retailer/ Aggregator. It will be responsible of a local electricity market for the isolated mode and of offering energy efficiency services taking advantage of the aggregation of customers for the connected mode. The MGMS will be owned by the grid owner, which is usually a DISCO or DSO.
- In the intelligence layer, both operation modes, connected and isolated ones, would
be still under discussion in the near future. Control systems used by MGMS to guarantee stability and security in the network will depend on the requirements of each regulation and the number of changes between operation modes. Authors consider that in areas such as Europe and North America where very reliable networks are available, the predominant operation mode could be the connected
2.9. Conclusion
Modeling Tools for Planning and Operation of DERs and their Impact in Microgrids and Centralized Resources. 55
one except for when a contingency occurs or if the regulation framework makes the isolated mode to be more profitable in some periods. However, in areas that suffer frequent contingencies or undeveloped regions the isolated mode could be more profitable one or even the only one possible. In developed areas, prices obtained from electricity market are expected to be lower than the cost associated with autoconsumption if regulation policies are properly done. In addition, which energy management algorithms and which DR programs are going to be used by future AMSs, BMSs and EBs need to be established. In Table 9, authors suggest the functions and algorithms these systems should perform. Since EBs would be located in a network without generators, they only should be in charge of reducing their consumption cost whereas BMSs also need to take into account their DERs’ operation. In the upper level, MGMSs would be responsible of the correct operation of the network whereas the AMSs would be in charge of the energy and economic exchanges of the MG and giving energy efficiency services to their clients.
- Regarding the business model layer, different questions still need to be solved since there are no solid developed business models yet. For instance, who should be or will be in charge of the operation of the MG? Who should be or will be the owner of the energy management systems deployed in houses and generators? Who should be or will be the owner of the generators in each district? Authors believes that in areas such as Europe and North America, a Retailer/Aggregator or an ESP could be in charge of the management of several MGs trying to maximize their global profit when connected to the grid, and trying to minimize their individual costs when isolated.
One of the main drawbacks for a large deployment of MGs is the cost associated
to the existing distribution networks, which will become stranded costs if those
networks happen to be clearly overinvested due to the lower use of them. This
makes countries with large still non-electrified areas or with areas with very low
reliable supply as good candidates for their deployment. Nevertheless, countries in
Europe and America would still need to know if the installation of MG could be
profitable for them. Further studies devoted to compare the actual costs of MGs
versus the aggregation of dispersed consumers need to be performed in order to
identify the factors (and their corresponding threshold values) that will be relevant
for that comparison.
Finally, Table 9 foresees how MG will be found in future networks taking into account the revision done in this Chapter.
2.9 Conclusion
This chapter contributes to clearly define the use of MGs in the future electric systems. To the authors’ best knowledge, it is the first time an exhaustive MGs review has been performed covering all the functional layers associated to MGs. Different definition and descriptions have been done in the literature and gathered in this chapter. The layer by layer approach used for the review helps providing a better understanding about the
Chapter 2. General review of the Microgrid concept
56 Francisco Martín Martínez
current state of the art related to MGs. The outcomes of the analysis and review performed at each layer level is suitably summarized and classified in Tables and Figures enabling a comprehensive outlook of the main design options and relevant issues involved in each layer.
The analysis of the physical layer provides a comparison between the AC and DC options, a review of the DC voltage levels, a clear physical division (Picogrid, Nanogrid and MG) and a comparison of technologies involved within the MG concept. Regarding the communication layer, two main contributions can be outlined, a table classifying the communication protocols and their main uses (which are different in the literature) and characteristics, and a table presenting the OSI layers in the most commonly used protocols and how they could be deployed in our organizational scheme of MGs. In the Intelligence layer, the main topics related to the MG operation have been identified and discussed and in the business layer, different options for future business models taking into account different alternatives found in the literature have been organized and classified. They have been summarized in Figure 2.9 which allows a better understanding of these options. Besides, a conceptual organizational scheme of MG has been proposed using the concepts of Nanogrid and Picogrids. A division of functions among the Picogrid, the Nanogrid and the Microgrid itself has been defined in order to clearly identify the role and responsibilities of each one of them. In each level, and agent has been proposed in Table 9 to carry out those services. In addition, an extensive and detail review of the practical experiences of Microgrids deployed around the world has been carried out, classifying them according to the review schemes proposed in the review. Finally, the next research lines and current gaps have been outlined taking into account the review done in each layer.
Physical and communication layers were considered almost fully developed to build a MG as it was shown by the huge amount of testbeds found. In the physical layer, current literature in these topics are just developing more efficient ways to control voltage or frequency or simulating case studies of strategies to overcome faults in networks. In the communication layer, security issues, studying the application of current protocols and developing frameworks to support several types of protocols are the main trends. However, this thesis is born out of the desire to fill the gaps (Table 10) that have been detected in the literature:
State of arts about Microgrids are only focused on specific areas such as current testbeds in the world, stability issues or design of agents in the network, without making a global review of different aspects that Microgrids involves as done in this chapter.
Markets at district level have been mentioned in several projects but no models have been developed to study the behavior of those markets. Sizes and number of participants could be crucial to see the viability of those markets in order to avoid monopolistic behaviors.
No many approaches are able to properly model the behavior of a building and DERs. Modeling a building requires to consider their characteristics as the capability of storing thermal energy or home energy management systems that allow modifying demand profiles in order to make the most of the installed DERs. Although economies of scale make centralized resources more profitable, considering them in detail could affect the balance among centralized and distributed resources among other factors.
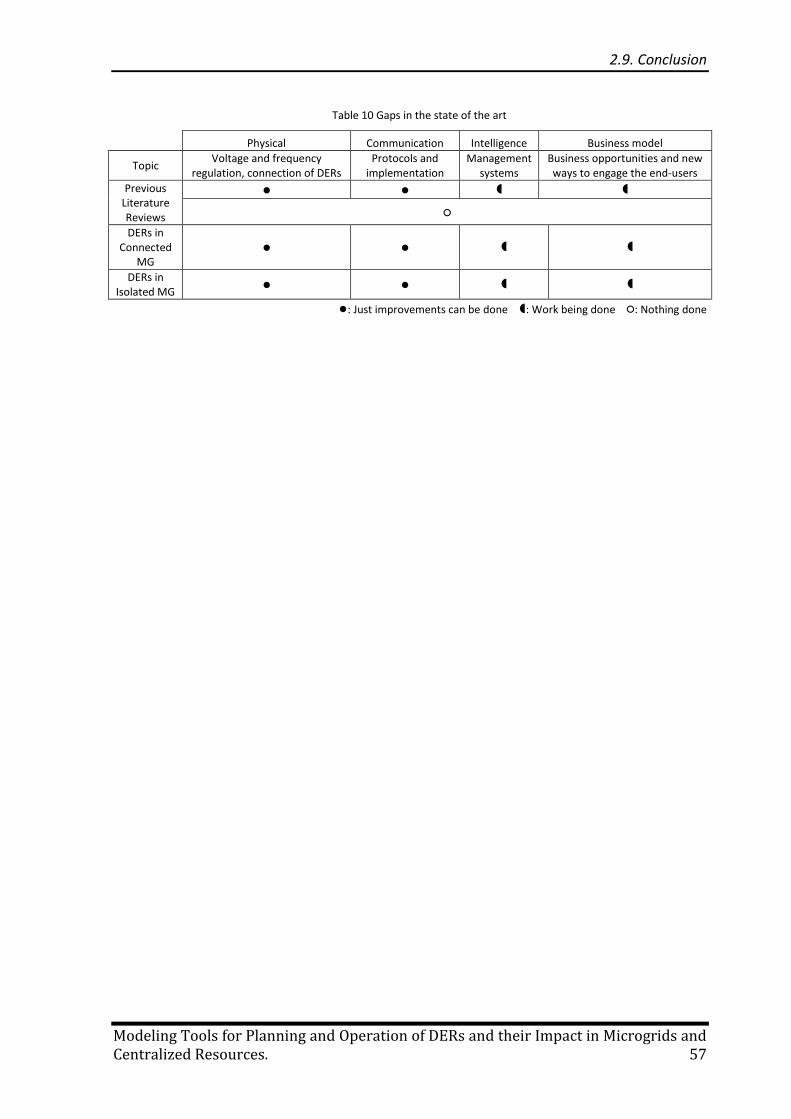
2.9. Conclusion
Modeling Tools for Planning and Operation of DERs and their Impact in Microgrids and Centralized Resources. 57
Table 10 Gaps in the state of the art
Physical Communication Intelligence Business model
Topic Voltage and frequency
regulation, connection of DERs Protocols and
implementation Management
systemsBusiness opportunities and new ways to engage the end-users
Previous Literature Reviews
● ●
○
DERs in Connected
MG ● ●
DERs in Isolated MG
● ●
●: Just improvements can be done : Work being done ○: Nothing done

Modeling Tools for Planning and Operation of DERs and their Impact in Microgrids and Centralized Resources. 59
If you optimize everything,
you will always be unhappy.
Donald Knuth
The first step to address the research questions of this dissertation is to properly characterize and model the electricity and thermal consumption of consumers and to identify the optimal deployment of DERs at the lowest level, the buildings (Nanogrids). This chapter describes in detail the mathematical formulation proposed to model the electrical and thermal consumption of buildings as well as the characteristics of the DER technologies most suitable to be installed in them. To properly represent their different energy consumption behavior, end-users are classified in different classes such as residential, commercial or industrial ones.
An optimization problem is formulated for minimizing energy costs in buildings by balancing the investment and operation costs of installing new DER equipment and the purchase of electricity and gas from suppliers. The formulation presented in this chapter is the main core of the rest of the models. In addition, analyzing properly the thermal consumption of buildings when optimizing DERs’ deployment is one of the objectives of the thesis and presented here. In a first stage, thermal energy is considered as a total daily energy requirement. Then, in a second phase, a more detailed modeling of thermal consumption is studied, where heating and domestic hot water needs are distinguished in order to take into account thermal inertias and outdoor temperatures.
Chapter 3. Building: Investment, Operation and Real Time Management of DERs to meet thermal and electricity consumption needs
60 Francisco Martín Martínez
3.1 Introduction
As reviewed in the previous chapter, Microgrids (MGs) are one of the best ways for integrating Distributed Energy Resources (DERs) such as Distributed Generation or Energy Storage (ES) with the deployment of Information and Communication Technologies (ICT). MGs can aggregate several DERs in a single cluster which can operate either alone or connected to the grid [142].
As mentioned in chapter 1, the first step to design this network is to properly model their basic component, a building, since although MGs could be made of several of them, MGs acts as a unit when they are connected to the main grid. Decisions in MGs will be taken by a single entity, the MG Central Controller (owner or manager of the MG). These decisions could be made either by a physical person using Decision Support System (DSSs) or automatically through an EMS. DSSs as OPTIMUS [143] provides a set of actions to be taken by the manager of the MG to reach the best result taking into account the objectives established by the user. Even if it is a person that takes the decision, EMSs become an essential tool for the efficient management of a MG [144,145] when different horizons and purposes are considered: planning (investment decisions related to the size, the number and the technologies of generators to be installed considering long-term periods) and operation (power production scheduling and real time optimal control decisions within short-term periods). Same systems and entities could also be applied to buildings. For these reasons, modeling of heating consumption and individual DERs operation in buildings are studied in this chapter.
Besides integrating DERs, MGs present other technical benefits such as higher reliability of the energy supply [54,55,146], steady voltage levels and the minimization of network losses [147]. Nevertheless, MGs and buildings will need day-to-day operation planning and control of a variety of sources. Given the uncertainty and the production intermittency of most renewable sources such as the solar generation for which the output of the photovoltaic solar panels (PVs) will depend on weather conditions. ESs, management strategies and demand side management schemes should be needed to guarantee a continuous supply of energy [148]. For instance, a review of ES systems that are technically and economically able to operate with PV panels in order to smooth out the discontinued output of the solar energy is reported in [149]. In addition, MGs are also suitable to deploy technologies for district heating [150]. For instance, combined heat and power (CHP) units seem to be a good option since they are capable of producing electrical and thermal energy at the same time and they can be combined with absorption chillers to obtain combined cooling heat and power (CCHP). For this reason, these DERs are included in the model although for operation of a small building will not be profitable enough due to the investment costs.
All of the aforementioned devices will be required if a 100% renewable energy paradigm is foreseen, such as the one presented in [151]. Future distribution networks may be made up of different MGs, as reviewed in chapter 2, where each one will be composed by a number of buildings. The Energy Performance of Buildings Directive (ED 2010/31/EU) [152,153] forces new buildings by 2020 to have low primary energy consumptions since the major part of their load should be supplied from their own renewable sources and thanks
3.1. Introduction
Modeling Tools for Planning and Operation of DERs and their Impact in Microgrids and Centralized Resources. 61
also to the new thermal efficiency designs. Thus, these Nearly Zero Energy Buildings, that behaves as small MGs or Nanogrids if we use the classification presented in the chapter 2 and [2] , stands for an opportunity to increase the amount of renewable energy sources at distribution level (e.g. PV panels, batteries, heat pumps) but also some challenges since energy management systems should be necessary to operate these buildings [154].
As aforementioned, [155] deeply reviews investment and operation models in smart cities regarding their scope. For instance, Calvillo et al. [68] assess the thermal effects in distribution networks (losses in lines) optimizing DERs’ investment and operation. Other issues related to the different kinds of storage systems (e.g., batteries, also for e-car applications) [135] have been considered in planning decisions. Quashie et al. [156] use a bi-level problem to optimize urban Microgrids. Mehleri et al. [157] search the optimal DER configuration in a small neighborhood where district heating pipelines are also designed. Omu et al. [158] analyze the economic and environmental impacts taking into account the grid to show the environmental effect achieved by DERs. Another example is [66] where distribution network reinforcements for deploying distributed generation (capacities, location and time frame of the investments) are studied. Finally, planning and operation of DERs could be studied using public tools such as DERCAM which uses demand profiles, weather data, DERs’ characteristics and electric prices to minimize costs or emissions [159]; EnerGIS that designs district heating and cooling networks [160]; and DPG.sim which analyzes end-users equipped with load, generators and storages [161]. However, few of them include thermal modeling.
The thermal consumptions are usually considered by energy management models in two main ways: using thermal demands profiles or introducing thermal requirements. For instance, the approach of using electrical and thermal profiles as input data (for instance, in the DER-CAM model [159] or the work of Bracco et al. [162]) to set the operation of the different devices presents two main disadvantages. The first one is that obtaining or measuring the thermal profiles is not so widespread in the residential sector. The second drawback is that using fix profiles does not allow using the thermal inertia of the building. Then, the second solution, introducing thermal requirements as in the reference [68], that allows to use the building as a thermal storage, needs specific constraints to avoid thermal generation only in low price periods that may result in unrealistic usages. In fact, the use of a profile that represents the reality could avoid possible savings from undesired heating usages, which can reach up to a 30% in the United States [163]. The importance of introducing temperature models in current optimization models can be seen in recent reports such as the one developed by the MIT [164], which uses a temperature model in the Demand Response and Distributed Resource Economics model, based on the formula presented in [165].
Other fields are more focused on temperature models. The forecasting field uses predictive algorithms to estimate indoor temperatures and their associated energy consumptions using techniques and algorithms such as ARIMA models, multi-layer perceptron algorithms or multivariate adaptive regression splines approaches [166]. These methods could be used to create the profiles introduced in optimization problems. Other studies such as [167,168] use temperature simulations to analyze the heat dynamics of buildings. Those references propose temperature models that can be introduced easily in the mathematical formulation. In particular, reference [167] presents fifteen RC-network
Chapter 3. Building: Investment, Operation and Real Time Management of DERs to meet thermal and electricity consumption needs
62 Francisco Martín Martínez
models to simulate the indoor temperature behavior. The models presented in this reference allow considering in different ways several factors: Outdoor and indoor temperatures, the wall or envelope of the building, solar radiation, heaters and the internal furniture and devices. Reference [168] classifies the approaches for temperature simulations depending if they rely on physical models (named as “white-box models” that use RC-networks models) or if they rely on statistics and historical data (named as “black-box models”). A third option, the “grey-box models”, uses RC-networks but the parameters are estimated with historical data. This is the approach used in this thesis to integrate a physical model in the energy management optimization problem.
As mentioned, a critical aspect to properly asses the role of DERs is a characterization of electrical and thermal demands. Unfortunately, available public information on end-users’ consumptions and on distribution networks is quite limited. For this reason, information regarding the demand side is usually obtained from public reports. For instance, for the Spanish cases presented hereinafter, two main sources in Spain that analyze the demand have been used. Firstly, the report developed by the Spanish TSO [31] studies the whole consumption sector classifying it in six categories and analyzing in detail residential, commercial and touristic ones. Finally, the SPAHOUSEC project [30] deeply analyses the electrical and thermal consumption of the residential sector for different weather climates and household types in Spain.
This chapter presents the mathematical formulation of the model used in the thesis to represent the optimal behavior of buildings’ owners to reduce their energy cost, by balancing the investment and operation costs of installing new DERs’ equipment with the purchase of electricity and/or gas to suppliers. This model will be the core of the different models developed later on in the thesis. Section 3.2 explains the objective function used to reproduce the building owner (or manager) goals, and the set of equations to represent the energy exchanges inside the building and the operational characteristics of the main DERs. Then, section 3.3 focuses on one of the contributions of the thesis by improving the modeling of the thermal consumption. A temperature model to properly model thermal inertias in buildings taking into account outdoor temperatures is added to the previous model, and the advantages, relevance and consequences of explicitly taking it into account analyzed. Both sections use a case study to validate the formulation and to analyze the advantages. Finally, section 3.4 describes how this model could be actually used by real EMS to optimize the operation of a building during a day-to-day basis.
3.2 Modeling DERs’ deployment in building considering electrical and thermal requirements without thermal inertias
This section describes the main set of equations used in the dissertation to represent the deployment and operation of DERs in a building. Firstly, the main structure and function of the model are described. Then, the mathematical formulation is presented when heating and domestic hot water requirements are not differentiated. Finally, the model is applied to a real case study where results are analyzed.
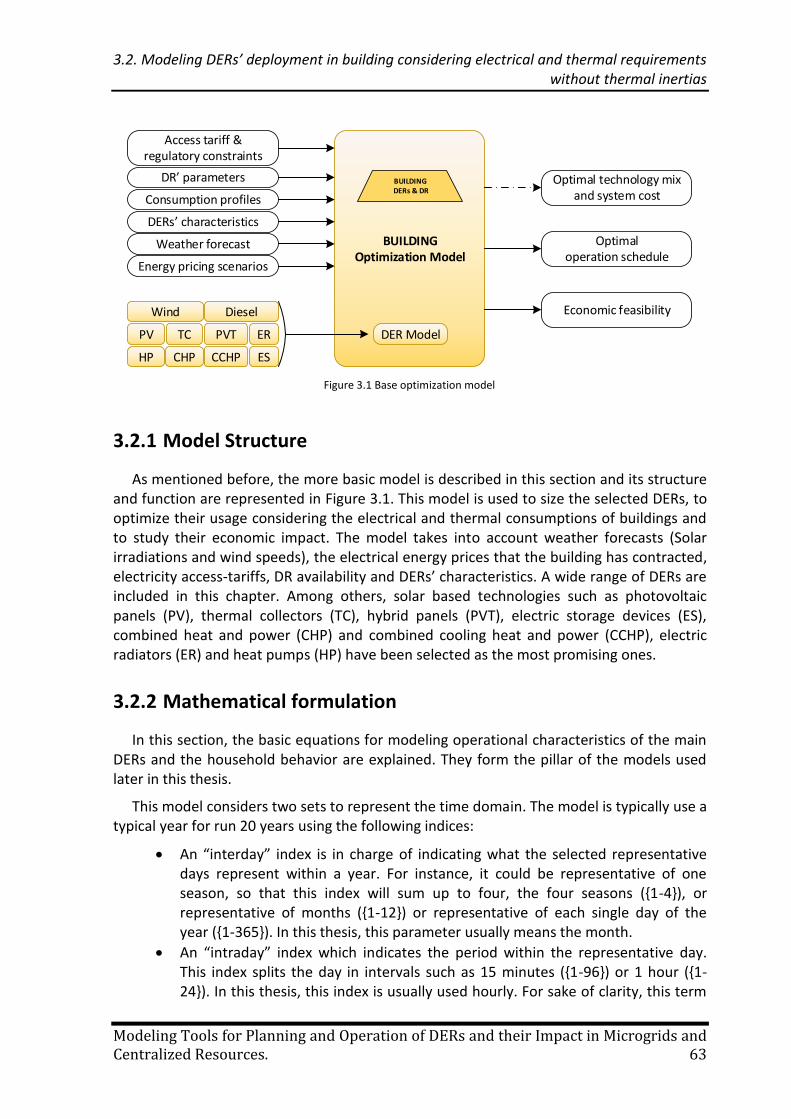
3.2. Modeling DERs’ deployment in building considering electrical and thermal requirements without thermal inertias
Modeling Tools for Planning and Operation of DERs and their Impact in Microgrids and Centralized Resources. 63
3.2.1 Model Structure
As mentioned before, the more basic model is described in this section and its structure and function are represented in Figure 3.1. This model is used to size the selected DERs, to optimize their usage considering the electrical and thermal consumptions of buildings and to study their economic impact. The model takes into account weather forecasts (Solar irradiations and wind speeds), the electrical energy prices that the building has contracted, electricity access-tariffs, DR availability and DERs’ characteristics. A wide range of DERs are included in this chapter. Among others, solar based technologies such as photovoltaic panels (PV), thermal collectors (TC), hybrid panels (PVT), electric storage devices (ES), combined heat and power (CHP) and combined cooling heat and power (CCHP), electric radiators (ER) and heat pumps (HP) have been selected as the most promising ones.
3.2.2 Mathematical formulation
In this section, the basic equations for modeling operational characteristics of the main DERs and the household behavior are explained. They form the pillar of the models used later in this thesis.
This model considers two sets to represent the time domain. The model is typically use a typical year for run 20 years using the following indices:
An “interday” index is in charge of indicating what the selected representative days represent within a year. For instance, it could be representative of one season, so that this index will sum up to four, the four seasons ({1-4}), or representative of months ({1-12}) or representative of each single day of the year ({1-365}). In this thesis, this parameter usually means the month.
An “intraday” index which indicates the period within the representative day. This index splits the day in intervals such as 15 minutes ({1-96}) or 1 hour ({1-24}). In this thesis, this index is usually used hourly. For sake of clarity, this term
Access tariff & regulatory constraints
DR’ parameters
Consumption profiles
DERs’ characteristics
Weather forecast
Energy pricing scenarios
PV
Wind Diesel
TC
HP CHP CCHP ES
BUILDINGOptimization Model
DER Model
Economic feasibility
Optimal operation schedule
Optimal technology mix and system cost
BUILDING DERs & DR
ERPVT
Figure 3.1 Base optimization model
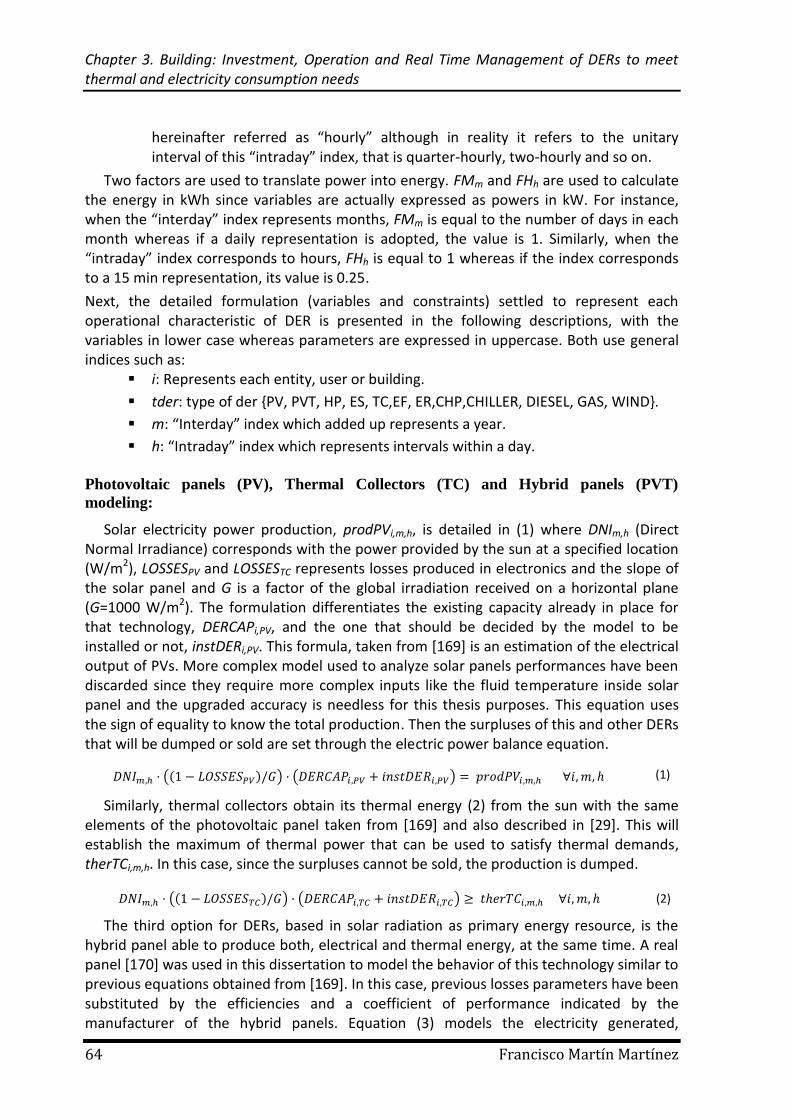
Chapter 3. Building: Investment, Operation and Real Time Management of DERs to meet thermal and electricity consumption needs
64 Francisco Martín Martínez
hereinafter referred as “hourly” although in reality it refers to the unitary interval of this “intraday” index, that is quarter-hourly, two-hourly and so on.
Two factors are used to translate power into energy. FMm and FHh are used to calculate the energy in kWh since variables are actually expressed as powers in kW. For instance, when the “interday” index represents months, FMm is equal to the number of days in each month whereas if a daily representation is adopted, the value is 1. Similarly, when the “intraday” index corresponds to hours, FHh is equal to 1 whereas if the index corresponds to a 15 min representation, its value is 0.25.
Next, the detailed formulation (variables and constraints) settled to represent each operational characteristic of DER is presented in the following descriptions, with the variables in lower case whereas parameters are expressed in uppercase. Both use general indices such as:
i: Represents each entity, user or building.
tder: type of der {PV, PVT, HP, ES, TC,EF, ER,CHP,CHILLER, DIESEL, GAS, WIND}.
m: “Interday” index which added up represents a year.
h: “Intraday” index which represents intervals within a day.
Photovoltaic panels (PV), Thermal Collectors (TC) and Hybrid panels (PVT)
modeling:
Solar electricity power production, prodPVi,m,h, is detailed in (1) where DNIm,h (Direct Normal Irradiance) corresponds with the power provided by the sun at a specified location (W/m2), LOSSESPV and LOSSESTC represents losses produced in electronics and the slope of the solar panel and G is a factor of the global irradiation received on a horizontal plane (G=1000 W/m2). The formulation differentiates the existing capacity already in place for that technology, DERCAPi,PV, and the one that should be decided by the model to be installed or not, instDERi,PV. This formula, taken from [169] is an estimation of the electrical output of PVs. More complex model used to analyze solar panels performances have been discarded since they require more complex inputs like the fluid temperature inside solar panel and the upgraded accuracy is needless for this thesis purposes. This equation uses the sign of equality to know the total production. Then the surpluses of this and other DERs that will be dumped or sold are set through the electric power balance equation.
(( ) ) ( ) (1)
Similarly, thermal collectors obtain its thermal energy (2) from the sun with the same elements of the photovoltaic panel taken from [169] and also described in [29]. This will establish the maximum of thermal power that can be used to satisfy thermal demands, therTCi,m,h. In this case, since the surpluses cannot be sold, the production is dumped.
(( ) ) ( ) (2)
The third option for DERs, based in solar radiation as primary energy resource, is the hybrid panel able to produce both, electrical and thermal energy, at the same time. A real panel [170] was used in this dissertation to model the behavior of this technology similar to previous equations obtained from [169]. In this case, previous losses parameters have been substituted by the efficiencies and a coefficient of performance indicated by the manufacturer of the hybrid panels. Equation (3) models the electricity generated,
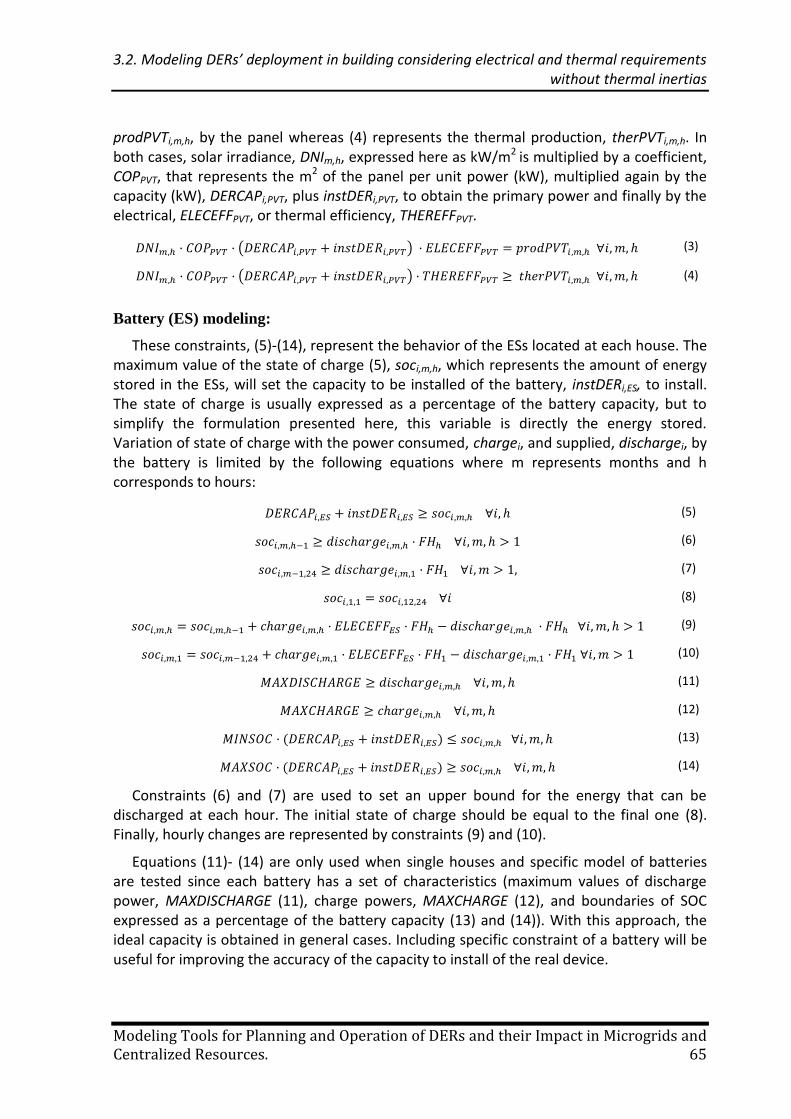
3.2. Modeling DERs’ deployment in building considering electrical and thermal requirements without thermal inertias
Modeling Tools for Planning and Operation of DERs and their Impact in Microgrids and Centralized Resources. 65
prodPVTi,m,h, by the panel whereas (4) represents the thermal production, therPVTi,m,h. In both cases, solar irradiance, DNIm,h, expressed here as kW/m2 is multiplied by a coefficient, COPPVT, that represents the m2 of the panel per unit power (kW), multiplied again by the capacity (kW), DERCAPi,PVT, plus instDERi,PVT, to obtain the primary power and finally by the electrical, ELECEFFPVT, or thermal efficiency, THEREFFPVT.
( ) (3)
( ) (4)
Battery (ES) modeling:
These constraints, (5)-(14), represent the behavior of the ESs located at each house. The maximum value of the state of charge (5), soci,m,h, which represents the amount of energy stored in the ESs, will set the capacity to be installed of the battery, instDERi,ES, to install. The state of charge is usually expressed as a percentage of the battery capacity, but to simplify the formulation presented here, this variable is directly the energy stored. Variation of state of charge with the power consumed, chargei, and supplied, dischargei, by the battery is limited by the following equations where m represents months and h corresponds to hours:
(5)
(6)
(7)
(8)
(9)
(10)
(11)
(12)
( ) (13)
( ) (14)
Constraints (6) and (7) are used to set an upper bound for the energy that can be discharged at each hour. The initial state of charge should be equal to the final one (8). Finally, hourly changes are represented by constraints (9) and (10).
Equations (11)- (14) are only used when single houses and specific model of batteries are tested since each battery has a set of characteristics (maximum values of discharge power, MAXDISCHARGE (11), charge powers, MAXCHARGE (12), and boundaries of SOC expressed as a percentage of the battery capacity (13) and (14)). With this approach, the ideal capacity is obtained in general cases. Including specific constraint of a battery will be useful for improving the accuracy of the capacity to install of the real device.
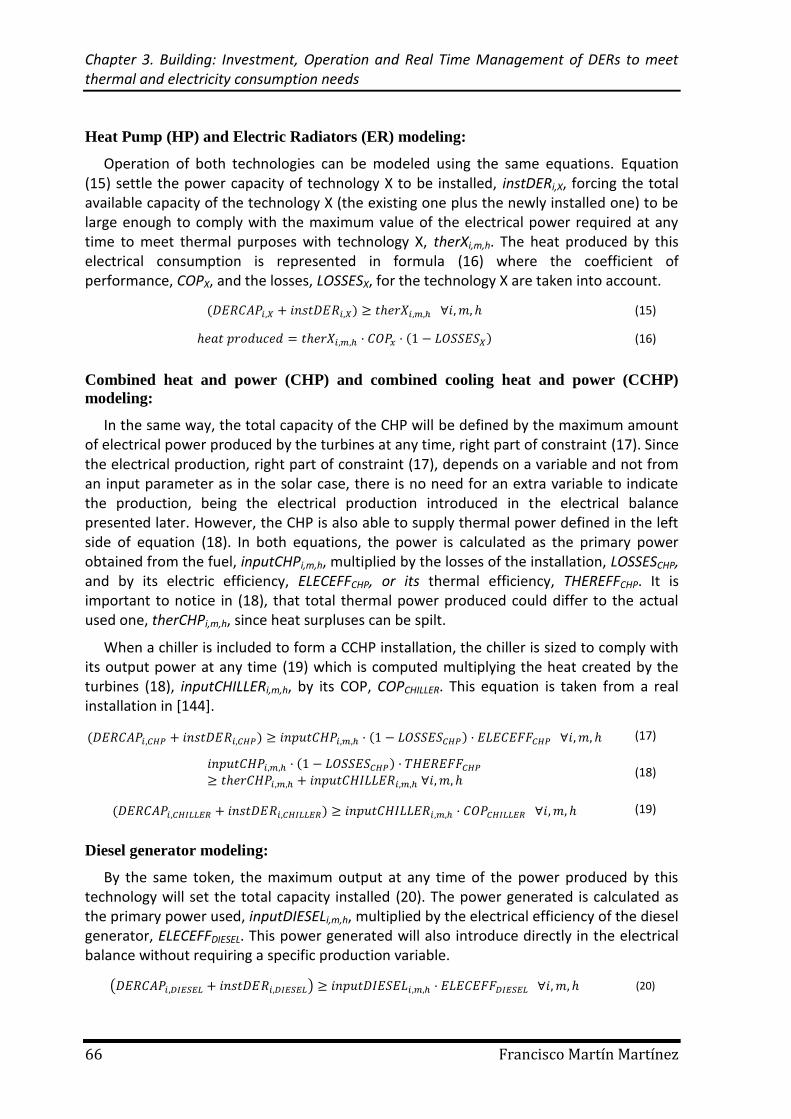
Chapter 3. Building: Investment, Operation and Real Time Management of DERs to meet thermal and electricity consumption needs
66 Francisco Martín Martínez
Heat Pump (HP) and Electric Radiators (ER) modeling:
Operation of both technologies can be modeled using the same equations. Equation (15) settle the power capacity of technology X to be installed, instDERi,X, forcing the total available capacity of the technology X (the existing one plus the newly installed one) to be large enough to comply with the maximum value of the electrical power required at any time to meet thermal purposes with technology X, therXi,m,h. The heat produced by this electrical consumption is represented in formula (16) where the coefficient of performance, COPX, and the losses, LOSSESX, for the technology X are taken into account.
( ) (15)
( ) (16)
Combined heat and power (CHP) and combined cooling heat and power (CCHP)
modeling:
In the same way, the total capacity of the CHP will be defined by the maximum amount of electrical power produced by the turbines at any time, right part of constraint (17). Since the electrical production, right part of constraint (17), depends on a variable and not from an input parameter as in the solar case, there is no need for an extra variable to indicate the production, being the electrical production introduced in the electrical balance presented later. However, the CHP is also able to supply thermal power defined in the left side of equation (18). In both equations, the power is calculated as the primary power obtained from the fuel, inputCHPi,m,h, multiplied by the losses of the installation, LOSSESCHP, and by its electric efficiency, ELECEFFCHP, or its thermal efficiency, THEREFFCHP. It is important to notice in (18), that total thermal power produced could differ to the actual used one, therCHPi,m,h, since heat surpluses can be spilt.
When a chiller is included to form a CCHP installation, the chiller is sized to comply with its output power at any time (19) which is computed multiplying the heat created by the turbines (18), inputCHILLERi,m,h, by its COP, COPCHILLER. This equation is taken from a real installation in [144].
( ) ( ) (17)
( )
(18)
( ) (19)
Diesel generator modeling:
By the same token, the maximum output at any time of the power produced by this technology will set the total capacity installed (20). The power generated is calculated as the primary power used, inputDIESELi,m,h, multiplied by the electrical efficiency of the diesel generator, ELECEFFDIESEL. This power generated will also introduce directly in the electrical balance without requiring a specific production variable.
( ) (20)
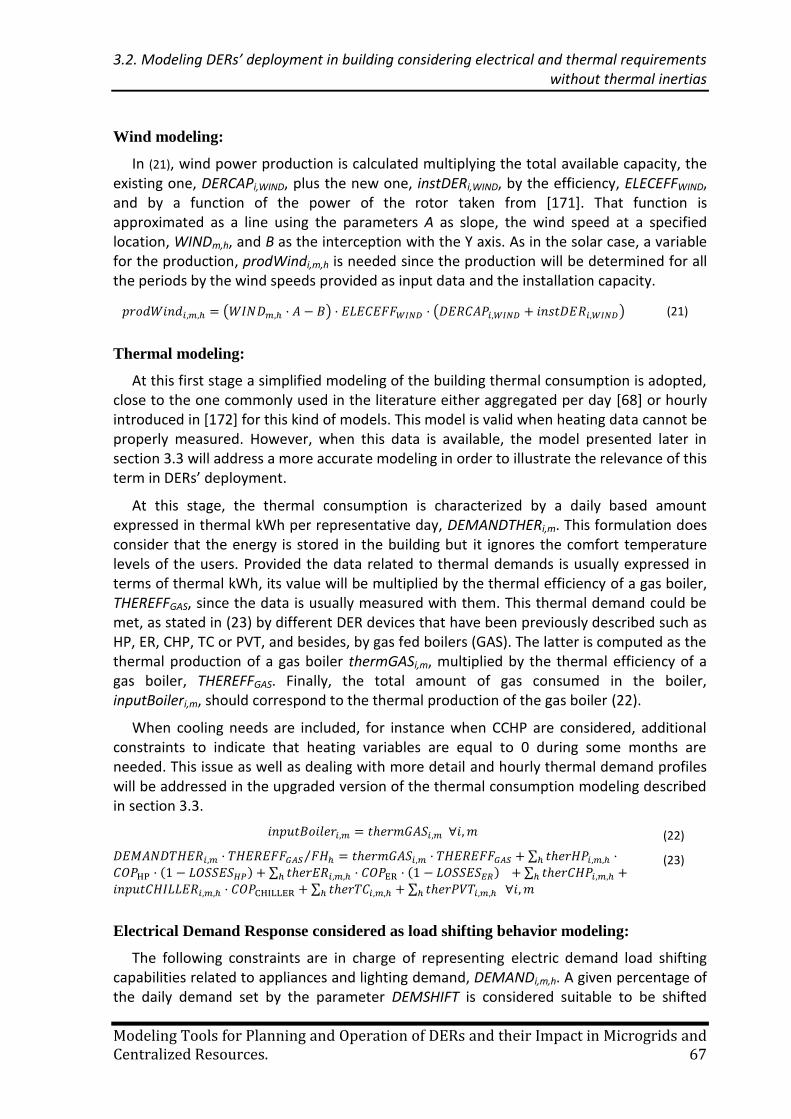
3.2. Modeling DERs’ deployment in building considering electrical and thermal requirements without thermal inertias
Modeling Tools for Planning and Operation of DERs and their Impact in Microgrids and Centralized Resources. 67
Wind modeling:
In (21), wind power production is calculated multiplying the total available capacity, the existing one, DERCAPi,WIND, plus the new one, instDERi,WIND, by the efficiency, ELECEFFWIND, and by a function of the power of the rotor taken from [171]. That function is approximated as a line using the parameters A as slope, the wind speed at a specified location, WINDm,h, and B as the interception with the Y axis. As in the solar case, a variable for the production, prodWindi,m,h is needed since the production will be determined for all the periods by the wind speeds provided as input data and the installation capacity.
( ) ( ) (21)
Thermal modeling:
At this first stage a simplified modeling of the building thermal consumption is adopted, close to the one commonly used in the literature either aggregated per day [68] or hourly introduced in [172] for this kind of models. This model is valid when heating data cannot be properly measured. However, when this data is available, the model presented later in section 3.3 will address a more accurate modeling in order to illustrate the relevance of this term in DERs’ deployment.
At this stage, the thermal consumption is characterized by a daily based amount expressed in thermal kWh per representative day, DEMANDTHERi,m. This formulation does consider that the energy is stored in the building but it ignores the comfort temperature levels of the users. Provided the data related to thermal demands is usually expressed in terms of thermal kWh, its value will be multiplied by the thermal efficiency of a gas boiler, THEREFFGAS, since the data is usually measured with them. This thermal demand could be met, as stated in (23) by different DER devices that have been previously described such as HP, ER, CHP, TC or PVT, and besides, by gas fed boilers (GAS). The latter is computed as the thermal production of a gas boiler thermGASi,m, multiplied by the thermal efficiency of a gas boiler, THEREFFGAS. Finally, the total amount of gas consumed in the boiler, inputBoileri,m, should correspond to the thermal production of the gas boiler (22).
When cooling needs are included, for instance when CCHP are considered, additional constraints to indicate that heating variables are equal to 0 during some months are needed. This issue as well as dealing with more detail and hourly thermal demand profiles will be addressed in the upgraded version of the thermal consumption modeling described in section 3.3.
(22)
⁄ ∑
( ) ∑ ( ) ∑
∑ ∑
(23)
Electrical Demand Response considered as load shifting behavior modeling:
The following constraints are in charge of representing electric demand load shifting capabilities related to appliances and lighting demand, DEMANDi,m,h. A given percentage of the daily demand set by the parameter DEMSHIFT is considered suitable to be shifted
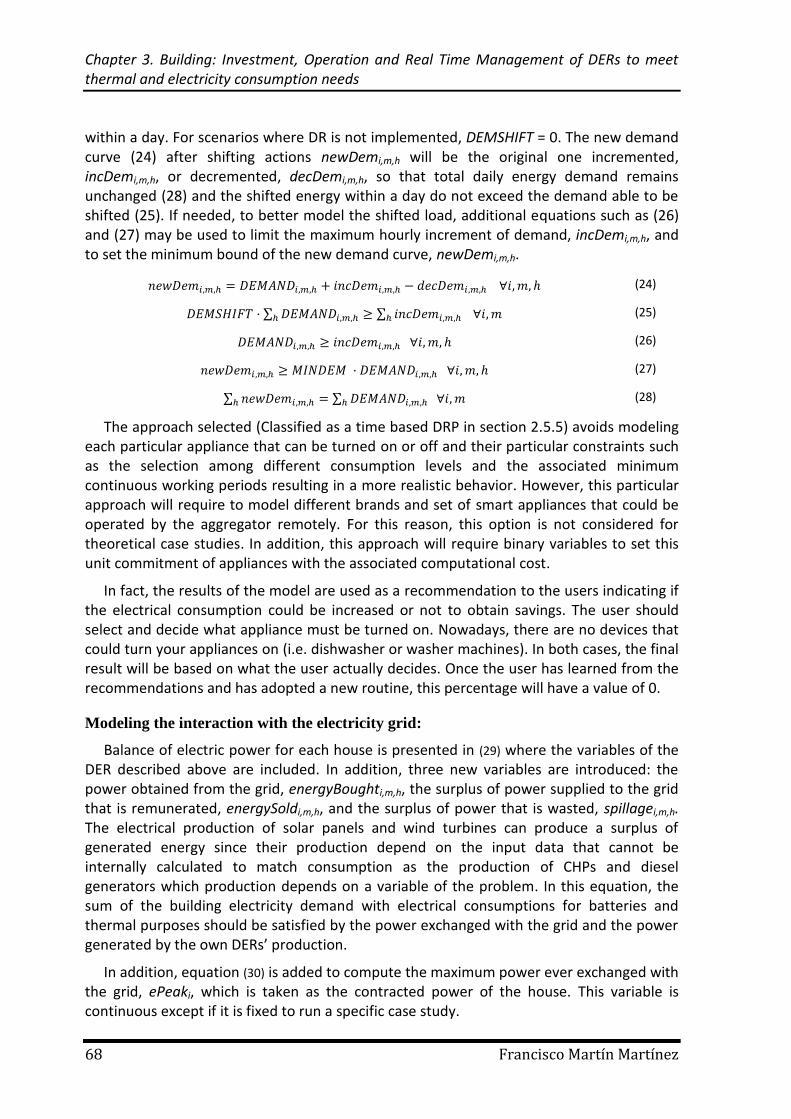
Chapter 3. Building: Investment, Operation and Real Time Management of DERs to meet thermal and electricity consumption needs
68 Francisco Martín Martínez
within a day. For scenarios where DR is not implemented, DEMSHIFT = 0. The new demand curve (24) after shifting actions newDemi,m,h will be the original one incremented, incDemi,m,h, or decremented, decDemi,m,h, so that total daily energy demand remains unchanged (28) and the shifted energy within a day do not exceed the demand able to be shifted (25). If needed, to better model the shifted load, additional equations such as (26) and (27) may be used to limit the maximum hourly increment of demand, incDemi,m,h, and to set the minimum bound of the new demand curve, newDemi,m,h.
(24)
∑ ∑ (25)
(26)
(27)
∑ ∑ (28)
The approach selected (Classified as a time based DRP in section 2.5.5) avoids modeling each particular appliance that can be turned on or off and their particular constraints such as the selection among different consumption levels and the associated minimum continuous working periods resulting in a more realistic behavior. However, this particular approach will require to model different brands and set of smart appliances that could be operated by the aggregator remotely. For this reason, this option is not considered for theoretical case studies. In addition, this approach will require binary variables to set this unit commitment of appliances with the associated computational cost.
In fact, the results of the model are used as a recommendation to the users indicating if the electrical consumption could be increased or not to obtain savings. The user should select and decide what appliance must be turned on. Nowadays, there are no devices that could turn your appliances on (i.e. dishwasher or washer machines). In both cases, the final result will be based on what the user actually decides. Once the user has learned from the recommendations and has adopted a new routine, this percentage will have a value of 0.
Modeling the interaction with the electricity grid:
Balance of electric power for each house is presented in (29) where the variables of the DER described above are included. In addition, three new variables are introduced: the power obtained from the grid, energyBoughti,m,h, the surplus of power supplied to the grid that is remunerated, energySoldi,m,h, and the surplus of power that is wasted, spillagei,m,h. The electrical production of solar panels and wind turbines can produce a surplus of generated energy since their production depend on the input data that cannot be internally calculated to match consumption as the production of CHPs and diesel generators which production depends on a variable of the problem. In this equation, the sum of the building electricity demand with electrical consumptions for batteries and thermal purposes should be satisfied by the power exchanged with the grid and the power generated by the own DERs’ production.
In addition, equation (30) is added to compute the maximum power ever exchanged with the grid, ePeaki, which is taken as the contracted power of the house. This variable is continuous except if it is fixed to run a specific case study.
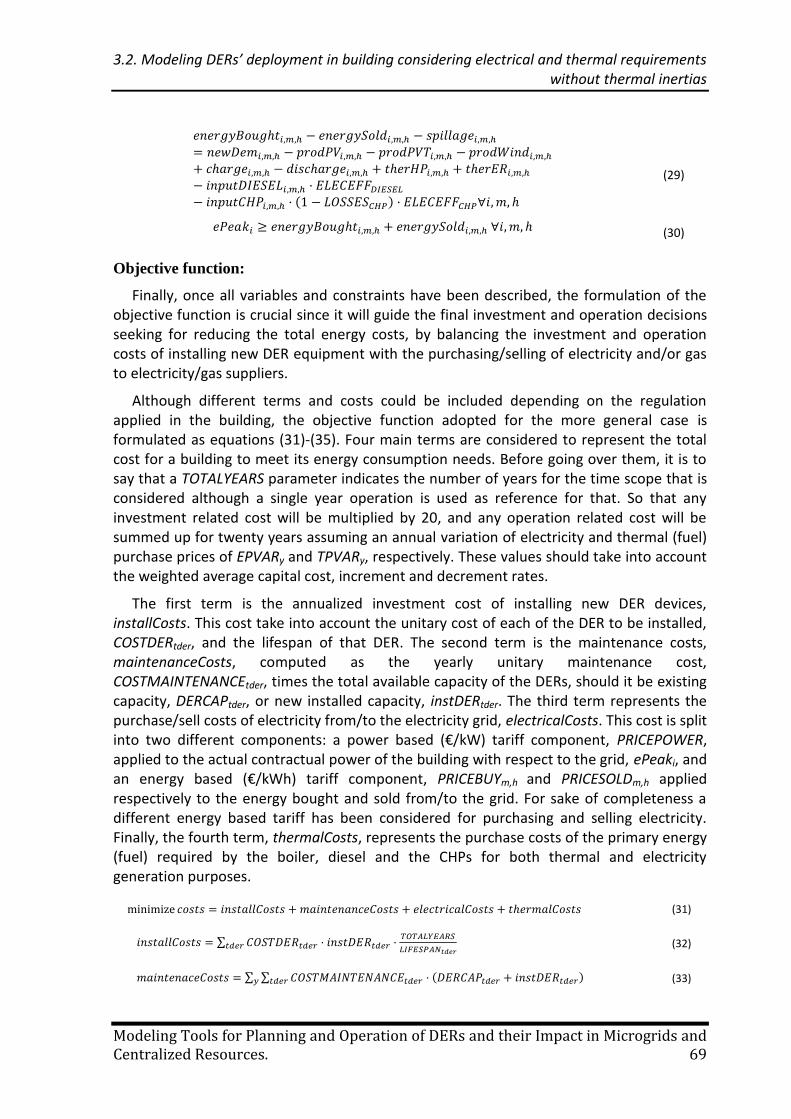
3.2. Modeling DERs’ deployment in building considering electrical and thermal requirements without thermal inertias
Modeling Tools for Planning and Operation of DERs and their Impact in Microgrids and Centralized Resources. 69
( )
(29)
(30)
Objective function:
Finally, once all variables and constraints have been described, the formulation of the objective function is crucial since it will guide the final investment and operation decisions seeking for reducing the total energy costs, by balancing the investment and operation costs of installing new DER equipment with the purchasing/selling of electricity and/or gas to electricity/gas suppliers.
Although different terms and costs could be included depending on the regulation applied in the building, the objective function adopted for the more general case is formulated as equations (31)-(35). Four main terms are considered to represent the total cost for a building to meet its energy consumption needs. Before going over them, it is to say that a TOTALYEARS parameter indicates the number of years for the time scope that is considered although a single year operation is used as reference for that. So that any investment related cost will be multiplied by 20, and any operation related cost will be summed up for twenty years assuming an annual variation of electricity and thermal (fuel) purchase prices of EPVARy and TPVARy, respectively. These values should take into account the weighted average capital cost, increment and decrement rates.
The first term is the annualized investment cost of installing new DER devices, installCosts. This cost take into account the unitary cost of each of the DER to be installed, COSTDERtder, and the lifespan of that DER. The second term is the maintenance costs, maintenanceCosts, computed as the yearly unitary maintenance cost, COSTMAINTENANCEtder, times the total available capacity of the DERs, should it be existing capacity, DERCAPtder, or new installed capacity, instDERtder. The third term represents the purchase/sell costs of electricity from/to the electricity grid, electricalCosts. This cost is split into two different components: a power based (€/kW) tariff component, PRICEPOWER, applied to the actual contractual power of the building with respect to the grid, ePeaki, and an energy based (€/kWh) tariff component, PRICEBUYm,h and PRICESOLDm,h applied respectively to the energy bought and sold from/to the grid. For sake of completeness a different energy based tariff has been considered for purchasing and selling electricity. Finally, the fourth term, thermalCosts, represents the purchase costs of the primary energy (fuel) required by the boiler, diesel and the CHPs for both thermal and electricity generation purposes.
(31)
∑
(32)
∑ ∑ ( ) (33)
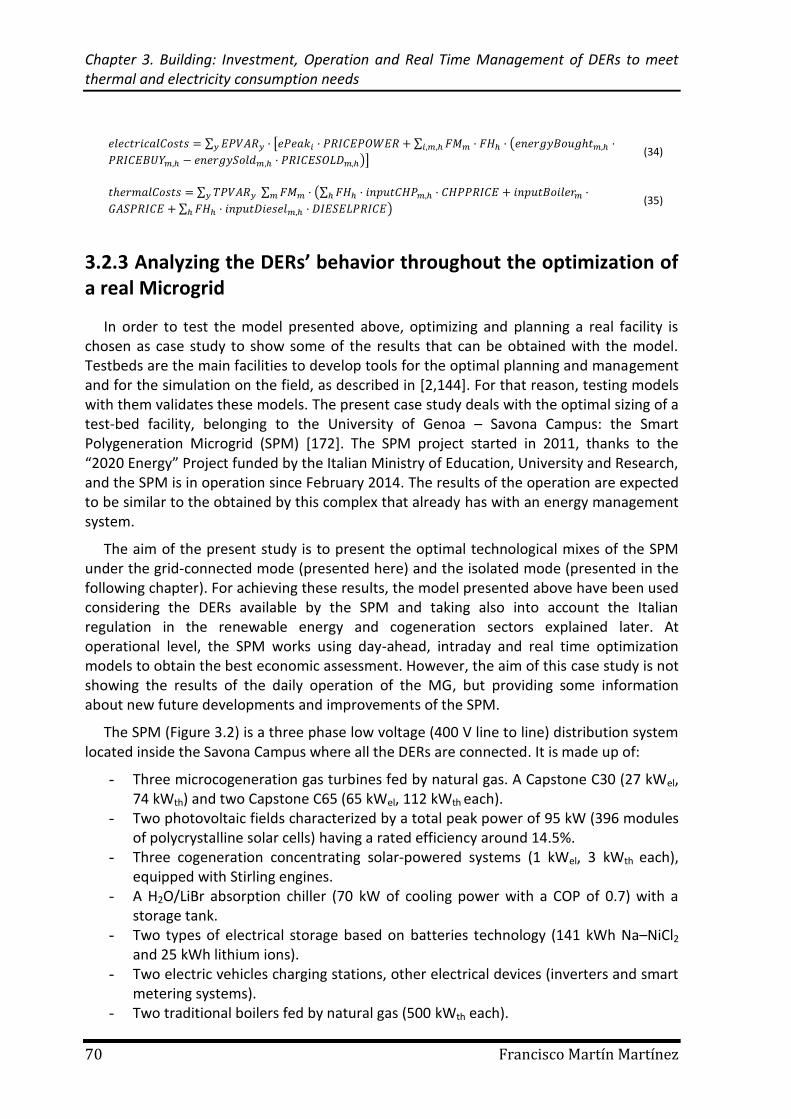
Chapter 3. Building: Investment, Operation and Real Time Management of DERs to meet thermal and electricity consumption needs
70 Francisco Martín Martínez
∑ [ ∑ (
)] (34)
∑ ∑ (∑
∑ ) (35)
3.2.3 Analyzing the DERs’ behavior throughout the optimization of a real Microgrid
In order to test the model presented above, optimizing and planning a real facility is chosen as case study to show some of the results that can be obtained with the model. Testbeds are the main facilities to develop tools for the optimal planning and management and for the simulation on the field, as described in [2,144]. For that reason, testing models with them validates these models. The present case study deals with the optimal sizing of a test-bed facility, belonging to the University of Genoa – Savona Campus: the Smart Polygeneration Microgrid (SPM) [172]. The SPM project started in 2011, thanks to the “2020 Energy” Project funded by the Italian Ministry of Education, University and Research, and the SPM is in operation since February 2014. The results of the operation are expected to be similar to the obtained by this complex that already has with an energy management system.
The aim of the present study is to present the optimal technological mixes of the SPM under the grid-connected mode (presented here) and the isolated mode (presented in the following chapter). For achieving these results, the model presented above have been used considering the DERs available by the SPM and taking also into account the Italian regulation in the renewable energy and cogeneration sectors explained later. At operational level, the SPM works using day-ahead, intraday and real time optimization models to obtain the best economic assessment. However, the aim of this case study is not showing the results of the daily operation of the MG, but providing some information about new future developments and improvements of the SPM.
The SPM (Figure 3.2) is a three phase low voltage (400 V line to line) distribution system located inside the Savona Campus where all the DERs are connected. It is made up of:
- Three microcogeneration gas turbines fed by natural gas. A Capstone C30 (27 kWel, 74 kWth) and two Capstone C65 (65 kWel, 112 kWth each).
- Two photovoltaic fields characterized by a total peak power of 95 kW (396 modules of polycrystalline solar cells) having a rated efficiency around 14.5%.
- Three cogeneration concentrating solar-powered systems (1 kWel, 3 kWth each), equipped with Stirling engines.
- A H2O/LiBr absorption chiller (70 kW of cooling power with a COP of 0.7) with a storage tank.
- Two types of electrical storage based on batteries technology (141 kWh Na–NiCl2 and 25 kWh lithium ions).
- Two electric vehicles charging stations, other electrical devices (inverters and smart metering systems).
- Two traditional boilers fed by natural gas (500 kWth each).
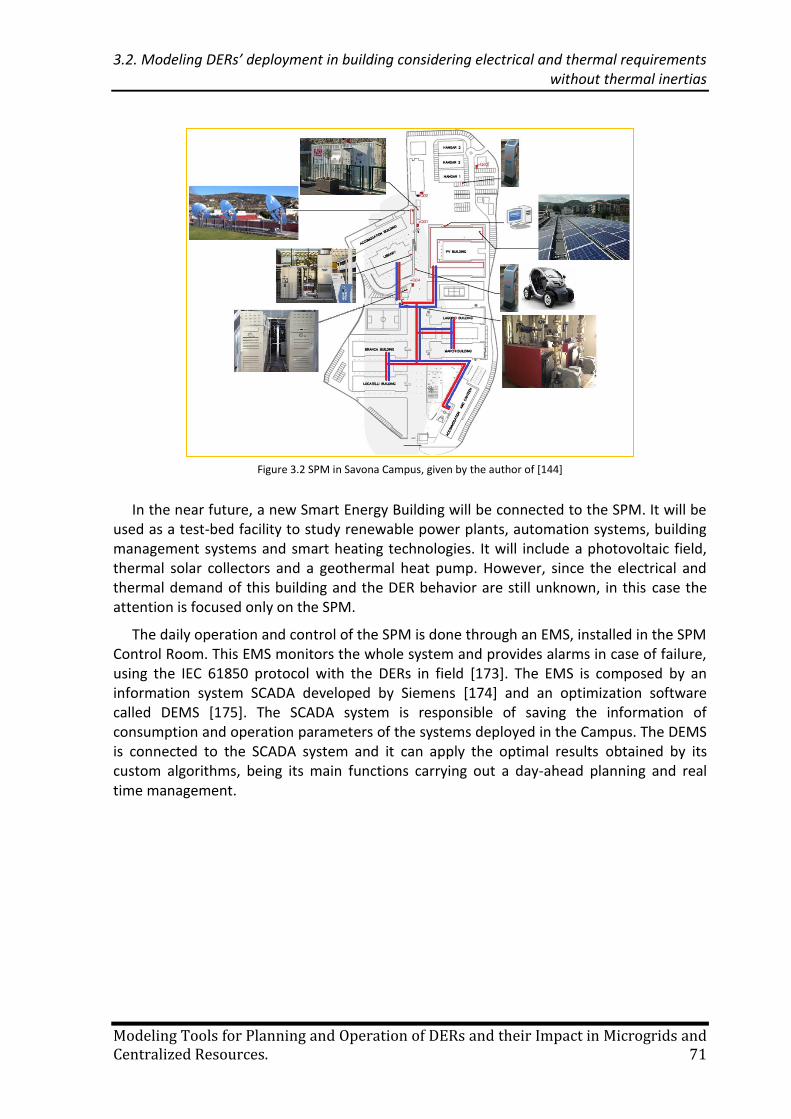
3.2. Modeling DERs’ deployment in building considering electrical and thermal requirements without thermal inertias
Modeling Tools for Planning and Operation of DERs and their Impact in Microgrids and Centralized Resources. 71
In the near future, a new Smart Energy Building will be connected to the SPM. It will be used as a test-bed facility to study renewable power plants, automation systems, building management systems and smart heating technologies. It will include a photovoltaic field, thermal solar collectors and a geothermal heat pump. However, since the electrical and thermal demand of this building and the DER behavior are still unknown, in this case the attention is focused only on the SPM.
The daily operation and control of the SPM is done through an EMS, installed in the SPM Control Room. This EMS monitors the whole system and provides alarms in case of failure, using the IEC 61850 protocol with the DERs in field [173]. The EMS is composed by an information system SCADA developed by Siemens [174] and an optimization software called DEMS [175]. The SCADA system is responsible of saving the information of consumption and operation parameters of the systems deployed in the Campus. The DEMS is connected to the SCADA system and it can apply the optimal results obtained by its custom algorithms, being its main functions carrying out a day-ahead planning and real time management.
Figure 3.2 SPM in Savona Campus, given by the author of [144]
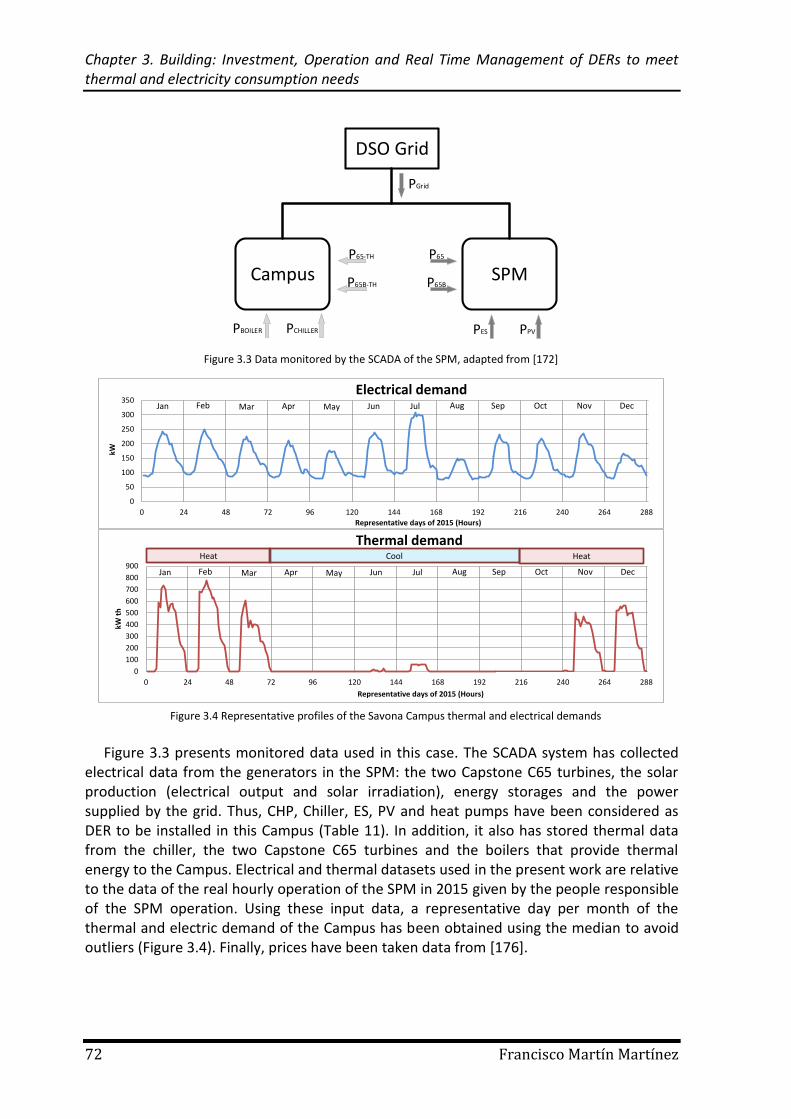
Chapter 3. Building: Investment, Operation and Real Time Management of DERs to meet thermal and electricity consumption needs
72 Francisco Martín Martínez
Figure 3.3 presents monitored data used in this case. The SCADA system has collected electrical data from the generators in the SPM: the two Capstone C65 turbines, the solar production (electrical output and solar irradiation), energy storages and the power supplied by the grid. Thus, CHP, Chiller, ES, PV and heat pumps have been considered as DER to be installed in this Campus (Table 11). In addition, it also has stored thermal data from the chiller, the two Capstone C65 turbines and the boilers that provide thermal energy to the Campus. Electrical and thermal datasets used in the present work are relative to the data of the real hourly operation of the SPM in 2015 given by the people responsible of the SPM operation. Using these input data, a representative day per month of the thermal and electric demand of the Campus has been obtained using the median to avoid outliers (Figure 3.4). Finally, prices have been taken data from [176].
DSO Grid
Campus SPM
PGrid
P65-TH P65
PPV
P65B
PES
P65B-TH
PBOILER PCHILLER
Figure 3.3 Data monitored by the SCADA of the SPM, adapted from [172]
0
50
100
150
200
250
300
350
0 24 48 72 96 120 144 168 192 216 240 264 288
kW
Representative days of 2015 (Hours)
Electrical demandSep Oct Nov DecJan MayMar JunApr Jul AugFeb
0
100
200
300
400
500
600
700
800
900
0 24 48 72 96 120 144 168 192 216 240 264 288
kW t
h
Representative days of 2015 (Hours)
Thermal demandHeat HeatCool
Jan MayMar JunApr Jul AugFeb Sep Oct Nov Dec
Figure 3.4 Representative profiles of the Savona Campus thermal and electrical demands
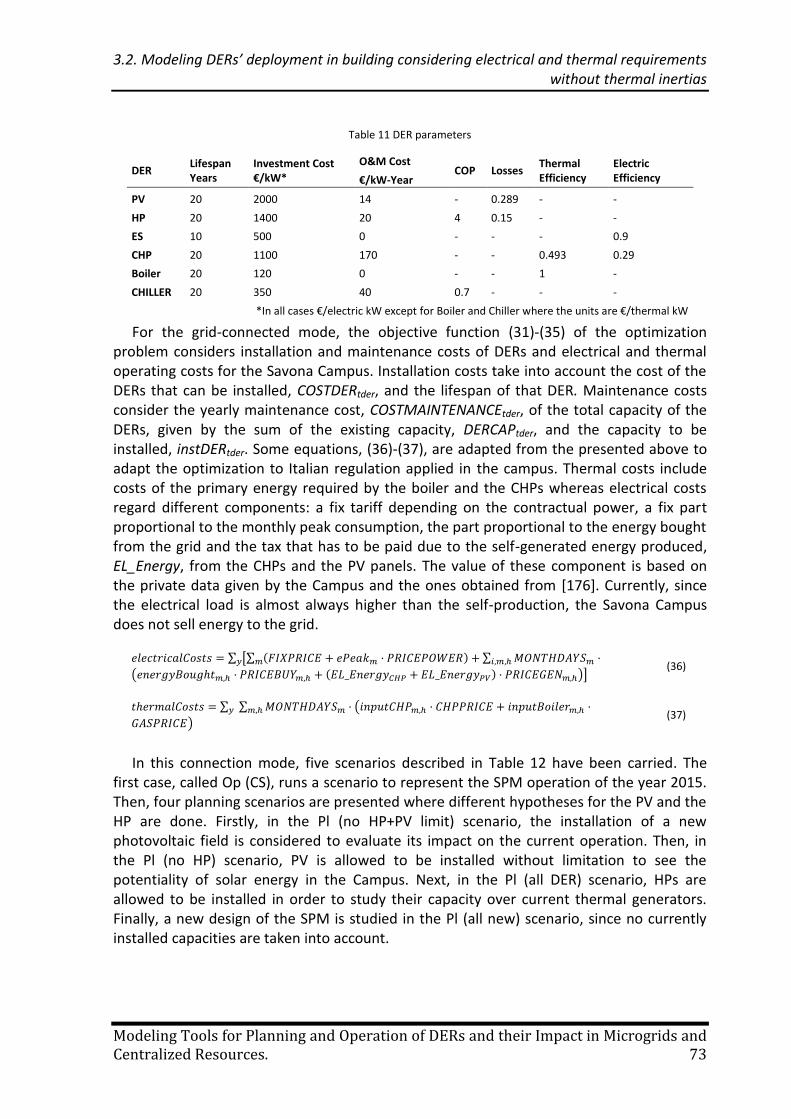
3.2. Modeling DERs’ deployment in building considering electrical and thermal requirements without thermal inertias
Modeling Tools for Planning and Operation of DERs and their Impact in Microgrids and Centralized Resources. 73
Table 11 DER parameters
DER Lifespan Years
Investment Cost €/kW*
O&M Cost
€/kW-Year COP Losses
Thermal Efficiency
Electric Efficiency
PV 20 2000 14 - 0.289 - -
HP 20 1400 20 4 0.15 - -
ES 10 500 0 - - - 0.9
CHP 20 1100 170 - - 0.493 0.29
Boiler 20 120 0 - - 1 -
CHILLER 20 350 40 0.7 - - -
*In all cases €/electric kW except for Boiler and Chiller where the units are €/thermal kW
For the grid-connected mode, the objective function (31)-(35) of the optimization problem considers installation and maintenance costs of DERs and electrical and thermal operating costs for the Savona Campus. Installation costs take into account the cost of the DERs that can be installed, COSTDERtder, and the lifespan of that DER. Maintenance costs consider the yearly maintenance cost, COSTMAINTENANCEtder, of the total capacity of the DERs, given by the sum of the existing capacity, DERCAPtder, and the capacity to be installed, instDERtder. Some equations, (36)-(37), are adapted from the presented above to adapt the optimization to Italian regulation applied in the campus. Thermal costs include costs of the primary energy required by the boiler and the CHPs whereas electrical costs regard different components: a fix tariff depending on the contractual power, a fix part proportional to the monthly peak consumption, the part proportional to the energy bought from the grid and the tax that has to be paid due to the self-generated energy produced, EL_Energy, from the CHPs and the PV panels. The value of these component is based on the private data given by the Campus and the ones obtained from [176]. Currently, since the electrical load is almost always higher than the self-production, the Savona Campus does not sell energy to the grid.
∑ [∑ ( ) ∑
( ( ) )] (36)
∑ ∑ (
) (37)
In this connection mode, five scenarios described in Table 12 have been carried. The first case, called Op (CS), runs a scenario to represent the SPM operation of the year 2015. Then, four planning scenarios are presented where different hypotheses for the PV and the HP are done. Firstly, in the Pl (no HP+PV limit) scenario, the installation of a new photovoltaic field is considered to evaluate its impact on the current operation. Then, in the Pl (no HP) scenario, PV is allowed to be installed without limitation to see the potentiality of solar energy in the Campus. Next, in the Pl (all DER) scenario, HPs are allowed to be installed in order to study their capacity over current thermal generators. Finally, a new design of the SPM is studied in the Pl (all new) scenario, since no currently installed capacities are taken into account.
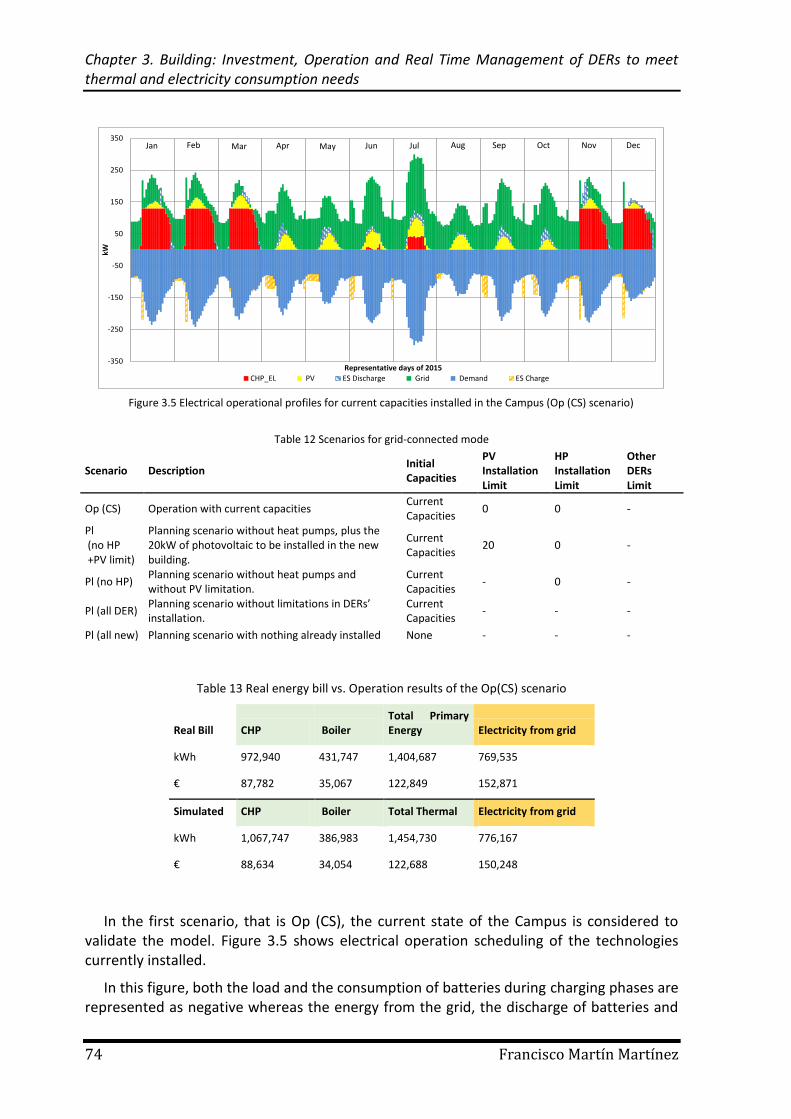
Chapter 3. Building: Investment, Operation and Real Time Management of DERs to meet thermal and electricity consumption needs
74 Francisco Martín Martínez
Table 12 Scenarios for grid-connected mode
Scenario Description Initial Capacities
PV Installation Limit
HP Installation Limit
Other DERs Limit
Op (CS) Operation with current capacities Current Capacities
0 0 -
Pl (no HP +PV limit)
Planning scenario without heat pumps, plus the 20kW of photovoltaic to be installed in the new building.
Current Capacities
20 0 -
Pl (no HP) Planning scenario without heat pumps and without PV limitation.
Current Capacities
- 0 -
Pl (all DER) Planning scenario without limitations in DERs’ installation.
Current Capacities
- - -
Pl (all new) Planning scenario with nothing already installed None - - -
Table 13 Real energy bill vs. Operation results of the Op(CS) scenario
Real Bill CHP Boiler Total Primary Energy Electricity from grid
kWh 972,940 431,747 1,404,687 769,535
€ 87,782 35,067 122,849 152,871
Simulated CHP Boiler Total Thermal Electricity from grid
kWh 1,067,747 386,983 1,454,730 776,167
€ 88,634 34,054 122,688 150,248
In the first scenario, that is Op (CS), the current state of the Campus is considered to validate the model. Figure 3.5 shows electrical operation scheduling of the technologies currently installed.
In this figure, both the load and the consumption of batteries during charging phases are represented as negative whereas the energy from the grid, the discharge of batteries and
-350
-250
-150
-50
50
150
250
350
kW
Representative days of 2015
CHP_EL PV ES Discharge Grid Demand ES Charge
Jan MayMar JunApr Jul AugFeb Sep Oct Nov Dec
Figure 3.5 Electrical operational profiles for current capacities installed in the Campus (Op (CS) scenario)
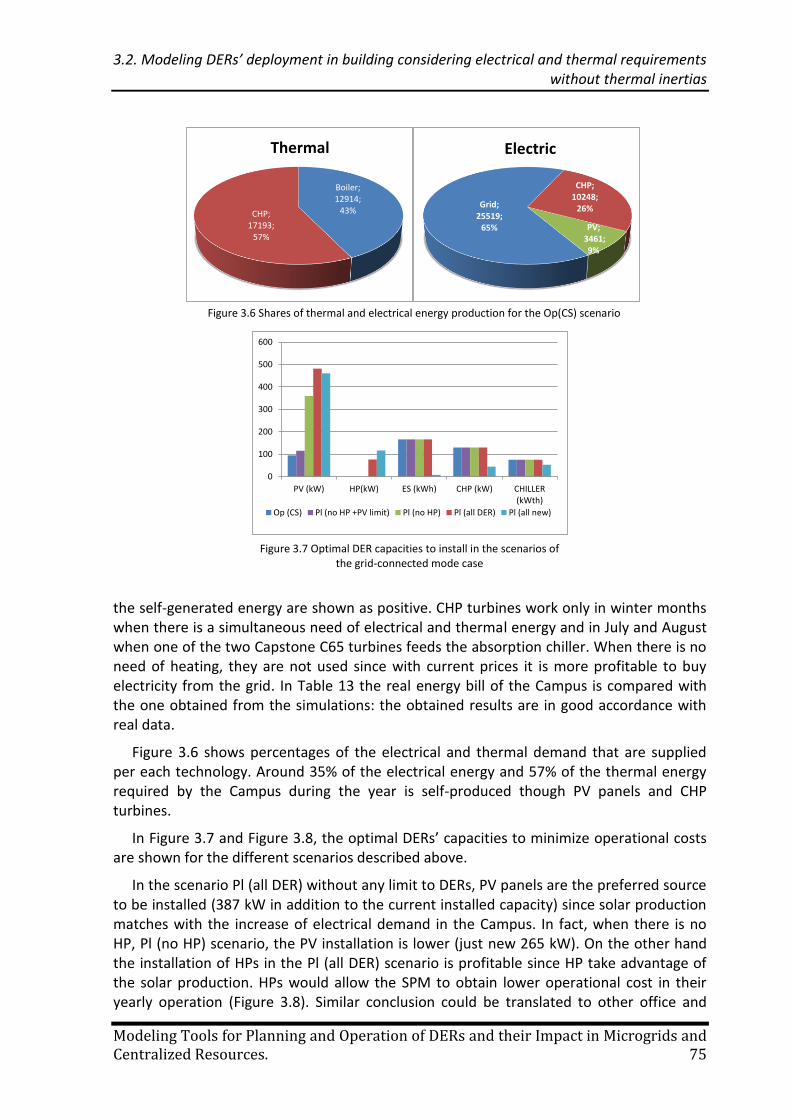
3.2. Modeling DERs’ deployment in building considering electrical and thermal requirements without thermal inertias
Modeling Tools for Planning and Operation of DERs and their Impact in Microgrids and Centralized Resources. 75
the self-generated energy are shown as positive. CHP turbines work only in winter months when there is a simultaneous need of electrical and thermal energy and in July and August when one of the two Capstone C65 turbines feeds the absorption chiller. When there is no need of heating, they are not used since with current prices it is more profitable to buy electricity from the grid. In Table 13 the real energy bill of the Campus is compared with the one obtained from the simulations: the obtained results are in good accordance with real data.
Figure 3.6 shows percentages of the electrical and thermal demand that are supplied per each technology. Around 35% of the electrical energy and 57% of the thermal energy required by the Campus during the year is self-produced though PV panels and CHP turbines.
In Figure 3.7 and Figure 3.8, the optimal DERs’ capacities to minimize operational costs are shown for the different scenarios described above.
In the scenario Pl (all DER) without any limit to DERs, PV panels are the preferred source to be installed (387 kW in addition to the current installed capacity) since solar production matches with the increase of electrical demand in the Campus. In fact, when there is no HP, Pl (no HP) scenario, the PV installation is lower (just new 265 kW). On the other hand the installation of HPs in the Pl (all DER) scenario is profitable since HP take advantage of the solar production. HPs would allow the SPM to obtain lower operational cost in their yearly operation (Figure 3.8). Similar conclusion could be translated to other office and
Boiler; 12914;
43%CHP; 17193;
57%
Thermal
Grid; 25519;
65%
CHP; 10248;
26%
PV;3461; 9%
Electric
Figure 3.6 Shares of thermal and electrical energy production for the Op(CS) scenario
0
100
200
300
400
500
600
PV (kW) HP(kW) ES (kWh) CHP (kW) CHILLER(kWth)
Op (CS) Pl (no HP +PV limit) Pl (no HP) Pl (all DER) Pl (all new)
Figure 3.7 Optimal DER capacities to install in the scenarios of the grid-connected mode case
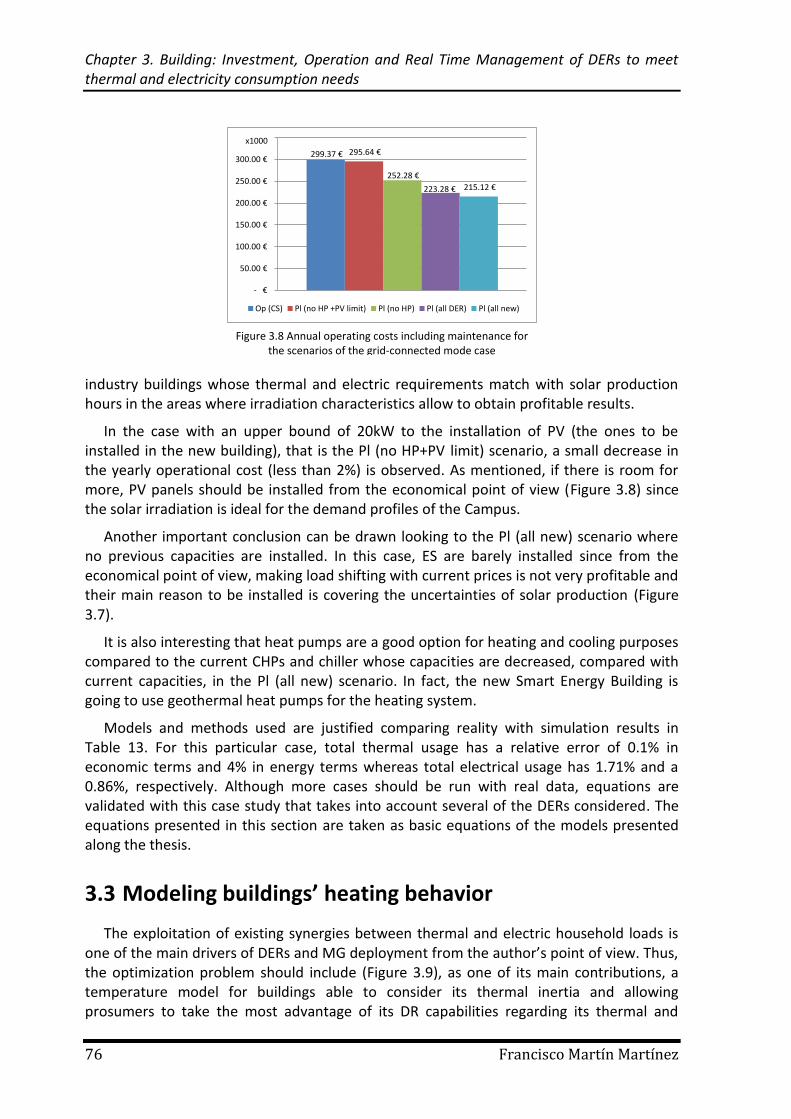
Chapter 3. Building: Investment, Operation and Real Time Management of DERs to meet thermal and electricity consumption needs
76 Francisco Martín Martínez
industry buildings whose thermal and electric requirements match with solar production hours in the areas where irradiation characteristics allow to obtain profitable results.
In the case with an upper bound of 20kW to the installation of PV (the ones to be installed in the new building), that is the Pl (no HP+PV limit) scenario, a small decrease in the yearly operational cost (less than 2%) is observed. As mentioned, if there is room for more, PV panels should be installed from the economical point of view (Figure 3.8) since the solar irradiation is ideal for the demand profiles of the Campus.
Another important conclusion can be drawn looking to the Pl (all new) scenario where no previous capacities are installed. In this case, ES are barely installed since from the economical point of view, making load shifting with current prices is not very profitable and their main reason to be installed is covering the uncertainties of solar production (Figure 3.7).
It is also interesting that heat pumps are a good option for heating and cooling purposes compared to the current CHPs and chiller whose capacities are decreased, compared with current capacities, in the Pl (all new) scenario. In fact, the new Smart Energy Building is going to use geothermal heat pumps for the heating system.
Models and methods used are justified comparing reality with simulation results in Table 13. For this particular case, total thermal usage has a relative error of 0.1% in economic terms and 4% in energy terms whereas total electrical usage has 1.71% and a 0.86%, respectively. Although more cases should be run with real data, equations are validated with this case study that takes into account several of the DERs considered. The equations presented in this section are taken as basic equations of the models presented along the thesis.
3.3 Modeling buildings’ heating behavior
The exploitation of existing synergies between thermal and electric household loads is one of the main drivers of DERs and MG deployment from the author’s point of view. Thus, the optimization problem should include (Figure 3.9), as one of its main contributions, a temperature model for buildings able to consider its thermal inertia and allowing prosumers to take the most advantage of its DR capabilities regarding its thermal and
299.37 € 295.64 €
252.28 €
223.28 € 215.12 €
- €
50.00 €
100.00 €
150.00 €
200.00 €
250.00 €
300.00 €
350.00 €
Op (CS) Pl (no HP +PV limit) Pl (no HP) Pl (all DER) Pl (all new)
x1000
Figure 3.8 Annual operating costs including maintenance for the scenarios of the grid-connected mode case
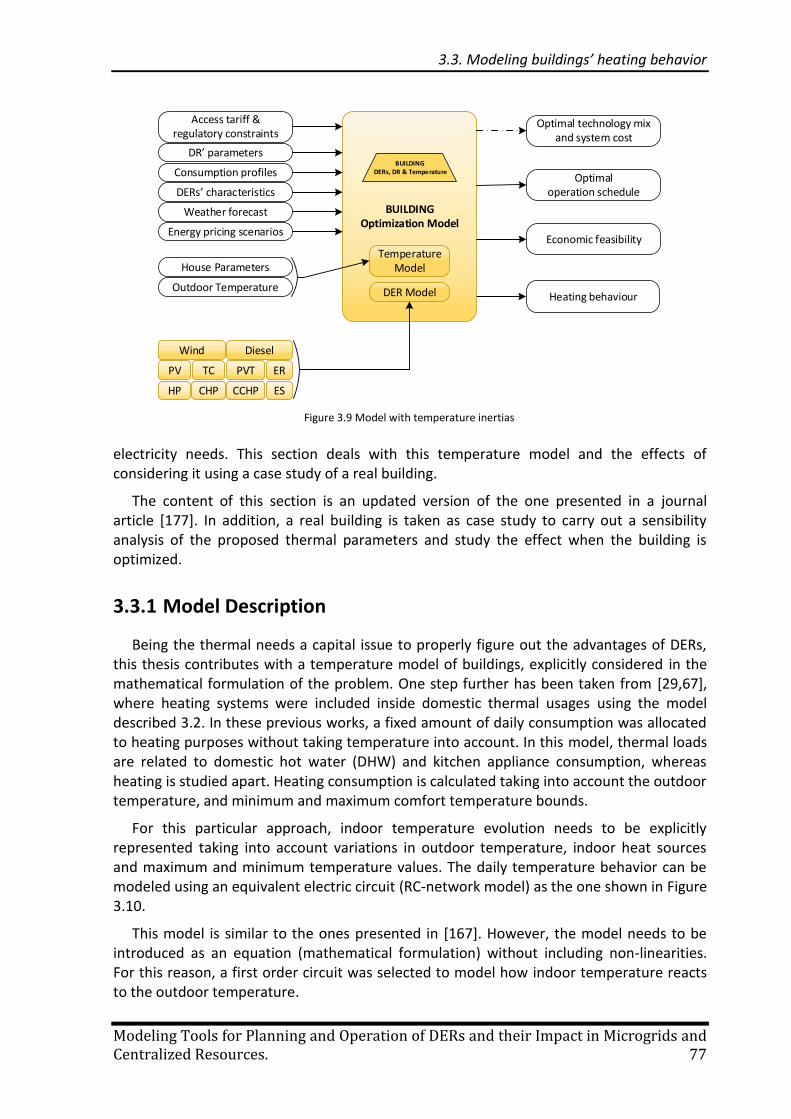
3.3. Modeling buildings’ heating behavior
Modeling Tools for Planning and Operation of DERs and their Impact in Microgrids and Centralized Resources. 77
electricity needs. This section deals with this temperature model and the effects of considering it using a case study of a real building.
The content of this section is an updated version of the one presented in a journal article [177]. In addition, a real building is taken as case study to carry out a sensibility analysis of the proposed thermal parameters and study the effect when the building is optimized.
3.3.1 Model Description
Being the thermal needs a capital issue to properly figure out the advantages of DERs, this thesis contributes with a temperature model of buildings, explicitly considered in the mathematical formulation of the problem. One step further has been taken from [29,67], where heating systems were included inside domestic thermal usages using the model described 3.2. In these previous works, a fixed amount of daily consumption was allocated to heating purposes without taking temperature into account. In this model, thermal loads are related to domestic hot water (DHW) and kitchen appliance consumption, whereas heating is studied apart. Heating consumption is calculated taking into account the outdoor temperature, and minimum and maximum comfort temperature bounds.
For this particular approach, indoor temperature evolution needs to be explicitly represented taking into account variations in outdoor temperature, indoor heat sources and maximum and minimum temperature values. The daily temperature behavior can be modeled using an equivalent electric circuit (RC-network model) as the one shown in Figure 3.10.
This model is similar to the ones presented in [167]. However, the model needs to be introduced as an equation (mathematical formulation) without including non-linearities. For this reason, a first order circuit was selected to model how indoor temperature reacts to the outdoor temperature.
Heating behaviour
Access tariff & regulatory constraints
DR’ parameters
Consumption profiles
DERs’ characteristics
Weather forecast
Energy pricing scenarios
BUILDINGOptimization Model
DER Model
Economic feasibility
Optimal operation schedule
Optimal technology mix and system cost
Temperature ModelHouse Parameters
Outdoor Temperature
BUILDING DERs, DR & Temperature
PV
Wind Diesel
TC
HP CHP CCHP ES
ERPVT
Figure 3.9 Model with temperature inertias
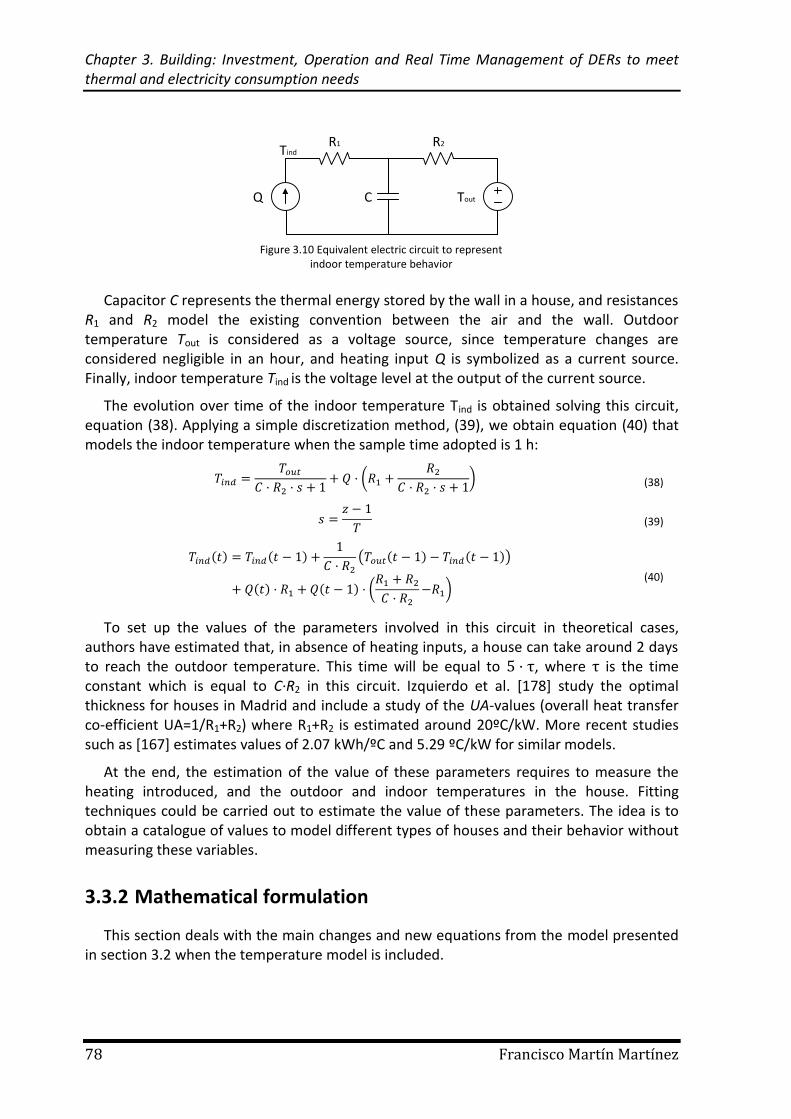
Chapter 3. Building: Investment, Operation and Real Time Management of DERs to meet thermal and electricity consumption needs
78 Francisco Martín Martínez
Capacitor C represents the thermal energy stored by the wall in a house, and resistances R1 and R2 model the existing convention between the air and the wall. Outdoor temperature Tout is considered as a voltage source, since temperature changes are considered negligible in an hour, and heating input Q is symbolized as a current source. Finally, indoor temperature Tind is the voltage level at the output of the current source.
The evolution over time of the indoor temperature Tind is obtained solving this circuit, equation (38). Applying a simple discretization method, (39), we obtain equation (40) that models the indoor temperature when the sample time adopted is 1 h:
(
) (38)
(39)
( ) ( )
( ( ) ( ))
( ) ( ) (
) (40)
To set up the values of the parameters involved in this circuit in theoretical cases, authors have estimated that, in absence of heating inputs, a house can take around 2 days to reach the outdoor temperature. This time will be equal to , where is the time constant which is equal to C·R2 in this circuit. Izquierdo et al. [178] study the optimal thickness for houses in Madrid and include a study of the UA-values (overall heat transfer co-efficient UA=1/R1+R2) where R1+R2 is estimated around 20ºC/kW. More recent studies such as [167] estimates values of 2.07 kWh/ºC and 5.29 ºC/kW for similar models.
At the end, the estimation of the value of these parameters requires to measure the heating introduced, and the outdoor and indoor temperatures in the house. Fitting techniques could be carried out to estimate the value of these parameters. The idea is to obtain a catalogue of values to model different types of houses and their behavior without measuring these variables.
3.3.2 Mathematical formulation
This section deals with the main changes and new equations from the model presented in section 3.2 when the temperature model is included.
Q
R1 R2
C Tout
Tind
Figure 3.10 Equivalent electric circuit to represent indoor temperature behavior
3.3. Modeling buildings’ heating behavior
Modeling Tools for Planning and Operation of DERs and their Impact in Microgrids and Centralized Resources. 79
Upgrades in DER modeling:
As previously said, heating and cooling needs are now independent of the rest of the thermal consumption. Main changes implies to divide the previous variables of electric consumption for thermal demands, therXi,m,h, in two variables, the same one for DHW requirements and a new one, tempXi,m,h, for heating purposes (41). If the device can also be used for cooling, another variable is used, for instance the HP includes inputACi,m,h.
(41)
Equation (11) would be modified for the HP in the following way (42):
(42)
Upgrades in thermal consumption modeling:
In the same way, gas variable is divided in two, the one related to the DHW consumption expressed daily, thermGASi,m, and the one related to heating expressed in each “intraday” period, tempGASi,m,h.
∑
(43)
Temperature behavior modeling:
The following constraints represent the temperature model described in previous section. Comfort temperatures considered are between TREFMINi,m,h (44) and TREFMAXi,m,h (45). Regarding temperature and thermal constraints, it is important to make notice that thermal generation of the air-source heat pump is considered to have a greater output than its actual production as it is compared with the cost of producing the same amount of energy with a conventional gas boiler with efficiency, THEREFFGAS. In addition, in order to equalize the efficiency of the HP for heating and cooling, the COP for cooling purposes is divided by 1.12, a value obtained from the tables of efficiency of these devices regarding its category. Equations (46) and (47) represent the equation (40) when only Gas and HP are considered.
(44)
(45)
( ) (
⁄ ( ))
( ⁄
( )) (
)
(46)
( ) (
⁄ ( ))
( ⁄
( )) (
)
(47)
Chapter 3. Building: Investment, Operation and Real Time Management of DERs to meet thermal and electricity consumption needs
80 Francisco Martín Martínez
Other DERs with thermal outputs from (23) related to heating consumptions could be added to (47) using the new variables created.
3.3.3 Thermal parameters – a model to estimate them
In order to use equation (40), some parameters should be defined as an input. In particular, heating generated in thermal energy units, and outdoor and indoor temperatures should be measured and introduced as input parameters. Actually, since each house differs from other, a fitting algorithm should be carried out per each case after having acquired data of the temperature and the heating energy used during a minimum period of time. Equation (48) includes the assumption that both resistances, R1 and R2, are equal and their sum is RUA (Resistance of the overall heat transfer co-efficient) in order to reduce the number of variables to fit to two: C and RUA.
( ) ( )
( ( ) ( ))
( )
( ) (
)
(48)
Non-linearity is presented in equation (48). For this reason, a two-step algorithm has been established for fitting this parameter (Figure 3.11).
In a first stage, typical values are used to build a grid in order to use a Mix integer programming to find the initial values to be used in the second part (107)-(113). The idea was obtained from [179] where authors use a grid to remove a similar non-linearity. The sets, parameters and equations used in this part are described in Appendix B.
In a second step, the corner values obtained in the first stage are used as initial value for a NLP which minimizes the weighted sum of the mean square errors of the temperature and the consumption fittings (114)-(118). The sets, parameters and equations used in this part are described in Appendix B.
Results obtained from this algorithm fix the time constant that determines the behavior of the system (see the sensitivity analysis made in the next section). However, final values of both parameters will be set to match consumption levels when the comfort levels are introduced as constraints instead of the actual consumption. In addition, days with undesired usages can be removed from the data introduced in the fitting estimation routine although a trade-off needs to be considered since estimating the inertia requires the time sequence.
Call MIP problem for setting initial parameters
Call NLP solverSet weights for fitting equilibrium
(Temperature vs Consumption fitting)
Build grid with typical values of C and UA
Y - UA
X - CX1 X2 X3 X4 X5 X
Y1
Y
Y2
Y3
Y4
Y5
Figure 3.11 Fitting temperature parameters algorithm
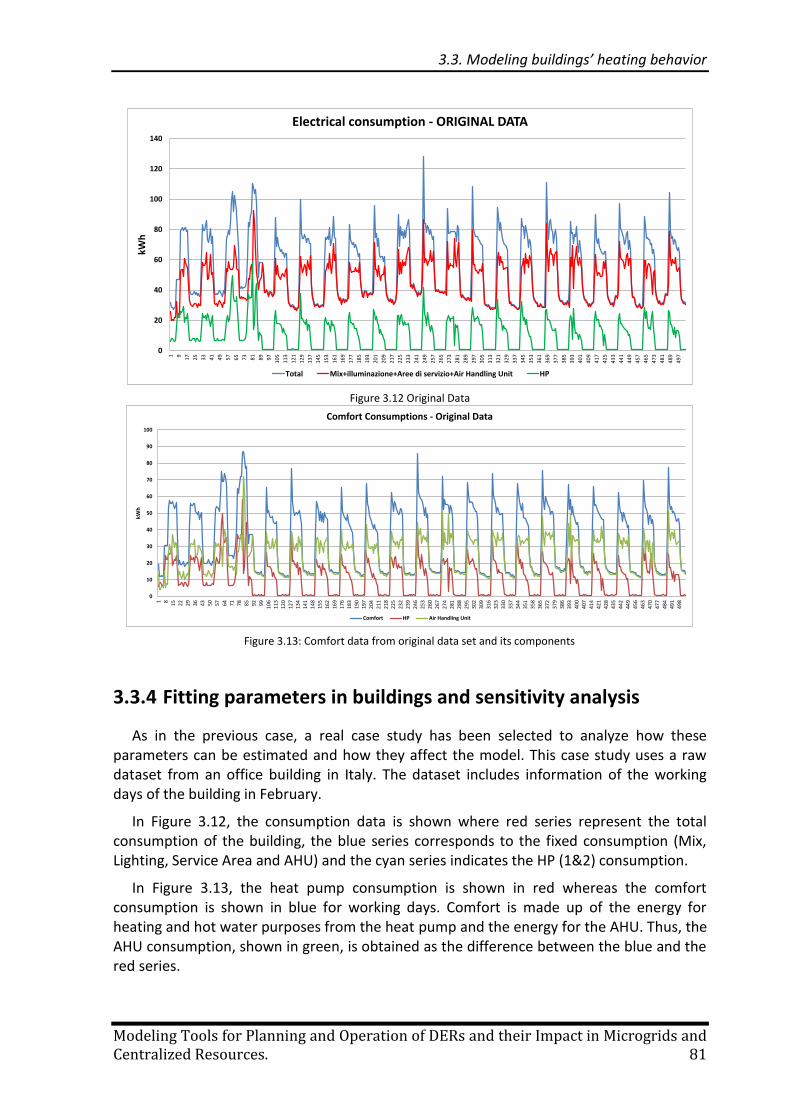
3.3. Modeling buildings’ heating behavior
Modeling Tools for Planning and Operation of DERs and their Impact in Microgrids and Centralized Resources. 81
3.3.4 Fitting parameters in buildings and sensitivity analysis
As in the previous case, a real case study has been selected to analyze how these parameters can be estimated and how they affect the model. This case study uses a raw dataset from an office building in Italy. The dataset includes information of the working days of the building in February.
In Figure 3.12, the consumption data is shown where red series represent the total consumption of the building, the blue series corresponds to the fixed consumption (Mix, Lighting, Service Area and AHU) and the cyan series indicates the HP (1&2) consumption.
In Figure 3.13, the heat pump consumption is shown in red whereas the comfort consumption is shown in blue for working days. Comfort is made up of the energy for heating and hot water purposes from the heat pump and the energy for the AHU. Thus, the AHU consumption, shown in green, is obtained as the difference between the blue and the red series.
0
10
20
30
40
50
60
70
80
90
100
1 8
15
22
29
36
43
50
57
64
71
78
85
92
99
10
6
11
3
12
0
12
7
13
4
14
1
14
8
15
5
16
2
16
9
17
6
18
3
19
0
19
7
20
4
21
1
21
8
22
5
23
2
23
9
24
6
25
3
26
0
26
7
27
4
28
1
28
8
29
5
30
2
30
9
31
6
32
3
33
0
33
7
34
4
35
1
35
8
36
5
37
2
37
9
38
6
39
3
40
0
40
7
41
4
42
1
42
8
43
5
44
2
44
9
45
6
46
3
47
0
47
7
48
4
49
1
49
8
kWh
Comfort Consumptions - Original Data
Comfort HP Air Handling Unit
Figure 3.13: Comfort data from original data set and its components
0
20
40
60
80
100
120
140
1 9
17
25
33
41
49
57
65
73
81
89
97
10
5
11
3
12
1
12
9
13
7
14
5
15
3
16
1
16
9
17
7
18
5
19
3
20
1
20
9
21
7
22
5
23
3
24
1
24
9
25
7
26
5
27
3
28
1
28
9
29
7
30
5
31
3
32
1
32
9
33
7
34
5
35
3
36
1
36
9
37
7
38
5
39
3
40
1
40
9
41
7
42
5
43
3
44
1
44
9
45
7
46
5
47
3
48
1
48
9
49
7
kWh
Electrical consumption - ORIGINAL DATA
Total Mix+illuminazione+Aree di servizio+Air Handling Unit HP
Figure 3.12 Original Data
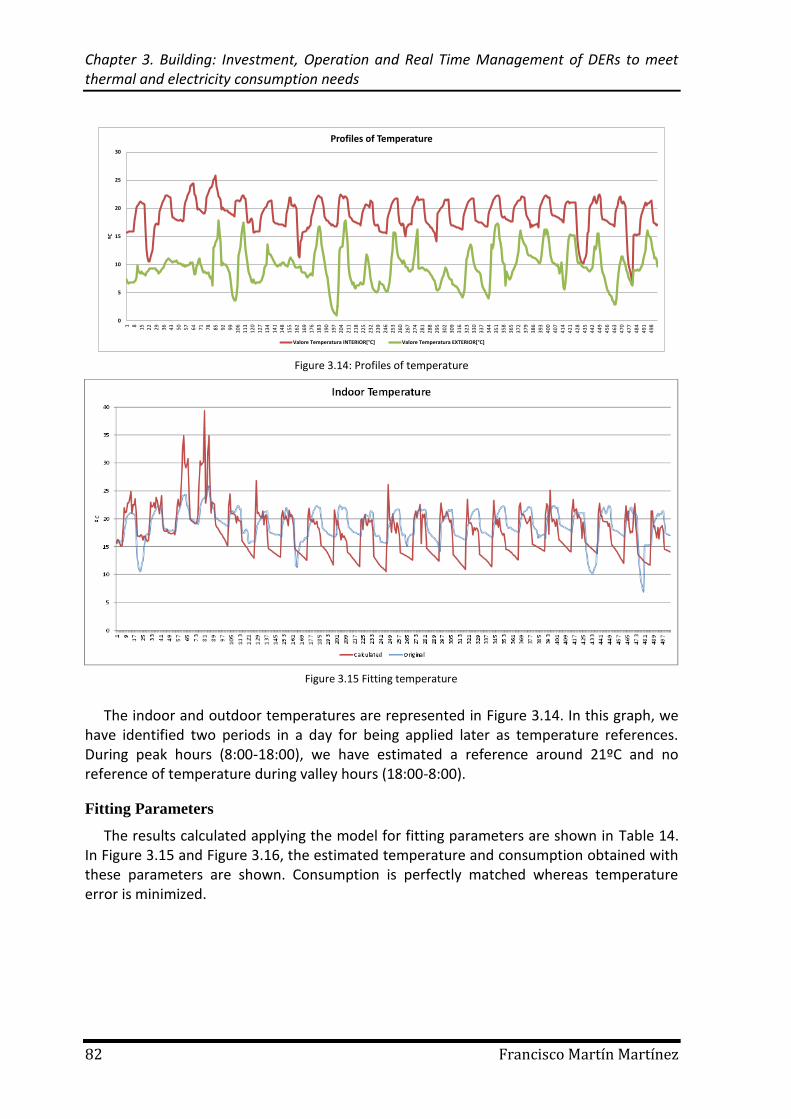
Chapter 3. Building: Investment, Operation and Real Time Management of DERs to meet thermal and electricity consumption needs
82 Francisco Martín Martínez
The indoor and outdoor temperatures are represented in Figure 3.14. In this graph, we have identified two periods in a day for being applied later as temperature references. During peak hours (8:00-18:00), we have estimated a reference around 21ºC and no reference of temperature during valley hours (18:00-8:00).
Fitting Parameters
The results calculated applying the model for fitting parameters are shown in Table 14. In Figure 3.15 and Figure 3.16, the estimated temperature and consumption obtained with these parameters are shown. Consumption is perfectly matched whereas temperature error is minimized.
0
5
10
15
20
25
30
1 8
15
22
29
36
43
50
57
64
71
78
85
92
99
10
6
11
3
12
0
12
7
13
4
14
1
14
8
15
5
16
2
16
9
17
6
18
3
19
0
19
7
20
4
21
1
21
8
22
5
23
2
23
9
24
6
25
3
26
0
26
7
27
4
28
1
28
8
29
5
30
2
30
9
31
6
32
3
33
0
33
7
34
4
35
1
35
8
36
5
37
2
37
9
38
6
39
3
40
0
40
7
41
4
42
1
42
8
43
5
44
2
44
9
45
6
46
3
47
0
47
7
48
4
49
1
49
8
ºC
Profiles of Temperature
Valore Temperatura INTERIOR[°C] Valore Temperatura EXTERIOR[°C]
Figure 3.14: Profiles of temperature
Figure 3.15 Fitting temperature
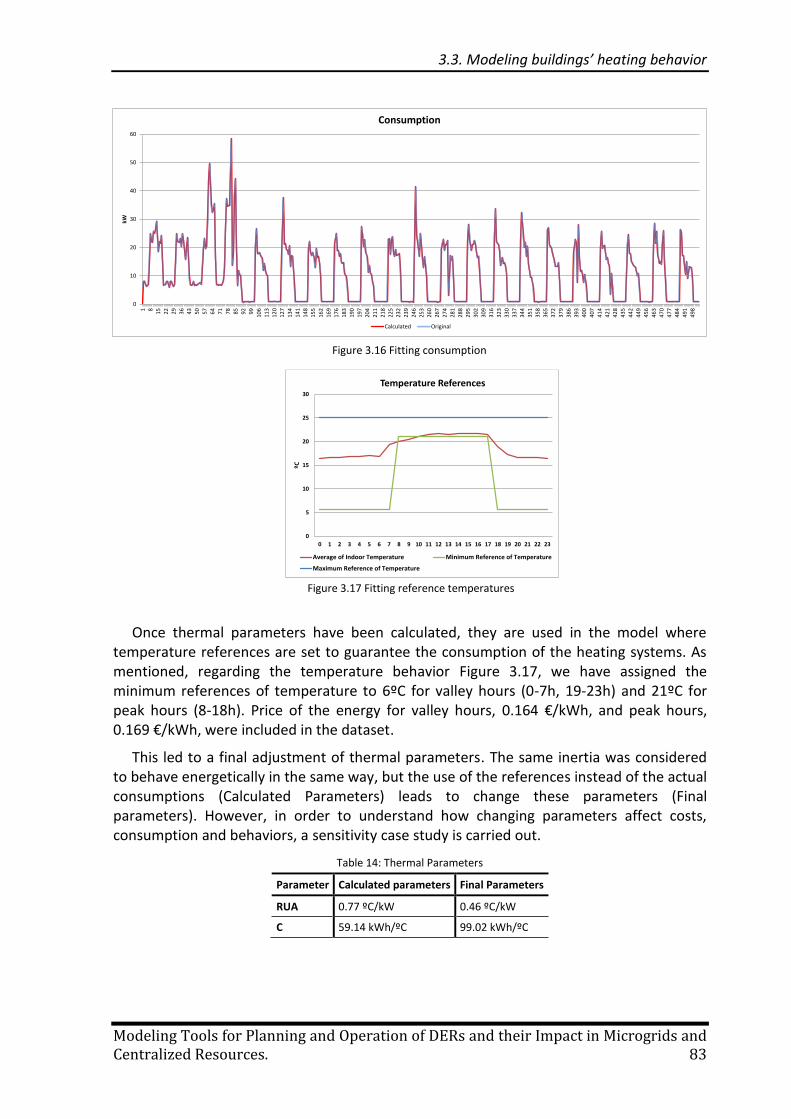
3.3. Modeling buildings’ heating behavior
Modeling Tools for Planning and Operation of DERs and their Impact in Microgrids and Centralized Resources. 83
Once thermal parameters have been calculated, they are used in the model where temperature references are set to guarantee the consumption of the heating systems. As mentioned, regarding the temperature behavior Figure 3.17, we have assigned the minimum references of temperature to 6ºC for valley hours (0-7h, 19-23h) and 21ºC for peak hours (8-18h). Price of the energy for valley hours, 0.164 €/kWh, and peak hours, 0.169 €/kWh, were included in the dataset.
This led to a final adjustment of thermal parameters. The same inertia was considered to behave energetically in the same way, but the use of the references instead of the actual consumptions (Calculated Parameters) leads to change these parameters (Final parameters). However, in order to understand how changing parameters affect costs, consumption and behaviors, a sensitivity case study is carried out.
Table 14: Thermal Parameters
Parameter Calculated parameters Final Parameters
RUA 0.77 ºC/kW 0.46 ºC/kW
C 59.14 kWh/ºC 99.02 kWh/ºC
0
5
10
15
20
25
30
0 1 2 3 4 5 6 7 8 9 10 11 12 13 14 15 16 17 18 19 20 21 22 23
ºC
Temperature References
Average of Indoor Temperature Minimum Reference of Temperature
Maximum Reference of Temperature
Figure 3.17 Fitting reference temperatures
0
10
20
30
40
50
601 8
15
22
29
36
43
50
57
64
71
78
85
92
99
10
61
13
12
01
27
13
4
14
11
48
15
5
16
2
16
91
76
18
31
90
19
72
04
21
12
18
22
5
23
22
39
24
6
25
3
26
02
67
27
42
81
28
82
95
30
23
09
31
6
32
33
30
33
73
44
35
13
58
36
53
72
37
9
38
63
93
40
0
40
7
41
44
21
42
84
35
44
24
49
45
64
63
47
0
47
74
84
49
1
49
8
kWConsumption
Calculated Original
Figure 3.16 Fitting consumption
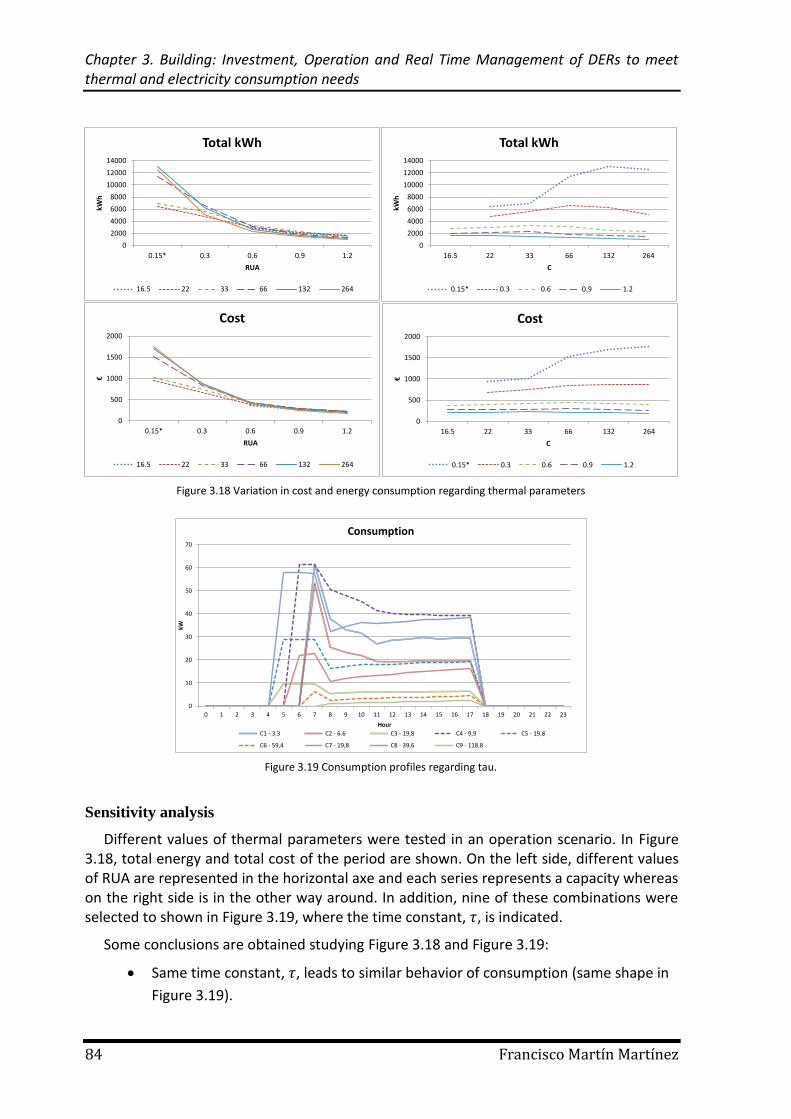
Chapter 3. Building: Investment, Operation and Real Time Management of DERs to meet thermal and electricity consumption needs
84 Francisco Martín Martínez
Sensitivity analysis
Different values of thermal parameters were tested in an operation scenario. In Figure 3.18, total energy and total cost of the period are shown. On the left side, different values of RUA are represented in the horizontal axe and each series represents a capacity whereas on the right side is in the other way around. In addition, nine of these combinations were selected to shown in Figure 3.19, where the time constant, , is indicated.
Some conclusions are obtained studying Figure 3.18 and Figure 3.19:
Same time constant, , leads to similar behavior of consumption (same shape in
Figure 3.19).
0
10
20
30
40
50
60
70
0 1 2 3 4 5 6 7 8 9 10 11 12 13 14 15 16 17 18 19 20 21 22 23
kW
Hour
Consumption
C1 - 3.3 C2 - 6.6 C3 - 19,8 C4 - 9,9 C5 - 19,8
C6 - 59,4 C7 - 19,8 C8 - 39,6 C9 - 118,8
Figure 3.19 Consumption profiles regarding tau.
0
2000
4000
6000
8000
10000
12000
14000
0.15* 0.3 0.6 0.9 1.2
kWh
RUA
Total kWh
16.5 22 33 66 132 264
0
500
1000
1500
2000
0.15* 0.3 0.6 0.9 1.2
€
RUA
Cost
16.5 22 33 66 132 264
0
2000
4000
6000
8000
10000
12000
14000
16.5 22 33 66 132 264
kWh
C
Total kWh
0.15* 0.3 0.6 0.9 1.2
0
500
1000
1500
2000
16.5 22 33 66 132 264
€
C
Cost
0.15* 0.3 0.6 0.9 1.2
Figure 3.18 Variation in cost and energy consumption regarding thermal parameters
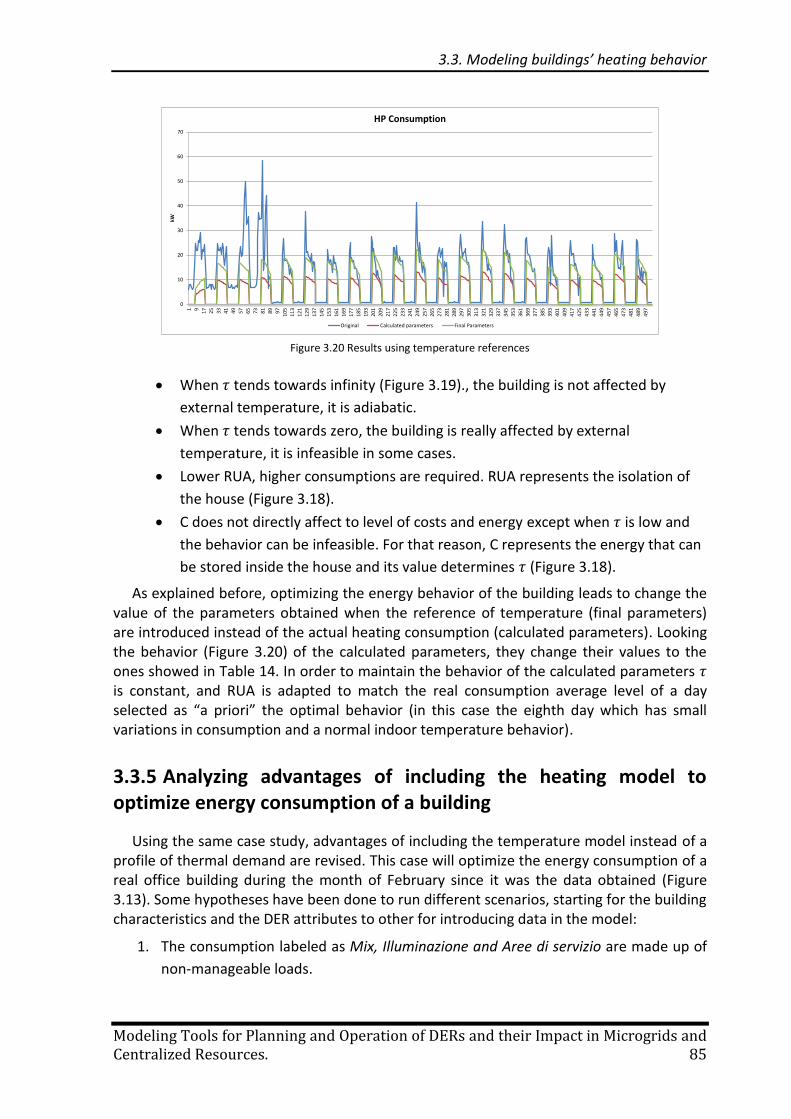
3.3. Modeling buildings’ heating behavior
Modeling Tools for Planning and Operation of DERs and their Impact in Microgrids and Centralized Resources. 85
When tends towards infinity (Figure 3.19)., the building is not affected by
external temperature, it is adiabatic.
When tends towards zero, the building is really affected by external
temperature, it is infeasible in some cases.
Lower RUA, higher consumptions are required. RUA represents the isolation of
the house (Figure 3.18).
C does not directly affect to level of costs and energy except when is low and
the behavior can be infeasible. For that reason, C represents the energy that can
be stored inside the house and its value determines (Figure 3.18).
As explained before, optimizing the energy behavior of the building leads to change the value of the parameters obtained when the reference of temperature (final parameters) are introduced instead of the actual heating consumption (calculated parameters). Looking the behavior (Figure 3.20) of the calculated parameters, they change their values to the ones showed in Table 14. In order to maintain the behavior of the calculated parameters is constant, and RUA is adapted to match the real consumption average level of a day selected as “a priori” the optimal behavior (in this case the eighth day which has small variations in consumption and a normal indoor temperature behavior).
3.3.5 Analyzing advantages of including the heating model to optimize energy consumption of a building
Using the same case study, advantages of including the temperature model instead of a profile of thermal demand are revised. This case will optimize the energy consumption of a real office building during the month of February since it was the data obtained (Figure 3.13). Some hypotheses have been done to run different scenarios, starting for the building characteristics and the DER attributes to other for introducing data in the model:
1. The consumption labeled as Mix, Illuminazione and Aree di servizio are made up of
non-manageable loads.
0
10
20
30
40
50
60
70
1 9
17
25
33
41
49
57
65
73
81
89
97
10
5
11
3
12
1
12
9
13
7
14
5
15
3
16
1
16
9
17
7
18
5
19
3
20
1
20
9
21
7
22
5
23
3
24
1
24
9
25
7
26
5
27
3
28
1
28
9
29
7
30
5
31
3
32
1
32
9
33
7
34
5
35
3
36
1
36
9
37
7
38
5
39
3
40
1
40
9
41
7
42
5
43
3
44
1
44
9
45
7
46
5
47
3
48
1
48
9
49
7
kW
HP Consumption
Original Calculated parameters Final Parameters
Figure 3.20 Results using temperature references
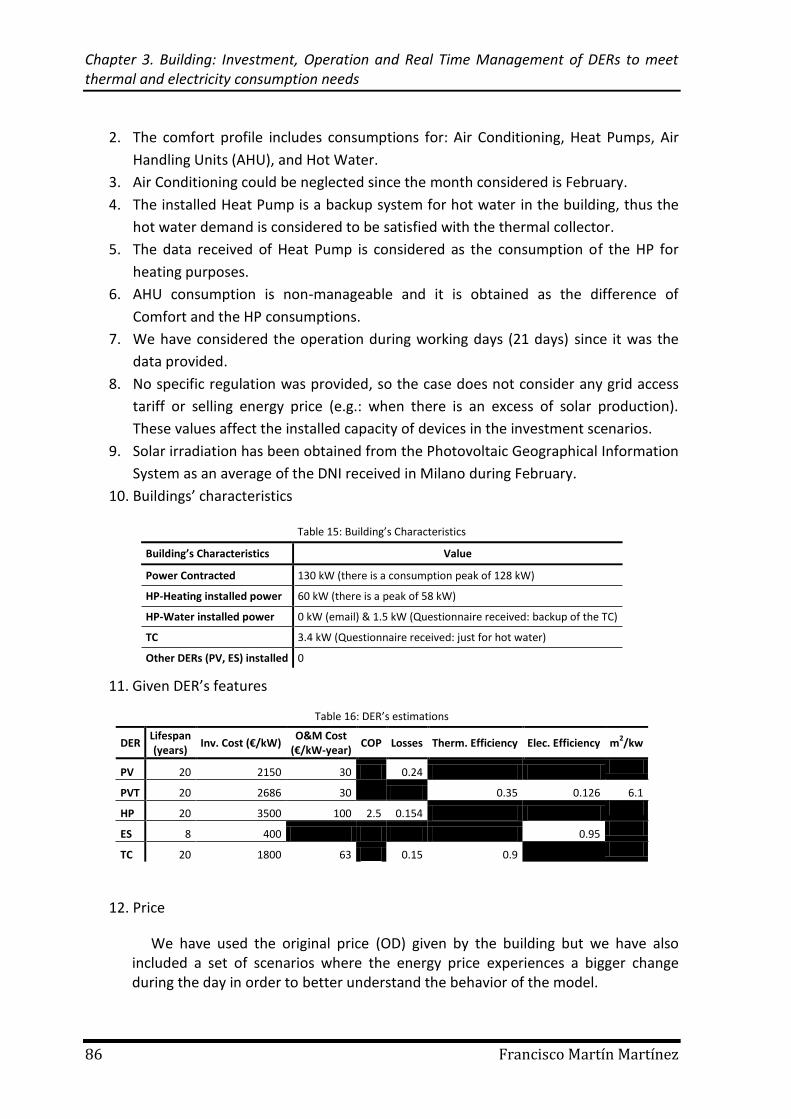
Chapter 3. Building: Investment, Operation and Real Time Management of DERs to meet thermal and electricity consumption needs
86 Francisco Martín Martínez
2. The comfort profile includes consumptions for: Air Conditioning, Heat Pumps, Air
Handling Units (AHU), and Hot Water.
3. Air Conditioning could be neglected since the month considered is February.
4. The installed Heat Pump is a backup system for hot water in the building, thus the
hot water demand is considered to be satisfied with the thermal collector.
5. The data received of Heat Pump is considered as the consumption of the HP for
heating purposes.
6. AHU consumption is non-manageable and it is obtained as the difference of
Comfort and the HP consumptions.
7. We have considered the operation during working days (21 days) since it was the
data provided.
8. No specific regulation was provided, so the case does not consider any grid access
tariff or selling energy price (e.g.: when there is an excess of solar production).
These values affect the installed capacity of devices in the investment scenarios.
9. Solar irradiation has been obtained from the Photovoltaic Geographical Information
System as an average of the DNI received in Milano during February.
10. Buildings’ characteristics
Table 15: Building’s Characteristics
Building’s Characteristics Value
Power Contracted 130 kW (there is a consumption peak of 128 kW)
HP-Heating installed power 60 kW (there is a peak of 58 kW)
HP-Water installed power 0 kW (email) & 1.5 kW (Questionnaire received: backup of the TC)
TC 3.4 kW (Questionnaire received: just for hot water)
Other DERs (PV, ES) installed 0
11. Given DER’s features
Table 16: DER’s estimations
DER Lifespan (years)
Inv. Cost (€/kW) O&M Cost
(€/kW-year) COP Losses Therm. Efficiency Elec. Efficiency m
2/kw
PV 20 2150 30 0.24
PVT 20 2686 30
0.35 0.126 6.1
HP 20 3500 100 2.5 0.154
ES 8 400 0.95
TC 20 1800 63 0.15 0.9
12. Price
We have used the original price (OD) given by the building but we have also included a set of scenarios where the energy price experiences a bigger change during the day in order to better understand the behavior of the model.
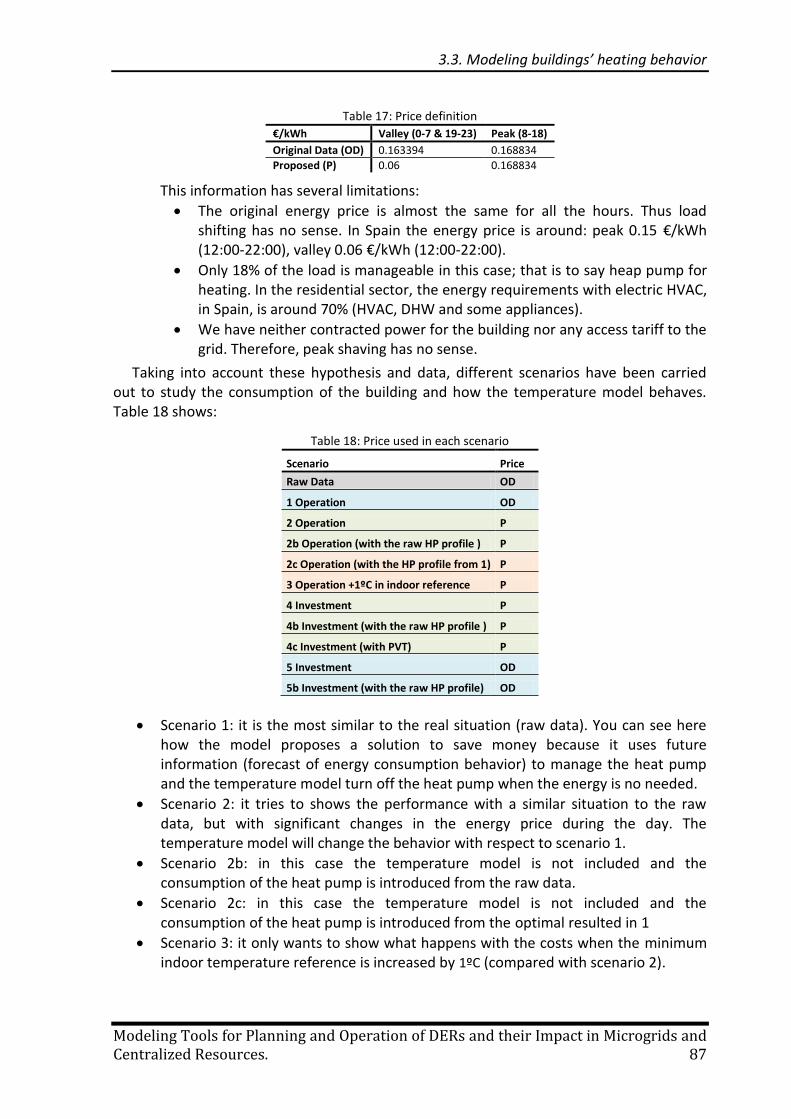
3.3. Modeling buildings’ heating behavior
Modeling Tools for Planning and Operation of DERs and their Impact in Microgrids and Centralized Resources. 87
Table 17: Price definition
€/kWh Valley (0-7 & 19-23) Peak (8-18)
Original Data (OD) 0.163394 0.168834
Proposed (P) 0.06 0.168834
This information has several limitations:
The original energy price is almost the same for all the hours. Thus load shifting has no sense. In Spain the energy price is around: peak 0.15 €/kWh (12:00-22:00), valley 0.06 €/kWh (12:00-22:00).
Only 18% of the load is manageable in this case; that is to say heap pump for heating. In the residential sector, the energy requirements with electric HVAC, in Spain, is around 70% (HVAC, DHW and some appliances).
We have neither contracted power for the building nor any access tariff to the grid. Therefore, peak shaving has no sense.
Taking into account these hypothesis and data, different scenarios have been carried out to study the consumption of the building and how the temperature model behaves. Table 18 shows:
Table 18: Price used in each scenario
Scenario Price
Raw Data OD
1 Operation OD
2 Operation P
2b Operation (with the raw HP profile ) P
2c Operation (with the HP profile from 1) P
3 Operation +1ºC in indoor reference P
4 Investment P
4b Investment (with the raw HP profile ) P
4c Investment (with PVT) P
5 Investment OD
5b Investment (with the raw HP profile) OD
Scenario 1: it is the most similar to the real situation (raw data). You can see here how the model proposes a solution to save money because it uses future information (forecast of energy consumption behavior) to manage the heat pump and the temperature model turn off the heat pump when the energy is no needed.
Scenario 2: it tries to shows the performance with a similar situation to the raw data, but with significant changes in the energy price during the day. The temperature model will change the behavior with respect to scenario 1.
Scenario 2b: in this case the temperature model is not included and the consumption of the heat pump is introduced from the raw data.
Scenario 2c: in this case the temperature model is not included and the consumption of the heat pump is introduced from the optimal resulted in 1
Scenario 3: it only wants to show what happens with the costs when the minimum indoor temperature reference is increased by 1ºC (compared with scenario 2).
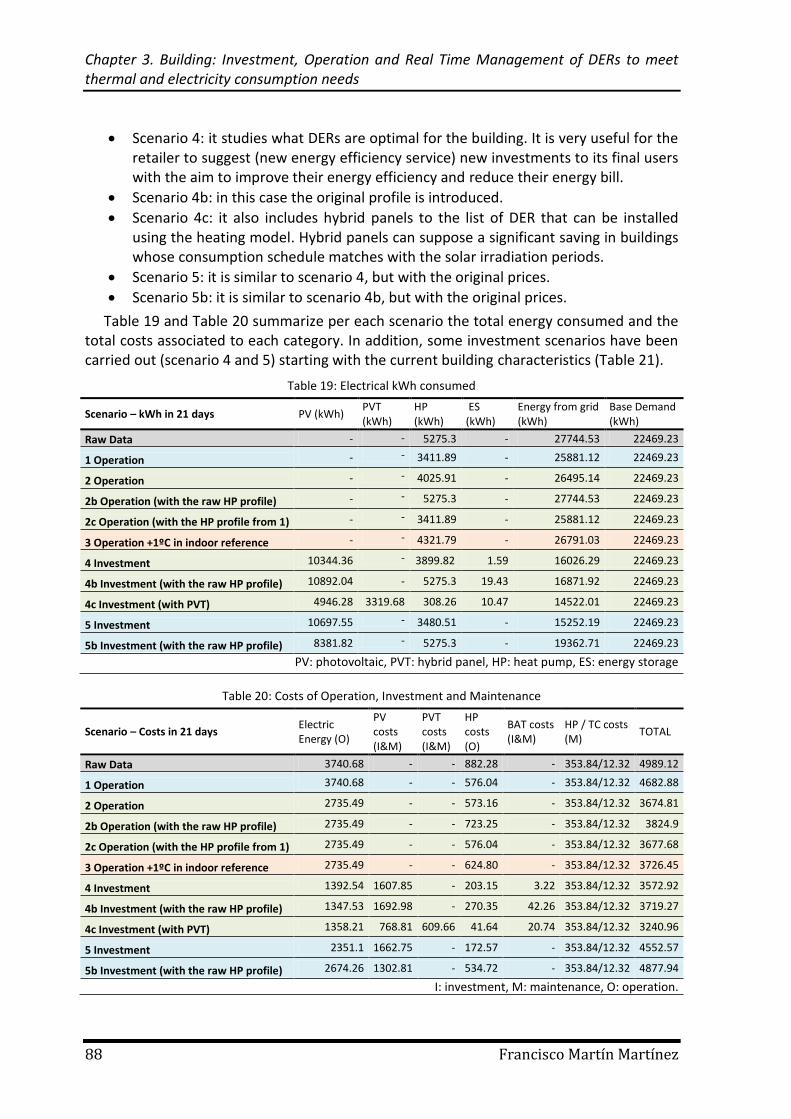
Chapter 3. Building: Investment, Operation and Real Time Management of DERs to meet thermal and electricity consumption needs
88 Francisco Martín Martínez
Scenario 4: it studies what DERs are optimal for the building. It is very useful for the retailer to suggest (new energy efficiency service) new investments to its final users with the aim to improve their energy efficiency and reduce their energy bill.
Scenario 4b: in this case the original profile is introduced.
Scenario 4c: it also includes hybrid panels to the list of DER that can be installed using the heating model. Hybrid panels can suppose a significant saving in buildings whose consumption schedule matches with the solar irradiation periods.
Scenario 5: it is similar to scenario 4, but with the original prices.
Scenario 5b: it is similar to scenario 4b, but with the original prices.
Table 19 and Table 20 summarize per each scenario the total energy consumed and the total costs associated to each category. In addition, some investment scenarios have been carried out (scenario 4 and 5) starting with the current building characteristics (Table 21).
Table 19: Electrical kWh consumed
Scenario – kWh in 21 days PV (kWh) PVT (kWh)
HP (kWh)
ES (kWh)
Energy from grid (kWh)
Base Demand (kWh)
Raw Data - - 5275.3 - 27744.53 22469.23
1 Operation - - 3411.89 - 25881.12 22469.23
2 Operation - - 4025.91 - 26495.14 22469.23
2b Operation (with the raw HP profile) - - 5275.3 - 27744.53 22469.23
2c Operation (with the HP profile from 1) - - 3411.89 - 25881.12 22469.23
3 Operation +1ºC in indoor reference - - 4321.79 - 26791.03 22469.23
4 Investment 10344.36 - 3899.82 1.59 16026.29 22469.23
4b Investment (with the raw HP profile) 10892.04 - 5275.3 19.43 16871.92 22469.23
4c Investment (with PVT) 4946.28 3319.68 308.26 10.47 14522.01 22469.23
5 Investment 10697.55 - 3480.51 - 15252.19 22469.23
5b Investment (with the raw HP profile) 8381.82 - 5275.3 - 19362.71 22469.23
PV: photovoltaic, PVT: hybrid panel, HP: heat pump, ES: energy storage
Table 20: Costs of Operation, Investment and Maintenance
Scenario – Costs in 21 days Electric Energy (O)
PV costs (I&M)
PVT costs (I&M)
HP costs (O)
BAT costs (I&M)
HP / TC costs (M)
TOTAL
Raw Data 3740.68 - - 882.28 - 353.84/12.32 4989.12
1 Operation 3740.68 - - 576.04 - 353.84/12.32 4682.88
2 Operation 2735.49 - - 573.16 - 353.84/12.32 3674.81
2b Operation (with the raw HP profile) 2735.49 - - 723.25 - 353.84/12.32 3824.9
2c Operation (with the HP profile from 1) 2735.49 - - 576.04 - 353.84/12.32 3677.68
3 Operation +1ºC in indoor reference 2735.49 - - 624.80 - 353.84/12.32 3726.45
4 Investment 1392.54 1607.85 - 203.15 3.22 353.84/12.32 3572.92
4b Investment (with the raw HP profile) 1347.53 1692.98 - 270.35 42.26 353.84/12.32 3719.27
4c Investment (with PVT) 1358.21 768.81 609.66 41.64 20.74 353.84/12.32 3240.96
5 Investment 2351.1 1662.75 - 172.57 - 353.84/12.32 4552.57
5b Investment (with the raw HP profile) 2674.26 1302.81 - 534.72 - 353.84/12.32 4877.94
I: investment, M: maintenance, O: operation.
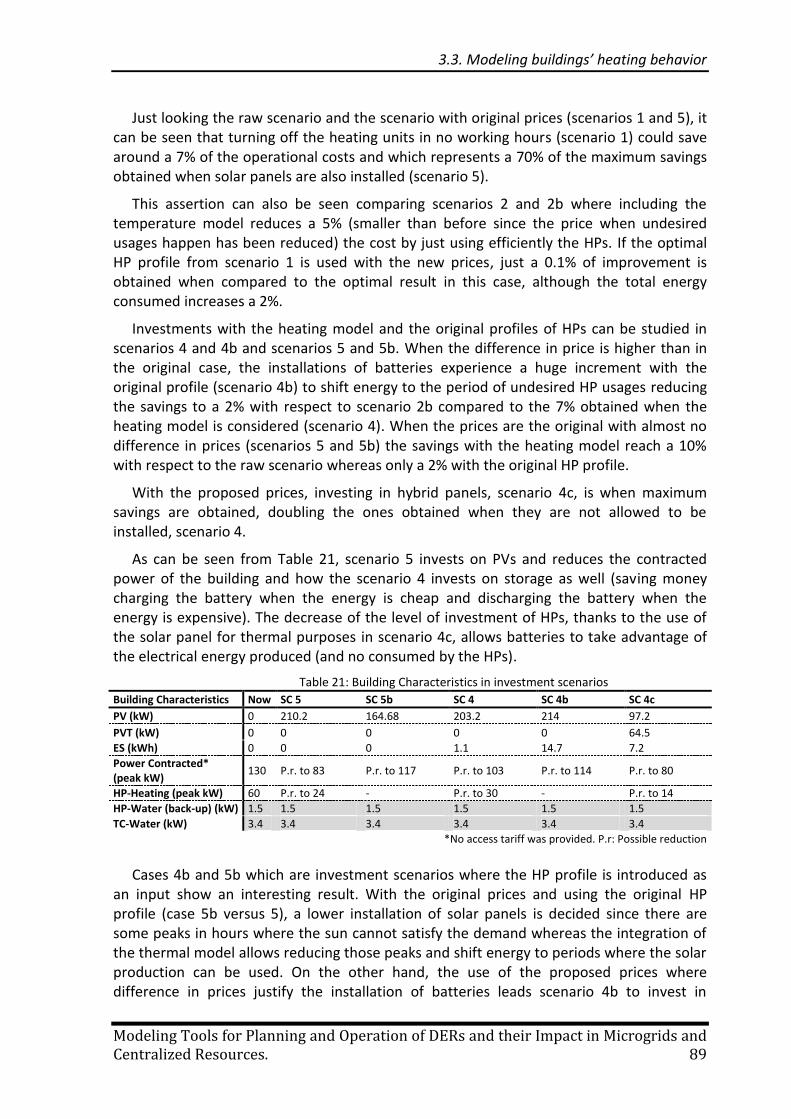
3.3. Modeling buildings’ heating behavior
Modeling Tools for Planning and Operation of DERs and their Impact in Microgrids and Centralized Resources. 89
Just looking the raw scenario and the scenario with original prices (scenarios 1 and 5), it can be seen that turning off the heating units in no working hours (scenario 1) could save around a 7% of the operational costs and which represents a 70% of the maximum savings obtained when solar panels are also installed (scenario 5).
This assertion can also be seen comparing scenarios 2 and 2b where including the temperature model reduces a 5% (smaller than before since the price when undesired usages happen has been reduced) the cost by just using efficiently the HPs. If the optimal HP profile from scenario 1 is used with the new prices, just a 0.1% of improvement is obtained when compared to the optimal result in this case, although the total energy consumed increases a 2%.
Investments with the heating model and the original profiles of HPs can be studied in scenarios 4 and 4b and scenarios 5 and 5b. When the difference in price is higher than in the original case, the installations of batteries experience a huge increment with the original profile (scenario 4b) to shift energy to the period of undesired HP usages reducing the savings to a 2% with respect to scenario 2b compared to the 7% obtained when the heating model is considered (scenario 4). When the prices are the original with almost no difference in prices (scenarios 5 and 5b) the savings with the heating model reach a 10% with respect to the raw scenario whereas only a 2% with the original HP profile.
With the proposed prices, investing in hybrid panels, scenario 4c, is when maximum savings are obtained, doubling the ones obtained when they are not allowed to be installed, scenario 4.
As can be seen from Table 21, scenario 5 invests on PVs and reduces the contracted power of the building and how the scenario 4 invests on storage as well (saving money charging the battery when the energy is cheap and discharging the battery when the energy is expensive). The decrease of the level of investment of HPs, thanks to the use of the solar panel for thermal purposes in scenario 4c, allows batteries to take advantage of the electrical energy produced (and no consumed by the HPs).
Table 21: Building Characteristics in investment scenarios
Building Characteristics Now SC 5 SC 5b SC 4 SC 4b SC 4c
PV (kW) 0 210.2 164.68 203.2 214 97.2
PVT (kW) 0 0 0 0 0 64.5
ES (kWh) 0 0 0 1.1 14.7 7.2
Power Contracted* (peak kW)
130 P.r. to 83 P.r. to 117 P.r. to 103 P.r. to 114 P.r. to 80
HP-Heating (peak kW) 60 P.r. to 24 - P.r. to 30 - P.r. to 14
HP-Water (back-up) (kW) 1.5 1.5 1.5 1.5 1.5 1.5
TC-Water (kW) 3.4 3.4 3.4 3.4 3.4 3.4
*No access tariff was provided. P.r: Possible reduction
Cases 4b and 5b which are investment scenarios where the HP profile is introduced as an input show an interesting result. With the original prices and using the original HP profile (case 5b versus 5), a lower installation of solar panels is decided since there are some peaks in hours where the sun cannot satisfy the demand whereas the integration of the thermal model allows reducing those peaks and shift energy to periods where the solar production can be used. On the other hand, the use of the proposed prices where difference in prices justify the installation of batteries leads scenario 4b to invest in
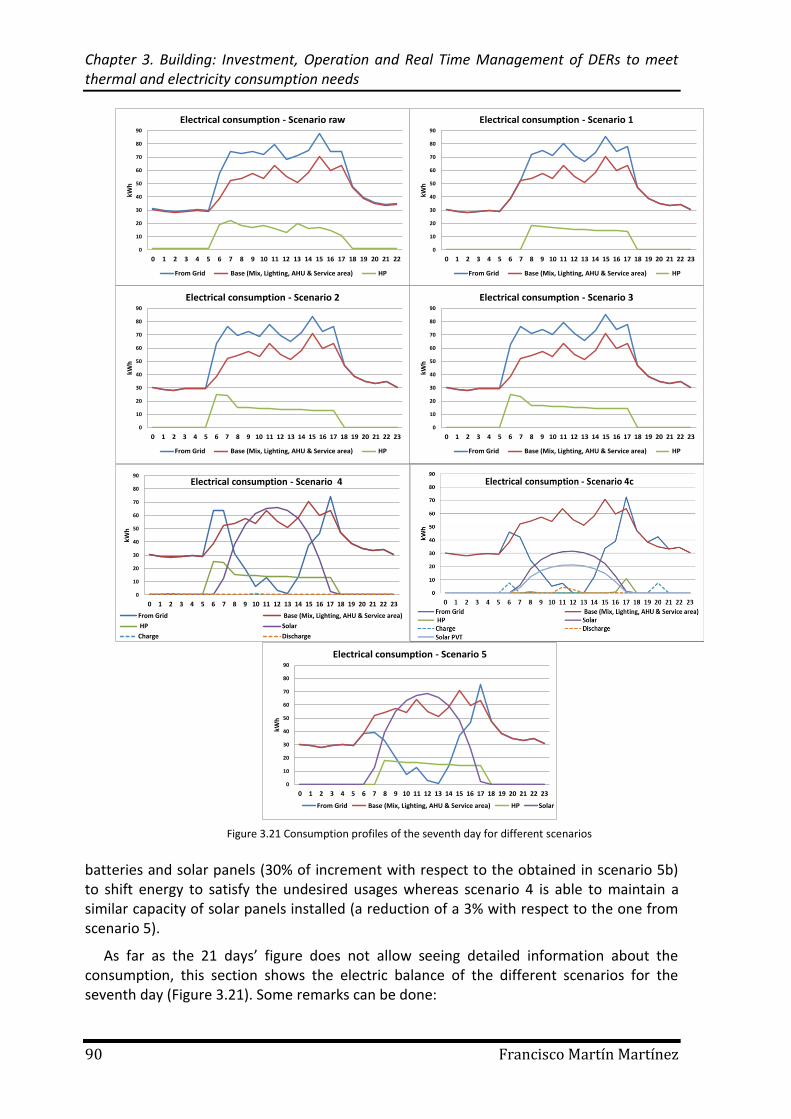
Chapter 3. Building: Investment, Operation and Real Time Management of DERs to meet thermal and electricity consumption needs
90 Francisco Martín Martínez
batteries and solar panels (30% of increment with respect to the obtained in scenario 5b) to shift energy to satisfy the undesired usages whereas scenario 4 is able to maintain a similar capacity of solar panels installed (a reduction of a 3% with respect to the one from scenario 5).
As far as the 21 days’ figure does not allow seeing detailed information about the consumption, this section shows the electric balance of the different scenarios for the seventh day (Figure 3.21). Some remarks can be done:
0
10
20
30
40
50
60
70
80
90
0 1 2 3 4 5 6 7 8 9 10 11 12 13 14 15 16 17 18 19 20 21 22 23
kW
h
Electrical consumption - Scenario 4b
From Grid Base (Mix, Lighting, AHU & Service area) HP SolarCharge DischargeSolar PVT
0
10
20
30
40
50
60
70
80
90
0 1 2 3 4 5 6 7 8 9 10 11 12 13 14 15 16 17 18 19 20 21 22 23
kWh
Electrical consumption - Scenario 5
From Grid Base (Mix, Lighting, AHU & Service area) HP Solar
0
10
20
30
40
50
60
70
80
90
0 1 2 3 4 5 6 7 8 9 10 11 12 13 14 15 16 17 18 19 20 21 22 23
kWh
Electrical consumption - Scenario 4
From Grid Base (Mix, Lighting, AHU & Service area)
HP Solar
Charge Discharge
0
10
20
30
40
50
60
70
80
90
0 1 2 3 4 5 6 7 8 9 10 11 12 13 14 15 16 17 18 19 20 21 22 23
kWh
Electrical consumption - Scenario 3
From Grid Base (Mix, Lighting, AHU & Service area) HP
0
10
20
30
40
50
60
70
80
90
0 1 2 3 4 5 6 7 8 9 10 11 12 13 14 15 16 17 18 19 20 21 22 23
kWh
Electrical consumption - Scenario 2
From Grid Base (Mix, Lighting, AHU & Service area) HP
0
10
20
30
40
50
60
70
80
90
0 1 2 3 4 5 6 7 8 9 10 11 12 13 14 15 16 17 18 19 20 21 22 23
kWh
Electrical consumption - Scenario 1
From Grid Base (Mix, Lighting, AHU & Service area) HP
0
10
20
30
40
50
60
70
80
90
0 1 2 3 4 5 6 7 8 9 10 11 12 13 14 15 16 17 18 19 20 21 22
kWh
Electrical consumption - Scenario raw
From Grid Base (Mix, Lighting, AHU & Service area) HP
Figure 3.21 Consumption profiles of the seventh day for different scenarios
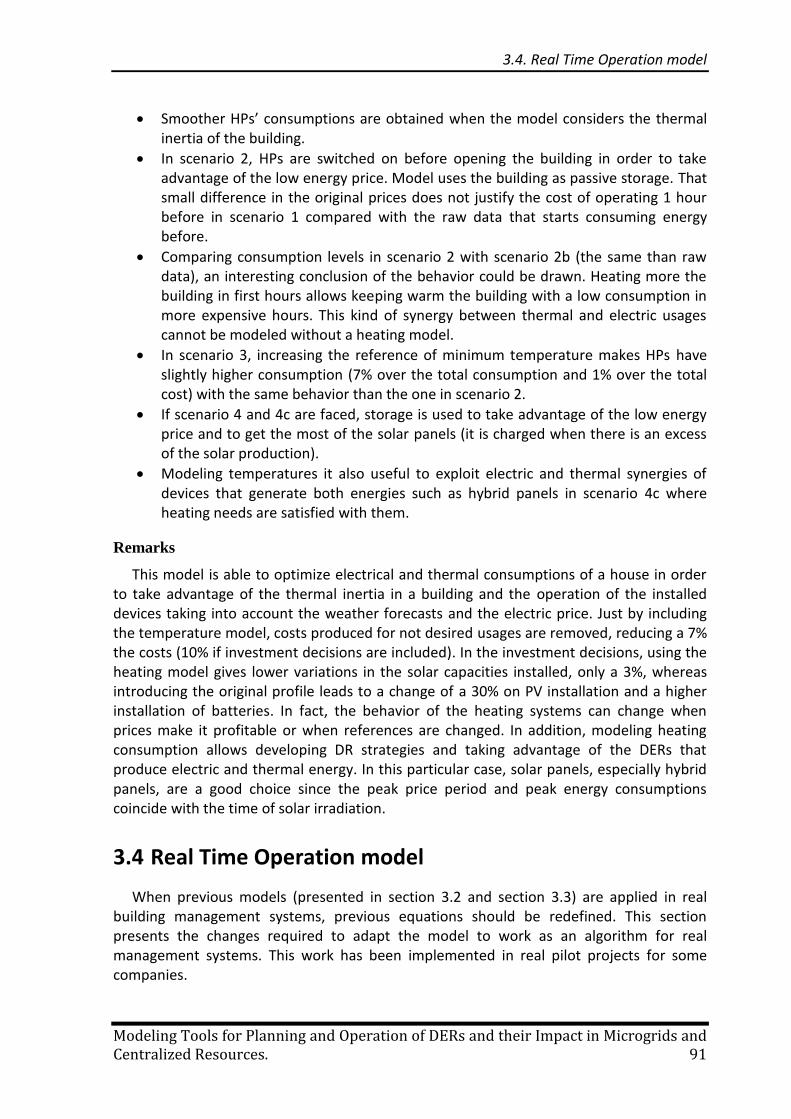
3.4. Real Time Operation model
Modeling Tools for Planning and Operation of DERs and their Impact in Microgrids and Centralized Resources. 91
Smoother HPs’ consumptions are obtained when the model considers the thermal inertia of the building.
In scenario 2, HPs are switched on before opening the building in order to take advantage of the low energy price. Model uses the building as passive storage. That small difference in the original prices does not justify the cost of operating 1 hour before in scenario 1 compared with the raw data that starts consuming energy before.
Comparing consumption levels in scenario 2 with scenario 2b (the same than raw data), an interesting conclusion of the behavior could be drawn. Heating more the building in first hours allows keeping warm the building with a low consumption in more expensive hours. This kind of synergy between thermal and electric usages cannot be modeled without a heating model.
In scenario 3, increasing the reference of minimum temperature makes HPs have slightly higher consumption (7% over the total consumption and 1% over the total cost) with the same behavior than the one in scenario 2.
If scenario 4 and 4c are faced, storage is used to take advantage of the low energy price and to get the most of the solar panels (it is charged when there is an excess of the solar production).
Modeling temperatures it also useful to exploit electric and thermal synergies of devices that generate both energies such as hybrid panels in scenario 4c where heating needs are satisfied with them.
Remarks
This model is able to optimize electrical and thermal consumptions of a house in order to take advantage of the thermal inertia in a building and the operation of the installed devices taking into account the weather forecasts and the electric price. Just by including the temperature model, costs produced for not desired usages are removed, reducing a 7% the costs (10% if investment decisions are included). In the investment decisions, using the heating model gives lower variations in the solar capacities installed, only a 3%, whereas introducing the original profile leads to a change of a 30% on PV installation and a higher installation of batteries. In fact, the behavior of the heating systems can change when prices make it profitable or when references are changed. In addition, modeling heating consumption allows developing DR strategies and taking advantage of the DERs that produce electric and thermal energy. In this particular case, solar panels, especially hybrid panels, are a good choice since the peak price period and peak energy consumptions coincide with the time of solar irradiation.
3.4 Real Time Operation model
When previous models (presented in section 3.2 and section 3.3) are applied in real building management systems, previous equations should be redefined. This section presents the changes required to adapt the model to work as an algorithm for real management systems. This work has been implemented in real pilot projects for some companies.
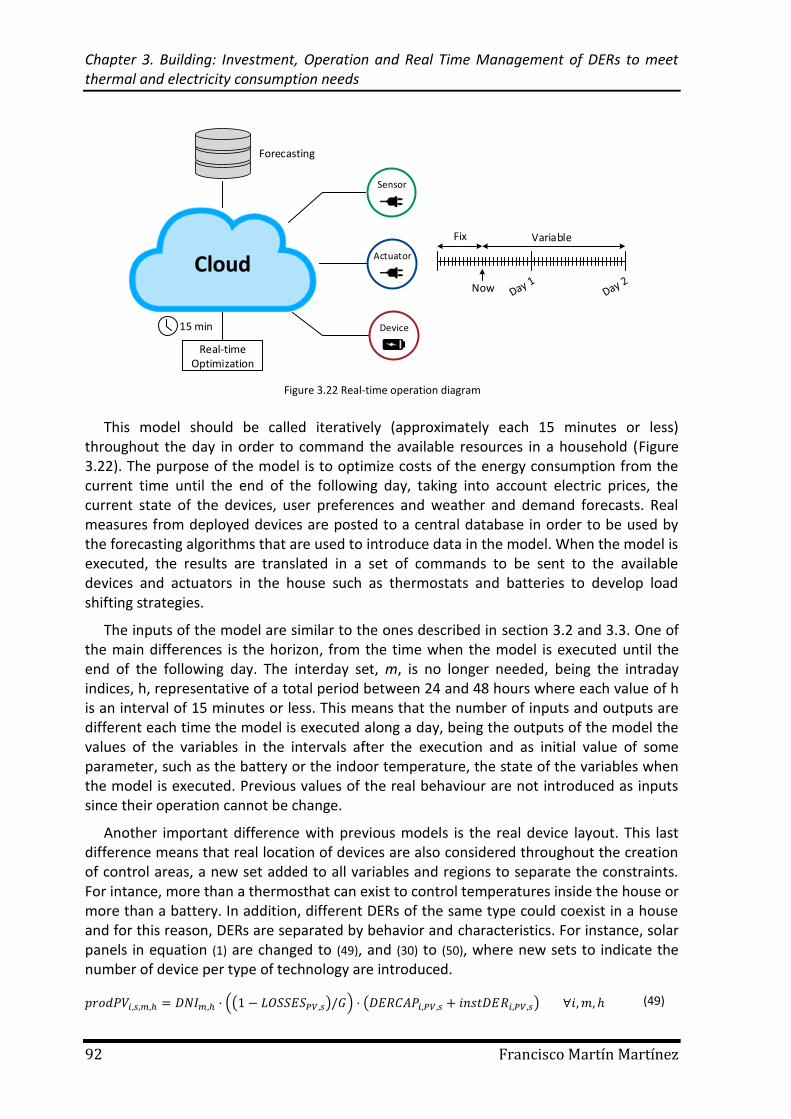
Chapter 3. Building: Investment, Operation and Real Time Management of DERs to meet thermal and electricity consumption needs
92 Francisco Martín Martínez
This model should be called iteratively (approximately each 15 minutes or less) throughout the day in order to command the available resources in a household (Figure 3.22). The purpose of the model is to optimize costs of the energy consumption from the current time until the end of the following day, taking into account electric prices, the current state of the devices, user preferences and weather and demand forecasts. Real measures from deployed devices are posted to a central database in order to be used by the forecasting algorithms that are used to introduce data in the model. When the model is executed, the results are translated in a set of commands to be sent to the available devices and actuators in the house such as thermostats and batteries to develop load shifting strategies.
The inputs of the model are similar to the ones described in section 3.2 and 3.3. One of the main differences is the horizon, from the time when the model is executed until the end of the following day. The interday set, m, is no longer needed, being the intraday indices, h, representative of a total period between 24 and 48 hours where each value of h is an interval of 15 minutes or less. This means that the number of inputs and outputs are different each time the model is executed along a day, being the outputs of the model the values of the variables in the intervals after the execution and as initial value of some parameter, such as the battery or the indoor temperature, the state of the variables when the model is executed. Previous values of the real behaviour are not introduced as inputs since their operation cannot be change.
Another important difference with previous models is the real device layout. This last difference means that real location of devices are also considered throughout the creation of control areas, a new set added to all variables and regions to separate the constraints. For intance, more than a thermosthat can exist to control temperatures inside the house or more than a battery. In addition, different DERs of the same type could coexist in a house and for this reason, DERs are separated by behavior and characteristics. For instance, solar panels in equation (1) are changed to (49), and (30) to (50), where new sets to indicate the number of device per type of technology are introduced.
(( ) ) ( ) (49)
Real-timeOptimization
CloudActuator
Sensor
Device
Forecasting
15 min
Now
Fix Variable
Figure 3.22 Real-time operation diagram
3.5. Conclusion
Modeling Tools for Planning and Operation of DERs and their Impact in Microgrids and Centralized Resources. 93
∑
∑ ∑ ∑ ( )
∑ ∑
∑ ∑ ( )
(50)
3.5 Conclusion
The electric and thermal behavior of building, several DERs’ operation, DR capabilities and the temperature behavior modeling presented in this chapter have been proven effective to match real consumption behaviors. Consequently, equations have been validated in real cases. These equations can be used in residential, commercial or industrial building since no specific constraint limit its application for a particular kind of end user. Results of the case studies support these assertions.
One of the contributions of the dissertation has been described in this chapter, a specific set of heating formulas and parameters to model thermal inertias in buildings. These equations allow operating smartly the heating devices presented avoiding not desired usages when the energy is not required or consuming it in more profitable hours regarding comfort requirements. Parameters’ variations over the model have been studied detecting how each parameter affects the consumption and the inertia of the system.
In fact, equivalences between parameters and real elements have been concluded in the sensitivity analysis (Figure 3.23). The first parameter called RUA was identified as the isolation quality of the house and its value affect directly to the level of input energy required. The second parameter called C was recognized as a representative parameter of the amount of heat that can be stored inside a building and its value determine the inertia of the system. Finally, the combination of both parameters named as the time constant of the building, τ, was related to the behavior of the system and its value is determined by the one of the previous parameters. However, different combination of values of the two first parameters that produce a same value of the time constant will present a similar shape in their consumption profile.
Appendix B describes the models used for the estimation proposed in section 3.3.3. Other estimation algorithms could be used to obtain the parameters used later to optimize the buildings. In addition, other parameters, more difficult to measure, should be considered to improve the building temperature modeling in future work. For instance, building occupancy, the number of windows or the sun irradiation may also affect temperature profiles. Some models presented in [167] could be used for including these additional factors in the model.
The heating consumption of a real office building was studied and some conclusions were drawn for this particular case study. Before the building heating model was introduced to optimize the consumption costs, the actual consumption was taken place when the prices of energy were high. The optimization model decides to heat the building when the price are low and to reduce the consumption when the prices are high, obtaining between a 5% to 7% of savings during a winter month, highlighting the importance of
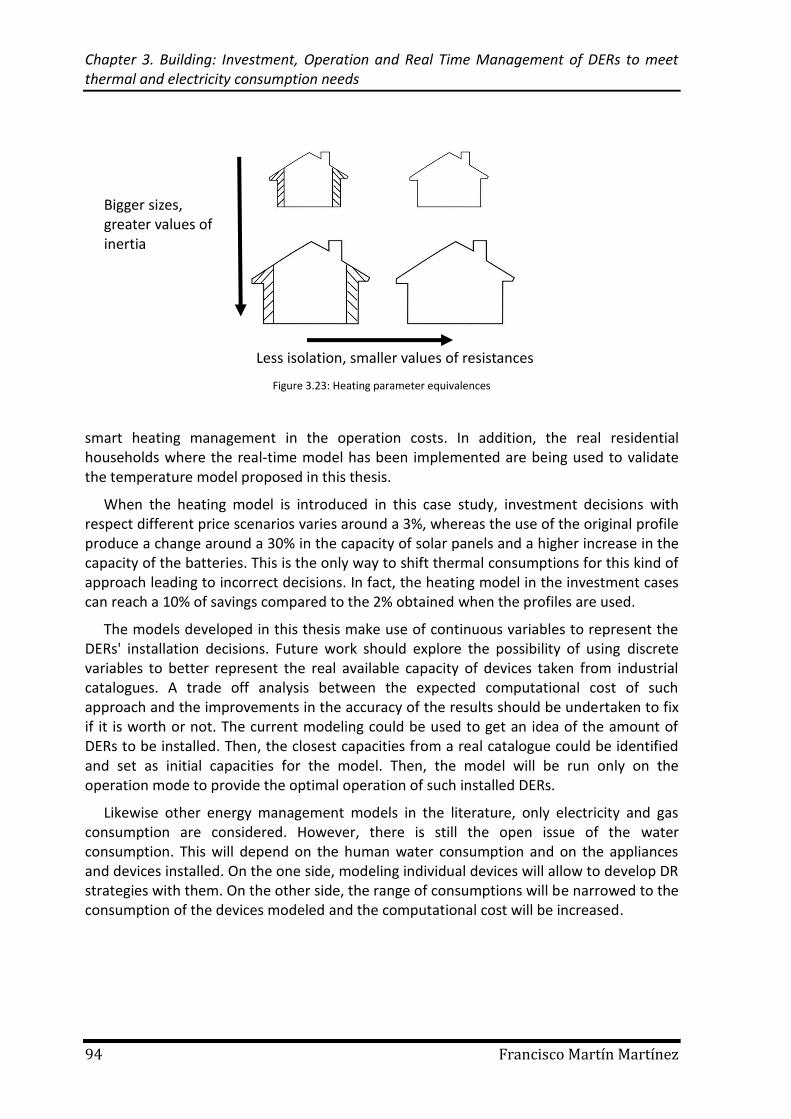
Chapter 3. Building: Investment, Operation and Real Time Management of DERs to meet thermal and electricity consumption needs
94 Francisco Martín Martínez
smart heating management in the operation costs. In addition, the real residential households where the real-time model has been implemented are being used to validate the temperature model proposed in this thesis.
When the heating model is introduced in this case study, investment decisions with respect different price scenarios varies around a 3%, whereas the use of the original profile produce a change around a 30% in the capacity of solar panels and a higher increase in the capacity of the batteries. This is the only way to shift thermal consumptions for this kind of approach leading to incorrect decisions. In fact, the heating model in the investment cases can reach a 10% of savings compared to the 2% obtained when the profiles are used.
The models developed in this thesis make use of continuous variables to represent the DERs' installation decisions. Future work should explore the possibility of using discrete variables to better represent the real available capacity of devices taken from industrial catalogues. A trade off analysis between the expected computational cost of such approach and the improvements in the accuracy of the results should be undertaken to fix if it is worth or not. The current modeling could be used to get an idea of the amount of DERs to be installed. Then, the closest capacities from a real catalogue could be identified and set as initial capacities for the model. Then, the model will be run only on the operation mode to provide the optimal operation of such installed DERs.
Likewise other energy management models in the literature, only electricity and gas consumption are considered. However, there is still the open issue of the water consumption. This will depend on the human water consumption and on the appliances and devices installed. On the one side, modeling individual devices will allow to develop DR strategies with them. On the other side, the range of consumptions will be narrowed to the consumption of the devices modeled and the computational cost will be increased.
Bigger sizes, greater values of inertia
Less isolation, smaller values of resistances
Figure 3.23: Heating parameter equivalences
Modeling Tools for Planning and Operation of DERs and their Impact in Microgrids and Centralized Resources. 95
Research is what I'm doing when I don't know what I'm doing.
Wernher von Braun
Previous chapter addresses the modeling of DER’s deployment and operation at building level. As said, the same model can be used when a connected MG is operated by a single entity. The building energy manager or the Microgrid Operator (MGO) looks for minimizing its thermal and electrical energy supply costs, properly balancing the deployment of its own DERs with the purchase of gas and electricity from the grid it is connected to. This chapter enlarges the context, focusing on isolated MGs made of several buildings. Each building owner makes decisions on their DERs’ deployment and operation and may exchange energy with other building owners within the MG. Besides, the agent in charge of the operation or external energy service provider (ESP) may find profitable for the MG as a whole to invest in larger common generation facilities such as a diesel generation unit, which may not make sense to invest on at building level. Although literature has largely addressed the technical performance of such MGs or the optimal deployment of DER for an MG as a single owner entity, few studies have been done on modeling the economic interaction of different ownerships within the MG. Recent European projects have launched the proposal of a local market based approach to operate isolated MGs. One of the main concerns of such an approach is whether the small size of such markets may lead to strategic behaviors and distort the overall efficiency of the MG, which may largely depend on the number and size of local market agents. This chapter aims at contributing to this discussion by developing a model able to support future analysis related to these issues. This chapter presents detailed mathematical modeling of a single-level investment equilibrium, formulated as a mix complementarity problem (MCP), to optimize the economic planning and operation of isolated MGs, and able to represent the impact of agent’s strategic behavior through the explicit consideration of the conjectural parameter [180]. Although identifying the value of such conjectures for each particular MG is out of scope of this
Chapter 4. Planning and operation of isolated Microgrids
96 Francisco Martín Martínez
dissertation, a case study is conducted to analyze its impact on investments and local prices. The chapter conducts different case studies to illustrate its impact. Although the work has been focused on isolated MGs it is worth noting that the model presented is also for interest for MGs connected to the main grid. Indeed the chapter briefly discusses the role such local markets may play whenever the MG happens to work isolated due to a grid failure. The model, cancelling its investment related options, may be used to analyze the operation of MGs under such conditions. Also, for MGs designed to be permanently connected to the grid, the optimal deployment and operation of DER from a single decision-maker can be analyzed making use of the very same model already described in the previous chapter. The content of this section is an updated version of the one presented in a journal article [177].
4.1 Introduction
Aggregating resources has two main advantages: the first is the capability of offering services (resilience against outages, voltage support and balancing services) to the grid from small groups of end-users and the second is to be more flexible regarding the global operation of these resources (for instance decreasing in risk of not meeting market commitments). But many other advantages over individual operation of DER may be identified as described in [103]. Moreover, [103] presents the services that the aggregation of DER can offer and how they can achieve it. As shown and summarized in Figure 2.9 different types of aggregation may be found depending on what they aggregate (MGs, dispersed aggregation, VPPs, EV fleets, …) and the services they will be able to offer.
Among them, this chapter pays attention to the MGs. In the EU approach, see for instance the European MICROGRIDS project, an MG is defined as “a Low Voltage distribution network comprising various DG, storage devices and controllable loads that can operate interconnected or isolated from the main distribution grids”[7]. Indeed, public policies in many countries are attempting to mitigate the consequences and avoid the future effects of climate change. These policies lead to more efficient, less polluting, energy self-sufficient systems. Thus, enhanced efficiency, security and grid resiliency have become high priority objectives in recent times. MGs may contribute to these goals. Indeed, MGs are not only useful for remote areas without access to the main grid, but may play an essential role for locations with army conflicts or natural disaster risks, foreseen to be more frequent in the future due to climate change. For sure MG should be considered as one of the possible solutions to address energy challenges such as the penetration of renewable energy resources and resiliency. A proper balance between centralized generation schemes (taking advantages of economies of scale), VPPs, remote aggregations of loads and EV fleets, and MGs (taking advantage of households thermal and electricity loads synergies, and their contribution to resiliency issues) could be expected as a possible future configuration of electricity systems. MGs will be the ones ready to operate either connected to the grid (connecting mode), or disconnected from the grid (isolated mode). The isolated mode could be temporary as a consequence of a disconnection due to some severe disturbances in centralized systems or permanent due to the isolated geographical situation of the community to be supplied.
4.1. Introduction
Modeling Tools for Planning and Operation of DERs and their Impact in Microgrids and Centralized Resources. 97
Traditional optimization problems, which have been explained in chapter 2, study buildings (Nanogrids) or distribution networks (MGs) which are always connected to the grid. On the contrary, planning and operating distribution systems in isolated mode have not been studied as much as in the grid-connected case. In this mode of operation, studies are mostly focused on voltage and frequency regulation. For instance, control strategies in an MG for different cases such as grid-connected mode, pre-planned isolating, line-to-ground faults and line-to-line faults are shown in [74]. Generally, studies in this topic do not address the problem of what happens inside an MG and how generators schedule their production. For instance, [79] operates DERs in an MG as a VPP, but they belong to the same owner who uses priorities to set their operation; and [63] only considers MG exchanges. However, how an MG can operate when there is more than one agent inside is not considered.
The MORE MICROGRIDS European project [76] launches the idea of decentralized business models and local markets to organize the operation in each MG. In particular, three different business models are proposed in [77,124], which belong to this project. The first model is a DSO monopoly, which is also responsible for the retailer functions and DERs’ operations. The second model is a prosumer consortium model, similar to the aggregation of consumers found in the literature, where consumers minimize their costs by exporting or changing their consumption. Finally, the third model is a market inside the MG, where a Microgrid Central Controller (MGCC) is in charge of local balancing, exporting and importing. This last model ensures a similar distribution of benefits between all the agents involved in the MG and it could be particularly useful and valid for the isolated mode.
The project also describes two types of internal markets [124]: “… Regarding Microgrid internal markets, two general types have been studies, namely, local retail market and local service market. The local retail market can be simply put as an ‘over-the-grid’ trading platform where MS units and local consumers attempts to avoid potential transmission and MV distribution-related grid charges by trading directly with each other within the physical threshold of a Microgrid. The local service market, on the other hand, mainly serves as a smaller version of ancillary service market established between DSO and potential sources of grid control power, namely, MS units, dispatchable loads, storage devices, and so forth”. However neither in that project nor in the literature review, to the best knowledge of the author, a proper tool to address and study the viability of these schemes has been developed, especially, when the MG operates in isolated mode. For instance, one of the main concerns of such an approach is whether the small size of such local markets may lead to strategic behaviors, although it may depend on the number and size of local market agents.
Nowadays, these local markets are starting to be deployed when MG are still connected to the main grid. A real application of this local market mixed with the use of virtual coins is being tested in Brooklyn [181] where the neighbors with solar panels sell their surpluses to other neighbors. For the time being, they are using the platform developed by a company called LO3 for managing the economic exchanges that are conducted over PayPal since the company cannot legally buy or sell electricity until regulators determine the legal status of these markets [182]. Once this legal problem will be fixed, the chief executive of the LO3
Chapter 4. Planning and operation of isolated Microgrids
98 Francisco Martín Martínez
Company states that users will continue paying for infrastructures fees and services but the trading among them will be facilitated.
In addition, there are several other initiatives that are using virtual coins and the blockchain concept for trading energy in distribution networks. Power Ledger has announced a residential trading market in Perth [183], ME SOLshare has been developing peer-to-peer trading networks of rural households with and without rural solar panels in Bangladesh [184], Sonnen has developed a web of about 8000 customers for trading the energy stored in their batteries [185] or a project from the European Commission called Scanenergy [186] among others. The number of initiatives has started to increase in the last years and it is expected to continue with a growth rate of 14% between 2017 and 2021 where the first commercial projects of Microgrids will be deployed according to the report of the consulting firm GlobalData [187].
This chapter presents a mathematical modeling, formulated as a Mix Complementarity Problem (MCP), of the economic expansion and operation of MGs functioning permanently in isolated mode, able to represent the impact of agent’s strategic behavior through the explicit consideration of conjectural parameters. This chapter therefore contributes with a basic tool to properly address these issues. Although identifying the value of such conjectural parameters for each particular MG is out of the scope of this thesis, a case study is conducted to analyze the impact on investment, operation decisions and local market prices of such parameter. The model provides a fundamental tool for further investigations on these issues. Different case studies are conducted, ignoring strategic behavior, to illustrate the impact of different technologies and behavior under this market approach.
4.2 Isolated Microgrid
This section presents a model in order to describe a possible operation of MGs in isolated areas where each building belongs to different owners. Firstly, the chapter presents different operation schemes for connected MGs and isolated MGs where a local market is proposed for total isolated MGs or connected MGs when the grid is not available. For that reason, a brief explanation of the classic market equilibrium is done. Then, the required changes to the mathematical formulation already presented in the previous chapter in order to adapt the model to a multi-owner decision making process within a MG are summarized. Finally, the model is applied to a case study and results analyzed.
4.2.1 Model Description
As mentioned previously, a proper balance between centralized generation schemes, VPPs, remote aggregations of loads and EV fleets, and MGs could be expected as a possible future configuration of electricity systems. Moreover, in our view, the distribution level in future electric systems could be made of different MGs if resiliency was to be considered a major concern for public authorities. MG would be connected to the grid during normal operation conditions selling/buying energy to/from the grid, but if a disturbance happens in any point of the distribution network, MGs could switch their operation to the isolated mode.
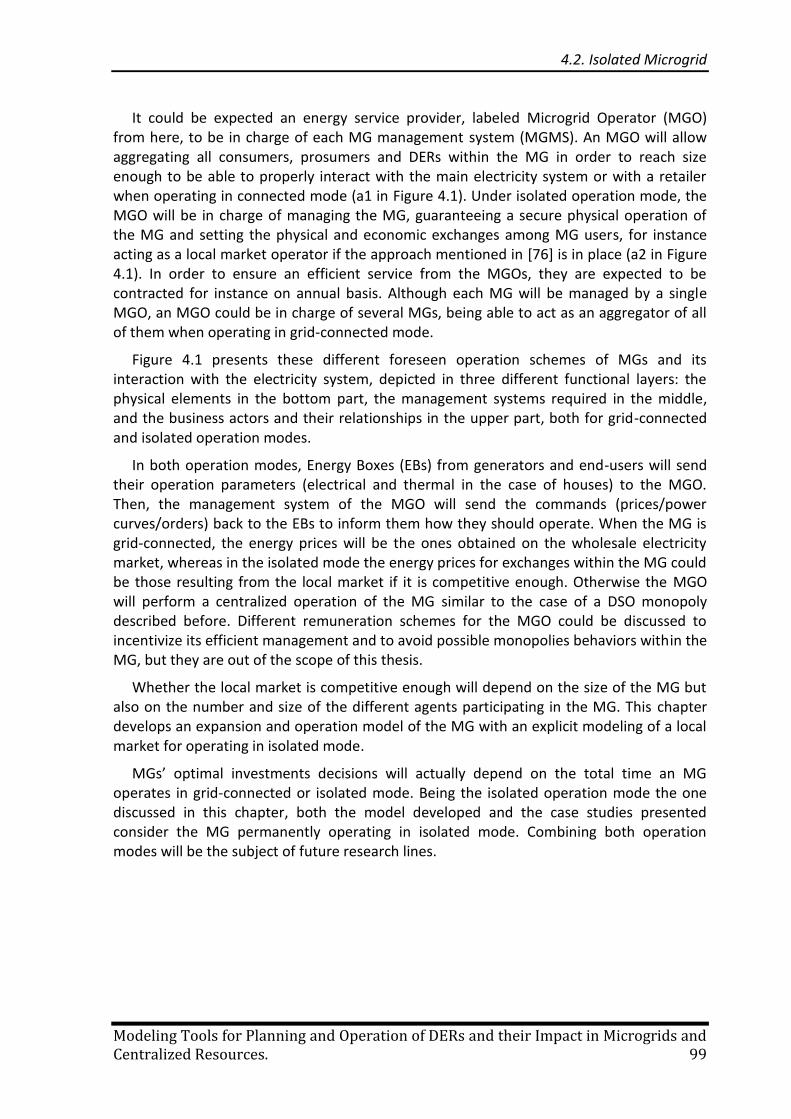
4.2. Isolated Microgrid
Modeling Tools for Planning and Operation of DERs and their Impact in Microgrids and Centralized Resources. 99
It could be expected an energy service provider, labeled Microgrid Operator (MGO) from here, to be in charge of each MG management system (MGMS). An MGO will allow aggregating all consumers, prosumers and DERs within the MG in order to reach size enough to be able to properly interact with the main electricity system or with a retailer when operating in connected mode (a1 in Figure 4.1). Under isolated operation mode, the MGO will be in charge of managing the MG, guaranteeing a secure physical operation of the MG and setting the physical and economic exchanges among MG users, for instance acting as a local market operator if the approach mentioned in [76] is in place (a2 in Figure 4.1). In order to ensure an efficient service from the MGOs, they are expected to be contracted for instance on annual basis. Although each MG will be managed by a single MGO, an MGO could be in charge of several MGs, being able to act as an aggregator of all of them when operating in grid-connected mode.
Figure 4.1 presents these different foreseen operation schemes of MGs and its interaction with the electricity system, depicted in three different functional layers: the physical elements in the bottom part, the management systems required in the middle, and the business actors and their relationships in the upper part, both for grid-connected and isolated operation modes.
In both operation modes, Energy Boxes (EBs) from generators and end-users will send their operation parameters (electrical and thermal in the case of houses) to the MGO. Then, the management system of the MGO will send the commands (prices/power curves/orders) back to the EBs to inform them how they should operate. When the MG is grid-connected, the energy prices will be the ones obtained on the wholesale electricity market, whereas in the isolated mode the energy prices for exchanges within the MG could be those resulting from the local market if it is competitive enough. Otherwise the MGO will perform a centralized operation of the MG similar to the case of a DSO monopoly described before. Different remuneration schemes for the MGO could be discussed to incentivize its efficient management and to avoid possible monopolies behaviors within the MG, but they are out of the scope of this thesis.
Whether the local market is competitive enough will depend on the size of the MG but also on the number and size of the different agents participating in the MG. This chapter develops an expansion and operation model of the MG with an explicit modeling of a local market for operating in isolated mode.
MGs’ optimal investments decisions will actually depend on the total time an MG operates in grid-connected or isolated mode. Being the isolated operation mode the one discussed in this chapter, both the model developed and the case studies presented consider the MG permanently operating in isolated mode. Combining both operation modes will be the subject of future research lines.
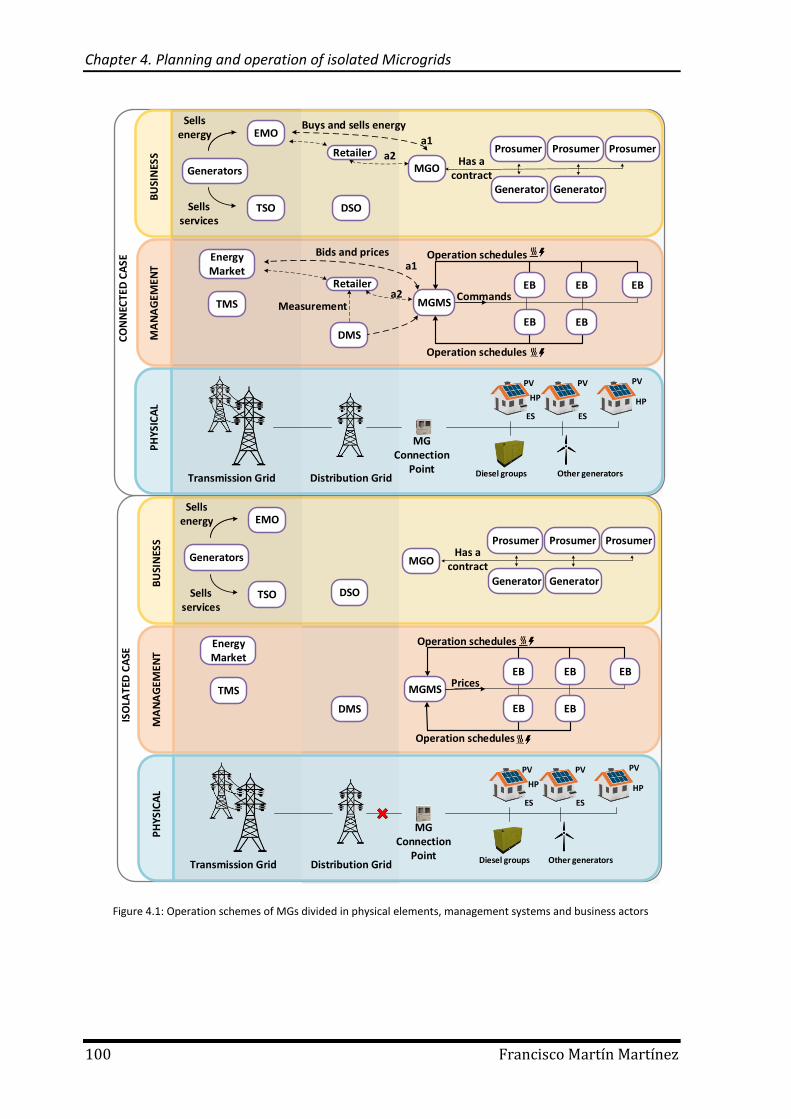
Chapter 4. Planning and operation of isolated Microgrids
100 Francisco Martín Martínez
PH
YS
ICA
LM
AN
AG
EM
EN
TB
USI
NES
S
Transmission Grid Distribution Grid Diesel groups Other generators
ES
PV PV PV
ES
MG Connection
Point
MGO
ISO
LAT
ED C
ASE
Generator
Prosumer
MGMS
Generator
ProsumerProsumer
EB
EB EB
EB
EB
Operation schedules
Operation schedules
Prices
Has a contract
DSO
EMO
DMS
TMS
TSO
Generators
Energy Market
Sells services
Sells energy
HP HP
PH
YSIC
AL
MA
NA
GEM
ENT
BU
SIN
ESS
Diesel groups Other generators
ES
PV PV PV
ES
MG Connection
Point
DSO
EMOC
ON
NEC
TED
CA
SE
DMS
TMS
Generator
Prosumer
MGMS
Generator
ProsumerProsumer
EB
EB EB
EB
EB
Operation schedules
Operation schedules
Commands
Has a contract
TSO
Generators
Energy Market
Bids and prices
Buys and sells energySells energy
Sells services
MGO
Retailer a2
a1
Retailera2
a1
Measurement
HP HP
Transmission Grid Distribution Grid
Figure 4.1: Operation schemes of MGs divided in physical elements, management systems and business actors
4.2. Isolated Microgrid
Modeling Tools for Planning and Operation of DERs and their Impact in Microgrids and Centralized Resources. 101
Market Model –Problem Description
As stated earlier, a local market model is adopted to represent the isolated operation case. In practice, this model (Figure 4.2) consists of different agents (generators and end-users) who send their consumption and supply bids (USD/kWh) to the MGO, which clears the market and sends back hourly prices. End-users regulate their consumption, controlling the output of their energy storage and their demand profiles. The final price is the result of the equilibrium among all the agents.
This process could be carried out as a local day-ahead market in order to send the final prices for the next 24 hours to the EBs. The daily results of such a local market will be only activated when the MG comes to operate in isolated mode, whereas the prices will be those of the wholesale electricity market when the MG is operating in grid-connected mode.
As mentioned, the isolated MG consists of end-users and generators of different agents. If permanently isolated, generation capacity within the MG should be enough to supply the energy required at every moment by end-users.
If further studies show that local markets are not appropriate for the majority of MGs configurations, alternative management schemes should be adopted to guarantee a fair price for the exchanges of energy among the agents (generators, prosumers, consumers) when the MG is operating in isolated mode. In this case, the MGO will be paid, for instance, an annual fixed fee for him to centrally operate the MG when it is running isolated from the grid and set the appropriate exchange prices. This fixed fee would not be correlated to the number of times the MG will be operating under isolated mode, in order to avoid any perverse incentive for the MGO to disconnect the MG from the grid. Such a management scheme will be close to the results of a fully competitive local market, so that it could also be represented by the model proposed in this chapter by setting the conjectural price response parameters to zero. Although in those cases a more simple modeling approach could be used since it is not necessary to represent equilibriums among agents anymore. A single optimization problem could be adopted [188], although it will be important to take into account in the overall decision making the thermal energy consumption component of
Generators
End-users
Local Market
Prices
Prices
Supply bids
Consumption bids
Supply bids
Min CostsSt: ...
Generation=Demand
Min CostsSt: ...
Figure 4.2 Market flow between agents
Chapter 4. Planning and operation of isolated Microgrids
102 Francisco Martín Martínez
buildings as shown in previous chapter. A model close to the one developed in the previous chapter will fit these needs.
The complete model of the MG represents the optimal expansion and operation decisions of a set of agents (consumers, generators, prosumers) within an MG operating in isolated mode under a local market. The agents’ behavior is modeled through a profit maximization equilibrium problem. This equilibrium problem is formulated as an MCP with a price response conjectural parameter θi representing the strategic behavior of each involved agent i. Gabriel et al [189] explain how to work with complementarity models which also includes microeconomics, game-theory and electricity markets modeling concepts.
Although identifying the value of such conjectural parameters for each particular MG is out of the scope of this thesis (θi estimations are usually based on past behavior or on complex assumptions [180]), a case study is conducted to analyze the impact on investments, operation decisions and local market prices of such parameter. It should be said that historical conjecture values extracted from literature for different electricity markets could not be directly used as estimations for this case. Indeed, agents involved in this case are prosumers which may sometime behave as net generators and sometimes as net consumers, so that prices behaviors interact with them in opposite ways depending on the hour. Besides, a demand response behavior for electricity and thermal consumptions may also have an impact on such values. In addition, the consumer may switch from gas to electricity or vice versa for heating depending of electricity price behaviors. The estimation of such parameters requires a deep research work, based on historical data that are not available for the time being or on multi-agent simulation models designed to simulate the behavior of such kind of agents in local markets, which is clearly out of the scope of this thesis.
The model provides a fundamental tool for further investigations regarding for instance the behavior of local markets in MG operated in isolated modes depending on MGs possible configurations. The main case studies presented in this chapter focuses on the MG expansion and operation behavior assuming perfect competition in the local market (assuming θi= ⁄ =0). Since the constraints and the objective function of individual problems are lineal, the global problem is convex and has a unique equilibrium solution.
Figure 4.3 shows the structure of the model developed in this section illustrating its main inputs and outputs. As inputs, the model is fed with: forecasts associated to geographical characteristics (such as outdoor temperatures or irradiation), consumption profiles, percentage of load that could be shifted and available DER characteristics (investments and operation costs, operation constraints, efficiency parameters). The outputs are the optimal expansion and operation plans for each agent and their costs, and the energy prices.
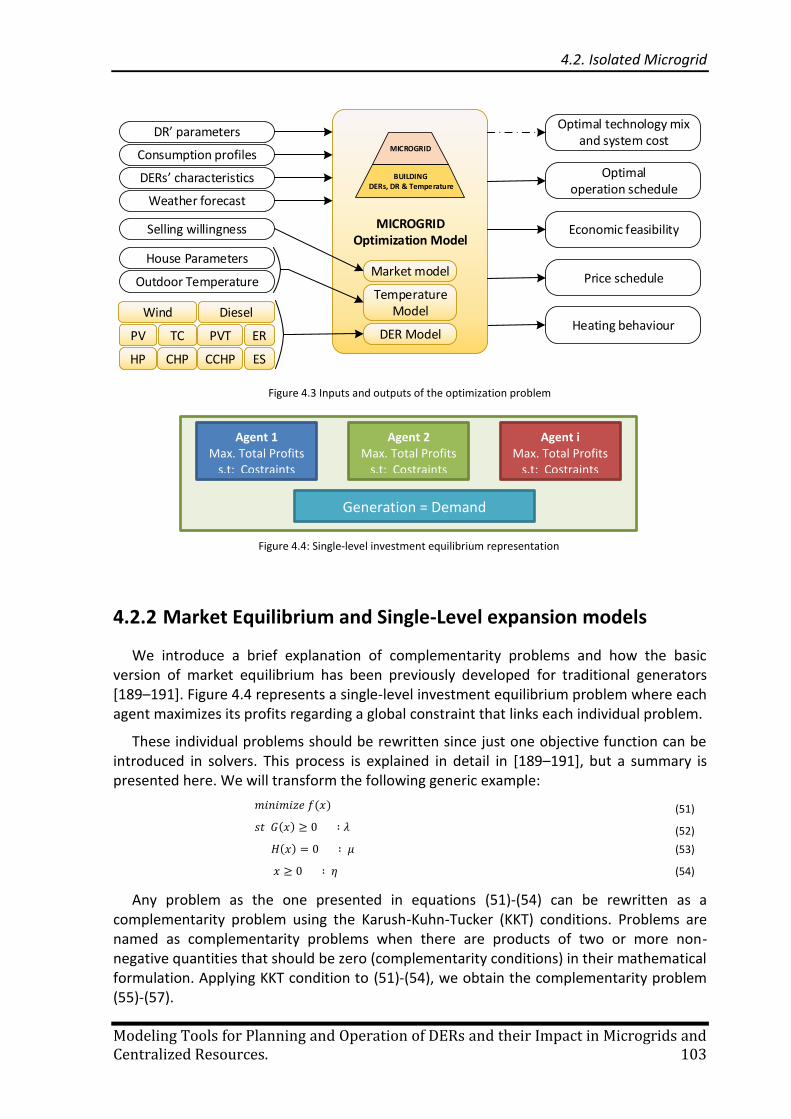
4.2. Isolated Microgrid
Modeling Tools for Planning and Operation of DERs and their Impact in Microgrids and Centralized Resources. 103
4.2.2 Market Equilibrium and Single-Level expansion models
We introduce a brief explanation of complementarity problems and how the basic version of market equilibrium has been previously developed for traditional generators [189–191]. Figure 4.4 represents a single-level investment equilibrium problem where each agent maximizes its profits regarding a global constraint that links each individual problem.
These individual problems should be rewritten since just one objective function can be introduced in solvers. This process is explained in detail in [189–191], but a summary is presented here. We will transform the following generic example:
( ) (51)
( ) (52)
( ) (53)
(54)
Any problem as the one presented in equations (51)-(54) can be rewritten as a complementarity problem using the Karush-Kuhn-Tucker (KKT) conditions. Problems are named as complementarity problems when there are products of two or more non-negative quantities that should be zero (complementarity conditions) in their mathematical formulation. Applying KKT condition to (51)-(54), we obtain the complementarity problem (55)-(57).
Heating behaviour
DR’ parameters
Consumption profiles
DERs’ characteristics
Weather forecast
MICROGRIDOptimization Model
DER Model
Economic feasibility
Optimal operation schedule
Optimal technology mix and system cost
Temperature Model
House Parameters
Outdoor TemperatureMarket model
Selling willingness
Price schedule
MICROGRID
BUILDING DERs, DR & Temperature
PV
Wind Diesel
TC
HP CHP CCHP ES
ERPVT
Figure 4.3 Inputs and outputs of the optimization problem
Agent 1 Max. Total Profits
s.t: Costraints
Agent 2 Max. Total Profits
s.t: Costraints
Agent i Max. Total Profits
s.t: Costraints
Generation = Demand
Figure 4.4: Single-level investment equilibrium representation
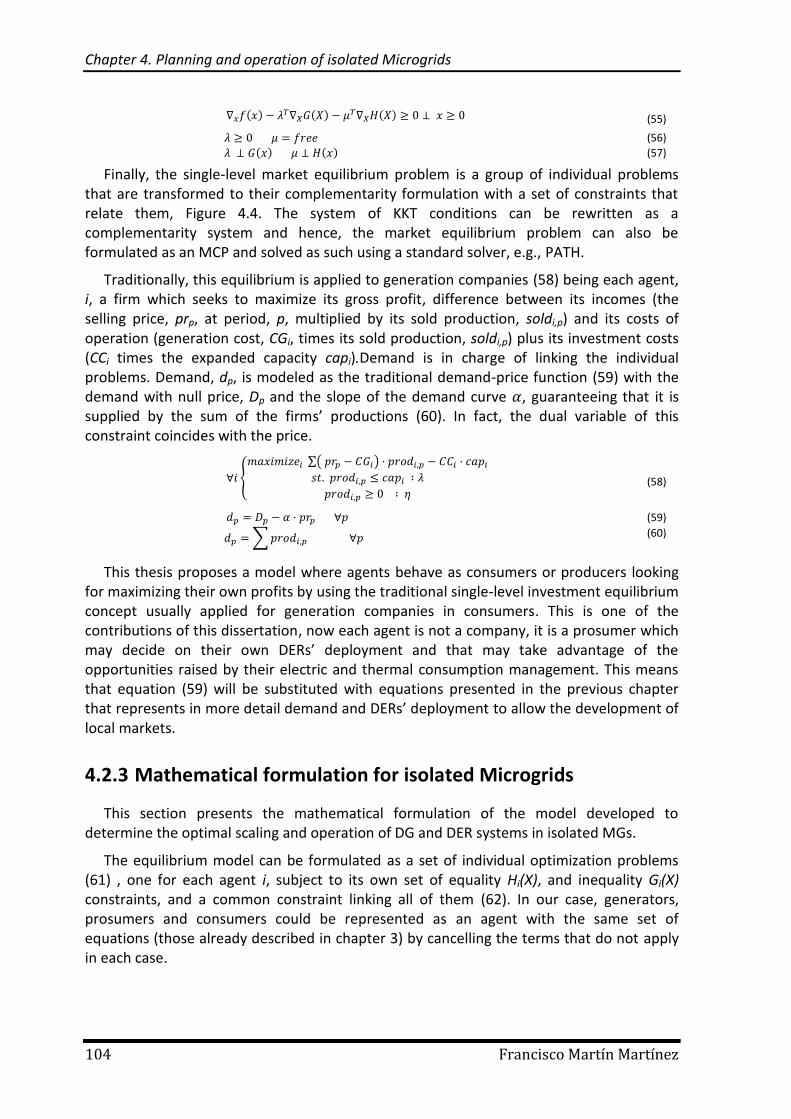
Chapter 4. Planning and operation of isolated Microgrids
104 Francisco Martín Martínez
( ) ( )
( ) (55)
(56)
( ) ( ) (57)
Finally, the single-level market equilibrium problem is a group of individual problems that are transformed to their complementarity formulation with a set of constraints that relate them, Figure 4.4. The system of KKT conditions can be rewritten as a complementarity system and hence, the market equilibrium problem can also be formulated as an MCP and solved as such using a standard solver, e.g., PATH.
Traditionally, this equilibrium is applied to generation companies (58) being each agent, i, a firm which seeks to maximize its gross profit, difference between its incomes (the selling price, prp, at period, p, multiplied by its sold production, soldi,p) and its costs of operation (generation cost, CGi, times its sold production, soldi,p) plus its investment costs (CCi times the expanded capacity capi).Demand is in charge of linking the individual problems. Demand, dp, is modeled as the traditional demand-price function (59) with the demand with null price, Dp and the slope of the demand curve , guaranteeing that it is supplied by the sum of the firms’ productions (60). In fact, the dual variable of this constraint coincides with the price.
{
∑( )
(58)
(59)
∑ (60)
This thesis proposes a model where agents behave as consumers or producers looking for maximizing their own profits by using the traditional single-level investment equilibrium concept usually applied for generation companies in consumers. This is one of the contributions of this dissertation, now each agent is not a company, it is a prosumer which may decide on their own DERs’ deployment and that may take advantage of the opportunities raised by their electric and thermal consumption management. This means that equation (59) will be substituted with equations presented in the previous chapter that represents in more detail demand and DERs’ deployment to allow the development of local markets.
4.2.3 Mathematical formulation for isolated Microgrids
This section presents the mathematical formulation of the model developed to determine the optimal scaling and operation of DG and DER systems in isolated MGs.
The equilibrium model can be formulated as a set of individual optimization problems (61) , one for each agent i, subject to its own set of equality Hi(X), and inequality Gi(X) constraints, and a common constraint linking all of them (62). In our case, generators, prosumers and consumers could be represented as an agent with the same set of equations (those already described in chapter 3) by cancelling the terms that do not apply in each case.
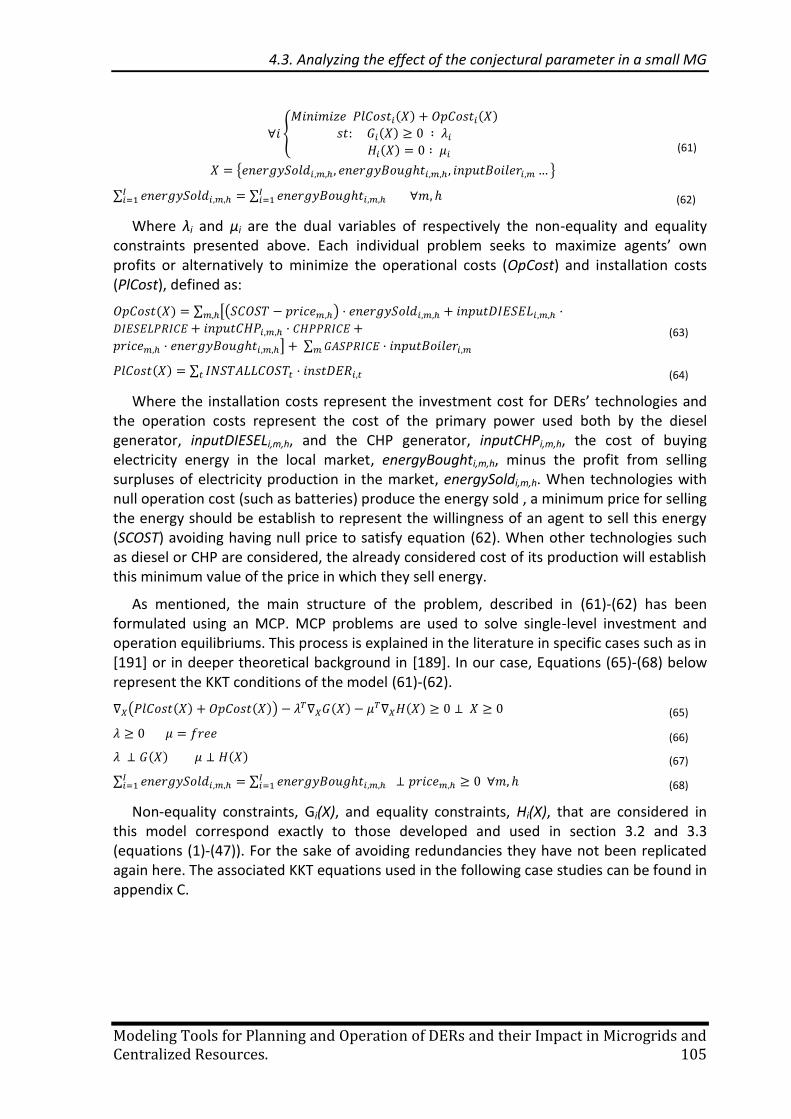
4.3. Analyzing the effect of the conjectural parameter in a small MG
Modeling Tools for Planning and Operation of DERs and their Impact in Microgrids and Centralized Resources. 105
{
( ) ( )
( ) ( )
{ }
(61)
∑ ∑
(62)
Where λi and μi are the dual variables of respectively the non-equality and equality constraints presented above. Each individual problem seeks to maximize agents’ own profits or alternatively to minimize the operational costs (OpCost) and installation costs (PlCost), defined as:
( ) ∑ [( )
] ∑ (63)
( ) ∑ (64)
Where the installation costs represent the investment cost for DERs’ technologies and the operation costs represent the cost of the primary power used both by the diesel generator, inputDIESELi,m,h, and the CHP generator, inputCHPi,m,h, the cost of buying electricity energy in the local market, energyBoughti,m,h, minus the profit from selling surpluses of electricity production in the market, energySoldi,m,h. When technologies with null operation cost (such as batteries) produce the energy sold , a minimum price for selling the energy should be establish to represent the willingness of an agent to sell this energy (SCOST) avoiding having null price to satisfy equation (62). When other technologies such as diesel or CHP are considered, the already considered cost of its production will establish this minimum value of the price in which they sell energy.
As mentioned, the main structure of the problem, described in (61)-(62) has been formulated using an MCP. MCP problems are used to solve single-level investment and operation equilibriums. This process is explained in the literature in specific cases such as in [191] or in deeper theoretical background in [189]. In our case, Equations (65)-(68) below represent the KKT conditions of the model (61)-(62).
( ( ) ( )) ( )
( ) (65)
(66)
( ) ( ) (67)
∑ ∑
(68)
Non-equality constraints, Gi(X), and equality constraints, Hi(X), that are considered in this model correspond exactly to those developed and used in section 3.2 and 3.3 (equations (1)-(47)). For the sake of avoiding redundancies they have not been replicated again here. The associated KKT equations used in the following case studies can be found in appendix C.
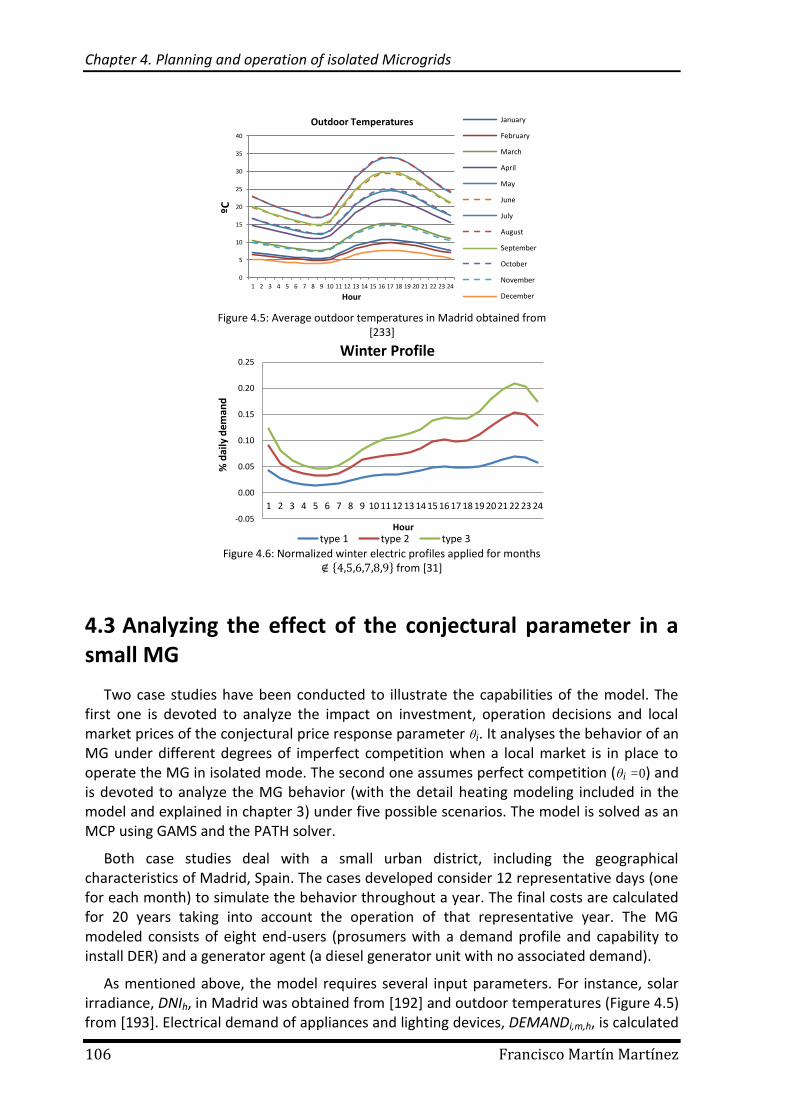
Chapter 4. Planning and operation of isolated Microgrids
106 Francisco Martín Martínez
4.3 Analyzing the effect of the conjectural parameter in a small MG
Two case studies have been conducted to illustrate the capabilities of the model. The first one is devoted to analyze the impact on investment, operation decisions and local market prices of the conjectural price response parameter θi. It analyses the behavior of an MG under different degrees of imperfect competition when a local market is in place to operate the MG in isolated mode. The second one assumes perfect competition (θi =0) and is devoted to analyze the MG behavior (with the detail heating modeling included in the model and explained in chapter 3) under five possible scenarios. The model is solved as an MCP using GAMS and the PATH solver.
Both case studies deal with a small urban district, including the geographical characteristics of Madrid, Spain. The cases developed consider 12 representative days (one for each month) to simulate the behavior throughout a year. The final costs are calculated for 20 years taking into account the operation of that representative year. The MG modeled consists of eight end-users (prosumers with a demand profile and capability to install DER) and a generator agent (a diesel generator unit with no associated demand).
As mentioned above, the model requires several input parameters. For instance, solar irradiance, DNIh, in Madrid was obtained from [192] and outdoor temperatures (Figure 4.5) from [193]. Electrical demand of appliances and lighting devices, DEMANDi,m,h, is calculated
-0.05
0.00
0.05
0.10
0.15
0.20
0.25
1 2 3 4 5 6 7 8 9 10 11 12 13 14 15 16 17 18 19 20 21 22 23 24
% d
aily
dem
and
Hour
Winter Profile
type 1 type 2 type 3
Figure 4.6: Normalized winter electric profiles applied for months * + from [31]
0
5
10
15
20
25
30
35
40
1 2 3 4 5 6 7 8 9 10 11 12 13 14 15 16 17 18 19 20 21 22 23 24
ºC
Hour
Outdoor Temperatures January
February
March
April
May
June
July
August
September
October
November
December
Figure 4.5: Average outdoor temperatures in Madrid obtained from [233]
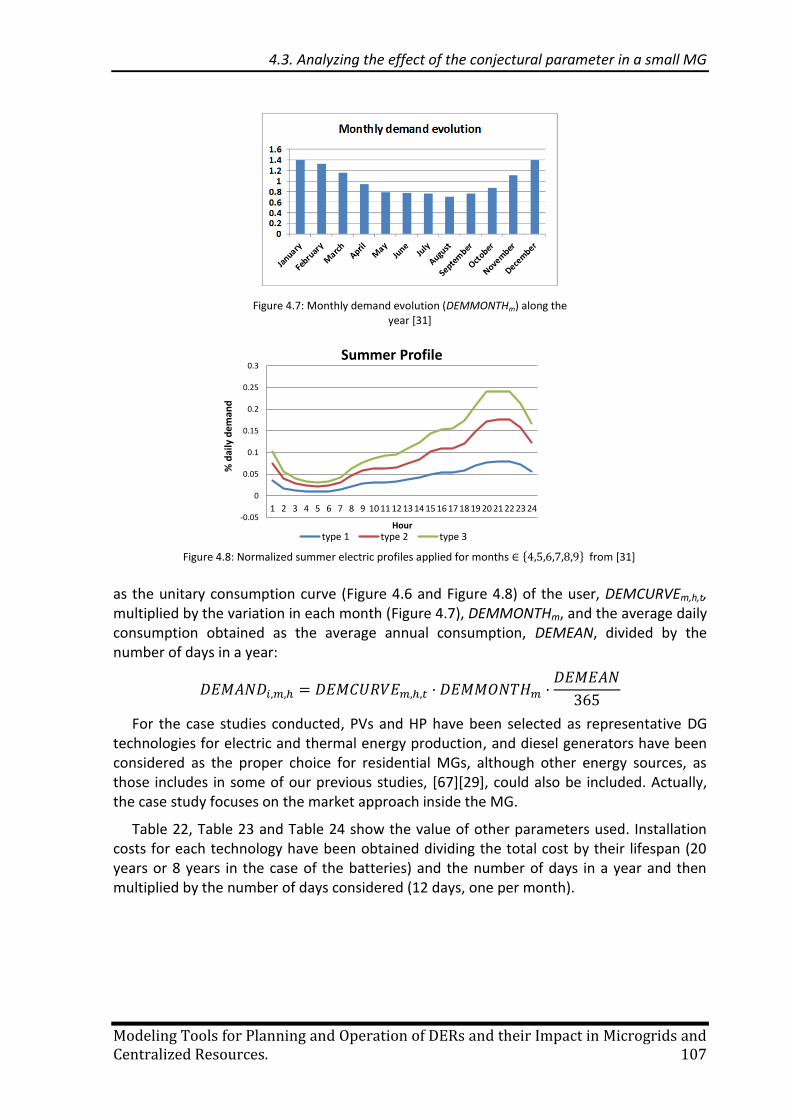
4.3. Analyzing the effect of the conjectural parameter in a small MG
Modeling Tools for Planning and Operation of DERs and their Impact in Microgrids and Centralized Resources. 107
as the unitary consumption curve (Figure 4.6 and Figure 4.8) of the user, DEMCURVEm,h,t, multiplied by the variation in each month (Figure 4.7), DEMMONTHm, and the average daily consumption obtained as the average annual consumption, DEMEAN, divided by the number of days in a year:
For the case studies conducted, PVs and HP have been selected as representative DG technologies for electric and thermal energy production, and diesel generators have been considered as the proper choice for residential MGs, although other energy sources, as those includes in some of our previous studies, [67][29], could also be included. Actually, the case study focuses on the market approach inside the MG.
Table 22, Table 23 and Table 24 show the value of other parameters used. Installation costs for each technology have been obtained dividing the total cost by their lifespan (20 years or 8 years in the case of the batteries) and the number of days in a year and then multiplied by the number of days considered (12 days, one per month).
-0.05
0
0.05
0.1
0.15
0.2
0.25
0.3
1 2 3 4 5 6 7 8 9 10 11 12 13 14 15 16 17 18 19 20 21 22 23 24
% d
aily
de
man
d
Hour
Summer Profile
type 1 type 2 type 3
Figure 4.8: Normalized summer electric profiles applied for months * + from [31]
Figure 4.7: Monthly demand evolution (DEMMONTHm) along the year [31]
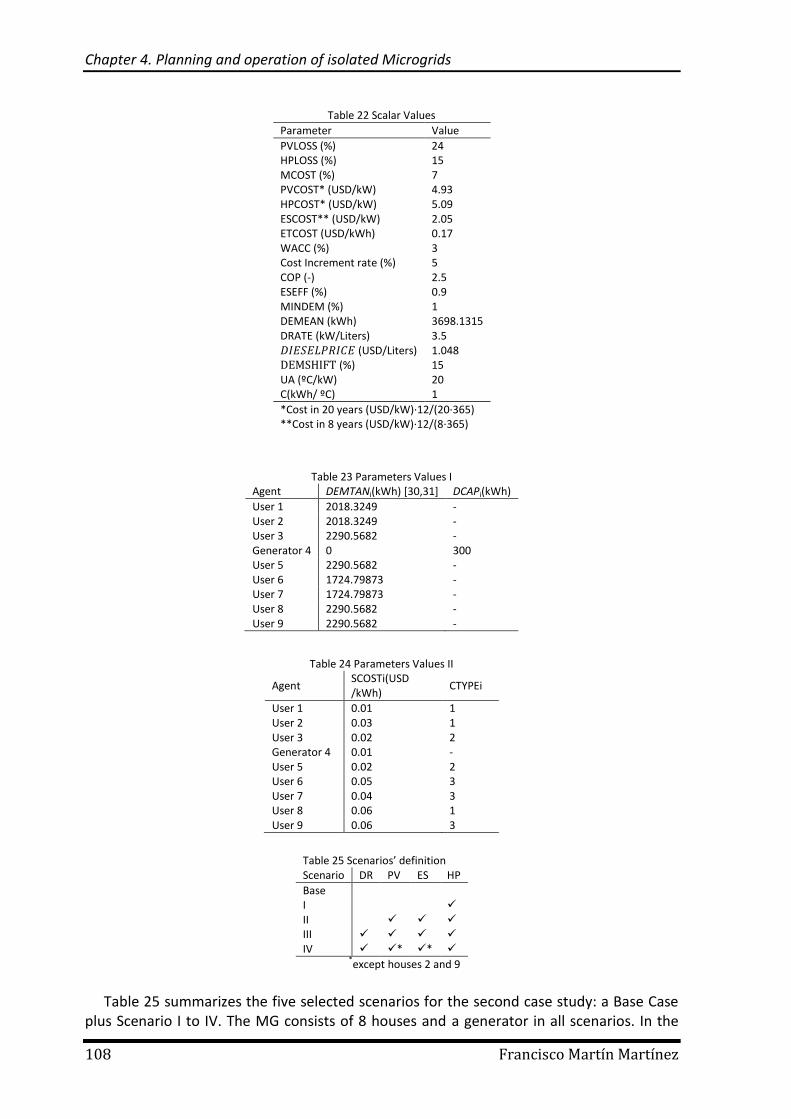
Chapter 4. Planning and operation of isolated Microgrids
108 Francisco Martín Martínez
Table 22 Scalar Values
Parameter Value
PVLOSS (%) 24 HPLOSS (%) 15 MCOST (%) 7 PVCOST* (USD/kW) 4.93 HPCOST* (USD/kW) 5.09 ESCOST** (USD/kW) 2.05 ETCOST (USD/kWh) 0.17 WACC (%) 3 Cost Increment rate (%) 5 COP (-) 2.5 ESEFF (%) 0.9 MINDEM (%) 1 DEMEAN (kWh) 3698.1315 DRATE (kW/Liters) 3.5 (USD/Liters) 1.048 (%) 15 UA (ºC/kW) 20 C(kWh/ ºC) 1
*Cost in 20 years (USD/kW)·12/(20·365) **Cost in 8 years (USD/kW)·12/(8·365)
Table 23 Parameters Values I Agent DEMTANi(kWh) [30,31] DCAPi(kWh)
User 1 2018.3249 - User 2 2018.3249 - User 3 2290.5682 - Generator 4 0 300 User 5 2290.5682 - User 6 1724.79873 - User 7 1724.79873 - User 8 2290.5682 - User 9 2290.5682 -
Table 24 Parameters Values II
Agent SCOSTi(USD /kWh)
CTYPEi
User 1 0.01 1 User 2 0.03 1 User 3 0.02 2 Generator 4 0.01 - User 5 0.02 2 User 6 0.05 3 User 7 0.04 3 User 8 0.06 1 User 9 0.06 3
Table 25 Scenarios’ definition Scenario DR PV ES HP
Base I II III IV * *
*except houses 2 and 9
Table 25 summarizes the five selected scenarios for the second case study: a Base Case plus Scenario I to IV. The MG consists of 8 houses and a generator in all scenarios. In the
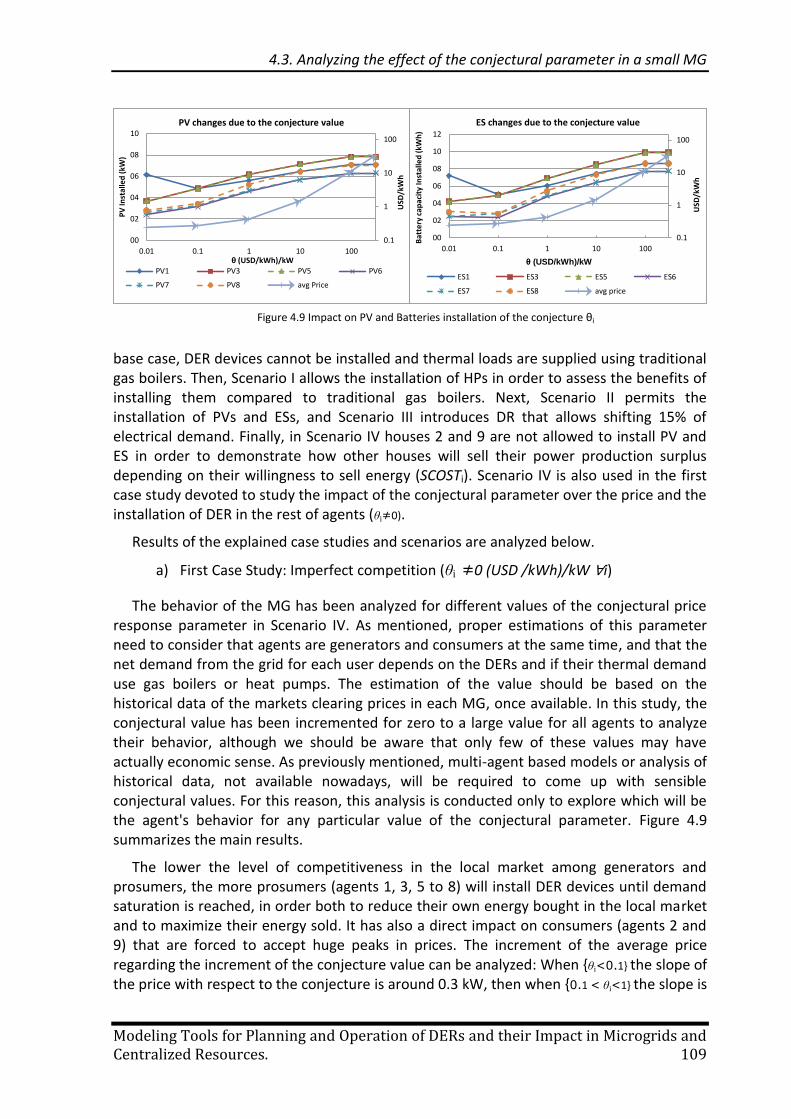
4.3. Analyzing the effect of the conjectural parameter in a small MG
Modeling Tools for Planning and Operation of DERs and their Impact in Microgrids and Centralized Resources. 109
base case, DER devices cannot be installed and thermal loads are supplied using traditional gas boilers. Then, Scenario I allows the installation of HPs in order to assess the benefits of installing them compared to traditional gas boilers. Next, Scenario II permits the installation of PVs and ESs, and Scenario III introduces DR that allows shifting 15% of electrical demand. Finally, in Scenario IV houses 2 and 9 are not allowed to install PV and ES in order to demonstrate how other houses will sell their power production surplus depending on their willingness to sell energy (SCOSTi). Scenario IV is also used in the first case study devoted to study the impact of the conjectural parameter over the price and the installation of DER in the rest of agents (θi≠0).
Results of the explained case studies and scenarios are analyzed below.
a) First Case Study: Imperfect competition (θi ≠0 (USD /kWh)/kW i)
The behavior of the MG has been analyzed for different values of the conjectural price response parameter in Scenario IV. As mentioned, proper estimations of this parameter need to consider that agents are generators and consumers at the same time, and that the net demand from the grid for each user depends on the DERs and if their thermal demand use gas boilers or heat pumps. The estimation of the value should be based on the historical data of the markets clearing prices in each MG, once available. In this study, the conjectural value has been incremented for zero to a large value for all agents to analyze their behavior, although we should be aware that only few of these values may have actually economic sense. As previously mentioned, multi-agent based models or analysis of historical data, not available nowadays, will be required to come up with sensible conjectural values. For this reason, this analysis is conducted only to explore which will be the agent's behavior for any particular value of the conjectural parameter. Figure 4.9 summarizes the main results.
The lower the level of competitiveness in the local market among generators and prosumers, the more prosumers (agents 1, 3, 5 to 8) will install DER devices until demand saturation is reached, in order both to reduce their own energy bought in the local market and to maximize their energy sold. It has also a direct impact on consumers (agents 2 and 9) that are forced to accept huge peaks in prices. The increment of the average price regarding the increment of the conjecture value can be analyzed: When {θi<0.1} the slope of the price with respect to the conjecture is around 0.3 kW, then when {0.1 < θi<1} the slope is
Figure 4.9 Impact on PV and Batteries installation of the conjecture θi
0.1
1
10
100
00
02
04
06
08
10
0.01 0.1 1 10 100
USD
/kW
h
PV
Inst
alle
d (
kW)
θ (USD/kWh)/kW
PV changes due to the conjecture value
PV1 PV3 PV5 PV6
PV7 PV8 avg Price
0.1
1
10
100
00
02
04
06
08
10
12
0.01 0.1 1 10 100
USD
/kW
h
Bat
tery
cap
acit
y In
stal
led
(kW
h)
θ (USD/kWh)/kW
ES changes due to the conjecture value
ES1 ES3 ES5 ES6
ES7 ES8 avg price
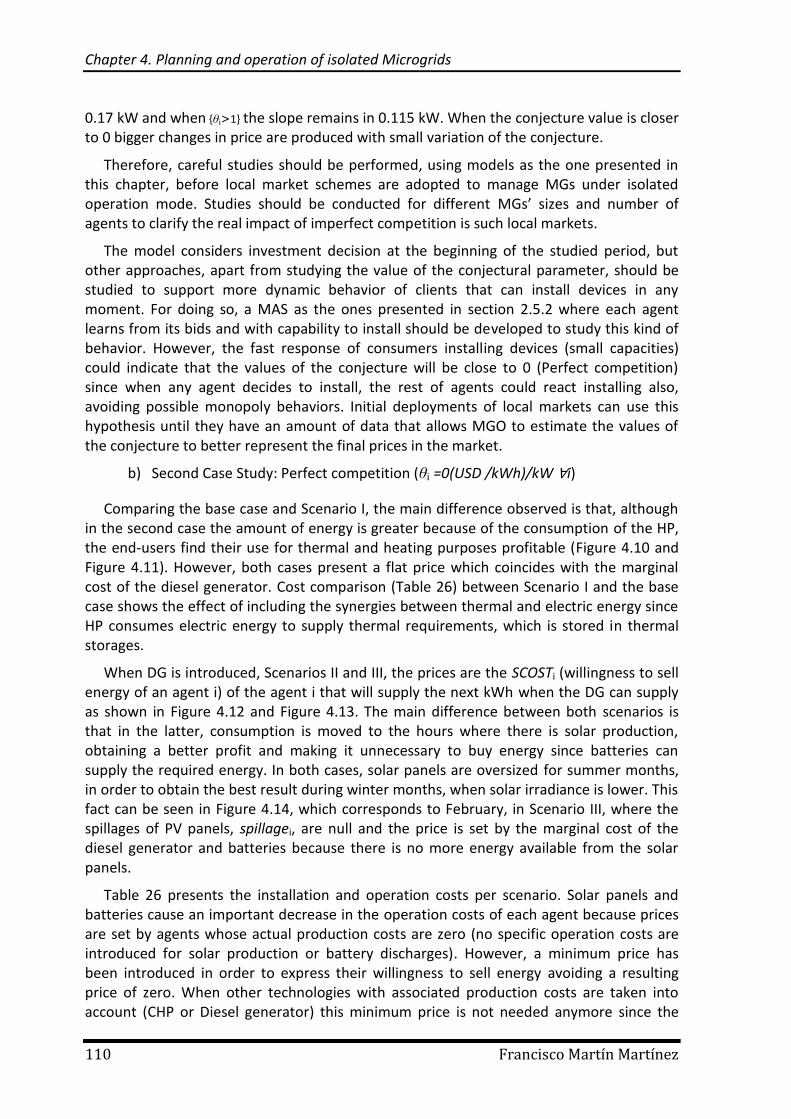
Chapter 4. Planning and operation of isolated Microgrids
110 Francisco Martín Martínez
0.17 kW and when {θi>1} the slope remains in 0.115 kW. When the conjecture value is closer to 0 bigger changes in price are produced with small variation of the conjecture.
Therefore, careful studies should be performed, using models as the one presented in this chapter, before local market schemes are adopted to manage MGs under isolated operation mode. Studies should be conducted for different MGs’ sizes and number of agents to clarify the real impact of imperfect competition is such local markets.
The model considers investment decision at the beginning of the studied period, but other approaches, apart from studying the value of the conjectural parameter, should be studied to support more dynamic behavior of clients that can install devices in any moment. For doing so, a MAS as the ones presented in section 2.5.2 where each agent learns from its bids and with capability to install should be developed to study this kind of behavior. However, the fast response of consumers installing devices (small capacities) could indicate that the values of the conjecture will be close to 0 (Perfect competition) since when any agent decides to install, the rest of agents could react installing also, avoiding possible monopoly behaviors. Initial deployments of local markets can use this hypothesis until they have an amount of data that allows MGO to estimate the values of the conjecture to better represent the final prices in the market.
b) Second Case Study: Perfect competition (θi =0(USD /kWh)/kW i)
Comparing the base case and Scenario I, the main difference observed is that, although in the second case the amount of energy is greater because of the consumption of the HP, the end-users find their use for thermal and heating purposes profitable (Figure 4.10 and Figure 4.11). However, both cases present a flat price which coincides with the marginal cost of the diesel generator. Cost comparison (Table 26) between Scenario I and the base case shows the effect of including the synergies between thermal and electric energy since HP consumes electric energy to supply thermal requirements, which is stored in thermal storages.
When DG is introduced, Scenarios II and III, the prices are the SCOSTi (willingness to sell energy of an agent i) of the agent i that will supply the next kWh when the DG can supply as shown in Figure 4.12 and Figure 4.13. The main difference between both scenarios is that in the latter, consumption is moved to the hours where there is solar production, obtaining a better profit and making it unnecessary to buy energy since batteries can supply the required energy. In both cases, solar panels are oversized for summer months, in order to obtain the best result during winter months, when solar irradiance is lower. This fact can be seen in Figure 4.14, which corresponds to February, in Scenario III, where the spillages of PV panels, spillagei, are null and the price is set by the marginal cost of the diesel generator and batteries because there is no more energy available from the solar panels.
Table 26 presents the installation and operation costs per scenario. Solar panels and batteries cause an important decrease in the operation costs of each agent because prices are set by agents whose actual production costs are zero (no specific operation costs are introduced for solar production or battery discharges). However, a minimum price has been introduced in order to express their willingness to sell energy avoiding a resulting price of zero. When other technologies with associated production costs are taken into account (CHP or Diesel generator) this minimum price is not needed anymore since the
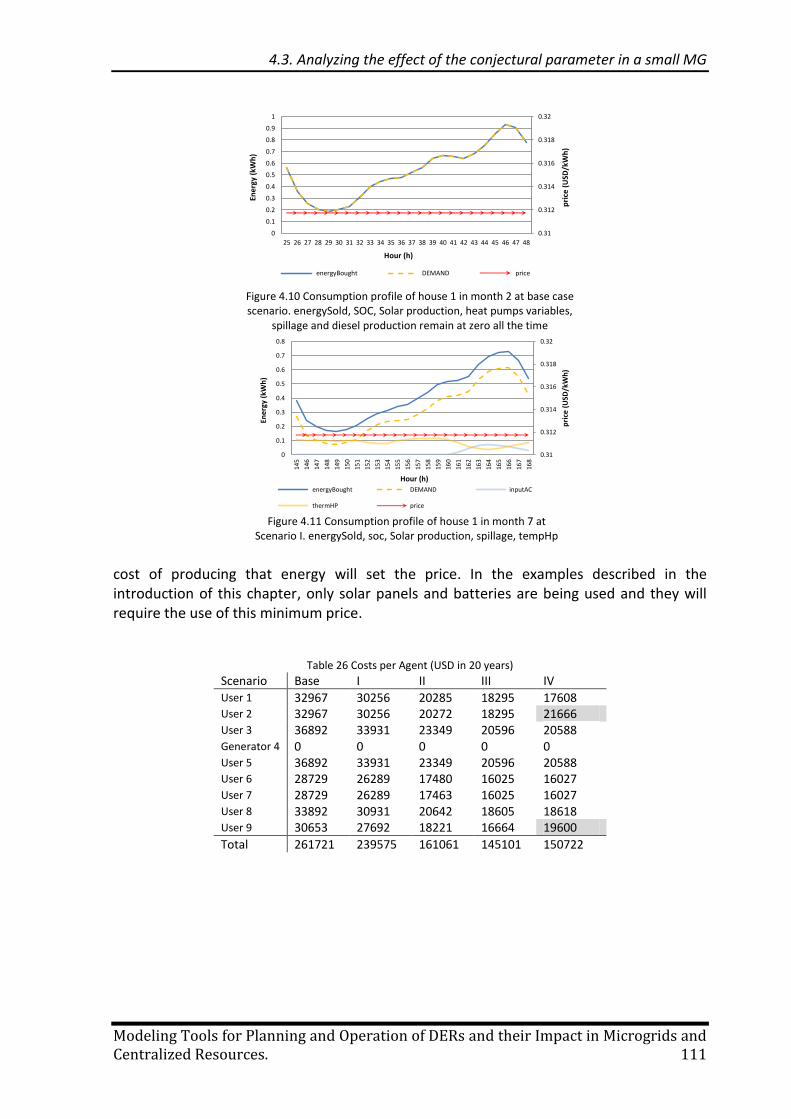
4.3. Analyzing the effect of the conjectural parameter in a small MG
Modeling Tools for Planning and Operation of DERs and their Impact in Microgrids and Centralized Resources. 111
cost of producing that energy will set the price. In the examples described in the introduction of this chapter, only solar panels and batteries are being used and they will require the use of this minimum price.
Table 26 Costs per Agent (USD in 20 years)
Scenario Base I II III IV User 1 32967 30256 20285 18295 17608 User 2 32967 30256 20272 18295 21666 User 3 36892 33931 23349 20596 20588 Generator 4 0 0 0 0 0 User 5 36892 33931 23349 20596 20588 User 6 28729 26289 17480 16025 16027 User 7 28729 26289 17463 16025 16027 User 8 33892 30931 20642 18605 18618 User 9 30653 27692 18221 16664 19600
Total 261721 239575 161061 145101 150722
0.31
0.312
0.314
0.316
0.318
0.32
0
0.1
0.2
0.3
0.4
0.5
0.6
0.7
0.8
14
5
14
6
14
7
14
8
14
9
15
0
15
1
15
2
15
3
15
4
15
5
156
15
7
15
8
15
9
16
0
16
1
16
2
16
3
16
4
16
5
16
6
16
7
16
8
pri
ce (
USD
/kW
h)
Ene
rgy
(kW
h)
Hour (h)
energyBought DEMAND inputAC
thermHP price
Figure 4.11 Consumption profile of house 1 in month 7 at Scenario I. energySold, soc, Solar production, spillage, tempHp
and diesel production remain at zero all the time
0.31
0.312
0.314
0.316
0.318
0.32
0
0.1
0.2
0.3
0.4
0.5
0.6
0.7
0.8
0.9
1
25 26 27 28 29 30 31 32 33 34 35 36 37 38 39 40 41 42 43 44 45 46 47 48
pri
ce (
USD
/kW
h)
Ener
gy (
kWh
)Hour (h)
energyBought DEMAND price
Figure 4.10 Consumption profile of house 1 in month 2 at base case scenario. energySold, SOC, Solar production, heat pumps variables,
spillage and diesel production remain at zero all the time
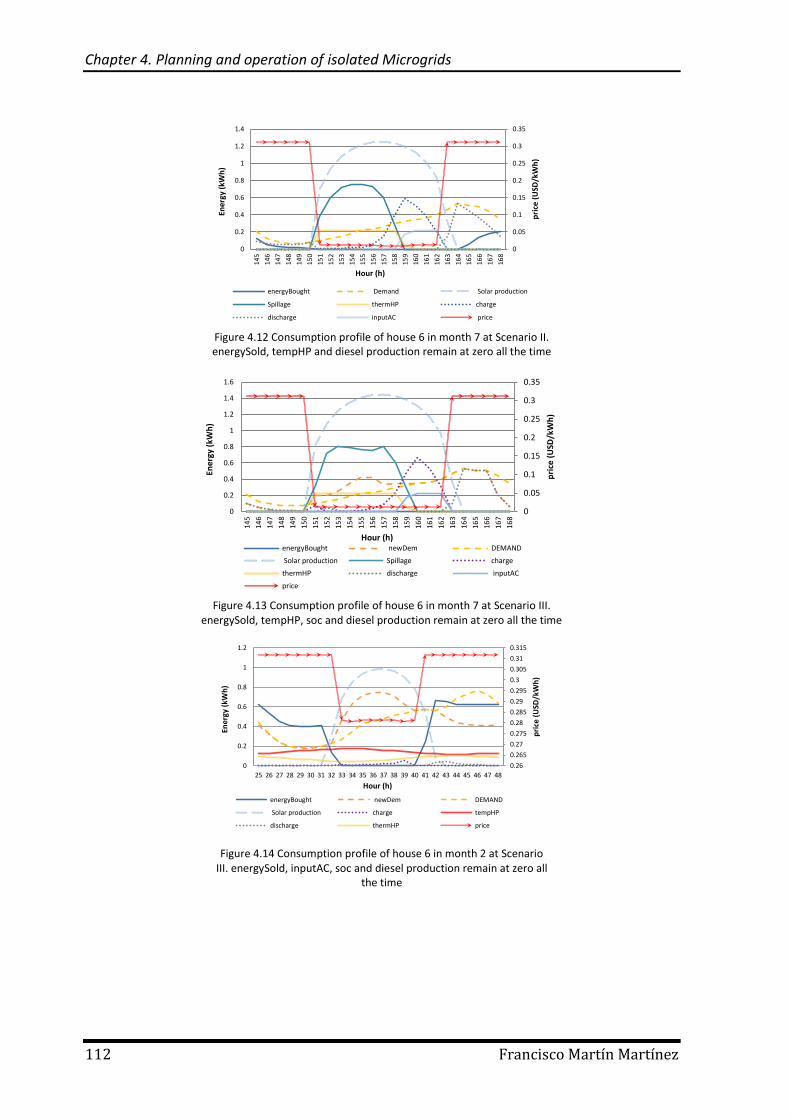
Chapter 4. Planning and operation of isolated Microgrids
112 Francisco Martín Martínez
0.26
0.265
0.27
0.275
0.28
0.285
0.29
0.295
0.3
0.305
0.31
0.315
0
0.2
0.4
0.6
0.8
1
1.2
25 26 27 28 29 30 31 32 33 34 35 36 37 38 39 40 41 42 43 44 45 46 47 48
pri
ce (
USD
/kW
h)
Ener
gy (
kWh
)
Hour (h)
energyBought newDem DEMAND
Solar production charge tempHP
discharge thermHP price
Figure 4.14 Consumption profile of house 6 in month 2 at Scenario III. energySold, inputAC, soc and diesel production remain at zero all
the time
0
0.05
0.1
0.15
0.2
0.25
0.3
0.35
0
0.2
0.4
0.6
0.8
1
1.2
1.4
1.6
14
5
14
6
14
7
14
8
14
9
15
0
15
1
15
2
15
3
15
4
15
5
15
6
15
7
15
8
15
9
16
0
16
1
16
2
16
3
16
4
16
5
166
16
7
16
8
pri
ce (
USD
/kW
h)
Ener
gy (
kWh
)
Hour (h)energyBought newDem DEMAND
Solar production Spillage charge
thermHP discharge inputAC
price
Figure 4.13 Consumption profile of house 6 in month 7 at Scenario III. energySold, tempHP, soc and diesel production remain at zero all the time
0
0.05
0.1
0.15
0.2
0.25
0.3
0.35
0
0.2
0.4
0.6
0.8
1
1.2
1.4
14
5
14
6
14
7
14
8
14
9
15
0
151
15
2
15
3
15
4
15
5
15
6
15
7
15
8
15
9
16
0
16
1
16
2
16
3
16
4
16
5
16
6
167
16
8
pri
ce (
USD
/kW
h)
Ener
gy (
kWh
)
Hour (h)
energyBought Demand Solar production
Spillage thermHP charge
discharge inputAC price
Figure 4.12 Consumption profile of house 6 in month 7 at Scenario II. energySold, tempHP and diesel production remain at zero all the time
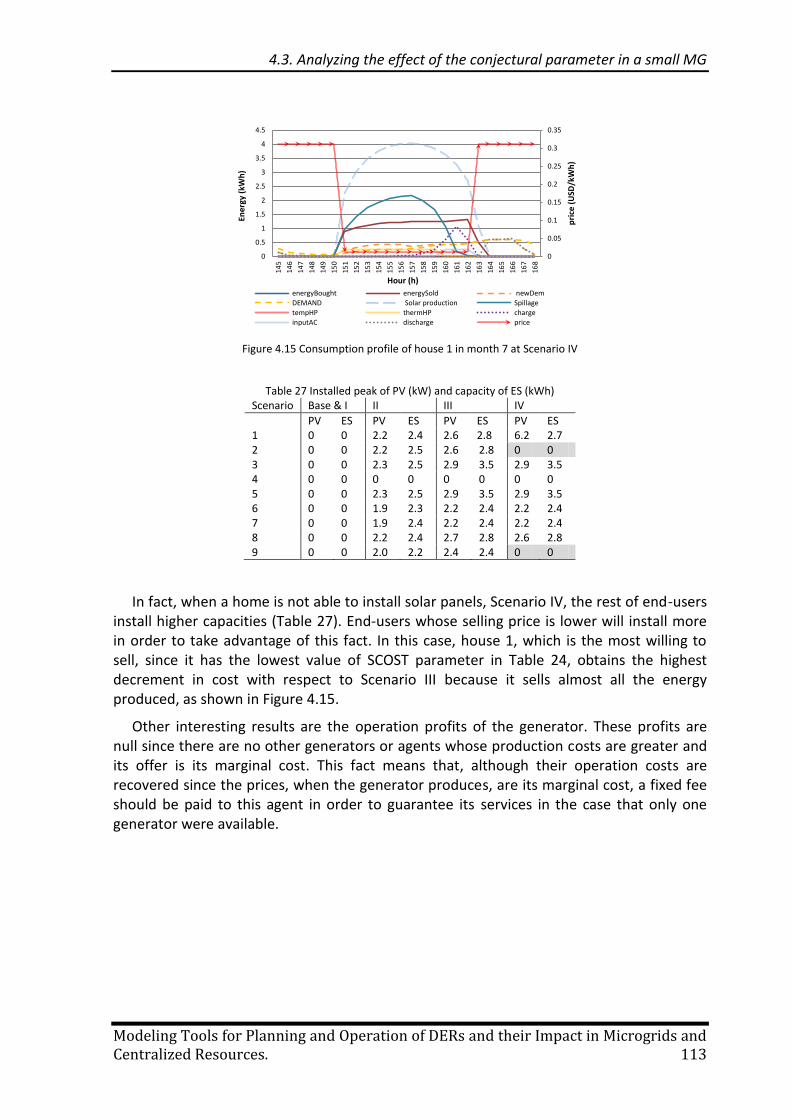
4.3. Analyzing the effect of the conjectural parameter in a small MG
Modeling Tools for Planning and Operation of DERs and their Impact in Microgrids and Centralized Resources. 113
Table 27 Installed peak of PV (kW) and capacity of ES (kWh) Scenario Base & I II III IV
PV ES PV ES PV ES PV ES 1 0 0 2.2 2.4 2.6 2.8 6.2 2.7 2 0 0 2.2 2.5 2.6 2.8 0 0 3 0 0 2.3 2.5 2.9 3.5 2.9 3.5 4 0 0 0 0 0 0 0 0 5 0 0 2.3 2.5 2.9 3.5 2.9 3.5 6 0 0 1.9 2.3 2.2 2.4 2.2 2.4 7 0 0 1.9 2.4 2.2 2.4 2.2 2.4 8 0 0 2.2 2.4 2.7 2.8 2.6 2.8 9 0 0 2.0 2.2 2.4 2.4 0 0
In fact, when a home is not able to install solar panels, Scenario IV, the rest of end-users install higher capacities (Table 27). End-users whose selling price is lower will install more in order to take advantage of this fact. In this case, house 1, which is the most willing to sell, since it has the lowest value of SCOST parameter in Table 24, obtains the highest decrement in cost with respect to Scenario III because it sells almost all the energy produced, as shown in Figure 4.15.
Other interesting results are the operation profits of the generator. These profits are null since there are no other generators or agents whose production costs are greater and its offer is its marginal cost. This fact means that, although their operation costs are recovered since the prices, when the generator produces, are its marginal cost, a fixed fee should be paid to this agent in order to guarantee its services in the case that only one generator were available.
0
0.05
0.1
0.15
0.2
0.25
0.3
0.35
0
0.5
1
1.5
2
2.5
3
3.5
4
4.5
14
5
14
6
14
7
14
8
14
9
15
0
151
15
2
15
3
15
4
15
5
15
6
15
7
15
8
15
9
16
0
16
1
16
2
16
3
16
4
16
5
16
6
167
16
8
pri
ce (
USD
/kW
h)
Ener
gy (
kWh
)
Hour (h)
energyBought energySold newDem
DEMAND Solar production Spillage
tempHP thermHP charge
inputAC discharge price
Figure 4.15 Consumption profile of house 1 in month 7 at Scenario IV
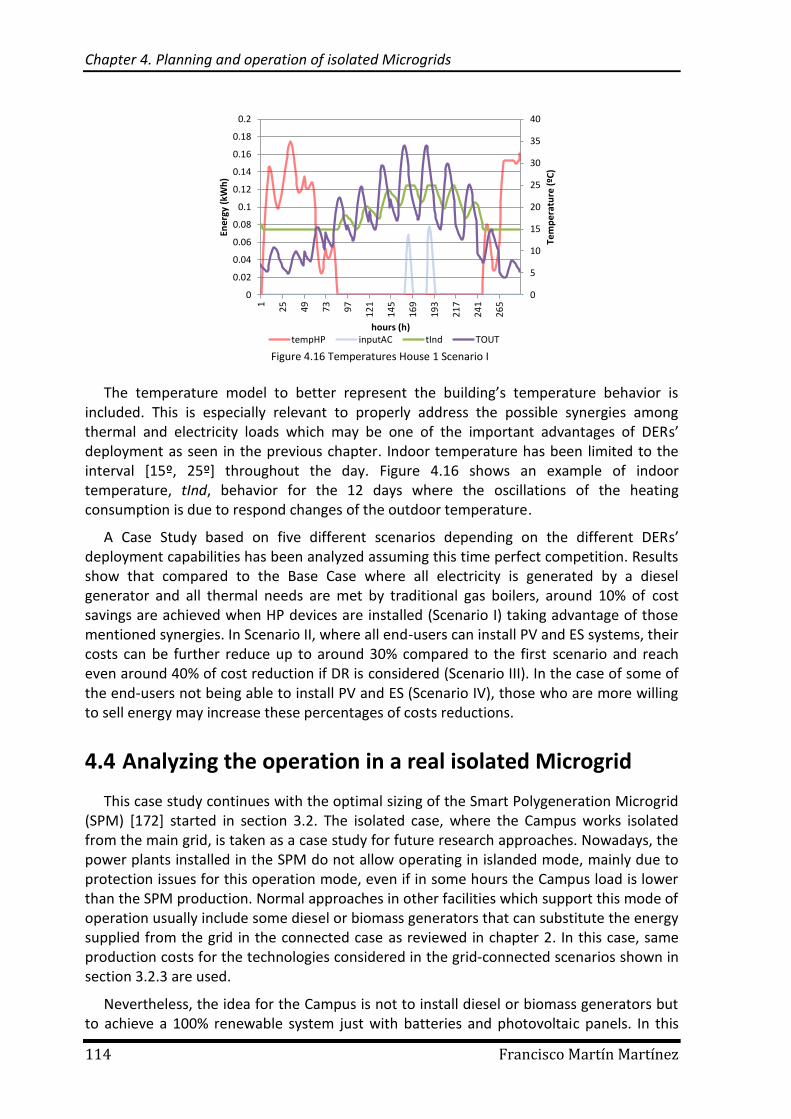
Chapter 4. Planning and operation of isolated Microgrids
114 Francisco Martín Martínez
The temperature model to better represent the building’s temperature behavior is included. This is especially relevant to properly address the possible synergies among thermal and electricity loads which may be one of the important advantages of DERs’ deployment as seen in the previous chapter. Indoor temperature has been limited to the interval [15º, 25º] throughout the day. Figure 4.16 shows an example of indoor temperature, tInd, behavior for the 12 days where the oscillations of the heating consumption is due to respond changes of the outdoor temperature.
A Case Study based on five different scenarios depending on the different DERs’ deployment capabilities has been analyzed assuming this time perfect competition. Results show that compared to the Base Case where all electricity is generated by a diesel generator and all thermal needs are met by traditional gas boilers, around 10% of cost savings are achieved when HP devices are installed (Scenario I) taking advantage of those mentioned synergies. In Scenario II, where all end-users can install PV and ES systems, their costs can be further reduce up to around 30% compared to the first scenario and reach even around 40% of cost reduction if DR is considered (Scenario III). In the case of some of the end-users not being able to install PV and ES (Scenario IV), those who are more willing to sell energy may increase these percentages of costs reductions.
4.4 Analyzing the operation in a real isolated Microgrid
This case study continues with the optimal sizing of the Smart Polygeneration Microgrid (SPM) [172] started in section 3.2. The isolated case, where the Campus works isolated from the main grid, is taken as a case study for future research approaches. Nowadays, the power plants installed in the SPM do not allow operating in islanded mode, mainly due to protection issues for this operation mode, even if in some hours the Campus load is lower than the SPM production. Normal approaches in other facilities which support this mode of operation usually include some diesel or biomass generators that can substitute the energy supplied from the grid in the connected case as reviewed in chapter 2. In this case, same production costs for the technologies considered in the grid-connected scenarios shown in section 3.2.3 are used.
Nevertheless, the idea for the Campus is not to install diesel or biomass generators but to achieve a 100% renewable system just with batteries and photovoltaic panels. In this
Figure 4.16 Temperatures House 1 Scenario I
0
5
10
15
20
25
30
35
40
0
0.02
0.04
0.06
0.08
0.1
0.12
0.14
0.16
0.18
0.2
1
25
49
73
97
12
1
14
5
16
9
19
3
21
7
24
1
26
5
Tem
pe
ratu
re (
ºC)
Ene
rgy
(kW
h)
hours (h)tempHP inputAC tInd TOUT
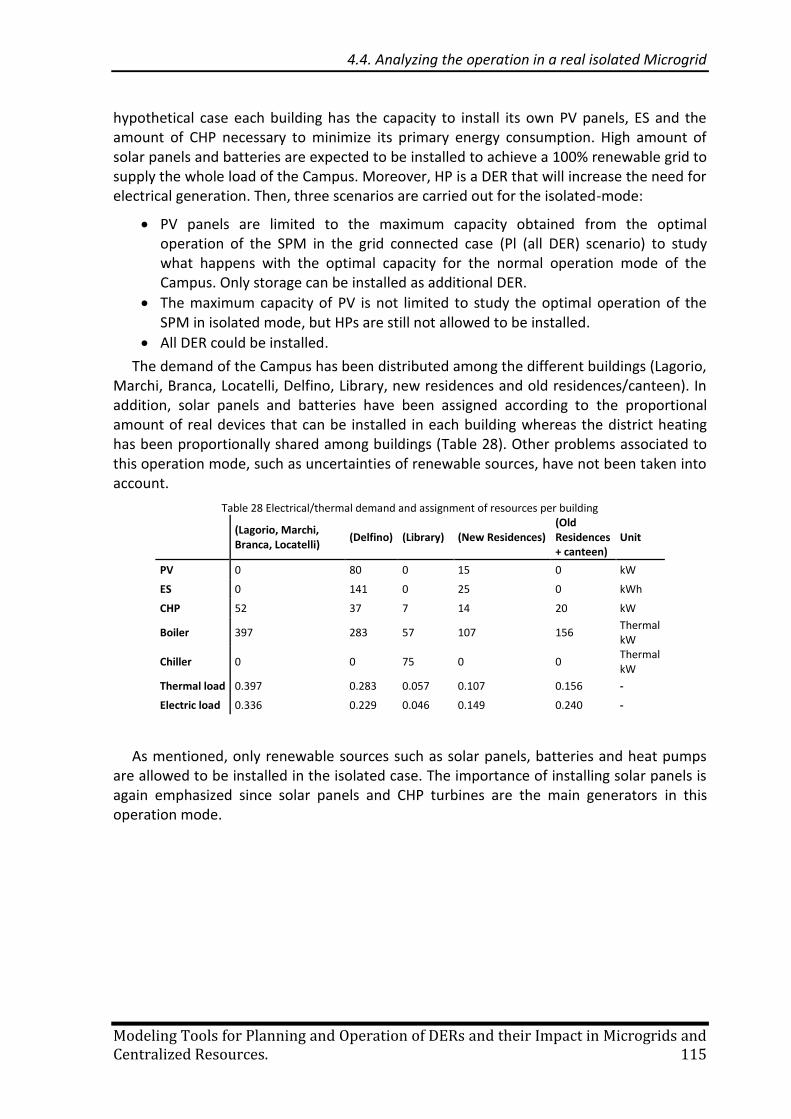
4.4. Analyzing the operation in a real isolated Microgrid
Modeling Tools for Planning and Operation of DERs and their Impact in Microgrids and Centralized Resources. 115
hypothetical case each building has the capacity to install its own PV panels, ES and the amount of CHP necessary to minimize its primary energy consumption. High amount of solar panels and batteries are expected to be installed to achieve a 100% renewable grid to supply the whole load of the Campus. Moreover, HP is a DER that will increase the need for electrical generation. Then, three scenarios are carried out for the isolated-mode:
PV panels are limited to the maximum capacity obtained from the optimal operation of the SPM in the grid connected case (Pl (all DER) scenario) to study what happens with the optimal capacity for the normal operation mode of the Campus. Only storage can be installed as additional DER.
The maximum capacity of PV is not limited to study the optimal operation of the SPM in isolated mode, but HPs are still not allowed to be installed.
All DER could be installed.
The demand of the Campus has been distributed among the different buildings (Lagorio, Marchi, Branca, Locatelli, Delfino, Library, new residences and old residences/canteen). In addition, solar panels and batteries have been assigned according to the proportional amount of real devices that can be installed in each building whereas the district heating has been proportionally shared among buildings (Table 28). Other problems associated to this operation mode, such as uncertainties of renewable sources, have not been taken into account.
Table 28 Electrical/thermal demand and assignment of resources per building
(Lagorio, Marchi, Branca, Locatelli)
(Delfino) (Library) (New Residences) (Old Residences + canteen)
Unit
PV 0 80 0 15 0 kW
ES 0 141 0 25 0 kWh
CHP 52 37 7 14 20 kW
Boiler 397 283 57 107 156 Thermal kW
Chiller 0 0 75 0 0 Thermal kW
Thermal load 0.397 0.283 0.057 0.107 0.156 -
Electric load 0.336 0.229 0.046 0.149 0.240 -
As mentioned, only renewable sources such as solar panels, batteries and heat pumps are allowed to be installed in the isolated case. The importance of installing solar panels is again emphasized since solar panels and CHP turbines are the main generators in this operation mode.
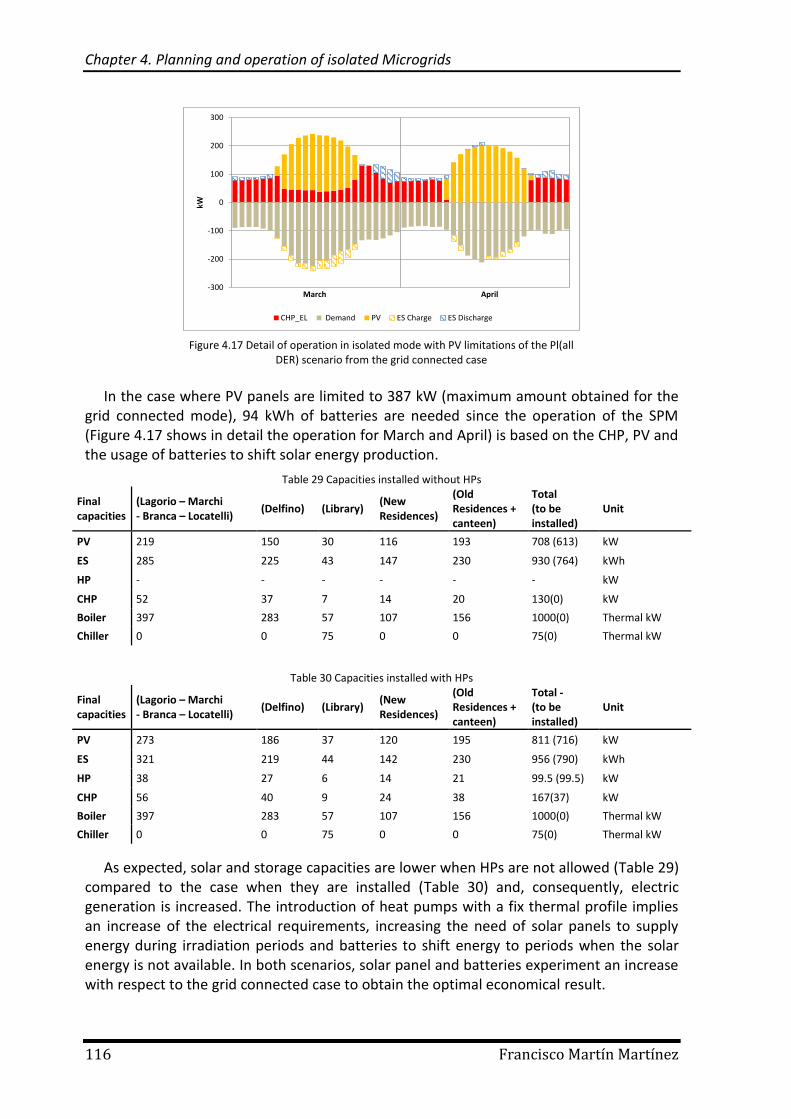
Chapter 4. Planning and operation of isolated Microgrids
116 Francisco Martín Martínez
In the case where PV panels are limited to 387 kW (maximum amount obtained for the grid connected mode), 94 kWh of batteries are needed since the operation of the SPM (Figure 4.17 shows in detail the operation for March and April) is based on the CHP, PV and the usage of batteries to shift solar energy production.
Table 29 Capacities installed without HPs
Final capacities
(Lagorio – Marchi - Branca – Locatelli)
(Delfino) (Library) (New Residences)
(Old Residences + canteen)
Total (to be installed)
Unit
PV 219 150 30 116 193 708 (613) kW
ES 285 225 43 147 230 930 (764) kWh
HP - - - - - - kW
CHP 52 37 7 14 20 130(0) kW
Boiler 397 283 57 107 156 1000(0) Thermal kW
Chiller 0 0 75 0 0 75(0) Thermal kW
Table 30 Capacities installed with HPs
Final capacities
(Lagorio – Marchi - Branca – Locatelli)
(Delfino) (Library) (New Residences)
(Old Residences + canteen)
Total - (to be installed)
Unit
PV 273 186 37 120 195 811 (716) kW
ES 321 219 44 142 230 956 (790) kWh
HP 38 27 6 14 21 99.5 (99.5) kW
CHP 56 40 9 24 38 167(37) kW
Boiler 397 283 57 107 156 1000(0) Thermal kW
Chiller 0 0 75 0 0 75(0) Thermal kW
As expected, solar and storage capacities are lower when HPs are not allowed (Table 29) compared to the case when they are installed (Table 30) and, consequently, electric generation is increased. The introduction of heat pumps with a fix thermal profile implies an increase of the electrical requirements, increasing the need of solar panels to supply energy during irradiation periods and batteries to shift energy to periods when the solar energy is not available. In both scenarios, solar panel and batteries experiment an increase with respect to the grid connected case to obtain the optimal economical result.
-300
-200
-100
0
100
200
300
kW
March April
CHP_EL Demand PV ES Charge ES Discharge
Figure 4.17 Detail of operation in isolated mode with PV limitations of the Pl(all DER) scenario from the grid connected case
4.5. Conclusion
Modeling Tools for Planning and Operation of DERs and their Impact in Microgrids and Centralized Resources. 117
Analyzing the results, solar panels are the main resource to be installed in both cases. Solar panels are a clean and cheap energy resource whose production attains higher values in the peak consumption hours of the Savona Campus. The installation around 387 kW of solar panels could achieve savings of about 25% in comparison with the current yearly operation mode in the grid-connected case (Figure 3.8).
More solar panels and batteries would be necessary to operate optimally in isolated mode in case of permanent problems in the main grid since the current capacities in the campus do not allow the isolated operation. However, since this mode of operation will be used for carrying out research activities or resist to transient occurrences in the grid, current capacities and the installation of the 387kW (maximum amount obtained for the grid connected mode), of solar panel plus 94kWh batteries will be enough to operate in isolated mode during short-time periods since they are the capacities obtained for the first scenario in isolated mode. In addition, other strategies such as load shedding could be implemented in case of isolated operation to reduce the total amount of energy consumption of the Campus.
The current district heating (boiler and CHP turbines) installed in the Campus is enough to cover their thermal demand. However, HPs could be installed to take advantage of the solar production in grid-connected mode.
In this case, the mathematical problems presented in chapter 3 and 4, have been applied for planning DER capacities in a real test-bed facility (called Smart Polygeneration Microgrid) at the Savona Campus of the University of Genoa. Two main cases have been considered: the grid-connected case (section 3.2.3) and the isolated case (section 4.2.5). In both cases, the opportunity for installing solar panels has been detected since the amount of solar panels installed in grid connected mode could allow the Campus saving around 25% of their yearly operation cost. If batteries are added to this amount of solar panels, the SPM could operate in isolated mode to overcome short time faults although the investment cost should be taken into account.
Moreover, new research activities related to islanded operation could be developed inside the campus such as the integration of renewable production, batteries and EMS and studies on frequency and voltage regulation and operational management models (unit commitments and optimization algorithms).
4.5 Conclusion
This chapter presents a model and mathematical formulation to represent the MG behavior in isolated operation mode where DERs and DR capabilities have been considered. This chapter presents two main contributions:
The idea of local markets for operating MGs has been already launched in the literature although their practical integration in MGs was not explored and properly set. This chapter presents and discusses a conceptual approach for operation of MGs both when the MG is integrated in a larger main grid (running sometimes isolated if necessary) and when it is an isolated MG. Defining new ideas and concepts of how MGs can operate in larger main grids is important since the chances to develop testbeds and pilot projects in such kind of MGs are higher. The proposed conceptual model presented, suggests that in normal conditions,
Chapter 4. Planning and operation of isolated Microgrids
118 Francisco Martín Martínez
MGs should be operated in connected mode like current distribution networks do. Therefore, non-isolated MGs should be understood as a scheme available for aggregators, retailers and energy service providers to offer better quality and reliability services to end-users when contingencies in the main system forces them to operate isolated. In that case the business model could be arrange around a local market framework able to properly accommodate the use of all DERs deployed within the MG and to value the energy exchanges among prosumers belonging to the MG. The model presented in this chapter will be used by the MGO for settling the electrical prices for the energy exchange inside the MG minimizing its total costs (a value of the conjecture equal to zero).
However, the model is very restrictive regarding the investment decisions in this kind of market. Investments done at the beginning of the period could not properly represent the behavior of this kind of markets where end-users can install DERs in short times. For this reason, the MGO could run the model allowing investment decisions to offer their clients recommendations about their installed DERs but the model will be used mainly for the operation of the grid.
This idea of a local market to manage the MG under isolated operation mode has been addressed through an equilibrium based MCP modeling approach. Existing equilibrium problems focus on generators competitive interactions, ignoring the role played by consumers and prosumers. The contribution of this work is twofold. First the demand is modeled in detail, taking into account both the electricity and thermal components of buildings’ consumptions. Second consumers may opt to become prosumers by installing and operating DERs, delivering even energy in certain periods. Such kind of model will allow investigations on the performances of such markets that have been already proposed in some European projects and some initiatives have been developed in the last year.
A Case Study has been conducted to assess the impact of the conjectural price response parameter used to model imperfect competition on the expansion and operation behavior of an MG. In the case study presented, price variations with respect to changes in the conjecture are higher (almost 3 times) when the value of the conjecture is closer to 0. Estimations of the values of such conjectures will be done based on the historical data of the clearing prices obtained. Further studies should be performed to evaluate the impact of imperfect competition for different MGs sizes and configuration in order to properly contribute to the discussion on the way MG should be economically managed under the isolated mode. For instance, simulations where each agent can bid in a market and learn from the results could be done to study the behavior of the users. Results indicate that prices are strongly affected by single users, justifying that some additional economic conditions should be considered. In addition, the model has been applied in a real university campus where the local market price drives the size of the DER elements required by each building, sets the economical interaction among them, and incentivizes energy efficiency behaviors in each of them.
Modeling Tools for Planning and Operation of DERs and their Impact in Microgrids and Centralized Resources. 119
A creation needs not only subjectivity,
but also objectivity.
Stephen Chow
The tool developed in previous chapters has been extended to support the analysis of DERs’ integration in bulk power system. Deployment of DERs is already a reality for electricity supply in many places, and a debate is currently taking place on whether DG is going to replace almost totally or partially the current centralized generation paradigm. Since the regulatory framework plays a major role in DERs’ deployment decisions, it is still not clear enough whether distributed resources are actually a better approach for electricity supply or such deployment is driven by misguided regulatory designs. This chapter aims at contributing to that debate. Firstly, the advantages of both paradigms are reviewed and the stranded costs recovery of the existing centralized system is discussed. Secondly, an optimization model is formulated to specifically address the discussion comparing both configuration paradigms. The main factors affecting the debate are identified and represented in the model: investment and operation costs of both centralized and DER resources, flexibility system requirements, demand response capabilities, building thermal demands, network investments and losses, and network access-fee design, among others. Thirdly, a realistic case study, based on Spain, is presented and some qualitative conclusions extracted like that ESs reduce whereas the PVs increase the need of faster technologies such as CCGT. Such kind of model is useful to undertake country specific studies either to perform sensitivity analyses revealing the relevance of the factors involved and the direct and indirect relationships among technologies, or to analyze which happens to be the more efficient system configuration and align regulatory decisions towards it.
Chapter 5. Integration of DERs in power systems.
120 Francisco Martín Martínez
5.1 Introduction
Electric power systems have been historically developed all around the globe according to a common structure and configuration: large plants located near places with easy access to primary energy resources and connected to a high-voltage meshed transmission network where substations feed radial distribution networks to reach lower voltages in order to get all final consumers. There are many factors that explain the success, until nowadays, of this centralized or traditional configuration or paradigm:
Economies of scale in generation facilities: The bigger the size of the generation facility, the lower the average cost (€/MW) of building it. In other words the marginal investment cost (€/ΔMW) is lower than the average investment cost (€/MW).
Technical viability and economic affordability of transporting large amounts of energy over long distances: Voltage level transformation using AC currents enabled raising the voltage to values high enough to reach affordable energy transmission costs.
Enhanced reliability: The inability of storing electricity requires back-up generation plants to face events such as units’ unavailability due to failures or maintenance programs, or large unexpected changes in demand. The larger is the connected system, the cheaper it is to invest on large generation facilities to be shared as back-up for the whole system in order to reach the targeted levels of reliability in the supply of electricity.
However, this traditional paradigm has been perturbed by the income of DER such as Distributed Generation (DG), Energy Storage (ES) or Demand Response (DR) along with the massive deployment of Information and Communication Technologies (ICT) into distribution electricity networks. DG began to be developed due to the strong engagement of many governments with renewable technologies, including cogeneration, to fight against climate change and meet international commitments. Renewables have also been developed at the level of large production fields connected to high voltage networks according to the traditional system settings. Wind and photovoltaic have taken advantage of their characteristic to be deployed in small-scale such as roof-tops PV panels and small domestic wind generators.
In fact, DERs allow a massive participation of players in the market with more distributed investments and more varied business models, where end-users leave their passive role towards a more active role (consumption and generation sides) becoming a new figure called prosumers. It implies a dramatic change in the traditional paradigm. Consumers, often managed by local providers or aggregators to reach a relevant enough size, can now decide issues such as installing generators for self-consumption purposes, storing energy or dumping it to the network at the most favorable time, managing their load profiles (DR) to reduce their energy purchasing costs, or even participating in ancillary services such as frequency regulation, reserves or control voltages.
To achieve it, technical and regulatory changes are needed. From the technical point of view, distribution networks should evolve towards more monitored, controllable and manageable networks with the protection systems designed to cope with downstream and upstream flows, that supposes a new distribution network concept that is often referred to
5.1. Introduction
Modeling Tools for Planning and Operation of DERs and their Impact in Microgrids and Centralized Resources. 121
as Smart Grid. From the regulatory point of view, several topics closely related to the deployment of DERs, such as the design of network access fees, the role of DSOs, TSO-DSO relationships, self-consumption rules and new market designs are currently being developed and discussed. For its relevance for the objective of the chapter the network access fee will be briefly discussed below.
In addition, DERs’ deployment in distribution networks is causing the appearance and development of new business models and new distributed systems whose objective is to improve the efficiency and engage end-users reducing their costs. As reviewed in chapter 2 they range from the Microgrid (MGs, microgenerators, storage devices and loads, geographically close together, prepared to be operated either connected or isolated from the grid [1]) or the Virtual Power Plant concept (VPPs, a set of aggregated DG, ES and load facilities, not necessarily geographically grouped together, managed as a single unit to interact with the market and system operators [2]) to the simple aggregation of dispersed loads and the management of electric vehicle fleets.
In view of these changes, the configuration of power systems is moving towards more distributed schemes. The faster deployment of DER is due to not only the advantages respect traditional schemes, but also the regulation developed during last years. Several articles and reports have discussed the technical advantages and economic benefits of this new distributed paradigm. For instance, [164] provides excellent insights to this discussion. Some of the main ones are:
DER enhances system resilience and supply reliability by reducing the dependence on the distribution network availability.
DER reduces transmission and distribution network investments needs.
DER reduces the large amounts of transmission network losses [194]
DERs’ aggregation could be used to provide ancillary services such as voltage support [195,196] or even to avoid overloads in networks to defer some investments in distribution networks [194,197].
DERs’ aggregation facilitates fulfilling market commitments since their global operation allows reallocating these commitments in case of individual failure [198].
The economic investment is diluted among several small agents making an active participation of end-users possible. Each agent can take a decision and choose a technology.
Deployment of DERs and renewable energy resources has significant positive environmental impacts such as the reduction of greenhouse gases, the higher energy efficiencies since some DERs can produce heat and electricity at the same time, the reduced damages on human health since they reduce the emission of pollutants and mitigate therefore climate change effects and additional usages of natural resources, if they are compared with thermal plants [158,199].
The fast deployment of DERs in many countries may seem to indicate that those advantages could overcome those of the centralized configuration paradigm, and that the change of paradigm is unstoppable. However, a closer look reveals that the regulation framework may be playing, indeed, a crucial role [200,201]. For instance, the way network access fees are regulated concerning self-consumers is a major issue. Usually, network
Chapter 5. Integration of DERs in power systems.
122 Francisco Martín Martínez
access fees applied to end-users in liberalized electricity systems aim at recovering all kind of regulated system costs such as the cost of the transmission and distribution networks, the cost of the system operator, and other costs related to policy-driven decisions, for instance, the cost associated to RES supporting mechanisms. They could be considered as stranded costs for the system since they are fully regulated and will require being recovered anyway in the future, regardless the tariff design adopted. The final format of the network access-fee is usually a mix of energy based (€/kWh) and power based (€/kW) tariff. A debate is open regarding the application of network access-tariffs to self-consumers and several options are being studied:
Network access fees are applied on the net consumption of power and energy, once self-consumption has been discounted. The network access-fee of the rest of consumers, those that are not self-consuming, should then be increased to recover the missing incomes, uncollected because of the net metering applied to the self-consumption ones. This option leads to what [118] labels as a “death spiral” for utility businesses. Indeed, larger access-fees will make more attractive becoming a self-consumer, which in turn will further increase the network access-fee to the non self-consumers, entering in a not-ended spiral. This regulated tariff design is therefore fostering the deployment of DERs regardless the fact if it is really an efficient solution for society.
Network access fees are applied on the net consumption of power and energy, but the incomes uncollected due to the effect of self-consumption are assumed by the state budget and are not charged to consumers who remain in the centralized system. The arguments supporting this option are that many of those regulated charges included in the network access fee obey to social policies or to energy policies that should concern all sectors of energy consumption and not exclusively the electricity one, such as for example the cost of RES supporting mechanisms in order to reduce greenhouse gases emissions.
Network access fees are applied on the total consumption of power and energy, regardless of the self-consumption. This approach guarantees a balanced distribution of the mentioned stranded costs among all end-users.
Therefore, DERs’ development and deployment in each country cannot be explained without taking into account the country regulation framework [200]. In some countries, DG has been encouraged using profitable remuneration schemes. Three types of currently applied tariff designs have been identified in [201] for that purpose Feed-in tariff, net-metering, and market-approaches.
All these discussions should be addressed if we seek for a 100% renewable energy based scenario such as the one presented by Fraunhofer in [151]. Furthermore, the Energy Performance of Buildings Directive (ED 2010/31/EU) [152,153] requests new buildings to comply with a low energy consumption level since 2020, which will require the larger part of their demand being supplied by distributed renewable sources.
Because of the considerable impact of the regulation adopted in each country, it is difficult to determine if the development of the DG is actually due to pure efficiency (generation closer to consumption) criteria, making it more attractive than the alternative development of the traditional centralized generation, or whether it is the result of the incentives implemented by regulation, would they be economically sounded or not. It
5.2. Factors considered in the model.
Modeling Tools for Planning and Operation of DERs and their Impact in Microgrids and Centralized Resources. 123
would be wise questioning (at least from the perspective of the regulator) if the above cited advantages of DERs overcome the economic and efficiency advantages of centralized generation (like economies of scale, easiest monitoring and controlling of few large production plants compared to a myriad of small production facilities, etc) or if their current deployment obeys exclusively to a favorable adopted regulation.
As reviewed in chapter 2, there are still no studies or models in the literature aimed at analyzing the efficiency of both schemes, centralized versus decentralized, from the point of view of the system, including thermal and electric synergies, and not just from the distribution network perspective. This chapter tries to make contribute to the discussion of DERs’ integration from a system wide perspective. Are any of both paradigms economically more appealing? Is the optimal one a mix of both schemes? Which are the more relevant and sensitive factors that may affect the balance among both paradigms? What is the impact of access-tariff designs or network losses in the mix? What is the impact of DG and ES investment costs? Does the possibility of supplying household thermal needs with electricity DER devices have any impact? Can DR skills affect the optimal mix?
Final conclusions on these issues will surely require a large set of studies and developments that overcome the scope of this dissertation. But this thesis aims at contributing to this discussion mainly in two ways. Firstly, it presents a detail formulation of a model oriented to study the optimal mix of centralized generation and distributed one in an environment in which consumers can choose to invest in DER or not using the models presented in chapter 3 and 4. The model does consider the main factors that have been identified as the more critical ones to properly address the problem. The model has explicitly been developed ignoring regulatory constraints (regulatory unbiased) to focus on the efficiency analysis per se. However, as an exception, given its relevance in the discussion, the model does consider, as an option, the impact of the access-fee design in the solution. Such a model is a basic milestone to conduct studies and sensitivity analysis able to contribute to the discussion.
Secondly, the chapter presents and analyses the results of applying such a model to a realistic case study, the Spanish case. Although quantitative results are presented, the effort has been place in obtaining qualitative conclusions on the relevance of the factors considered and on the behavior and interrelationships between the different technologies involved in the problem. Refinements in some of the input data parameters used in the model, out of the scope of this thesis, would be required before extracting conclusive quantitative indications from the study. Conclusions drawn depend on the particular system being studied.
The structure of this chapter is as follows. First, section 5.2 introduces the factors that have been considered in the model due to their relevance for this analysis. Then, Section 5.3 describes the optimization model and its full mathematical formulation. Later, Section 5.4 presents the case studies conducted (data used and scenarios analyzed), and the results for each one them. Finally, Section 5.5 analyses the concluding remarks.
Chapter 5. Integration of DERs in power systems.
124 Francisco Martín Martínez
5.2 Factors considered in the model.
Numberless possible factors should be considered to properly address the discussion between the centralized versus distributed configuration alternatives. The model presented in this chapter has focused on those that have been identified in this dissertation as the more potentially relevant ones. Assessing their impact on the solution is precisely one of the roles of using the model. The list below explains each of the considered factors. The approach used to model some of them has been simplified and summarized in the form of an input data parameter. The detail modeling of such factors is the result of complex models themselves, and could not therefore be included per se in this model. System dependent studies beyond the scope of this dissertation are required to properly fill this input data. Reasonable approximated data have been used in the Spanish case study presented later. Further steps in the work presented in this chapter will focus on improving the modeling of such factors and identifying and modeling additional factors that may play a role in the discussion addressed in this chapter.
Investment and maintenance costs of Centralized generation and DERs. Annualized investment costs of centralized generation are considered according to a technology cost, a weighted average cost of capital (WACC) and their lifespan, provided as input data together with the upfront investment cost of each technology. Some technologies have shown a fast decrease in their actual investment cost as for instance, solar panels, with more than a 50% decrease in investment costs in the last ten years [202]. The uncertainty on future investment costs of such kinds of technologies would require running the model with different combinations of investment costs to identify thresholds of profitability for some technologies.
Centralized production behavior. Regarding the operation of thermal centralized power plants, units are aggregated by technologies, and their generation dispatch is based on a production cost minimization. Each technology is represented by an installed capacity (MW), a production cost (€/MWh) and the capability to modify its output in time (CAPCHANGE parameter). Wind and solar production, and hydro production, either centralized or distributed, will depend respectively on weather forecasts and hydro inflows per period, provided as input data to the model.
Transmission losses. They are simplified using an average percentage over the total energy production in each period. A detail modeling of losses requires running load flow models. For the Spanish case study presented in the below section, this percentage is around 10% [203].
Reinforcement costs in transmission lines. Installing new centralized generation plants to meet load increases may require reinforcing the transmission and distribution networks. This cost is modeled in a simple way as an extra cost proportional to the amount of centralized generation investment costs decided by the model. This factor is an input data for the model and should be computed from specific network expansion tools in each country considered. Instead, adopting DG is supposed to have a lower reinforcement cost of the distribution network. In the Spanish study case, the distribution reinforcement costs have
5.2. Factors considered in the model.
Modeling Tools for Planning and Operation of DERs and their Impact in Microgrids and Centralized Resources. 125
been neglected which is reasonable assumption for a low to mid penetration of DG.
Electrical demands and shifting availability. For demand purposes, several sectors are considered, namely, residential, commercial and industrial consumers [31]. Each type of consumer is able to modify its consumption profile up to a certain percentage, shifting load, looking for lower energy prices. For the Spanish case study the percentages adopted for the energy that could be shifted are 10% for residential consumers [30], and 20% for industries (although actually some can reach higher values since they are allowed to include up to 40% of their load in DR programs [82]).
Thermal demand of residential consumers. This is a critical factor to be considered since, for instance, it represents above 60% of the total energy consumption of houses in Spain [30]. As far as thermal needs can be supplied by heat pumps, their modeling may be of paramount importance for the discussion since a coordinated optimization of the electricity and thermal needs may change the decision of an end-user to become or not prosumer.
Energy Storages. These devices allow consuming energy that has been previously stored in a different period. It allows decoupling generation and demand needs. For instance they provide the possibility to store the energy generated from renewable sources to be used either by heat pumps whenever needed, substituting classical gas boilers, or by electricity loads in more profitable hours.
Impact of considering or not the stranded costs of the system in the access-fee. As an option, the model may consider the existence of a given stranded-cost amount to be recovered throughout an access-fee applied to the power contracted and the energy consumed [204,205]. Three typical ways of recovering these costs (power based, volumetric based or hybrid based tariffs) are reviewed in [201]. In this case, whenever this option is activated, the access fee applied to the net contracted power (peak of consumption of each agent, ePeaki variable) and to the net energy consumed would be computed to recover the total amount of stranded cost considered. For doing so, an iterative call to the model is performed. The access-fee is updated to match the stranded costs to be recovered in each iteration loop. For each new value of the access-fee the decisions of the agents to resort on DER to self-consume part of its consumption will change. The iteration process is done until the total amount of power contracted (TOTALPEAK parameter) and energy bought (TOTALENERGY parameter) among agents reach stable values among iterations. Design of tariffs for distributed generators is out of the scope of this dissertation, but future research could use this model for those purposes.
System requirements. The model considers some technical requirements to be met in order to guarantee the stability and the correct operation of the system (behavior of the TSO). For instance, a minimum quantity of spinning reserves is considered in order to balance the system. This is done in two ways: uncertainties of solar and wind generation (Ur parameter) are represented and it is considered that the installation of any generation plant requires at least an additional percentage of faster technologies such as coal or CCGT (SPEED parameter) to be in place. Some ad-hoc models, out of the scope of the thesis,
Chapter 5. Integration of DERs in power systems.
126 Francisco Martín Martínez
should carried out to determine for instance what are the levels of reserves required when other technologies are installed, SPEED, and introduced .
In this chapter, the values of these parameters have been approximated for the Spanish case study, looking for a first set of qualitative results. Although quantitative results are provided, quantitative remarks are not provided since a set of more elaborated specific studies will be required to feed the model with more refined input data.
5.3 Modeling the Power System
There are some models described in [164] which try to study the operation of centralized and decentralized resources. Some of them are focused on transmission networks and settling the centralized dispatch as the Reliability and Operational Model (ROM), which computes the dispatch of energy resources considering transmission and distribution networks, or the Optimal Electricity Generation Expansion (GenX), which represents the expansion of generation capacity while distinguishing between distributed and centralized resources.
Some institutions are developing models for assessing the DERs’ deployment in systems. For instance, the National Renewable Energy Laboratory (NREL) has developed two models [206] (dGen, which analyzes the deployment of solar and wind technologies in distribution networks, and ReEDS, which is a capacity-expansion model for generation and infrastructures) that is going to combine in a third model to analyze the impact of DERs in the United States. Some institutions such as The Imperial College have developed a study of the integration of renewable energy in Europe between 2020 and 2030 where DR stands out as particularly promising to increase annual savings [207]. In this study, generic distribution systems are used for modeling DG whose capacities are introduced as an input.
Some models have been selected in Table 31 to clearly highlight the main differences between the models of this thesis and the existing ones. There are some models such as the Reference Network Model [208] which uses information from centralized resources, DERs and aggregated demands to optimize the deployment of the Network. Other modes such as the ROM model use the data of the network and the aggregated demand to set the economical dispatch of centralized resources. Then, the studies which are focused on DERs are also focused on distribution networks without taking into account centralized resources. For instance, some of them (DPG.sim [161]) use DERs to study their operation and their impact on specific network topologies. Finally, those studies which are focused on the optimization and the investment of DERs usually do not take into account the network, but they include the thermal demands, as reviewed in chapter 3.
In our case, the contribution is focused on the importance given to the detailed representation of the thermal (integrating a heating model) and the electrical demand. All previously cited models which study centralized resources represent the electrical demand as a single aggregated value per node and use DERs as input parameters. On the other hand, those models which study DERs’ deployment include thermal demands but they do not consider the centralized resources.
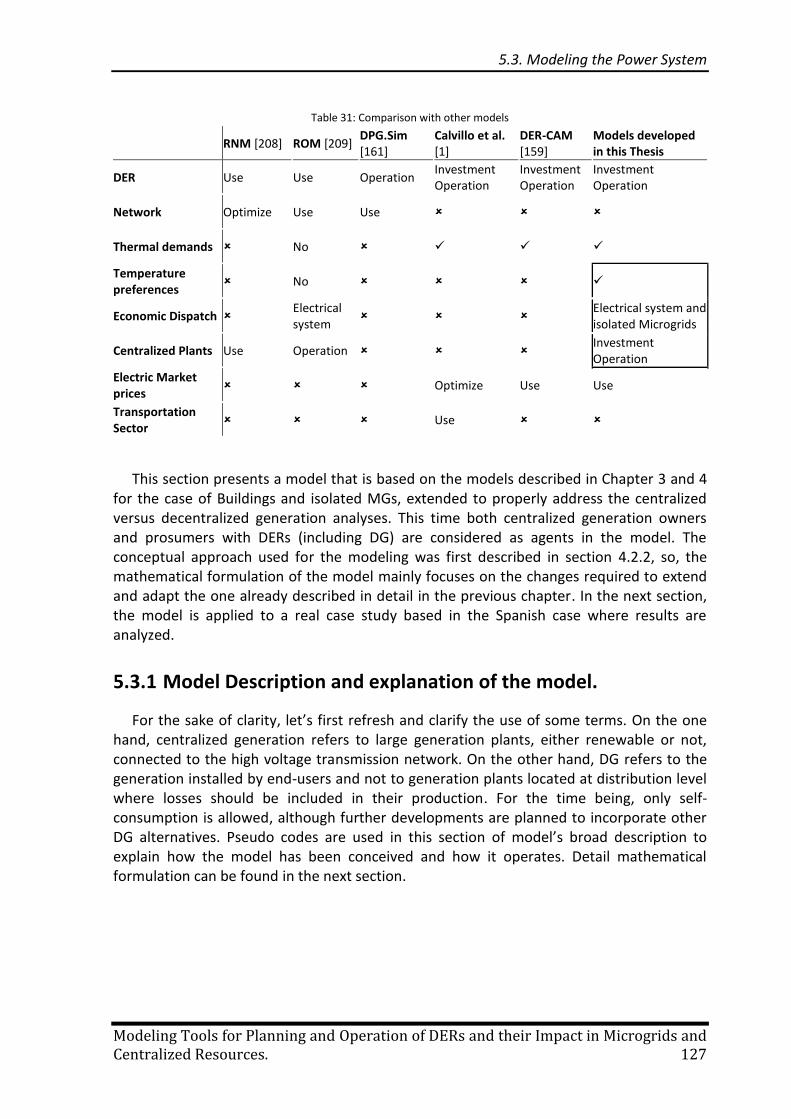
5.3. Modeling the Power System
Modeling Tools for Planning and Operation of DERs and their Impact in Microgrids and Centralized Resources. 127
Table 31: Comparison with other models
RNM [208] ROM [209]
DPG.Sim [161]
Calvillo et al. [1]
DER-CAM [159]
Models developed in this Thesis
DER Use Use Operation Investment Operation
Investment Operation
Investment Operation
Network Optimize Use Use
Thermal demands No
Temperature preferences
No
Economic Dispatch Electrical system
Electrical system and isolated Microgrids
Centralized Plants Use Operation Investment Operation
Electric Market prices
Optimize Use Use
Transportation Sector
Use
This section presents a model that is based on the models described in Chapter 3 and 4 for the case of Buildings and isolated MGs, extended to properly address the centralized versus decentralized generation analyses. This time both centralized generation owners and prosumers with DERs (including DG) are considered as agents in the model. The conceptual approach used for the modeling was first described in section 4.2.2, so, the mathematical formulation of the model mainly focuses on the changes required to extend and adapt the one already described in detail in the previous chapter. In the next section, the model is applied to a real case study based in the Spanish case where results are analyzed.
5.3.1 Model Description and explanation of the model.
For the sake of clarity, let’s first refresh and clarify the use of some terms. On the one hand, centralized generation refers to large generation plants, either renewable or not, connected to the high voltage transmission network. On the other hand, DG refers to the generation installed by end-users and not to generation plants located at distribution level where losses should be included in their production. For the time being, only self-consumption is allowed, although further developments are planned to incorporate other DG alternatives. Pseudo codes are used in this section of model’s broad description to explain how the model has been conceived and how it operates. Detail mathematical formulation can be found in the next section.
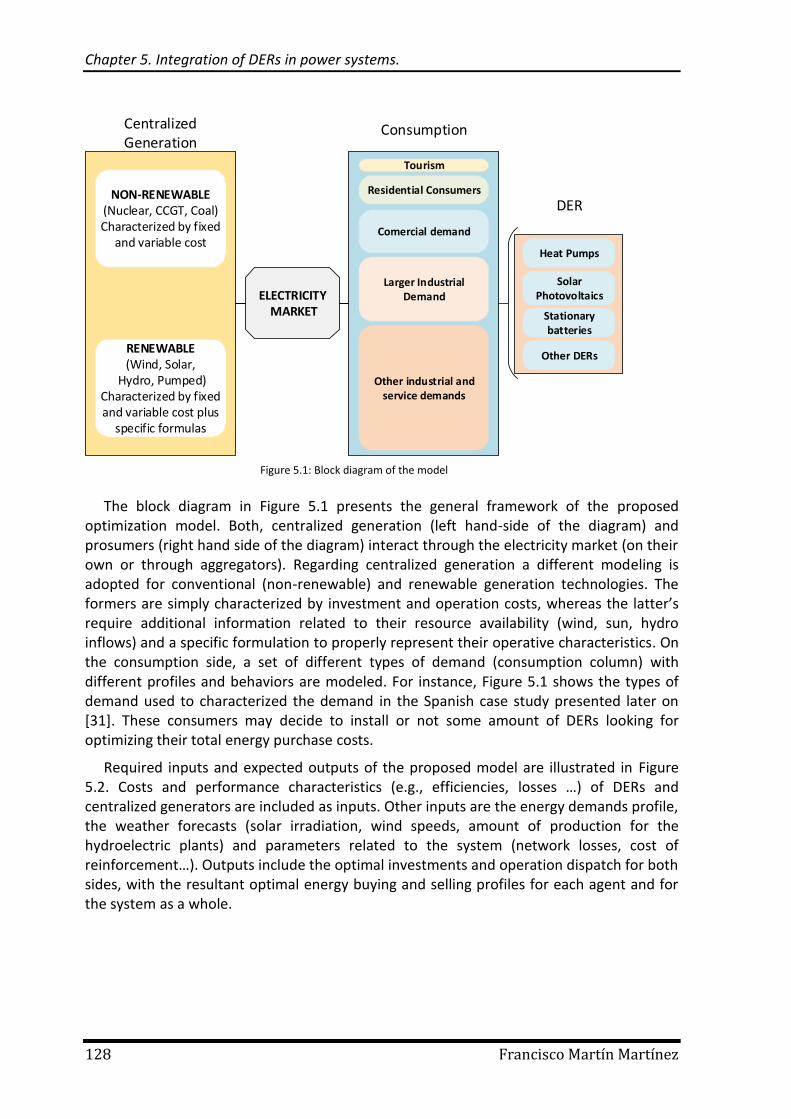
Chapter 5. Integration of DERs in power systems.
128 Francisco Martín Martínez
The block diagram in Figure 5.1 presents the general framework of the proposed optimization model. Both, centralized generation (left hand-side of the diagram) and prosumers (right hand side of the diagram) interact through the electricity market (on their own or through aggregators). Regarding centralized generation a different modeling is adopted for conventional (non-renewable) and renewable generation technologies. The formers are simply characterized by investment and operation costs, whereas the latter’s require additional information related to their resource availability (wind, sun, hydro inflows) and a specific formulation to properly represent their operative characteristics. On the consumption side, a set of different types of demand (consumption column) with different profiles and behaviors are modeled. For instance, Figure 5.1 shows the types of demand used to characterized the demand in the Spanish case study presented later on [31]. These consumers may decide to install or not some amount of DERs looking for optimizing their total energy purchase costs.
Required inputs and expected outputs of the proposed model are illustrated in Figure 5.2. Costs and performance characteristics (e.g., efficiencies, losses …) of DERs and centralized generators are included as inputs. Other inputs are the energy demands profile, the weather forecasts (solar irradiation, wind speeds, amount of production for the hydroelectric plants) and parameters related to the system (network losses, cost of reinforcement…). Outputs include the optimal investments and operation dispatch for both sides, with the resultant optimal energy buying and selling profiles for each agent and for the system as a whole.
Residential Consumers
Comercial demand
Larger Industrial Demand
RENEWABLE (Wind, Solar,
Hydro, Pumped)Characterized by fixed and variable cost plus
specific formulas
NON-RENEWABLE(Nuclear, CCGT, Coal)Characterized by fixed
and variable cost
Other industrial and service demands
ELECTRICITY MARKET
Tourism
SolarPhotovoltaics
Heat Pumps
Stationarybatteries
Other DERs
Centralized Generation
Consumption
DER
Figure 5.1: Block diagram of the model
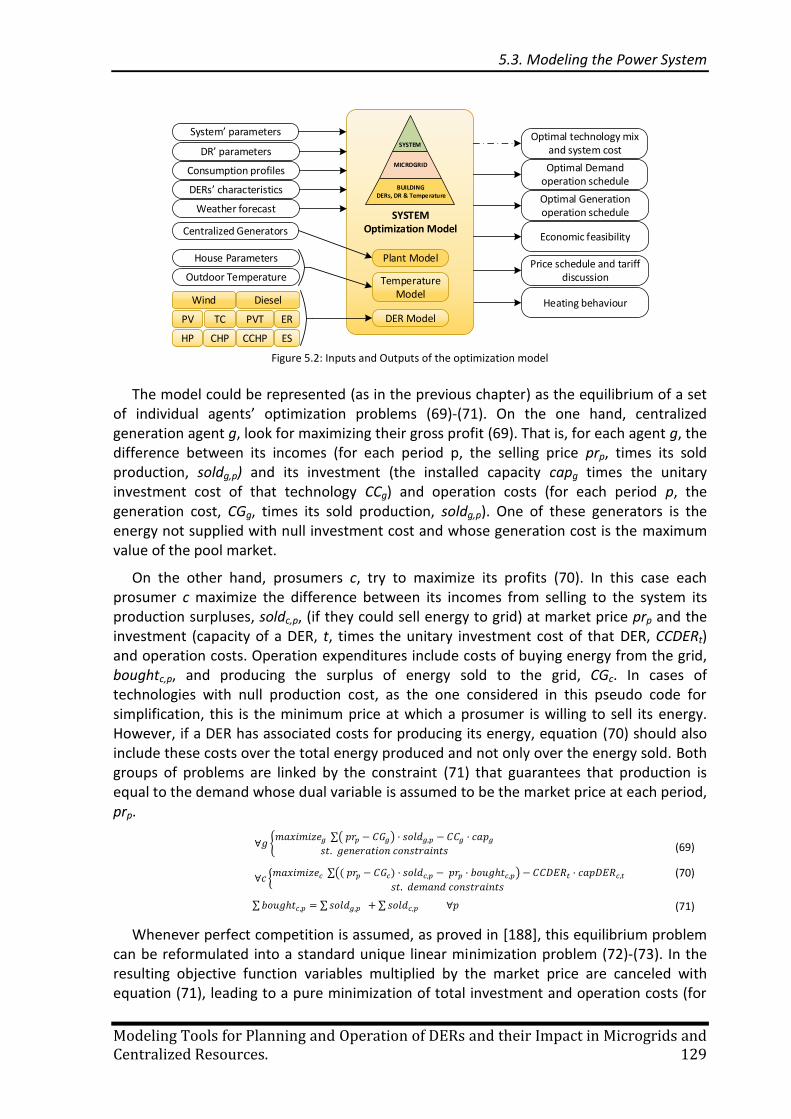
5.3. Modeling the Power System
Modeling Tools for Planning and Operation of DERs and their Impact in Microgrids and Centralized Resources. 129
The model could be represented (as in the previous chapter) as the equilibrium of a set of individual agents’ optimization problems (69)-(71). On the one hand, centralized generation agent g, look for maximizing their gross profit (69). That is, for each agent g, the difference between its incomes (for each period p, the selling price prp, times its sold production, soldg,p) and its investment (the installed capacity capg times the unitary investment cost of that technology CCg) and operation costs (for each period p, the generation cost, CGg, times its sold production, soldg,p). One of these generators is the energy not supplied with null investment cost and whose generation cost is the maximum value of the pool market.
On the other hand, prosumers c, try to maximize its profits (70). In this case each prosumer c maximize the difference between its incomes from selling to the system its production surpluses, soldc,p, (if they could sell energy to grid) at market price prp and the investment (capacity of a DER, t, times the unitary investment cost of that DER, CCDERt) and operation costs. Operation expenditures include costs of buying energy from the grid, boughtc,p, and producing the surplus of energy sold to the grid, CGc. In cases of technologies with null production cost, as the one considered in this pseudo code for simplification, this is the minimum price at which a prosumer is willing to sell its energy. However, if a DER has associated costs for producing its energy, equation (70) should also include these costs over the total energy produced and not only over the energy sold. Both groups of problems are linked by the constraint (71) that guarantees that production is equal to the demand whose dual variable is assumed to be the market price at each period, prp.
{ ∑( )
(69)
{ ∑(( ) )
(70)
∑ ∑ ∑ (71)
Whenever perfect competition is assumed, as proved in [188], this equilibrium problem can be reformulated into a standard unique linear minimization problem (72)-(73). In the resulting objective function variables multiplied by the market price are canceled with equation (71), leading to a pure minimization of total investment and operation costs (for
Heating behaviour
DR’ parameters
Consumption profiles
DERs’ characteristics
Weather forecastSYSTEM
Optimization Model
DER Model
Economic feasibility
Optimal Demandoperation schedule
Optimal technology mix and system cost
Temperature Model
House Parameters
Outdoor Temperature
Plant Model
Centralized Generators
Price schedule and tariff discussion
System’ parameters
Optimal Generationoperation schedule
SYSTEM
MICROGRID
BUILDING DERs, DR & Temperature
PV
Wind Diesel
TC
HP CHP CCHP ES
ERPVT
Figure 5.2: Inputs and Outputs of the optimization model
Chapter 5. Integration of DERs in power systems.
130 Francisco Martín Martínez
both centralized and DG facilities) to supply the demand (72). The existence of an optimal solution is also guaranteed. This is the proposed model adopted and developed in this chapter as a Mix Integer Programming problem.
∑( )
∑( )
(72)
∑ ∑ ∑ (73)
As mentioned previously, the model has been extended to consider several different regulatory factors that may affect DERs’ deployment. The main one is the possibility to consider a mandatory recovery of system’s stranded costs (typically regulatory costs or policy driven related costs) through the network access-tariff. In that case, any consumer connected to the grid is charged with an access-tariff devoted to recover a given amount (input data) of annual stranded costs. For the sake of completeness, the access fee is assumed to be applied part as a volumetric tariff EF (€/kWh, applied to the energy actually purchased from the grid, boughtc,p) and part as a power based tariff PF (€/kW, applied to the power actually contracted to the grid, poweri). As a simplification, when network access tariffs are considered, end users cannot sell their surplus of energy being the energy purchased from the grid, boughtc,p, equal to the net energy exchanged with the grid. The contracted power is assumed to be the maximum hourly purchased demand at any period p. EF and PF are designed to recover each one a given amount of stranded costs (input data), respectively EnergyCosts and PowerCosts (so that the sum of both adds for the total stranded costs to be recovered). Thus EF=EnergyCosts/∑boughtc,p and PF=PowerCosts/∑poweri. Then, when tariffs are considered equation (72) becomes (74):
∑( )
∑( )
(74)
Problem (74) leads now to a non-linear problem since EF and PF values depend on variables boughtc,p and poweri. To cope with it, the problem is solved using an iterative procedure in which the values for the two components of the access tariff EF and PF are calculated using values of boughtc,p and poweri from the previous iterative loop and updated at each iteration. The iterative process is performed until the total amount of power contracted and energy bought in the demand side remain constant among two consecutive iterations (“the process converges”).
This formulation allows to analyze, for instance, the so called “death spiral” effect, when consumers remaining connected to the grid are progressively charged more and more to recover stranded costs as self-consumption of other agents increases. When this “death spiral” is included, the model is unstable as highlighted in the review done in section 2.6. Indeed, self-consumption becomes more and more attractive as network access tariff raise, leading to the disconnection of all consumers from the grid. However, the following facts contribute making the process actually to converge to an intermediate solution:
Not all end-users can install DERs: actually, the option is realistic since not all buildings already in place could install DERs due to their location or design.
5.3. Modeling the Power System
Modeling Tools for Planning and Operation of DERs and their Impact in Microgrids and Centralized Resources. 131
Operation costs vs. stranded costs: if the amount of stranded costs charged to a particular prosumer is lower than that of operating and investing on an amount of DERs large enough as to ensure meeting its own demand under any possible scenario (relatively long period without sun or wind, adverse weather, etc.), it is not clear the prosumer decide to disconnect permanently from the grid.
Different demand day’s profiles: very different representative days with different
weather conditions, costs or demand profiles, should be considered to properly
address the problem. Prosumers’ investment in DERs to face some of these less
probable demand scenarios may not be worthwhile compared to the alternative of
purchasing the required energy from the grid.
Limits in production changes of central generators: since centralized generation technologies are represented in an aggregated way, unit commitment related costs and constraints are ignored (as for instance the startup costs or the minimum load restrictions) except the ramping one. Changes in production outputs of centralized generation units are limited from one period to the following one forcing to install different set of technologies. If a technology is installed, their operation will be determined by its installed capacity.
Constraints of system stability performance: as explained in more detail below, the model is prepared to impose a percentage of total installed generation capacity to be met with a given subset of generation technologies that are considered to be more appropriate to ensure stability performances and/or to provide enough production flexibility as to cope with the sharp changes in the production of non-controllable renewable generation facilities. Whenever these constraints are activated they will force to install those kinds of technologies which will make unprofitable installing others.
The detailed description of the mathematical model, the parameters used in this study and their value can be found in the following sections.
5.3.2 Mathematical formulation
The formulation of the model and main equations are described below as well as parameters and indices used.
Sets
i Agents: {Nuclear, Coal, CCGT, Wind, Solar, Hydro, Pumped, Consumers}
bu i Buyers: {Pumped, Consumers}
c bu Consumers
se i Sellers: {Nuclear, Coal, CCGT, Wind, Solar, Hydro, Pumped}
f se Fast controllable technologies: {Coal, CCGT}
hy se Hydro-electric agents: {Hydro}
n se Non-renewable technologies: {Nuclear, Coal, CCGT}
p se,bu Pumped technology agents: {Pumped}
r se Renewable agents with uncertainty: {Solar, Wind}
s r,se Solar agents
Chapter 5. Integration of DERs in power systems.
132 Francisco Martín Martínez
w r,se Wind agents
tder Include DERS: {PV, HP, ES, TC, ER,CHP,CHILLER, DIESEL, GAS, WIND}
m “Interday” index which added up represents a year. Typically, months.
h “Intraday” index which represents intervals within a day. Typically, hours.
Parameters
A Slope of the rotor power approximation for wind plants B Second term of the rotor power approximation for wind plants BOILERCOST Price of an individual boiler (€) BOILEREFF Boiler efficiency ratio (%) C Thermal building wall equivalent capacitor (kWh/ ºC) CAPACITYse Total capacity installed for agent se (MW) CAPCHANGEse Capacity of change of energyProduced per each MW installed (%) COP Coefficient of performance HP for heating (-) COPAC Coefficient of performance HP for air-conditioning (-) DEMANDEc,m,h Base electric demand curve for 12 representative days (MWh) DEMANDTc,m Thermal demand (DHW) for 12 representative days (MWh) DEMSHIFTi Maximum allowed load to be shifted per day of the base electric demand (%) DERCAPc,tder Total capacity installed of tder (MW or MWh in the case of batteries)
DERCOSTtder Total cost per installed kilowatt of tder (€/MW or €/MWh in the case of batteries)
DNIm,h Direct normal irradiance at month m, hour h (W/m2)
EFFBAT Battery charge/discharge efficiency ratio (%)
EFFWIND Efficiency of wind plants taking into account energy losses of the blade and rotor, mechanical losses at the gear, and electromechanical loss at the generator. (-)
ENERGYCOSTS Annual fix part of system costs associated to the energy tariffs (€) GASCOST Thermal energy base buying price (€/MWh) HYDROAVAILABILITYm Energy of Hydroelectric plant available at month m (MWh/MW) INSTCOSTse Installed cost for the capacity of instCapacity (€/MW) LOSSESHP Total thermal losses in the HP system (%) LOSSESPV Total electrical losses in the PV system (%) M Sufficiently enough large number MAXTEMP Maximum reference of temperature (ºC) MINTEMP Minimum reference of temperature (ºC) MONTHDAYSm Number of days in month m NETWORKLOSSES Losses in transmission System (%) NUM Number of representative households
OMCOSTtder Maintenance cost per installed watt of tder (€/MW or €/MWh in the case of batteries)
OPERCOSTse Operation cost including maintenance and CO2 emissions costs for energySold (€/MWh)
OUTTEMPm,h Outdoor temperature at month m, hour h (ºC) PFLOW Reference for flow in a pumped plant (m
3/s)
PHEIGHT Reference for jump height in a pumped plant (m)
POWERCOSTS Annual fix part of system costs associated to the contracted power tariffs (€). This cost should take into account that demand is aggregated.
PPOWER Reference for power in a pumped plant (MW) PVOL Reference for storage volume in a pumped plant (hm
3)
PYELD Efficiency of pumped plant flows [-] REINFORCEMENT Reinforcement needed when centralized generation is installed (%) RUA Resistance of the overall heat transfer coefficient (ºC/kW) [22] SPEED Percentage of quick technologies needed to guarantee the service (%) TOTALENERGY Sum of energy bought, energyBought, among buyers in the previous iteration
5.3. Modeling the Power System
Modeling Tools for Planning and Operation of DERs and their Impact in Microgrids and Centralized Resources. 133
(MWh)
TOTALPEAK Sum of contracted powers, ePeak, among buyers in the previous iteration (MW)
Ur Uncertainty of renewable sources (%) WINDm,h Wind speed at month m, hour h (m/s)
Positive variables
chargec,m,h Energy charged to the battery of agent c at hour h (MWh) coolHPc,m,h Electricity for cooling in agent c at hour h (MWh) costs Total Costs in the system (€) decDemc,m,h Decrease in the demand of agent c at hour h (MWh) dischargec,m,h Energy discharged from battery of agent c at hour h (MWh) energyBoughtbu,m,h Electricity bought by a buyer agent bu to meet the demand at hour h (MWh) energyDumpedc,m,h Electricity dumped from consumers with DERs (MWh) energyProduced se,m,h Energy produced by the seller at hour h (MWh) energyPumped p,m,h Energy Pumped by the pumped central p at hour h (MWh) energySoldse,m,h Electricity sold by a seller agent se at hour h (MWh)
energyTariffCosts Costs to recover part of the stranded cost of the system associated to the energy usage of the consumers (€)
ePeakc, Contracted annual electric power by agent c (MW) fixCosts Maintenance cost of installed DER (€) gasCosts Cost of gas(€) heatGasc,m,h Gas bought for heating in agent c at hour h (MWh) heatHPc,m,h Electricity for heating in agent c at hour h (MWh) incDemc,m,h Increase in the demand of agent c at hour h (MWh) indTempc,m,h Indoor temperature of agent c at hour h (ºC) installCosts Costs of installation (€)
instCapacityse Installed capacity of a centralized plant regarding the energyProduced per agent se (MW)
instDERc,tder Installed capacity of DER per agent c (MW or MWh in the case of batteries) newDemc,m,h New consumption curve after changing the profile (MWh) operationCosts Operation costs of generators including maintenance and CO2 emissions costs (€)
powerTariffCosts Costs to recover part of the stranded cost of the system associated to the contracted power of the consumers (€)
prodPVc,m,h Electricity produced by the distributed solar panel of agent c (MWh) qProduc p,m,h Water flow of the pumped plant p for production purposes (m
3/h)
qPumped p,m,h Water flow of the pumped plant p (m3/h)
reserv p,m,h Reservoir of the pumped plant p (hm3)
socc,m,h Battery State-Of-Charge of agent c at hour h (MWh) therGasc,m Gas bought for thermal demand in agent c at month m (MWh) therHPc,m,h Electricity for thermal demand in agent c at hour h (MWh)
Binary variable
gc Binary Variable to indicate that a Boiler need to be installed
Objective function
The proposed objective function minimizes the costs of the whole system; this is done taking into account the individual costs of the different agents in the objective function. Indeed, the objective function (75) is the sum of various elements. Installation costs (76) takes into account investment costs of centralized generation, including the percentage for the associated network reinforcements, and the investment cost of installation of DERs and gas boilers. In addition, DERs’ yearly maintenance costs are considered costs (77) as well as the operation cost of centralized generation plants, which also includes both maintenance
Chapter 5. Integration of DERs in power systems.
134 Francisco Martín Martínez
and CO2 emission costs (78). Finally, gas consumption costs for thermal purposes (79) are also included.
For those cases where stranded costs are considered and must be recovered through network access-fees, an additional term is added to the objective function to represent their impact on prosumers’ choice. Indeed, as explained earlier, the access tariff payments charged to agents are included in the objective function, calculated for each user as its net peak power and its total energy bought from the grid multiplied by the associated power and energy components of the access tariff recovered, (80) and (81). And these terms are computed as the total annual stranded costs to be recovered in the system, allocated separately into a power and energy component (POWERCOSTS and ENERGYCOSTS parameters), divided respectively by the total amount of power actually contracted (TOTALPEAK parameter) and the total annual energy actually bought (TOTALENERGY parameter) to the system. As mentioned, this option is solved using an iterative process in which the values for TOTALPEAK and TOTALENERGY are calculated in the previous iterative loop and updated at each iteration.
(75)
∑ ( ( ) ) ∑ (∑ )
(76)
∑ ( ) (77)
∑ ∑ (78)
∑ ( ∑
) (79)
∑
(80)
∑ ∑
(81)
Modeling system’s behavior constraints
No specific constraints have been imposed on the choice of the more efficient mix of technologies to meet the demand, except for the ones imposed by the TSO, for security purposes. A given percentage (SPEED parameter) of the total new centralized generation installed capacity (82) and a given percentage (Ur parameter) of the total new renewable generation installed capacity (83) force to install technologies flexible enough (CCGT and coal plants) to provide reserve and to respond to the uncertain and intermittent behavior of the renewable ones. These parameters will require ad-hoc models, out of the scope of this thesis, to obtain reliable values for these restrictive constraints. Constraint (84) stands for the hourly energy balance of the system taking into account the energy produced and sold by generators, the energy bought by end-users, and the network losses (NETWORKLOSSES parameter).
∑ ∑ (82)
∑ ∑ (83)
∑ ( ) ∑ (84)
5.3. Modeling the Power System
Modeling Tools for Planning and Operation of DERs and their Impact in Microgrids and Centralized Resources. 135
Modeling non-renewable plants
The energy produced by centralized plants at any time should be the one finally sold (85) and it could not exceed the whole installed capacity (86). Equation (85) is similar to the ones used to represent the energy exchanges in other technologies (88), (93) and (95). In addition, (87) limits changes in the energy produced for two consecutive periods (hours) according to the ramping capacities of each technology expressed as a percentage of the installed capacity of that technology (CAPCHANGE parameter for the ramp changes). This constraint is also applied later on to both classical (94) and pumped hydroelectric plants (103).
(85)
(86)
( ) | |
(87)
Modeling wind and solar energy
The energy produced by solar panels and wind turbines is obtained with formulas (89)-(91). Wind power can be calculated multiplying the total capacity by the efficiency and by a function of the power of the rotor [171]. Equation (89) uses a linear approximation of such expression, being parameter A the slope, parameter B the interception with Y axis, and WIND the variable representing the wind available at that time. Solar generation is detailed in (90) and (91) where DNI (direct normal irradiance), which is the energy provided by the sun at a specified location (W/m2), is multiplied by the losses produced in electronic components and divided by G, which is the global irradiation received on a horizontal plane (G=1000 W/m2). Then, this result is multiplied by the amount of solar installed capacity either centralized (90) or distributed (91).
(88)
( ) ( )
(89)
( ) ( )
(90)
( ) ( ) (91)
Modeling hydroelectric plants
Classical hydroelectric plants will produce according to the amount of power that the water in the hydro reservoir allows them (92). In our case study, this HYDROAVAILABILITYm is obtained from [210] as the power produced in an average day of a month divided by the current installed capacity of hydro plants. This approach does not consider that water can be stored.
( )
∑
(92)
(93)
Chapter 5. Integration of DERs in power systems.
136 Francisco Martín Martínez
( ) | |
(94)
Modeling pumped hydroelectric plants
The behavior of this technology is similar to a battery that charges and discharges a reservoir of water (101)-(102). The usual volume of the reservoir and the flows of water in a pumped hydroelectric plant have been divided by its usual capacity in order to represent the produced energy, the pumped energy and the water stored (99)-(100). Coefficients of 1000 in the equation obey to a unit transformation in order to reduce the numerical value of those variables and facilitate the solving of the optimization process. Equation (96) guarantees that the energy produced will be pumped during the same day (the model considers a representative day per month). This constraint is very restrictive since the usual will be to consider a week. Equations (97) and (98) relate the energy produced and pumped with the water fall and the water flows, being 9.8, the gravity value. Equation (102) represents the water balance in the reservoir, being 3.6, a coefficient to adjust the actual units used in the equation.
(95)
∑ ∑ (96)
(97)
(98)
( )
(99)
( )
(100)
(101)
(102)
( ) | |
(103)
Modeling electric constraint in consumers
The energy balance of consumers/prosumers including all their devices involved (for example: solar panels, batteries, heat pumps and loads consumption) is represented through constraint (104). This equation is similar to equation (29), but since here consumer represents several buildings, thermal consumption obtained from the temperature model are multiplied by the number of aggregated houses, NUM. Besides, constraint (105), similar to equation (30), identifies the peak of consumption for each agent, which will be used later for access-fees related issues.
5.4. Application of the model for analyzing technology impacts in the electric Spanish system.
Modeling Tools for Planning and Operation of DERs and their Impact in Microgrids and Centralized Resources. 137
( )
(104)
(105)
Upgrades heating related equations
For those consumers with smart temperature control behaviors, constraints (44)-(47) are included. For the others, a temperature behavior associated to thermal needs is included as previously done in section 3.2. However, since temperature model represents the behavior of a single house, this time the consumption should be multiplied by the number of aggregated house when it is aggregated to the rest of consumptions as in Equation (104).
Upgrades of the thermal modeling
Besides equations (22) and (23), this model uses a binary variable, gi, to determine whether or not a gas boiler will be installed (106).
(106)
Load-Shifting and other DERs modeling
The rest of equations are the ones listed in chapter 3 ((1)-(21),(25)-(24)) adapting the units.
5.4 Application of the model for analyzing technology impacts in the electric Spanish system.
The model has been applied to realistic case studies, based on the Spanish case (illustrated in Figure 5.3). Each centralized generation technology (Nuclear, Coal, Combined cycles…) whose data has been obtained from [211–213] is represented in an aggregated way and modeled as a separated agent in the model. In addition the energy not supplied (ENS) is modeled as an additional kind of generation technology (an additional agent) with no investment cost and whose operation cost is the energy price cap in the Spanish day-ahead electricity market pool. Demands in Spain have been classified as in [31] where electrical consumption profiles are described for five different categories (Tourism, Residential, Restaurants, Large Industrial and other industrial demands). Data for electrical profiles focus on residential demand, including thermal energy requirements, and a distinction of the demand profiles regarding the different weather climates is deeply studied in [30,31]. No thermal data have been found for the other sectors, but the possible electrification of some of them such as the steel industry could play a major role for analyzing future scenarios. In Figure 5.3, percentage values taken from [31] represent the weight of each clustered consumption over the total energy consumed in Spain (COUNTRYDEMAND) [210]. It has been considered in this case study that only residential
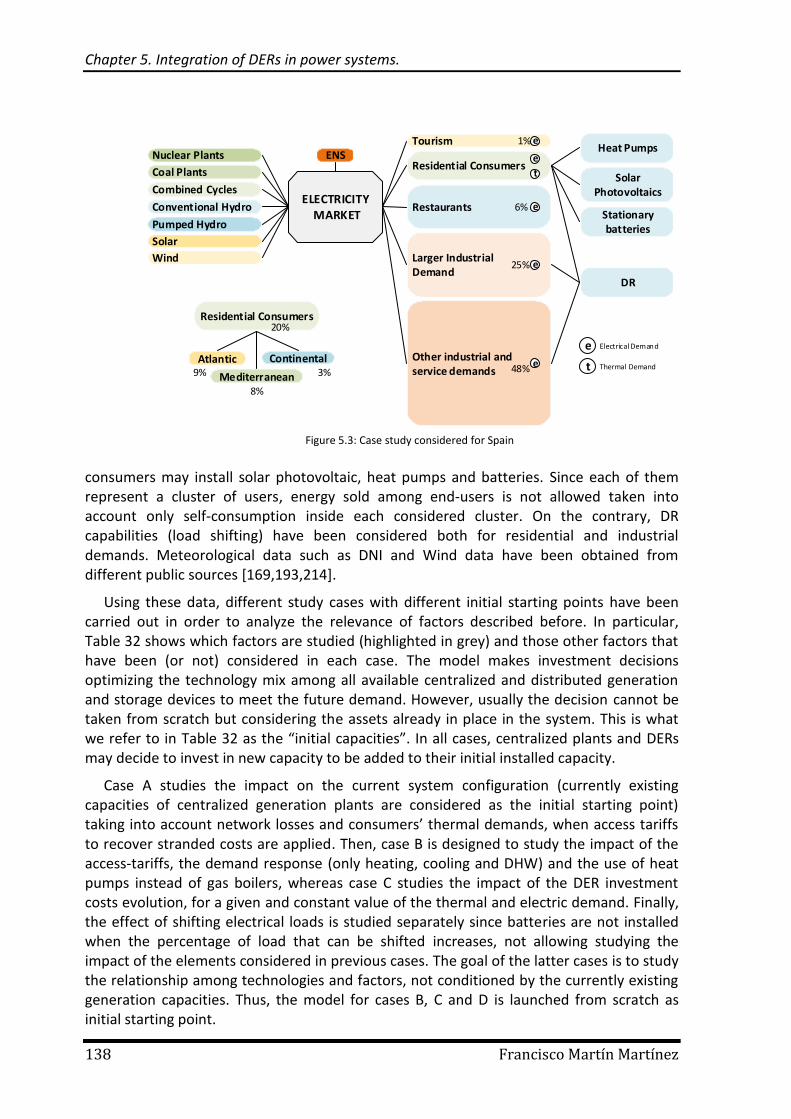
Chapter 5. Integration of DERs in power systems.
138 Francisco Martín Martínez
consumers may install solar photovoltaic, heat pumps and batteries. Since each of them represent a cluster of users, energy sold among end-users is not allowed taken into account only self-consumption inside each considered cluster. On the contrary, DR capabilities (load shifting) have been considered both for residential and industrial demands. Meteorological data such as DNI and Wind data have been obtained from different public sources [169,193,214].
Using these data, different study cases with different initial starting points have been carried out in order to analyze the relevance of factors described before. In particular, Table 32 shows which factors are studied (highlighted in grey) and those other factors that have been (or not) considered in each case. The model makes investment decisions optimizing the technology mix among all available centralized and distributed generation and storage devices to meet the future demand. However, usually the decision cannot be taken from scratch but considering the assets already in place in the system. This is what we refer to in Table 32 as the “initial capacities”. In all cases, centralized plants and DERs may decide to invest in new capacity to be added to their initial installed capacity.
Case A studies the impact on the current system configuration (currently existing capacities of centralized generation plants are considered as the initial starting point) taking into account network losses and consumers’ thermal demands, when access tariffs to recover stranded costs are applied. Then, case B is designed to study the impact of the access-tariffs, the demand response (only heating, cooling and DHW) and the use of heat pumps instead of gas boilers, whereas case C studies the impact of the DER investment costs evolution, for a given and constant value of the thermal and electric demand. Finally, the effect of shifting electrical loads is studied separately since batteries are not installed when the percentage of load that can be shifted increases, not allowing studying the impact of the elements considered in previous cases. The goal of the latter cases is to study the relationship among technologies and factors, not conditioned by the currently existing generation capacities. Thus, the model for cases B, C and D is launched from scratch as initial starting point.
Residential Consumers
Restaurants
Larger Industrial Demand
Other industrial and service demands
ELECTRICITY MARKET
Tourism
SolarPhotovoltaics
Heat Pumps
Stationarybatteries
DR
e
e
t
e
e
e
e
t Thermal Demand
Electrical Demand
Coal Plants
Combined Cycles
Conventional Hydro
Pumped Hydro
Nuclear Plants
Solar
Wind
Residential Consumers
Mediterranean
ContinentalAtlantic
1%
6%
25%
48%
20%
9%
8%
3%
ENS
Figure 5.3: Case study considered for Spain
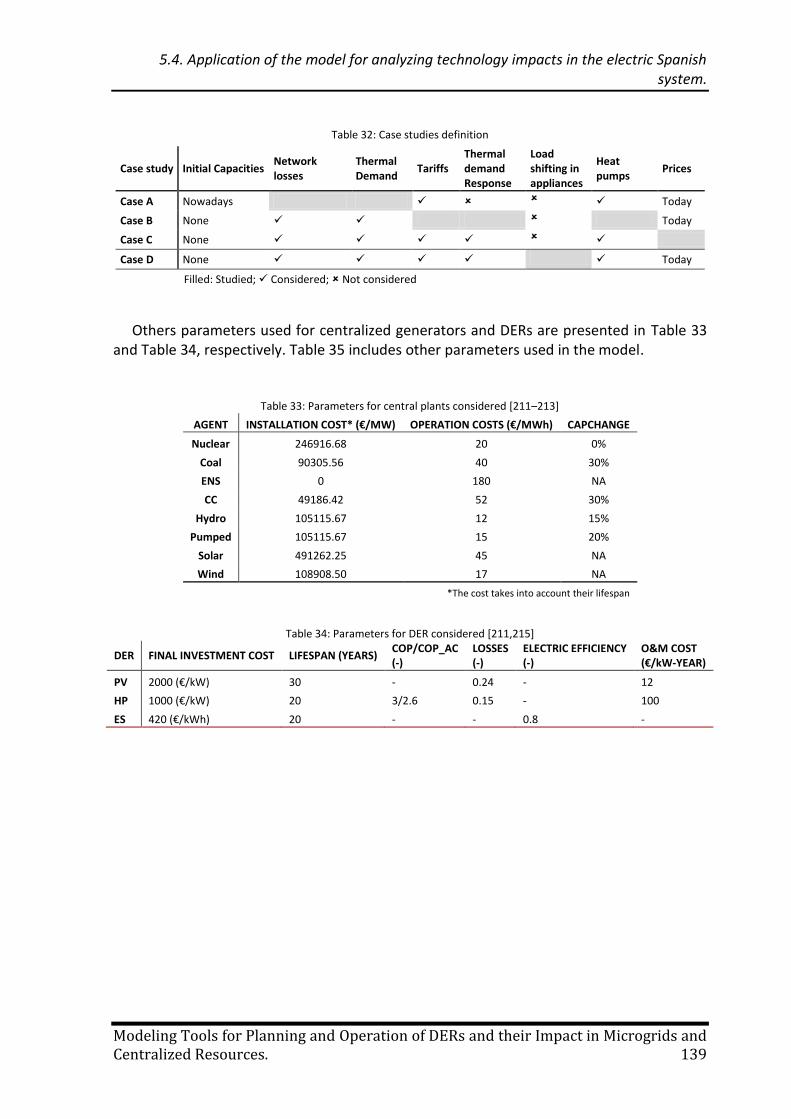
5.4. Application of the model for analyzing technology impacts in the electric Spanish system.
Modeling Tools for Planning and Operation of DERs and their Impact in Microgrids and Centralized Resources. 139
Table 32: Case studies definition
Case study Initial Capacities Network losses
Thermal Demand
Tariffs Thermal demand Response
Load shifting in appliances
Heat pumps
Prices
Case A Nowadays Today
Case B None Today
Case C None
Case D None Today
Filled: Studied; Considered; Not considered
Others parameters used for centralized generators and DERs are presented in Table 33 and Table 34, respectively. Table 35 includes other parameters used in the model.
Table 33: Parameters for central plants considered [211–213]
AGENT INSTALLATION COST* (€/MW) OPERATION COSTS (€/MWh) CAPCHANGE
Nuclear 246916.68 20 0%
Coal 90305.56 40 30%
ENS 0 180 NA
CC 49186.42 52 30%
Hydro 105115.67 12 15%
Pumped 105115.67 15 20%
Solar 491262.25 45 NA
Wind 108908.50 17 NA
*The cost takes into account their lifespan
Table 34: Parameters for DER considered [211,215]
DER FINAL INVESTMENT COST LIFESPAN (YEARS) COP/COP_AC (-)
LOSSES (-)
ELECTRIC EFFICIENCY (-)
O&M COST (€/kW-YEAR)
PV 2000 (€/kW) 30 - 0.24 - 12
HP 1000 (€/kW) 20 3/2.6 0.15 - 100
ES 420 (€/kWh) 20 - - 0.8 -
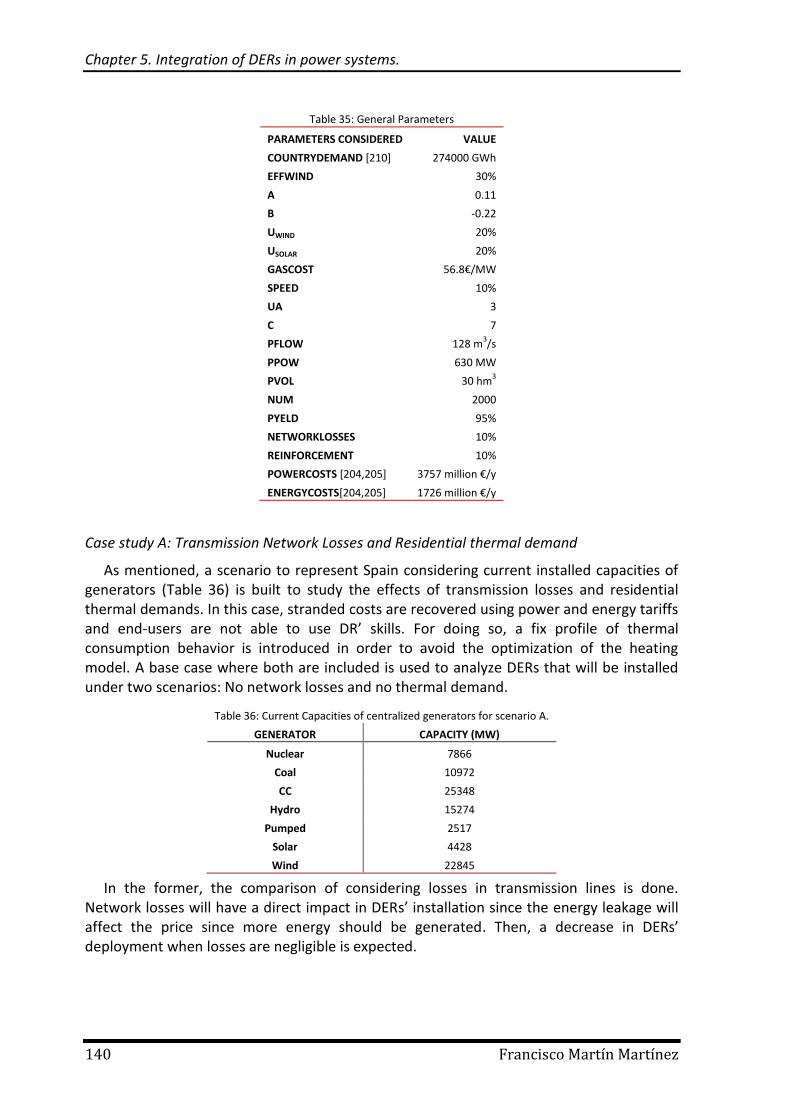
Chapter 5. Integration of DERs in power systems.
140 Francisco Martín Martínez
Table 35: General Parameters
PARAMETERS CONSIDERED VALUE
COUNTRYDEMAND [210] 274000 GWh
EFFWIND 30%
A 0.11
B -0.22
UWIND 20%
USOLAR 20%
GASCOST 56.8€/MW
SPEED 10%
UA 3
C 7
PFLOW 128 m3/s
PPOW 630 MW
PVOL 30 hm3
NUM 2000
PYELD 95%
NETWORKLOSSES 10%
REINFORCEMENT 10%
POWERCOSTS [204,205] 3757 million €/y
ENERGYCOSTS[204,205] 1726 million €/y
Case study A: Transmission Network Losses and Residential thermal demand
As mentioned, a scenario to represent Spain considering current installed capacities of generators (Table 36) is built to study the effects of transmission losses and residential thermal demands. In this case, stranded costs are recovered using power and energy tariffs and end-users are not able to use DR’ skills. For doing so, a fix profile of thermal consumption behavior is introduced in order to avoid the optimization of the heating model. A base case where both are included is used to analyze DERs that will be installed under two scenarios: No network losses and no thermal demand.
Table 36: Current Capacities of centralized generators for scenario A.
GENERATOR CAPACITY (MW)
Nuclear 7866
Coal 10972
CC 25348
Hydro 15274
Pumped 2517
Solar 4428
Wind 22845
In the former, the comparison of considering losses in transmission lines is done. Network losses will have a direct impact in DERs’ installation since the energy leakage will affect the price since more energy should be generated. Then, a decrease in DERs’ deployment when losses are negligible is expected.
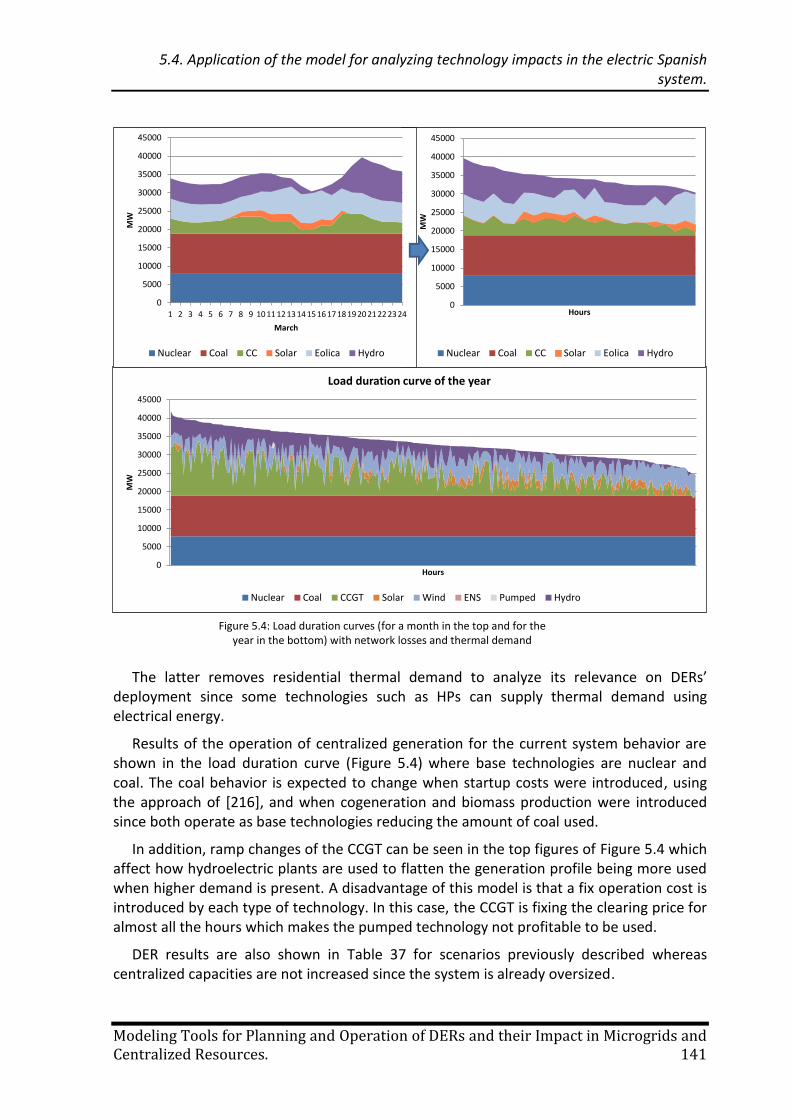
5.4. Application of the model for analyzing technology impacts in the electric Spanish system.
Modeling Tools for Planning and Operation of DERs and their Impact in Microgrids and Centralized Resources. 141
The latter removes residential thermal demand to analyze its relevance on DERs’ deployment since some technologies such as HPs can supply thermal demand using electrical energy.
Results of the operation of centralized generation for the current system behavior are shown in the load duration curve (Figure 5.4) where base technologies are nuclear and coal. The coal behavior is expected to change when startup costs were introduced, using the approach of [216], and when cogeneration and biomass production were introduced since both operate as base technologies reducing the amount of coal used.
In addition, ramp changes of the CCGT can be seen in the top figures of Figure 5.4 which affect how hydroelectric plants are used to flatten the generation profile being more used when higher demand is present. A disadvantage of this model is that a fix operation cost is introduced by each type of technology. In this case, the CCGT is fixing the clearing price for almost all the hours which makes the pumped technology not profitable to be used.
DER results are also shown in Table 37 for scenarios previously described whereas centralized capacities are not increased since the system is already oversized.
Figure 5.4: Load duration curves (for a month in the top and for the year in the bottom) with network losses and thermal demand
0
5000
10000
15000
20000
25000
30000
35000
40000
45000
MW
Hours
Load duration curve of the year
Nuclear Coal CCGT Solar Wind ENS Pumped Hydro
0
5000
10000
15000
20000
25000
30000
35000
40000
45000
MW
Hours
Nuclear Coal CC Solar Eolica Hydro
0
5000
10000
15000
20000
25000
30000
35000
40000
45000
1 2 3 4 5 6 7 8 9 10 11 12 13 14 15 16 17 18 19 20 21 22 23 24
MW
March
Nuclear Coal CC Solar Eolica Hydro
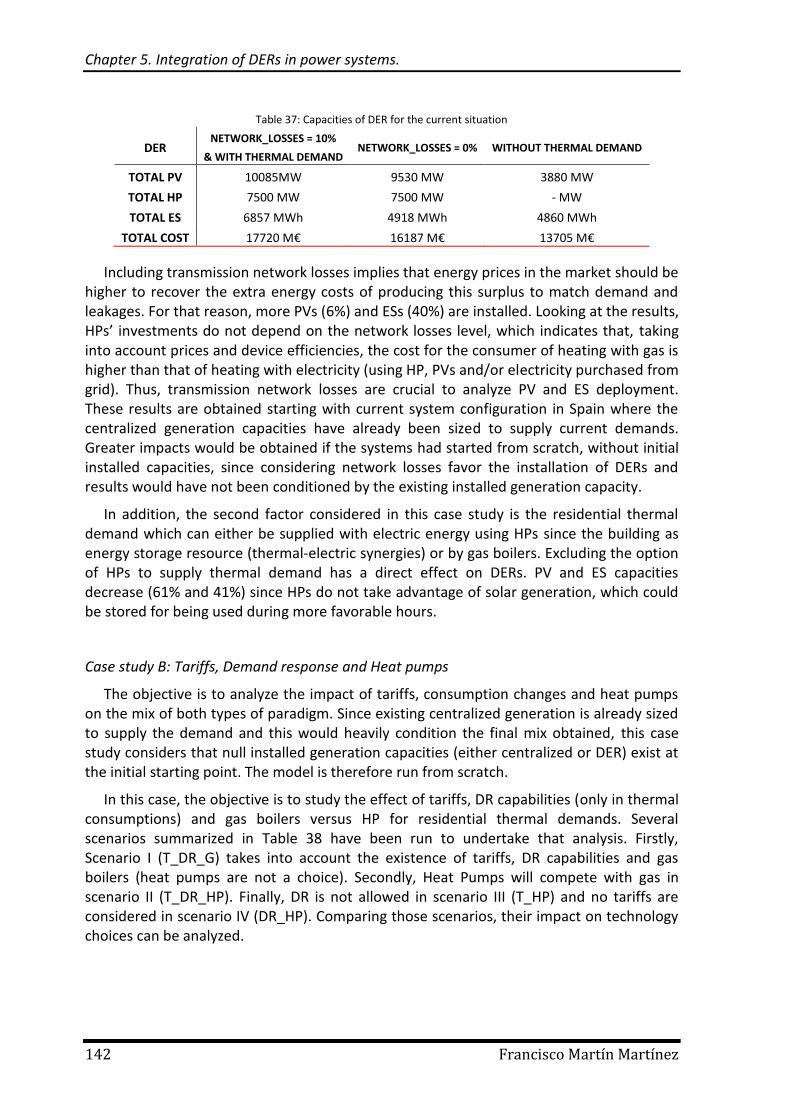
Chapter 5. Integration of DERs in power systems.
142 Francisco Martín Martínez
Table 37: Capacities of DER for the current situation
DER NETWORK_LOSSES = 10%
& WITH THERMAL DEMAND NETWORK_LOSSES = 0% WITHOUT THERMAL DEMAND
TOTAL PV 10085MW 9530 MW 3880 MW
TOTAL HP 7500 MW 7500 MW - MW
TOTAL ES 6857 MWh 4918 MWh 4860 MWh
TOTAL COST 17720 M€ 16187 M€ 13705 M€
Including transmission network losses implies that energy prices in the market should be higher to recover the extra energy costs of producing this surplus to match demand and leakages. For that reason, more PVs (6%) and ESs (40%) are installed. Looking at the results, HPs’ investments do not depend on the network losses level, which indicates that, taking into account prices and device efficiencies, the cost for the consumer of heating with gas is higher than that of heating with electricity (using HP, PVs and/or electricity purchased from grid). Thus, transmission network losses are crucial to analyze PV and ES deployment. These results are obtained starting with current system configuration in Spain where the centralized generation capacities have already been sized to supply current demands. Greater impacts would be obtained if the systems had started from scratch, without initial installed capacities, since considering network losses favor the installation of DERs and results would have not been conditioned by the existing installed generation capacity.
In addition, the second factor considered in this case study is the residential thermal demand which can either be supplied with electric energy using HPs since the building as energy storage resource (thermal-electric synergies) or by gas boilers. Excluding the option of HPs to supply thermal demand has a direct effect on DERs. PV and ES capacities decrease (61% and 41%) since HPs do not take advantage of solar generation, which could be stored for being used during more favorable hours.
Case study B: Tariffs, Demand response and Heat pumps
The objective is to analyze the impact of tariffs, consumption changes and heat pumps on the mix of both types of paradigm. Since existing centralized generation is already sized to supply the demand and this would heavily condition the final mix obtained, this case study considers that null installed generation capacities (either centralized or DER) exist at the initial starting point. The model is therefore run from scratch.
In this case, the objective is to study the effect of tariffs, DR capabilities (only in thermal consumptions) and gas boilers versus HP for residential thermal demands. Several scenarios summarized in Table 38 have been run to undertake that analysis. Firstly, Scenario I (T_DR_G) takes into account the existence of tariffs, DR capabilities and gas boilers (heat pumps are not a choice). Secondly, Heat Pumps will compete with gas in scenario II (T_DR_HP). Finally, DR is not allowed in scenario III (T_HP) and no tariffs are considered in scenario IV (DR_HP). Comparing those scenarios, their impact on technology choices can be analyzed.
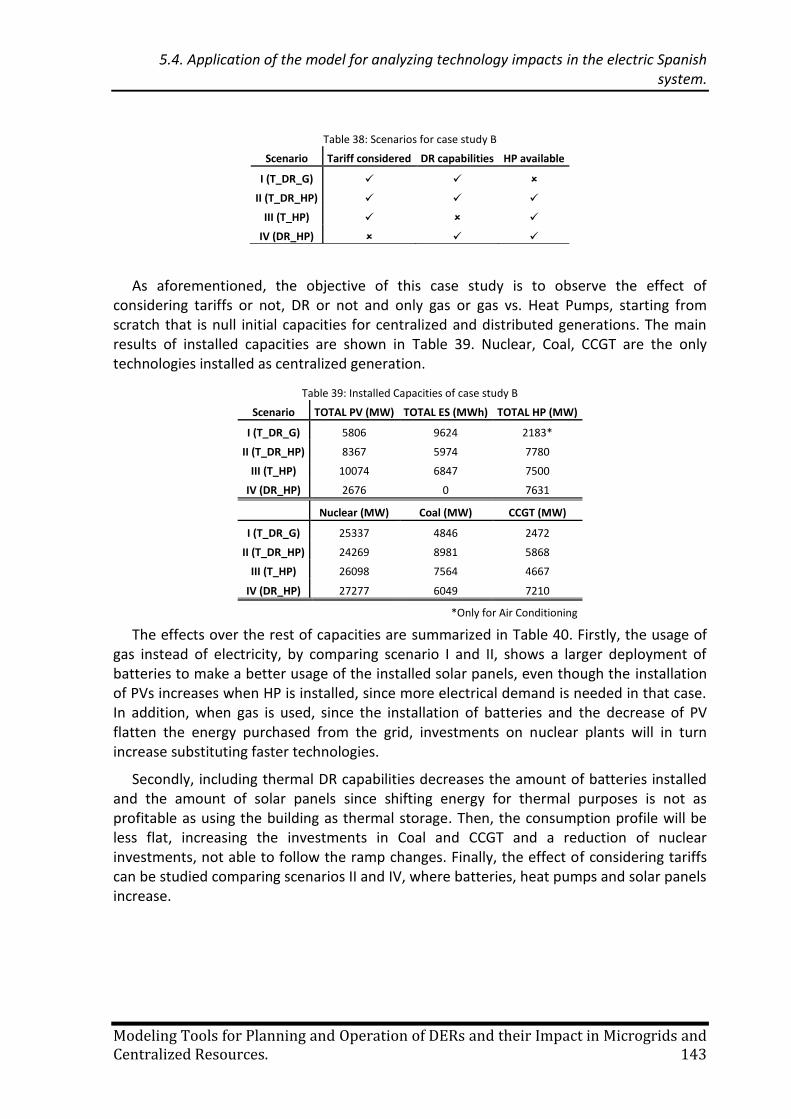
5.4. Application of the model for analyzing technology impacts in the electric Spanish system.
Modeling Tools for Planning and Operation of DERs and their Impact in Microgrids and Centralized Resources. 143
Table 38: Scenarios for case study B
Scenario Tariff considered DR capabilities HP available
I (T_DR_G)
II (T_DR_HP)
III (T_HP)
IV (DR_HP)
As aforementioned, the objective of this case study is to observe the effect of considering tariffs or not, DR or not and only gas or gas vs. Heat Pumps, starting from scratch that is null initial capacities for centralized and distributed generations. The main results of installed capacities are shown in Table 39. Nuclear, Coal, CCGT are the only technologies installed as centralized generation.
Table 39: Installed Capacities of case study B
Scenario TOTAL PV (MW) TOTAL ES (MWh) TOTAL HP (MW)
I (T_DR_G) 5806 9624 2183*
II (T_DR_HP) 8367 5974 7780
III (T_HP) 10074 6847 7500
IV (DR_HP) 2676 0 7631
Nuclear (MW) Coal (MW) CCGT (MW)
I (T_DR_G) 25337 4846 2472
II (T_DR_HP) 24269 8981 5868
III (T_HP) 26098 7564 4667
IV (DR_HP) 27277 6049 7210
*Only for Air Conditioning
The effects over the rest of capacities are summarized in Table 40. Firstly, the usage of gas instead of electricity, by comparing scenario I and II, shows a larger deployment of batteries to make a better usage of the installed solar panels, even though the installation of PVs increases when HP is installed, since more electrical demand is needed in that case. In addition, when gas is used, since the installation of batteries and the decrease of PV flatten the energy purchased from the grid, investments on nuclear plants will in turn increase substituting faster technologies.
Secondly, including thermal DR capabilities decreases the amount of batteries installed and the amount of solar panels since shifting energy for thermal purposes is not as profitable as using the building as thermal storage. Then, the consumption profile will be less flat, increasing the investments in Coal and CCGT and a reduction of nuclear investments, not able to follow the ramp changes. Finally, the effect of considering tariffs can be studied comparing scenarios II and IV, where batteries, heat pumps and solar panels increase.
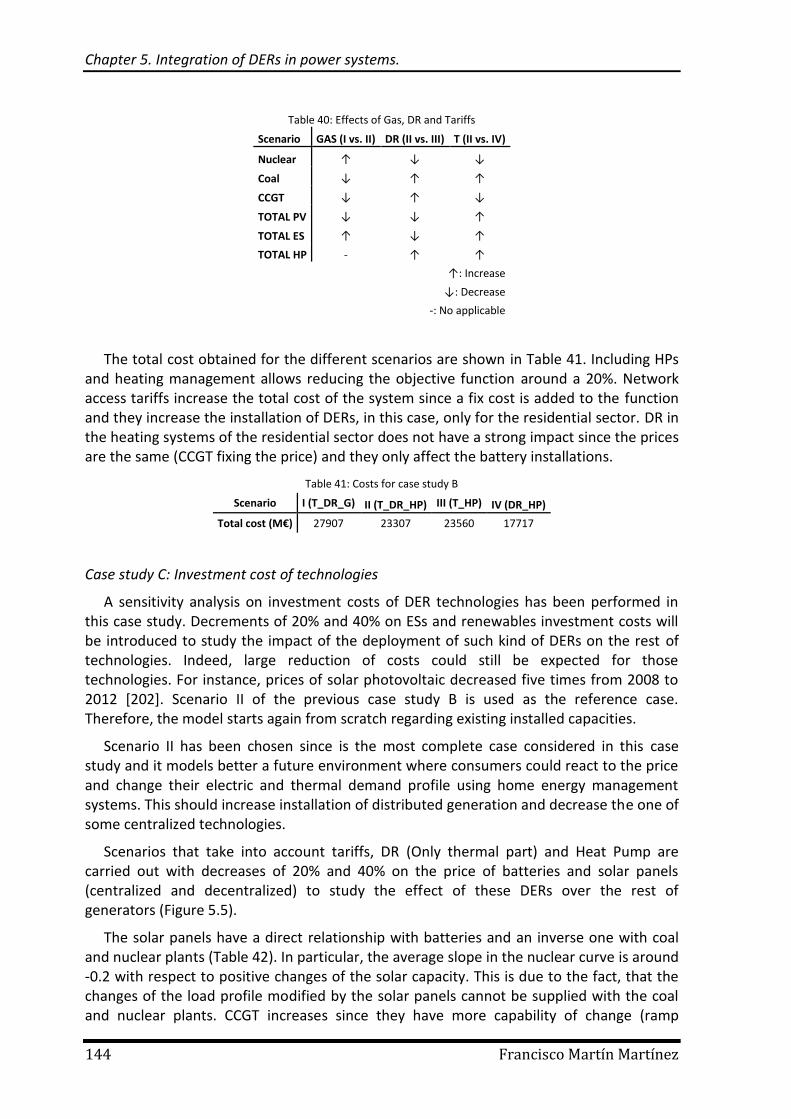
Chapter 5. Integration of DERs in power systems.
144 Francisco Martín Martínez
Table 40: Effects of Gas, DR and Tariffs
Scenario GAS (I vs. II) DR (II vs. III) T (II vs. IV)
Nuclear ↑ ↓ ↓
Coal ↓ ↑ ↑
CCGT ↓ ↑ ↓
TOTAL PV ↓ ↓ ↑
TOTAL ES ↑ ↓ ↑
TOTAL HP - ↑ ↑
↑: Increase
↓: Decrease
-: No applicable
The total cost obtained for the different scenarios are shown in Table 41. Including HPs and heating management allows reducing the objective function around a 20%. Network access tariffs increase the total cost of the system since a fix cost is added to the function and they increase the installation of DERs, in this case, only for the residential sector. DR in the heating systems of the residential sector does not have a strong impact since the prices are the same (CCGT fixing the price) and they only affect the battery installations.
Table 41: Costs for case study B
Scenario I (T_DR_G) II (T_DR_HP) III (T_HP) IV (DR_HP)
Total cost (M€) 27907 23307 23560 17717
Case study C: Investment cost of technologies
A sensitivity analysis on investment costs of DER technologies has been performed in this case study. Decrements of 20% and 40% on ESs and renewables investment costs will be introduced to study the impact of the deployment of such kind of DERs on the rest of technologies. Indeed, large reduction of costs could still be expected for those technologies. For instance, prices of solar photovoltaic decreased five times from 2008 to 2012 [202]. Scenario II of the previous case study B is used as the reference case. Therefore, the model starts again from scratch regarding existing installed capacities.
Scenario II has been chosen since is the most complete case considered in this case study and it models better a future environment where consumers could react to the price and change their electric and thermal demand profile using home energy management systems. This should increase installation of distributed generation and decrease the one of some centralized technologies.
Scenarios that take into account tariffs, DR (Only thermal part) and Heat Pump are carried out with decreases of 20% and 40% on the price of batteries and solar panels (centralized and decentralized) to study the effect of these DERs over the rest of generators (Figure 5.5).
The solar panels have a direct relationship with batteries and an inverse one with coal and nuclear plants (Table 42). In particular, the average slope in the nuclear curve is around -0.2 with respect to positive changes of the solar capacity. This is due to the fact, that the changes of the load profile modified by the solar panels cannot be supplied with the coal and nuclear plants. CCGT increases since they have more capability of change (ramp
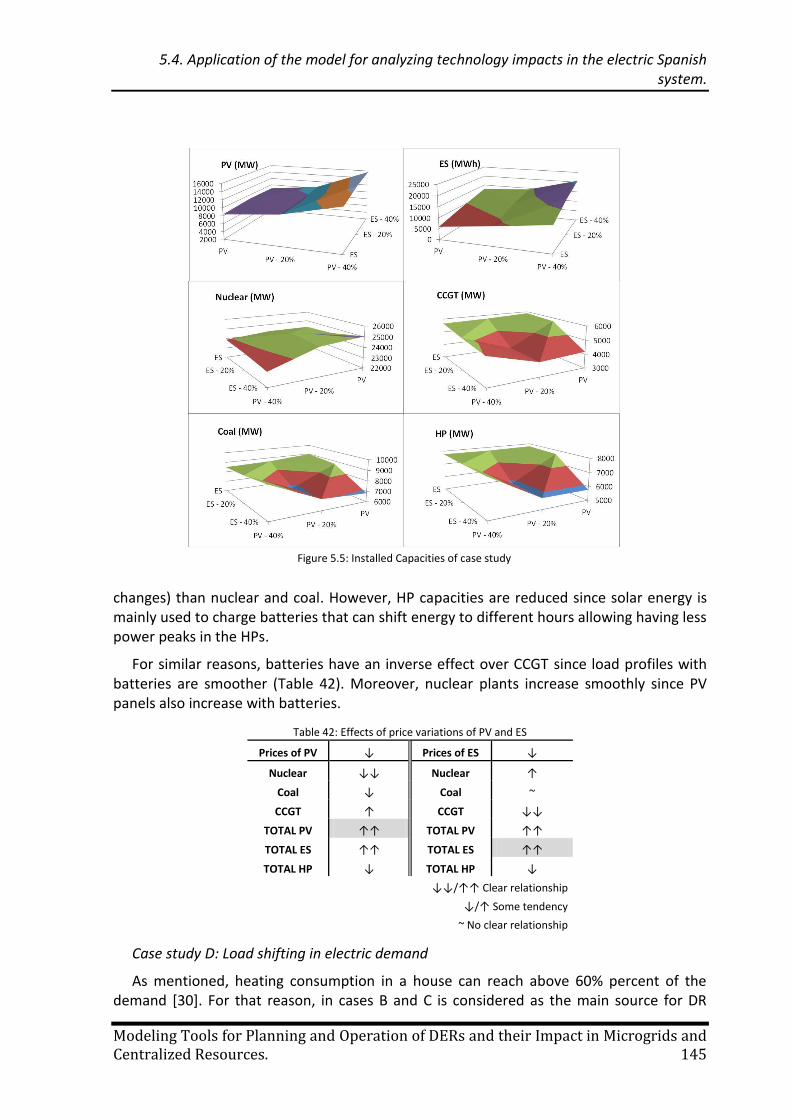
5.4. Application of the model for analyzing technology impacts in the electric Spanish system.
Modeling Tools for Planning and Operation of DERs and their Impact in Microgrids and Centralized Resources. 145
changes) than nuclear and coal. However, HP capacities are reduced since solar energy is mainly used to charge batteries that can shift energy to different hours allowing having less power peaks in the HPs.
For similar reasons, batteries have an inverse effect over CCGT since load profiles with batteries are smoother (Table 42). Moreover, nuclear plants increase smoothly since PV panels also increase with batteries.
Table 42: Effects of price variations of PV and ES
Prices of PV ↓ Prices of ES ↓
Nuclear ↓↓ Nuclear ↑
Coal ↓ Coal ~
CCGT ↑ CCGT ↓↓
TOTAL PV ↑↑ TOTAL PV ↑↑
TOTAL ES ↑↑ TOTAL ES ↑↑
TOTAL HP ↓ TOTAL HP ↓
↓↓/↑↑ Clear relationship
↓/↑ Some tendency
~ No clear relationship
Case study D: Load shifting in electric demand
As mentioned, heating consumption in a house can reach above 60% percent of the demand [30]. For that reason, in cases B and C is considered as the main source for DR
Figure 5.5: Installed Capacities of case study
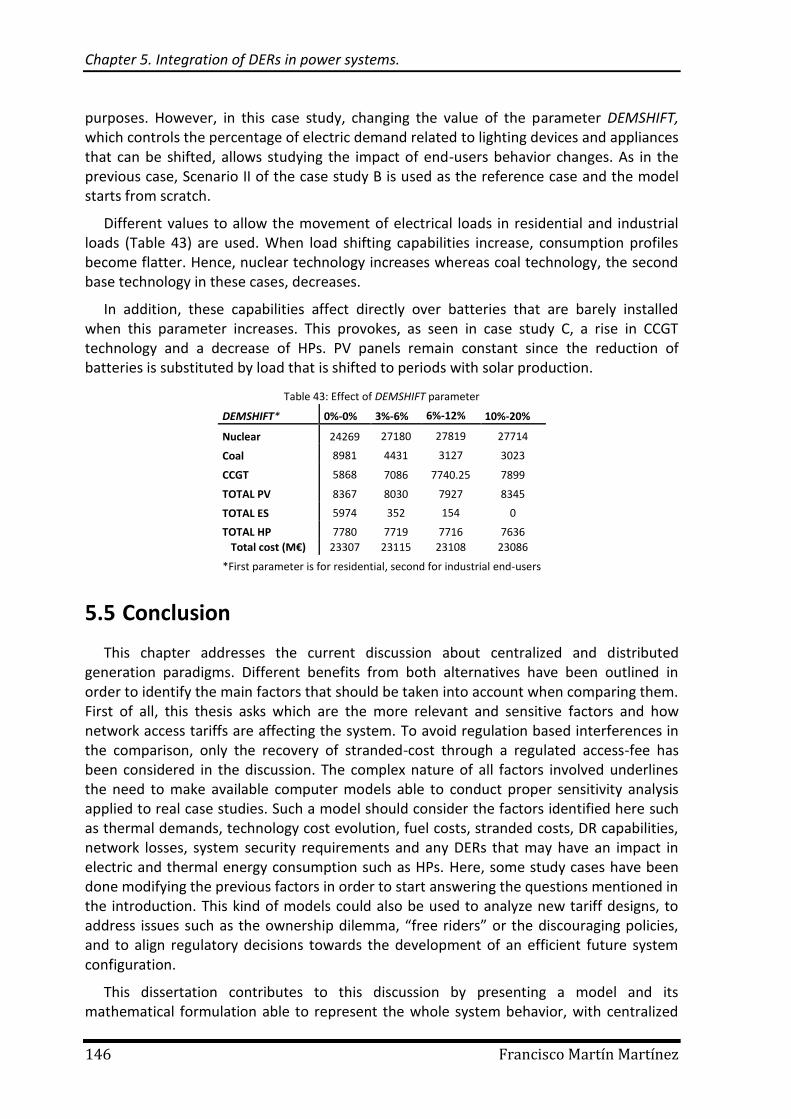
Chapter 5. Integration of DERs in power systems.
146 Francisco Martín Martínez
purposes. However, in this case study, changing the value of the parameter DEMSHIFT, which controls the percentage of electric demand related to lighting devices and appliances that can be shifted, allows studying the impact of end-users behavior changes. As in the previous case, Scenario II of the case study B is used as the reference case and the model starts from scratch.
Different values to allow the movement of electrical loads in residential and industrial loads (Table 43) are used. When load shifting capabilities increase, consumption profiles become flatter. Hence, nuclear technology increases whereas coal technology, the second base technology in these cases, decreases.
In addition, these capabilities affect directly over batteries that are barely installed when this parameter increases. This provokes, as seen in case study C, a rise in CCGT technology and a decrease of HPs. PV panels remain constant since the reduction of batteries is substituted by load that is shifted to periods with solar production.
Table 43: Effect of DEMSHIFT parameter
DEMSHIFT* 0%-0% 3%-6% 6%-12% 10%-20%
Nuclear 24269 27180 27819 27714
Coal 8981 4431 3127 3023
CCGT 5868 7086 7740.25 7899
TOTAL PV 8367 8030 7927 8345
TOTAL ES 5974 352 154 0
TOTAL HP 7780 7719 7716 7636
Total cost (M€) 23307 23115 23108 23086
*First parameter is for residential, second for industrial end-users
5.5 Conclusion
This chapter addresses the current discussion about centralized and distributed generation paradigms. Different benefits from both alternatives have been outlined in order to identify the main factors that should be taken into account when comparing them. First of all, this thesis asks which are the more relevant and sensitive factors and how network access tariffs are affecting the system. To avoid regulation based interferences in the comparison, only the recovery of stranded-cost through a regulated access-fee has been considered in the discussion. The complex nature of all factors involved underlines the need to make available computer models able to conduct proper sensitivity analysis applied to real case studies. Such a model should consider the factors identified here such as thermal demands, technology cost evolution, fuel costs, stranded costs, DR capabilities, network losses, system security requirements and any DERs that may have an impact in electric and thermal energy consumption such as HPs. Here, some study cases have been done modifying the previous factors in order to start answering the questions mentioned in the introduction. This kind of models could also be used to analyze new tariff designs, to address issues such as the ownership dilemma, “free riders” or the discouraging policies, and to align regulatory decisions towards the development of an efficient future system configuration.
This dissertation contributes to this discussion by presenting a model and its mathematical formulation able to represent the whole system behavior, with centralized
5.5. Conclusion
Modeling Tools for Planning and Operation of DERs and their Impact in Microgrids and Centralized Resources. 147
and distributed generation alternatives, with various DERs together with a modeling of the consumer response and building thermal behavior, among other factors. The model is formulated as mix integer linear optimization problem. Different case studies have been presented in order to show the relationships among technologies and analyze how different factors impact them. Some qualitative conclusions could be extracted from these case studies such as for instance:
The larger the penetration of distributed PV panels, the lower the investments in centralized base technologies Nuclear and Coal, as expected, since the net demand (once PV production is deducted) is more fluctuating. In particular, the nuclear capacity has a ratio of -0.2 over positive changes in solar capacities installed.
The larger the amount of ES, the lower the investments in flexible kind of technologies such as CCGT, as expected since net load profile becomes flatter. In this case, a ratio of -0.2 is also obtained regarding changes of CCGT over changes in ES capacities.
Transmission network losses are one of the factors that do impact on the choice for more distributed resources. The case studies show that the solution is sensible to changes in the loss parameter considered. Indeed, higher losses imply higher prices at the final consumer level due to the energy wasted, making DER investments more attractive. A factor of losses of 10% has increased a 10% the final cost, a 6% the installation of PV panels and an increment of 40% in batteries.
Properly modeling building thermal demands is relevant since the possibility of using electricity to cover thermal needs thanks to heat pumps, impact the level of distributed resources to be installed and could save around a 20% of the total costs. This conclusion, which was obtained in chapter 3, is also seen in this chapter.
The larger the DR skills in place, the lower the need of ES, as expected since load-shifting capabilities reduces the need of batteries to store PV panels’ production. In fact when 10% of the appliances in residential demand can be shifted as well as the heating consumption, batteries are no longer needed. Although, they almost disappear with only a 3%
The use of HP instead of gas to cover thermal demand decreases the amount of batteries needed since the thermal inertia of buildings allows shifting the purchase of electric energy for heating purposes avoiding the use of batteries for shaving the load profile. In fact, for the current situation scenario, no allowing the use of heat pumps decrease a 60% the capacity of the distributed solar panels.
Finally, as previously mentioned in the literature, applying net metering to self-consumers and forcing stranded costs recovery through access-fee, leads to a large amount of distributed DER, far away from the optimal mix resulting from a pure economic efficiency decision. However, this fact does not affect to the total centralized capacities which only varies around a 5% when only residential demands can install DERs. Regulators should carefully undertake similar studies as these ones before making such kind of tariff design decisions.
These qualitative conclusions highlight the interrelationships between the different technologies involved in the problem whereas quantitative conclusions will be the next step in this research. Two main reasons for that: first, results being able to be used as benchmarks for such kind of study have not been found in the literature since nobody
Chapter 5. Integration of DERs in power systems.
148 Francisco Martín Martínez
decides both things at the same time. This fact highlights the importance of doing these kinds of models and approaches. Second, refinements in some of the input data parameters used in the model would be required before extracting conclusive quantitative indications from the study. Indeed several input parameters of the model require an ad-hoc study to be properly fixed. Although reasonable approximations, drawn from official institutions reports, have been used for those parameters in the Spanish case study, a more refined study is required to extract conclusive quantitative conclusions.
Some improvements were being introduced in the current models by the time this thesis was written. For instance, this model is being improved by including additional factors such as: Distribution networks losses (adding losses to the DER devices in these networks), other important centralized technologies such cogeneration (profiles can be added to do this if the industrial sector is not modeled in detail), exchanges with other countries or startup costs (the approach of [216] shows how can be done when the technology is aggregated).
Modeling Tools for Planning and Operation of DERs and their Impact in Microgrids and Centralized Resources. 149
Focus on the journey, not the destination.
Joy is found not in finishing an activity but in doing it.
Greg Anderson
This last chapter summarizes the contributions of this thesis. The main conclusions that can be drawn from the case studies to answer the questions previously formulated and the most original developments are highlighted. Finally, the open issues that were not tackled in the thesis, as well as possible future research lines, are discussed.
6.1 Summary
Recent years have supposed a great change towards the adoption of deployment of DERs that probably become a regular part of our systems in a near future. Their deployment is encouraged in order to reduce climate change effects, to enhance resiliency, to reduce transmission and distribution network investment needs and network losses, and to increase efficiency.
DERs’ integration can be managed in different ways as Virtual Power Plants, aggregation of end users or Microgrids. Any of them are still in a preliminary stage in the majority of countries without clear rules defining their management. Isolated grids were selected as the focus of the study since the resilience is one of the most relevant issues in electrical networks nowadays. In fact, in some undeveloped countries, building a transmission grid to reach all consumers is economically unfeasible whereas building isolated grids that take advantage of local resources is the only available method. The profitability of them in developed countries is still a debate whereas the transition cost and the rules for their operation remain unknown. Finally, this dissertation has analyzed the deployment of DERs using mathematical models designed to address three important DERs’ issues.
Chapter 6. Conclusions, Contributions and Future Work
150 Francisco Martín Martínez
The first one assesses the optimal deployment of DERs at building level taking into account both electricity and thermal energy building requirements (Chapter 3). Modeling in detail both the buildings electricity and thermal demand behaviors, and the economic and physical characteristics of the different DERs involved, is of paramount importance to properly address the capabilities and efficiency of DERs’ solutions. Traditionally, electric models have focused on the electricity markets where end-users are fully aggregated or the models have not properly considered changes in demand behavior when different DERs’ technologies can be installed. Before analyzing DERs’ integration, demand should be properly modeled.
This thesis contributes with the integration of specific set of heating related formulas and parameters for properly modeling thermal inertias in buildings and adds them together with a detailed characterization of DERs to the formulation of existing DER related models. Thanks to that, synergies between thermal and electric energy in distributed systems can be taken into account and exploited. Such a mathematical model is presented and several studies conducted to understand the role played by each of the factors involved and their relevance. As shown in Chapter 3, managing heating devices in order to avoid undesired usages or consuming it in more profitable hours subject to comfort requirements is one of their main advantages. The parameters involved have been studied to analyze how each parameter affects the consumption and the thermal inertia of the building. Moreover, empirical correspondences between the mathematical parameters and the reality have been checked. Two main parameters are involved. One of them is identified as the isolation quality of the house and its value affects directly the level of consumption whereas the second parameter is identified as a representative parameter of the amount of heat that can be stored inside a building, whose value, multiplied by the former one, determines the thermal inertia of the building.
The second one addresses the optimal deployment of DERs at Microgrid (MG) level (Chapter 4). First, a literature review on MGs has been conducted (Chapter 2), classified by different functional layers to clearly define the MGs. Then, a mathematical model has been developed to represent the optimal investment and economic operation of DERs for an isolated MG, built as aggregation of individual buildings with their own DERS controlled by an Aggregator that has also the option to invest on common shared generation devices such as CHP units. Although there is still no regulation or business models defined for MGs, the literature review in Chapter 2 reveals that the operation of MGs could be understood under two different scenarios. On the one hand, MGs operated by single operators who decide the operation of their DG according to electricity grid prices (whenever operating connected to the grid) or according to their own priorities schemes. They are usually big installations owned by the same entity such as governmental buildings or University Campus. On the other hand, the problems arise when MGs are made of different buildings owned by different entities. As mentioned, some European projects have proposed ideas about developing local markets in distribution networks and some initiative have been reviewed. This thesis reviews the business model and develops a model for studying the behavior of such local markets. Results shows that the small size of these markets can influence the clearing price since strategic behavior can be adopted by agents as seen in chapter 4. Anyway, a set of rules for avoiding these behaviors inside these markets, out of the scope of this thesis, should be defined before implementing this kind of mechanism in current distribution networks.
6.1. Summary
Modeling Tools for Planning and Operation of DERs and their Impact in Microgrids and Centralized Resources. 151
Finally, the third one addresses the optimal deployment of DERs at system level. A mathematical model has been designed to properly address studies comparing DERs’ deployment versus centralized generation based deployment. Although DERs’ deployment may result attractive from end users’ point of view due to the specific regulation in place (tariffs design, incentives, charges …), it is not clear if it is an efficient option from the whole system point of view. An unbiased modeling of both the DER facilities and the centralized generation power plants has been developed taking into account the main factors that may affect the optimal solution, as for instance, economies of scale on investment and maintenance costs, the network investment and network losses impact or the electricity and thermal demand response capabilities of end-users. Besides, the impact of applying electricity tariffs to recover bulk power system regulated stranded cost, has also been considered, as an additional option. In such a way, DERs’ impacts over bulk power systems have been analyzed discovering relationships among technologies and how different factors impact them. Some qualitative conclusions could be extracted from these case studies. The complex nature of all factors involved underlines the need to make available computer models able to conduct proper sensitivity analysis applied to real case studies. Such a model should consider factors such as thermal demands, technology cost evolution, fuel costs, stranded costs, DR capabilities, network losses, system security requirements and any DERs that may have an impact in electric and thermal energy consumption such as HPs.
Throughout the thesis, different models have been applied to analyze the deployment of DERs at buildings or connected MGs level, in isolated MGs level and systems level. Table 44 shows the list of equation used in each model indicating the modifications that should be done. Optimal DERs’ installation mixes can be sized throughout all these models, using the core equations characterizing the behavior of all DERs and all thermal and electricity demands, as described in Chapter 3. These equations have been validated with real cases, described in that chapter, and then used in some theoretical case studies in the following chapters. In addition, some of these models are continuously being tested and used in real home energy management systems, to optimize the real-time operation of DER installed devices, according to current electricity grid supply prices.
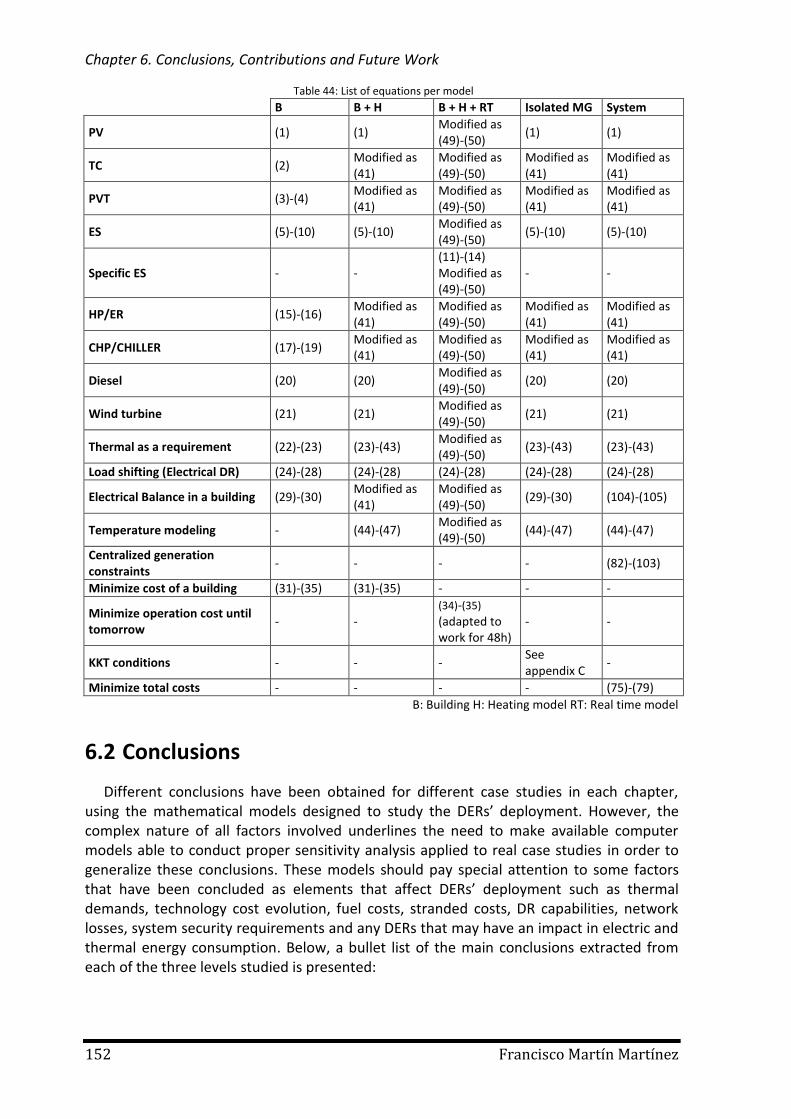
Chapter 6. Conclusions, Contributions and Future Work
152 Francisco Martín Martínez
Table 44: List of equations per model
B B + H B + H + RT Isolated MG System
PV (1) (1) Modified as (49)-(50)
(1) (1)
TC (2) Modified as (41)
Modified as (49)-(50)
Modified as (41)
Modified as (41)
PVT (3)-(4) Modified as (41)
Modified as (49)-(50)
Modified as (41)
Modified as (41)
ES (5)-(10) (5)-(10) Modified as (49)-(50)
(5)-(10) (5)-(10)
Specific ES - - (11)-(14) Modified as (49)-(50)
- -
HP/ER (15)-(16) Modified as (41)
Modified as (49)-(50)
Modified as (41)
Modified as (41)
CHP/CHILLER (17)-(19) Modified as (41)
Modified as (49)-(50)
Modified as (41)
Modified as (41)
Diesel (20) (20) Modified as (49)-(50)
(20) (20)
Wind turbine (21) (21) Modified as (49)-(50)
(21) (21)
Thermal as a requirement (22)-(23) (23)-(43) Modified as (49)-(50)
(23)-(43) (23)-(43)
Load shifting (Electrical DR) (24)-(28) (24)-(28) (24)-(28) (24)-(28) (24)-(28)
Electrical Balance in a building (29)-(30) Modified as (41)
Modified as (49)-(50)
(29)-(30) (104)-(105)
Temperature modeling - (44)-(47) Modified as (49)-(50)
(44)-(47) (44)-(47)
Centralized generation constraints
- - - - (82)-(103)
Minimize cost of a building (31)-(35) (31)-(35) - - -
Minimize operation cost until tomorrow
- - (34)-(35) (adapted to work for 48h)
- -
KKT conditions - - - See appendix C
-
Minimize total costs - - - - (75)-(79)
B: Building H: Heating model RT: Real time model
6.2 Conclusions
Different conclusions have been obtained for different case studies in each chapter, using the mathematical models designed to study the DERs’ deployment. However, the complex nature of all factors involved underlines the need to make available computer models able to conduct proper sensitivity analysis applied to real case studies in order to generalize these conclusions. These models should pay special attention to some factors that have been concluded as elements that affect DERs’ deployment such as thermal demands, technology cost evolution, fuel costs, stranded costs, DR capabilities, network losses, system security requirements and any DERs that may have an impact in electric and thermal energy consumption. Below, a bullet list of the main conclusions extracted from each of the three levels studied is presented:
6.2. Conclusions
Modeling Tools for Planning and Operation of DERs and their Impact in Microgrids and Centralized Resources. 153
At building level:
The electric and thermal behavior of building, several DERs’ operation, DR skills and the temperature behavior modeling presented have been proven effective to match real consumption behaviors.
The integration of a heating consumption model in a real building was studied. Some conclusions were drawn for this particular case. Before the heating model was introduced, the actual heating consumption was supplied when the prices of energy were high. The optimization model decides to heat the building when the price are low and reduces the consumption when the prices are high, obtaining between 5% and 7% of savings during a month and highlighting the importance of smart heating management.
When the heating model is introduced in this particular case, investment decisions
with respect to different price scenarios varies around a 3%, whereas the use of the
original profile produce a change around a 30% in the capacity of solar panels and a
huge increase of the batteries. This is the only way to shift thermal consumptions for
this kind of approach leading to incorrect decisions. In fact, the heating model in the
investment cases can reach a 10% of savings compared to the 2% obtained when the
profiles are used.
Empirical equivalences between parameters and real elements have been concluded. The first parameter called RUA was identified as the isolation quality of the house and its value affect directly to the level of input energy required. The second parameter called C was recognized as a representative parameter of the amount of heat that can be stored inside a building and its value determine the inertia of the system. Finally, the combination of both parameters named as the time constant of the building, τ, was related to the dynamic behavior of the system and its value is determined by the one of the previous parameters. However, different combination of values of the two first parameters that produce a same value of the time constant will present a similar shape in their consumption profile.
At MG level:
A comprehensive and exhaustive literature review of MGs has been performed. The review is organized attending to different functional layers and provides useful insights on the current situation of MGs. A functional and unified description of some MGs related concepts found in the literature, such as Microgrids, Nanogrids and Picogrids has been proposed, overcoming confuse and non consistent descriptions found in different papers This literature review on MGs some topics not addressed in the thesis, such as those related to the physical and communications layers or those related to technical real-time operation issues (i.e. voltage and frequency regulation, ancillary services provision). However, a large dispersion of terms and concepts related to MGs was found in the literature, makin neccesary an exhaustive review of the MG concept to address the aspects tackled in the thesis.
An operation framework of MGs when the MG is integrated in a larger main grid (running sometimes isolated if necessary) and when the MG is totally isolated has been presented. A Microgrid Operator (MGO) is in charge of each MG management system (MGMS). The MGO will aggregate all consumers, prosumers and DERs within
Chapter 6. Conclusions, Contributions and Future Work
154 Francisco Martín Martínez
the MG when operating in connected mode. Under isolated operation mode, the MGO will be in charge of managing the MG, guaranteeing a secure physical operation of the MG and setting the physical and economic exchanges among MG users. A market approach could be a solution when different owners of DERs are inside the MG. The MGO will run a total minimization of cost of the MG (conjecture value equal to 0) for settling the prices and giving recommendations of the ideal capacities to their users.
The small size of a MG using the local market approach could lead to price distortions due to the behavior of users, justifying that some additional economic conditions should be considered to avoid these behaviors.
The conjecture approach could be used when real local markets in MGs are
deployed and historical data will be available. In the case study presented, price
variations with respect to changes in the conjecture are higher (almost 3 times)
when the value of the conjecture is closer to 0.
At system level:
Several factors were identified as elements that tip the scale towards centralized or distributed technologies: thermal demands, technology costs, fuel costs, stranded costs, DR capabilities, network losses, system security requirements and any DERs that may have an impact in electric and thermal energy consumption such as HPs.
Fluctuations of solar technologies affect base technologies. For this reason, more solar investments affect to Nuclear and Coal deployment.
Storages flatten the consumption profile reducing the need of flexible technologies such as CCGT.
Variations of Nuclear with respect to variations of solar technologies present an average slope of -0.2. The same average ratio was obtained between variations of coal with respect to variations of batteries.
Considering transmission network losses of 10% has increased a 10% the final system cost for the current scenario, a 6% the installation of PV panels and an increment of 40% in batteries.
Properly modeling building thermal demands is relevant since the possibility of using electricity to cover thermal needs thanks to heat pumps, impact the level of distributed resources to be installed.
DR and ES have similar effects and therefore, load-shifting capabilities reduce the need of batteries to store PV panels’ production. When 10% of the appliances in residential demand can be shifted as well as the heating consumption, batteries are no longer needed. DR has a strong impact in batteries even when only a 3% is considered, highlighting its potential.
The use of HP instead of gas to cover thermal demand decreases the amount of batteries needed since the thermal inertia of buildings allows shifting the purchase of electric energy for heating purposes avoiding the use of batteries for shaving the load profile.
Both net metering in self-consumers and forcing stranded costs recovery through access-fee lead to the increase of distributed DERs’ installations.
6.3. Original Contributions
Modeling Tools for Planning and Operation of DERs and their Impact in Microgrids and Centralized Resources. 155
6.3 Original Contributions
This thesis was conceived with the objective of pushing forward research on DERs’ deployment throughout the use of MGs. The main original contributions of this dissertation are the following:
A complete literature review of Microgrids (Chapter 2). A comprehensive classification of the MG review has been performed, based on functional layers, enabling a joint and structured vision of all studied topics concerning MGs, who where up to now separately and individually addressed in the literature. The objective was to set up a MG review document, with a broad vision, in order to provide a useful starting point for new research in MGs’ topics.
The integration of a temperature model for buildings, able to consider its thermal inertia and its inclusion in all the DERs’ mathematical models used in the thesis. The use of a RC-network model in the optimization model allows considering the real behavior of the indoor temperature compared with other approaches in the literature. Thus, both electricity and thermal energy consumption are considered, allowing prosumers to take advantage of their DR capabilities regarding both their thermal and electricity needs and providing the option to use either gas or electricity to meet the thermal needs. The impact on DERs’ deployment of such a feature supports the relevance of such contribution. This model was not previously used in energy optimization models, being a clear contribution in order to improve the energy behavior in a building.
A mathematical model to analyze DERs’ deployment at building level taking into accounts both electricity and thermal energy building requirements. The model considers the economic and physical characteristics of the different DERs involved to decide both the optimal DERs’ investments and the optimal operation of such devices according to the grid electricity supply price hourly profiles.
One of the ways isolated MGs could be operated is through electricity markets at district level where each agent looks for minimizing its individual costs. European Projects have launched the proposal of this kind of local market based approach for isolated MGs. One of the main concerns of such an approach is the small size of such markets which could lead to strategic behaviors of agents, although it depends on the number and size of the local market agents. Chapter 4 presents a mathematical modeling of the economic planning and operation of isolated MGs, able to represent the impact of agent’s strategic behavior through the explicit consideration of conjectures in a market equilibrium modeling approach.
A mathematical model has been designed to properly address studies on the efficiency of DER deployment versus centralized generation based deployment. Countless factors affect the equilibrium between centralized and distributed generation paradigms. The model, inspired in the operation of isolated MG, does explicitly consider many of them and has been applied to study the impact of several of those factors in the optimal mix of installed capacities of centralized generation plants and DERs (Chapter 5). Important relations have been highlighted, and regulators could help to make proper decisions when incentivizing different technologies and designing proper tariffs.
Chapter 6. Conclusions, Contributions and Future Work
156 Francisco Martín Martínez
During this research, the following publications connected with the thesis have been developed:
Martín-Martínez F, Sánchez-Miralles A, Rivier M. A literature review of Microgrids: A
functional layer based classification. Renew Sustain Energy Rev 2016;62:1133–53.
doi:10.1016/j.rser.2016.05.025. JCR: 6.798
Martín-Martínez F, Sánchez-Miralles A, Rivier M. Prosumers’ optimal DER
investments and DR usage for thermal and electrical loads in isolated microgrids.
Electr Power Syst Res 2016. doi:10.1016/j.epsr.2016.05.028. JCR: 1.809
Martín F, Calvillo CF, Sanchez Miralles A, Villar J, Söder L. Optimal Planning and
Operation of Distributed Energy Resources Considering Uncertainty on EVs. Smart
Cities Conf. 25-28 Oct. 2015, Guadalajara, Mexico: IEEE, p. 5–10.
doi:10.1109/ISC2.2015.7366186.
Calvillo CF, Sánchez-Miralles A, Villar J, Martín F. Optimal planning and operation of
aggregated distributed energy resources with market participation. Applied Energy
2016;182:340–57. doi:10.1016/j.apenergy.2016.08.117. JCR: 5.746
Sánchez-Miralles Á, Calvillo CF, Martín F, Villar J. Use of Renewable Energy Systems
in Smart Cities. Springer International Publishing; 2014. doi:10.1007/978-3-319-
03224-5.
Moreover, when this thesis was written, other papers were under review:
Martín-Martínez F, Sánchez-Miralles A, Rivier M. Calvillo CF. Centralized vs
distributed generation. A model to assess the relevance of some thermal and
electric factors. Application to the Spanish case study. Submitted to Energy. JCR:
4.292
Martín-Martínez F, Boal J, Sánchez-Miralles A. Business models for the aggregation
of distributed energy resources. Submitted to Electr Power Syst Res. JCR: 1.809
6.4 Future Work
In the hope that this dissertation inspires readers to continue research on these issues, some ideas to further extend the work presented, and that may open new research areas, are set forth below:
It might be interesting, for the application of this kind of model in real-time home energy optimizations, to have a more accurate modeling of the thermal behavior (using other RC-network models such as the ones presented in [167]) since direct solar lighting and people presence may be critical factors. It would require the installation of devices to track the human presence in the building and estimate the number of individuals and devices to measure solar irradiation to estimate the heat produced by the sun.
Nowadays, due to current regulatory frameworks, it is difficult to foresee non-isolated MGs freely deciding to operate disconnected or connected to the system. However, if this kind of operation, where the MG could decide to be connected or
6.4. Future Work
Modeling Tools for Planning and Operation of DERs and their Impact in Microgrids and Centralized Resources. 157
not based on economic profitability criterion, comes to be an option, some basic questions should be considered. In case there are different owners of generators or DER devices inside a MG, which are the mechanisms to set the energy supplied by their units and to settle the energy exchanged among them? On the other hand, even if the MG belongs to a single owner, what will it be the cost of connection of a grid that can operate disconnected long periods?, Should a maximum of disconnected hours per year be set? Many questions can tip the balance to choose a unique mode of operation, either connected to the grid or in stand-alone mode. For determining it, a model defining conditions for both modes of operation should be carried out to obtain the optimal installation mix.
More complex models at system level such as a bi-level equilibrium where the investment decision are taken in the upper level whereas the operation is solved in the lower level can be developed to allow a more detail modeling. However, in such cases finding a solution is not guaranteed and further research is required to tackle this kind of concern.
The models presented in the dissertation have not included uncertainties. Only the variations of environment conditions (solar irradiation, wind speeds, outdoor temperatures) throughout the year. However, since the data introduced in the model are average values, extreme values are not considered. Adding stochasticity, for instance, with different sets of demand profiles could be another future work.

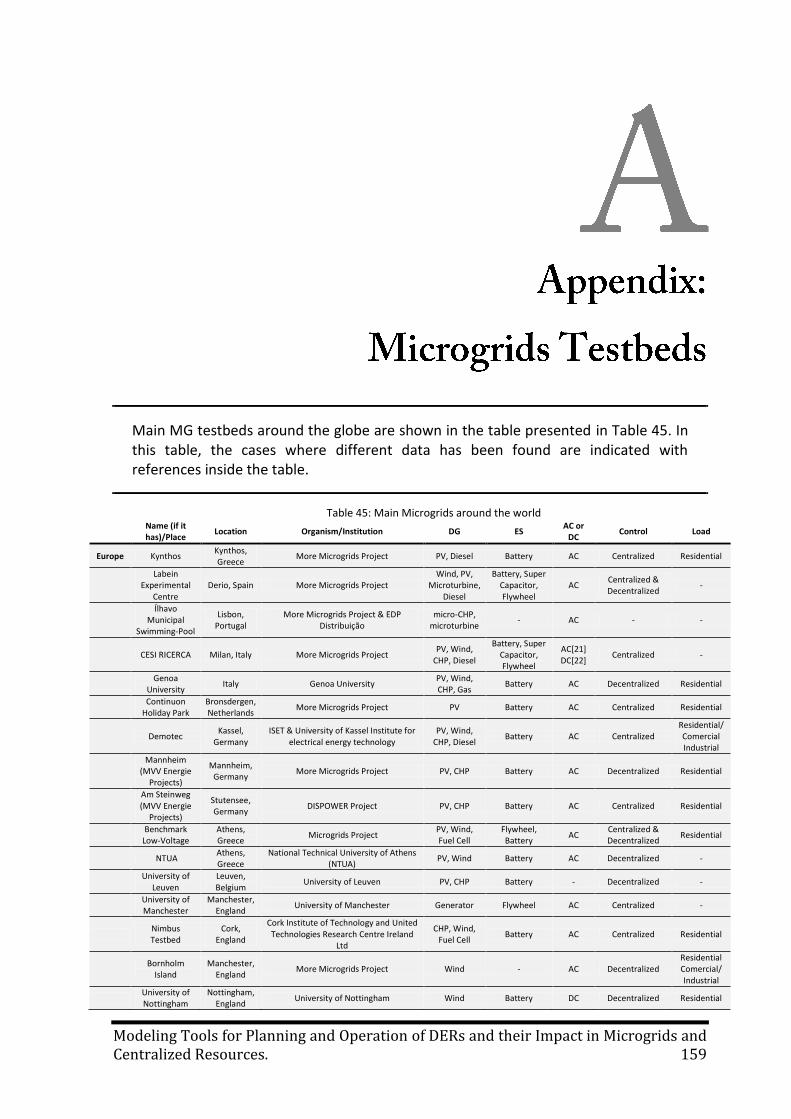
Modeling Tools for Planning and Operation of DERs and their Impact in Microgrids and Centralized Resources. 159
Main MG testbeds around the globe are shown in the table presented in Table 45. In this table, the cases where different data has been found are indicated with references inside the table.
Table 45: Main Microgrids around the world
Name (if it has)/Place
Location Organism/Institution DG ES AC or
DC Control Load
Europe Kynthos Kynthos, Greece
More Microgrids Project PV, Diesel Battery AC Centralized Residential
Labein Experimental
Centre Derio, Spain More Microgrids Project
Wind, PV, Microturbine,
Diesel
Battery, Super Capacitor, Flywheel
AC Centralized & Decentralized
-
Ílhavo Municipal
Swimming-Pool
Lisbon, Portugal
More Microgrids Project & EDP Distribuição
micro-CHP, microturbine
- AC - -
CESI RICERCA Milan, Italy More Microgrids Project
PV, Wind, CHP, Diesel
Battery, Super Capacitor, Flywheel
AC[21] DC[22]
Centralized -
Genoa
University Italy Genoa University
PV, Wind, CHP, Gas
Battery AC Decentralized Residential
Continuon
Holiday Park Bronsdergen, Netherlands
More Microgrids Project PV Battery AC Centralized Residential
Demotec
Kassel, Germany
ISET & University of Kassel Institute for electrical energy technology
PV, Wind, CHP, Diesel
Battery AC Centralized Residential/ Comercial Industrial
Mannheim (MVV Energie
Projects)
Mannheim, Germany
More Microgrids Project PV, CHP Battery AC Decentralized Residential
Am Steinweg (MVV Energie
Projects)
Stutensee, Germany
DISPOWER Project PV, CHP Battery AC Centralized Residential
Benchmark
Low-Voltage Athens, Greece
Microgrids Project PV, Wind, Fuel Cell
Flywheel, Battery
AC Centralized & Decentralized
Residential
NTUA
Athens, Greece
National Technical University of Athens (NTUA)
PV, Wind Battery AC Decentralized -
University of
Leuven Leuven, Belgium
University of Leuven PV, CHP Battery - Decentralized -
University of Manchester
Manchester, England
University of Manchester Generator Flywheel AC Centralized -
Nimbus Testbed
Cork, England
Cork Institute of Technology and United Technologies Research Centre Ireland
Ltd
CHP, Wind, Fuel Cell
Battery AC Centralized Residential
Bornholm
Island Manchester,
England More Microgrids Project Wind - AC Decentralized
Residential Comercial/ Industrial
University of Nottingham
Nottingham, England
University of Nottingham Wind Battery DC Decentralized Residential
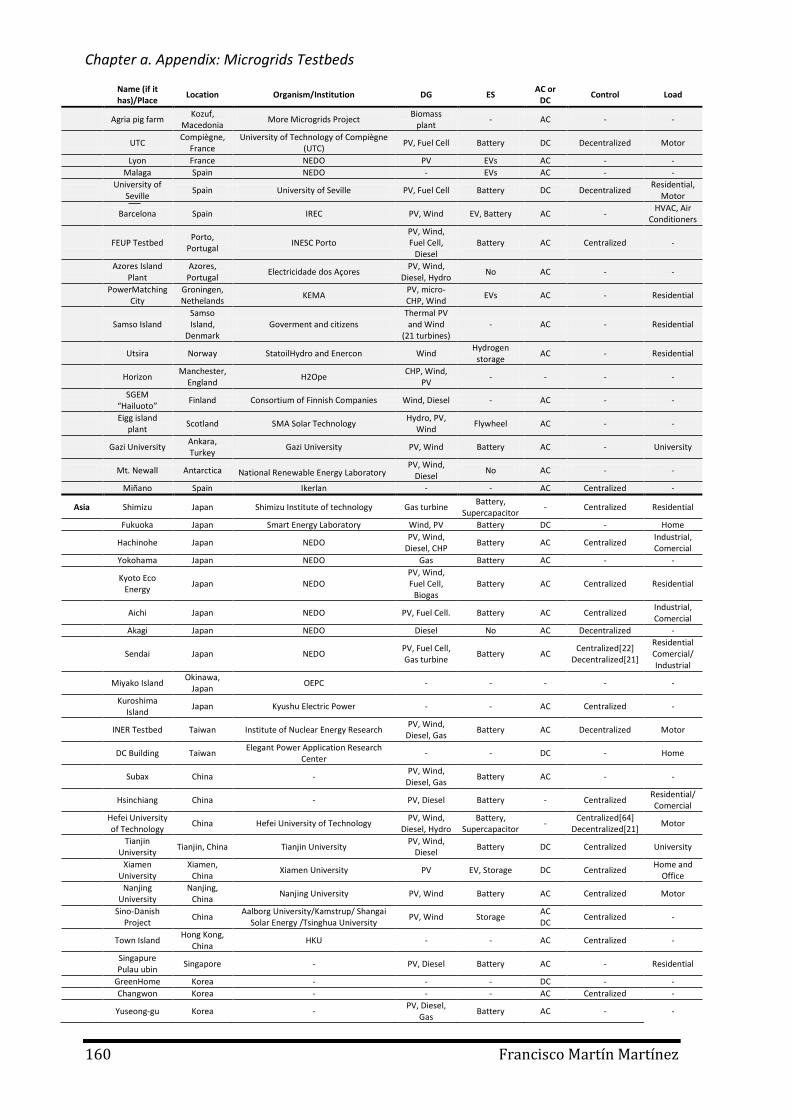
Chapter a. Appendix: Microgrids Testbeds
160 Francisco Martín Martínez
Name (if it has)/Place
Location Organism/Institution DG ES AC or
DC Control Load
Agria pig farm
Kozuf, Macedonia
More Microgrids Project Biomass
plant - AC - -
UTC Compiègne,
France University of Technology of Compiègne
(UTC) PV, Fuel Cell Battery DC Decentralized Motor
Lyon France NEDO PV EVs AC - -
Malaga Spain NEDO - EVs AC - -
University of
Seville Spain University of Seville PV, Fuel Cell Battery DC Decentralized
Residential, Motor
Barcelona Spain IREC PV, Wind EV, Battery AC -
HVAC, Air Conditioners
FEUP Testbed Porto,
Portugal INESC Porto
PV, Wind, Fuel Cell,
Diesel Battery AC Centralized -
Azores Island
Plant Azores, Portugal
Electricidade dos Açores PV, Wind,
Diesel, Hydro No AC - -
PowerMatching
City Groningen, Nethelands
KEMA PV, micro-CHP, Wind
EVs AC - Residential
Samso Island
Samso Island,
Denmark Goverment and citizens
Thermal PV and Wind
(21 turbines) - AC - Residential
Utsira Norway StatoilHydro and Enercon Wind
Hydrogen storage
AC - Residential
Horizon
Manchester, England
H2Ope CHP, Wind,
PV - - - -
SGEM
“Hailuoto” Finland Consortium of Finnish Companies Wind, Diesel - AC - -
Eigg island
plant Scotland SMA Solar Technology
Hydro, PV, Wind
Flywheel AC - -
Gazi University Ankara, Turkey
Gazi University PV, Wind Battery AC - University
Mt. Newall Antarctica National Renewable Energy Laboratory PV, Wind,
Diesel No AC - -
Miñano Spain Ikerlan - - AC Centralized -
Asia Shimizu Japan Shimizu Institute of technology Gas turbine Battery,
Supercapacitor - Centralized Residential
Fukuoka Japan Smart Energy Laboratory Wind, PV Battery DC - Home
Hachinohe Japan NEDO
PV, Wind, Diesel, CHP
Battery AC Centralized Industrial, Comercial
Yokohama Japan NEDO Gas Battery AC - -
Kyoto Eco
Energy Japan NEDO
PV, Wind, Fuel Cell,
Biogas Battery AC Centralized Residential
Aichi Japan NEDO PV, Fuel Cell. Battery AC Centralized
Industrial, Comercial
Akagi Japan NEDO Diesel No AC Decentralized -
Sendai Japan NEDO
PV, Fuel Cell, Gas turbine
Battery AC Centralized[22]
Decentralized[21]
Residential Comercial/ Industrial
Miyako Island
Okinawa, Japan
OEPC - - - - -
Kuroshima
Island Japan Kyushu Electric Power - - AC Centralized -
INER Testbed Taiwan Institute of Nuclear Energy Research PV, Wind,
Diesel, Gas Battery AC Decentralized Motor
DC Building Taiwan
Elegant Power Application Research Center
- - DC - Home
Subax China - PV, Wind,
Diesel, Gas Battery AC - -
Hsinchiang China - PV, Diesel Battery - Centralized
Residential/ Comercial
Hefei University of Technology
China Hefei University of Technology PV, Wind,
Diesel, Hydro Battery,
Supercapacitor -
Centralized[64] Decentralized[21]
Motor
Tianjin
University Tianjin, China Tianjin University
PV, Wind, Diesel
Battery DC Centralized University
Xiamen
University Xiamen,
China Xiamen University PV EV, Storage DC Centralized
Home and Office
Nanjing
University Nanjing,
China Nanjing University PV, Wind Battery AC Centralized Motor
Sino-Danish
Project China
Aalborg University/Kamstrup/ Shangai Solar Energy /Tsinghua University
PV, Wind Storage AC DC
Centralized -
Town Island
Hong Kong, China
HKU - - AC Centralized -
Singapure Pulau ubin
Singapore - PV, Diesel Battery AC - Residential
GreenHome Korea - - - DC - -
Changwon Korea - - - AC Centralized -
Yuseong-gu Korea -
PV, Diesel, Gas
Battery AC - -
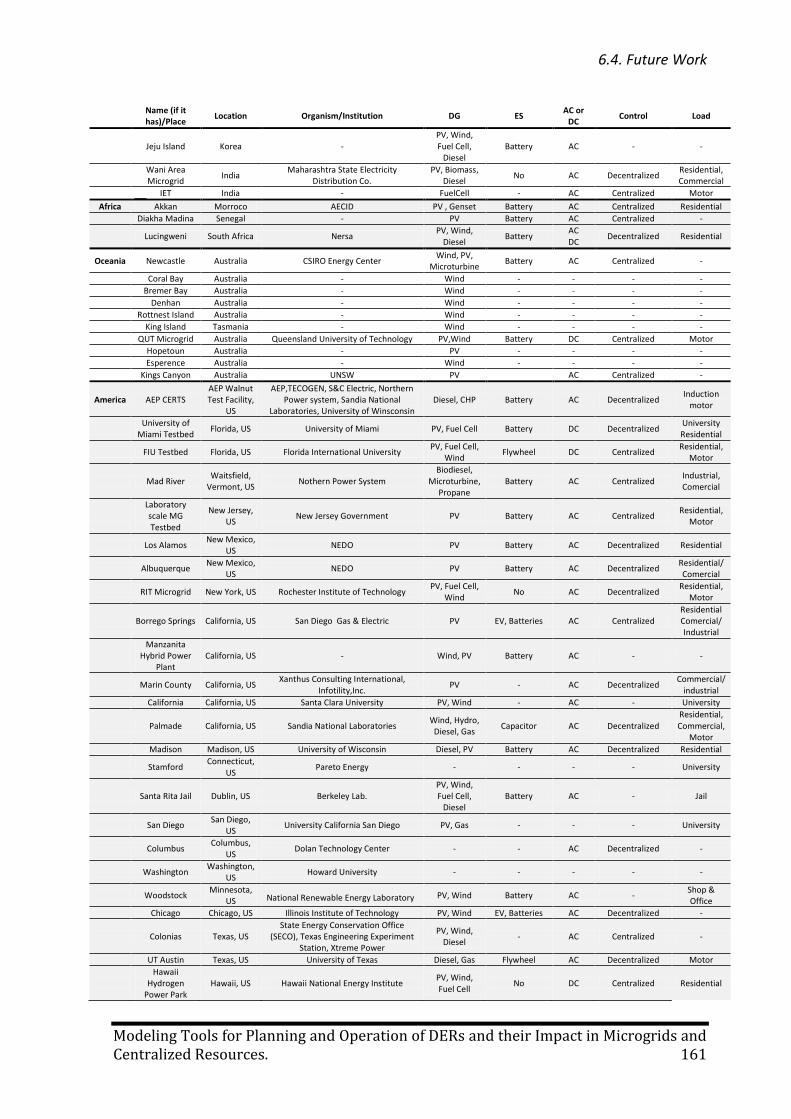
6.4. Future Work
Modeling Tools for Planning and Operation of DERs and their Impact in Microgrids and Centralized Resources. 161
Name (if it has)/Place
Location Organism/Institution DG ES AC or
DC Control Load
Jeju Island Korea -
PV, Wind, Fuel Cell,
Diesel Battery AC - -
Wani Area Microgrid
India Maharashtra State Electricity
Distribution Co. PV, Biomass,
Diesel No AC Decentralized
Residential, Commercial
IET India - FuelCell - AC Centralized Motor
Africa Akkan Morroco AECID PV , Genset Battery AC Centralized Residential
Diakha Madina Senegal - PV Battery AC Centralized -
Lucingweni South Africa Nersa
PV, Wind, Diesel
Battery AC DC
Decentralized Residential
Oceania Newcastle Australia CSIRO Energy Center Wind, PV,
Microturbine Battery AC Centralized -
Coral Bay Australia - Wind - - - -
Bremer Bay Australia - Wind - - - -
Denhan Australia - Wind - - - -
Rottnest Island Australia - Wind - - - -
King Island Tasmania - Wind - - - -
QUT Microgrid Australia Queensland University of Technology PV,Wind Battery DC Centralized Motor
Hopetoun Australia - PV - - - -
Esperence Australia - Wind - - - -
Kings Canyon Australia UNSW PV
AC Centralized -
America AEP CERTS AEP Walnut Test Facility,
US
AEP,TECOGEN, S&C Electric, Northern Power system, Sandia National
Laboratories, University of Winsconsin Diesel, CHP Battery AC Decentralized
Induction motor
University of
Miami Testbed Florida, US University of Miami PV, Fuel Cell Battery DC Decentralized
University Residential
FIU Testbed Florida, US Florida International University PV, Fuel Cell,
Wind Flywheel DC Centralized
Residential, Motor
Mad River Waitsfield,
Vermont, US Nothern Power System
Biodiesel, Microturbine,
Propane Battery AC Centralized
Industrial, Comercial
Laboratory scale MG Testbed
New Jersey, US
New Jersey Government PV Battery AC Centralized Residential,
Motor
Los Alamos New Mexico,
US NEDO PV Battery AC Decentralized Residential
Albuquerque New Mexico,
US NEDO PV Battery AC Decentralized
Residential/ Comercial
RIT Microgrid New York, US Rochester Institute of Technology PV, Fuel Cell,
Wind No AC Decentralized
Residential, Motor
Borrego Springs California, US San Diego Gas & Electric PV EV, Batteries AC Centralized Residential Comercial/ Industrial
Manzanita
Hybrid Power Plant
California, US - Wind, PV Battery AC - -
Marin County California, US Xanthus Consulting International,
Infotility,Inc. PV - AC Decentralized
Commercial/ industrial
California California, US Santa Clara University PV, Wind - AC - University
Palmade California, US Sandia National Laboratories Wind, Hydro,
Diesel, Gas Capacitor AC Decentralized
Residential, Commercial,
Motor
Madison Madison, US University of Wisconsin Diesel, PV Battery AC Decentralized Residential
Stamford Connecticut,
US Pareto Energy - - - - University
Santa Rita Jail Dublin, US Berkeley Lab. PV, Wind, Fuel Cell,
Diesel Battery AC - Jail
San Diego San Diego,
US University California San Diego PV, Gas - - - University
Columbus Columbus,
US Dolan Technology Center - - AC Decentralized -
Washington Washington,
US Howard University - - - - -
Woodstock Minnesota,
US National Renewable Energy Laboratory PV, Wind Battery AC - Shop & Office
Chicago Chicago, US Illinois Institute of Technology PV, Wind EV, Batteries AC Decentralized -
Colonias Texas, US State Energy Conservation Office
(SECO), Texas Engineering Experiment Station, Xtreme Power
PV, Wind, Diesel
- AC Centralized -
UT Austin Texas, US University of Texas Diesel, Gas Flywheel AC Decentralized Motor
Hawaii
Hydrogen Power Park
Hawaii, US Hawaii National Energy Institute PV, Wind, Fuel Cell
No DC Centralized Residential
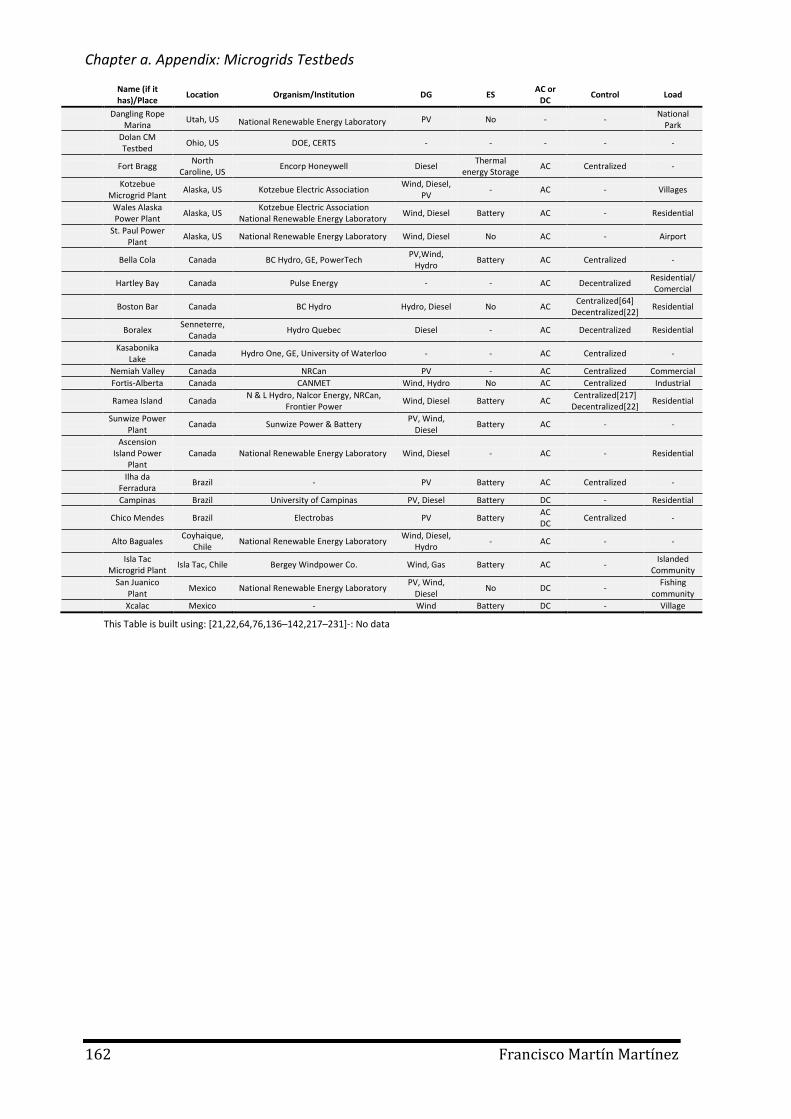
Chapter a. Appendix: Microgrids Testbeds
162 Francisco Martín Martínez
Name (if it has)/Place
Location Organism/Institution DG ES AC or
DC Control Load
Dangling Rope
Marina Utah, US National Renewable Energy Laboratory PV No - -
National Park
Dolan CM Testbed
Ohio, US DOE, CERTS - - - - -
Fort Bragg North
Caroline, US Encorp Honeywell Diesel
Thermal energy Storage
AC Centralized -
Kotzebue
Microgrid Plant Alaska, US Kotzebue Electric Association
Wind, Diesel, PV
- AC - Villages
Wales Alaska Power Plant
Alaska, US Kotzebue Electric Association
National Renewable Energy Laboratory Wind, Diesel Battery AC - Residential
St. Paul Power
Plant Alaska, US National Renewable Energy Laboratory Wind, Diesel No AC - Airport
Bella Cola Canada BC Hydro, GE, PowerTech PV,Wind,
Hydro Battery AC Centralized -
Hartley Bay Canada Pulse Energy - - AC Decentralized Residential/ Comercial
Boston Bar Canada BC Hydro Hydro, Diesel No AC Centralized[64]
Decentralized[22] Residential
Boralex Senneterre,
Canada Hydro Quebec Diesel - AC Decentralized Residential
Kasabonika
Lake Canada Hydro One, GE, University of Waterloo - - AC Centralized -
Nemiah Valley Canada NRCan PV - AC Centralized Commercial
Fortis-Alberta Canada CANMET Wind, Hydro No AC Centralized Industrial
Ramea Island Canada N & L Hydro, Nalcor Energy, NRCan,
Frontier Power Wind, Diesel Battery AC
Centralized[217] Decentralized[22]
Residential
Sunwize Power
Plant Canada Sunwize Power & Battery
PV, Wind, Diesel
Battery AC - -
Ascension
Island Power Plant
Canada National Renewable Energy Laboratory Wind, Diesel - AC - Residential
Ilha da
Ferradura Brazil - PV Battery AC Centralized -
Campinas Brazil University of Campinas PV, Diesel Battery DC - Residential
Chico Mendes Brazil Electrobas PV Battery AC DC
Centralized -
Alto Baguales Coyhaique,
Chile National Renewable Energy Laboratory
Wind, Diesel, Hydro
- AC - -
Isla Tac
Microgrid Plant Isla Tac, Chile Bergey Windpower Co. Wind, Gas Battery AC -
Islanded Community
San Juanico
Plant Mexico National Renewable Energy Laboratory
PV, Wind, Diesel
No DC - Fishing
community
Xcalac Mexico - Wind Battery DC - Village
This Table is built using: [21,22,64,76,136–142,217–231]-: No data
Modeling Tools for Planning and Operation of DERs and their Impact in Microgrids and Centralized Resources. 163
This appendix explains the two optimization models used for fitting the parameters of the heating model proposed in section 3.3.
2.1 First stage: Select the initial parameters values
Typical values are used to build a grid in order to use a Mix integer programming to find the initial values to be used in the second part (107)-(113). The idea was obtained from [179] where authors use a grid of possible values to remove a similar non-linearity. The sets, parameters and equations used in this part are described below:
sets
i time samples except the first one: 2…number of samples
n number of division for building the C axis of the grid
m number of division for building the UA axis of the grid
Variables
k Auxiliary variable to reduce the numbers used. It is equivalent to 1000/C.
RUA Resistance of the overall heat transfer co-efficient
σn,m Binary variable that indicates the corner of the grid.
Estimated indoor temperature
P, N Deviations between calculated and real temperatures
Parameter
Value of the C axis (kWh/ºC)
Value of the RUA axis (ºC/ kW [178])
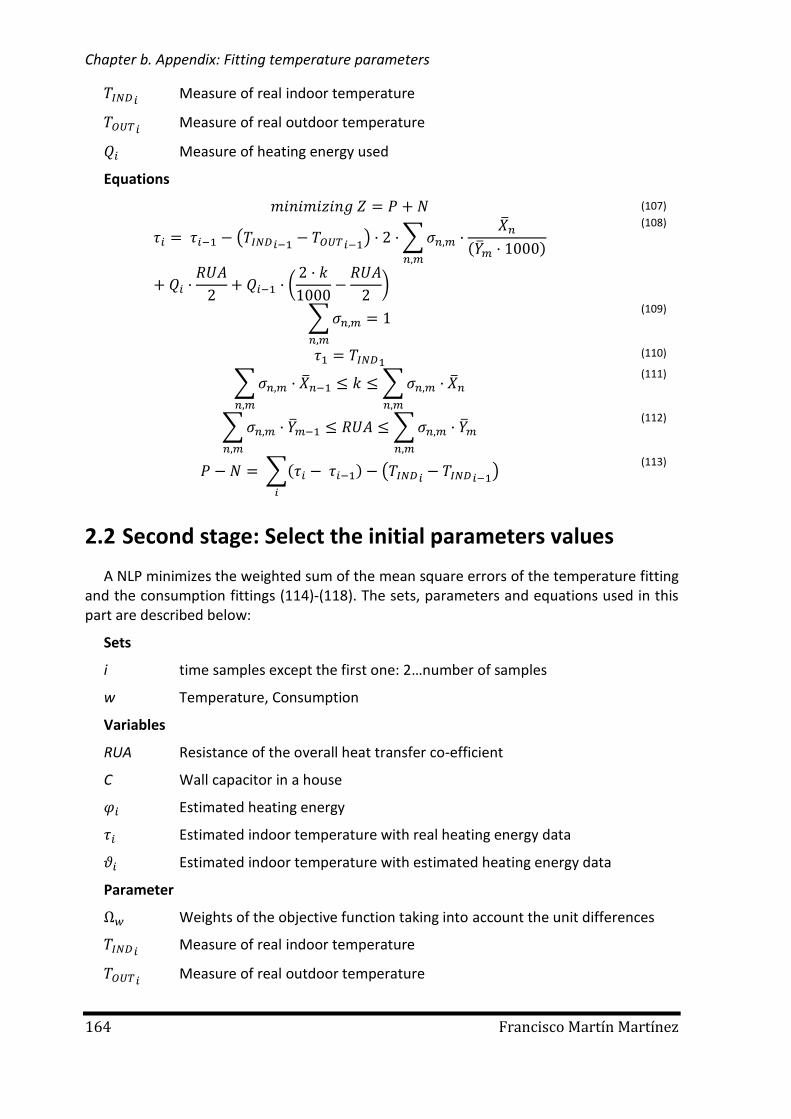
Chapter b. Appendix: Fitting temperature parameters
164 Francisco Martín Martínez
Measure of real indoor temperature
Measure of real outdoor temperature
Measure of heating energy used
Equations
(107)
( ) ∑
( )
(
)
(108)
∑
(109)
(110)
∑
∑
(111)
∑
∑
(112)
∑( ) ( )
(113)
2.2 Second stage: Select the initial parameters values
A NLP minimizes the weighted sum of the mean square errors of the temperature fitting and the consumption fittings (114)-(118). The sets, parameters and equations used in this part are described below:
Sets
i time samples except the first one: 2…number of samples
w Temperature, Consumption
Variables
RUA Resistance of the overall heat transfer co-efficient
C Wall capacitor in a house
Estimated heating energy
Estimated indoor temperature with real heating energy data
Estimated indoor temperature with estimated heating energy data
Parameter
Weights of the objective function taking into account the unit differences
Measure of real indoor temperature
Measure of real outdoor temperature
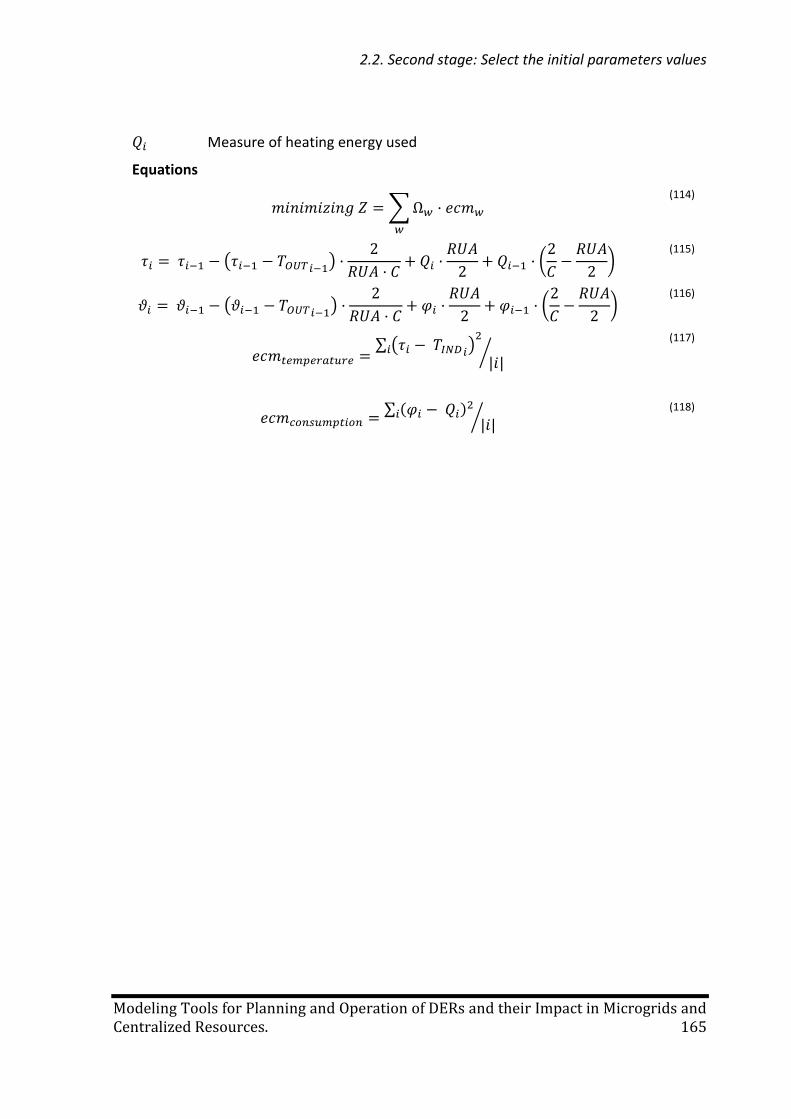
2.2. Second stage: Select the initial parameters values
Modeling Tools for Planning and Operation of DERs and their Impact in Microgrids and Centralized Resources. 165
Measure of heating energy used
Equations
∑
(114)
( )
(
)
(115)
( )
(
)
(116)
∑ ( )
⁄
(117)
∑ ( )
⁄ (118)
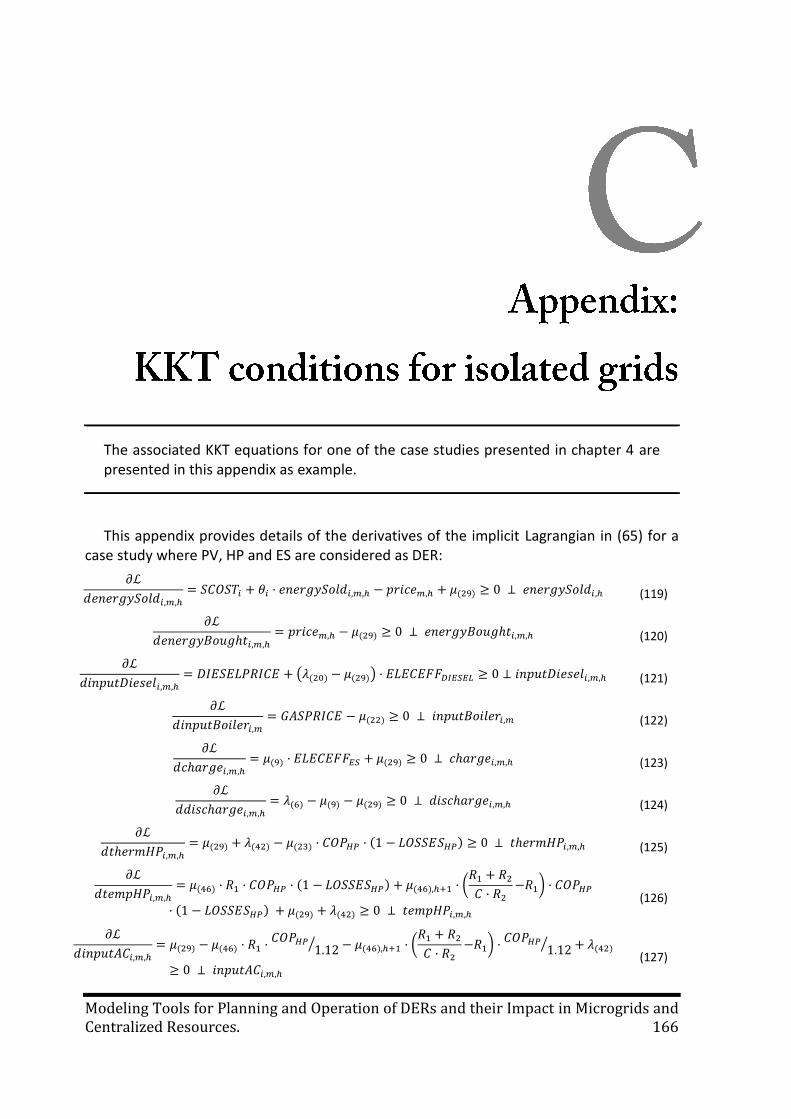
Modeling Tools for Planning and Operation of DERs and their Impact in Microgrids and Centralized Resources. 166
The associated KKT equations for one of the case studies presented in chapter 4 are presented in this appendix as example.
This appendix provides details of the derivatives of the implicit Lagrangian in (65) for a case study where PV, HP and ES are considered as DER:
( ) (119)
( ) (120)
( ( ) ( )) (121)
( ) (122)
( ) ( ) (123)
( ) ( ) ( ) (124)
( ) ( ) ( ) ( ) (125)
( ) ( ) ( ) (
)
( ) ( ) ( ) (126)
( ) ( )
⁄ ( ) (
)
⁄ ( )
(127)
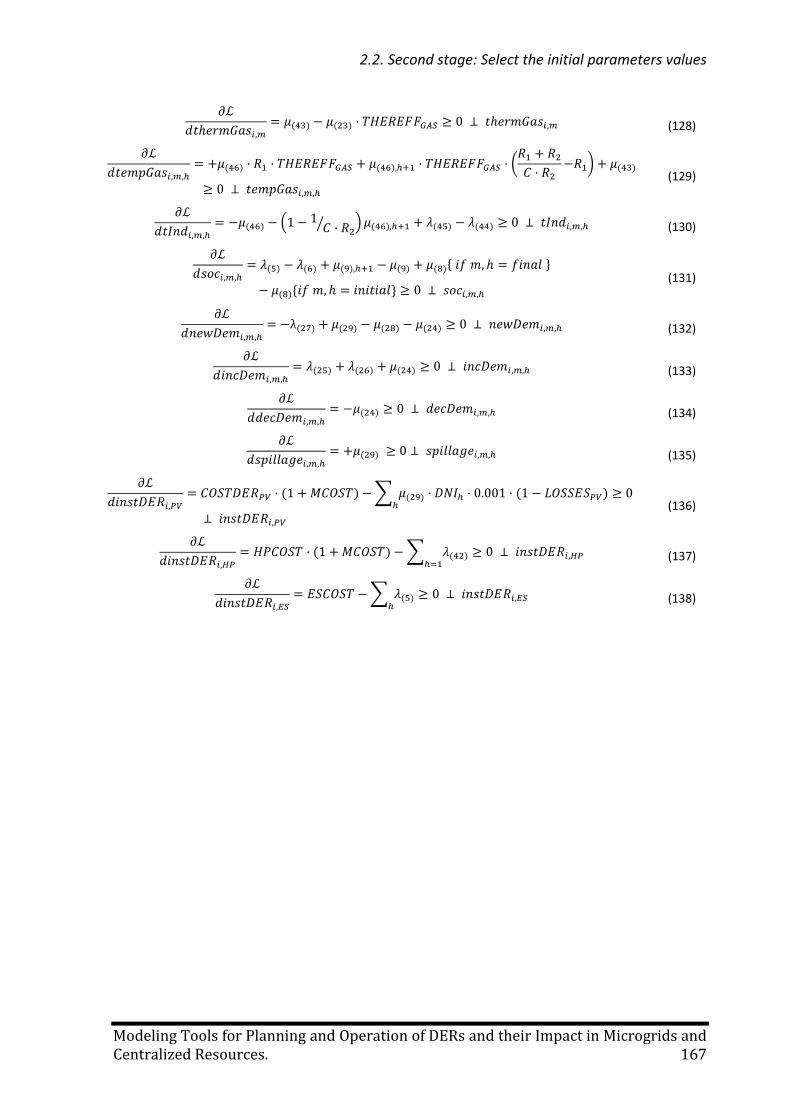
2.2. Second stage: Select the initial parameters values
Modeling Tools for Planning and Operation of DERs and their Impact in Microgrids and Centralized Resources. 167
( ) ( ) (128)
( ) ( ) (
) ( )
(129)
( ) (
⁄ ) ( ) ( ) ( ) (130)
( ) ( ) ( ) ( ) ( )* +
( )* + (131)
( ) ( ) ( ) ( ) (132)
( ) ( ) ( ) (133)
( ) (134)
( ) (135)
( ) ∑ ( ) ( )
(136)
( ) ∑ ( )
(137)
∑ ( )
(138)

Modeling Tools for Planning and Operation of DERs and their Impact in Microgrids and Centralized Resources. 169
[1] Calvillo CF, Sánchez-Miralles A, Villar J, Martín F. Optimal planning and operation of aggregated distributed energy resources with market participation. Appl Energy 2016;182:340–57. doi:10.1016/j.apenergy.2016.08.117.
[2] Martin-Martínez F, Sánchez-Miralles A, Rivier M. A literature review of Microgrids: A functional layer based classification. Renew Sustain Energy Rev 2016;62:1133–53. doi:10.1016/j.rser.2016.05.025.
[3] United States Department of Energy. “Grid2030”. A National Vision for Electricity’s Second 100 years. 2003.
[4] International Energy Agency. Smart Grids, Technology Roadmap. 2011.
[5] DTE Energy. Demand Response Overview and Pilot Concepts. 2007.
[6] Lasseter R, Akhil A, Marnay C, Stephens J, Dagle J, Guttromson R, et al. White Paper on Integration of Distributed Energy Resources The CERTS MicroGrid Concept. 2002.
[7] Dimeas AL, Member S, Hatziargyriou ND, Member S. Operation of a Multiagent System for Microgrid Control. IEEE Trans Power Syst 2005;20:1447–55.
[8] CEN-CENELEC-ETSI Smart Grid Coordination Group – Sustainable Processes. SG-CG/M490/E - Part E: Smart Grid Use Case Management Process. 2012.
[9] Boroyevich D, Cvetkovic I, Burgos R. Intergrid : A Future Electronic Energy Network ? IEEE J Emerg Sel Top Power Electron 2013;1:127–38.
[10] Madureira AG. Coordinated and optimized voltage management of distribution networks with multi-microgrids. Universidade do Porto, Facultade de Engenharia, 2010.
[11] Jiayi H, Chuanwen J, Rong X. A review on distributed energy resources and MicroGrid. Renew Sustain Energy Rev 2008;12:2472–83. doi:10.1016/j.rser.2007.06.004.
[12] Steimer PK. Enabled by high power electronics-Energy efficiency, renewables and smart grids. Int. Power Electron. Conf., Switzerland: 2010, p. 11–5.
[13] Wu TF, Chen YK, Yu GR, Chang Y-C. Design and development of dc-distributed system with grid connection for residential applications. 8th Int. Conf. Power Electron. ECCE Asia, Ieee; 2011, p. 235–41.
[14] Salomonsson D, Sannino A. Low-Voltage DC Distribution System for Commercial Power Systems With Sensitive Electronic Loads. IEEE Trans Power Deliv 2007;22:1620–7.
[15] Byeon G, Lee H, Yoon T, Jang G, Chae W, Kim J. A research on the characteristics of fault current of DC distribution system and AC distribution system. 8th Int. Conf. Power Electron. ECCE Asia, Ieee; 2011, p. 543–50.
[16] Piegari L, Tironi E, Musolino V, Grillo S, Tornelli C. DC Islands in AC Smart Grids. IEEE
References
170 Francisco Martín Martínez
Trans Power Electron 2014;29:89–98.
[17] IEEE Standards. A Call for Participation: IEEE Plan for “DC in the Home” 2013. http://standards.ieee.org/email/2013_10_cfp_dchome_web.html (accessed July 27, 2015).
[18] Jiang Z, Dougal R a. Hierarchical microgrid paradigm for integration of distributed energy resources. IEEE Power Energy Soc. 2008 Gen. Meet. Convers. Deliv. Electr. Energy 21st Century, PES, 2008, p. 1–8. doi:10.1109/PES.2008.4596185.
[19] Evans MAV. Why Low Voltage Direct Current Grids ? Delft University of Technology, 2013.
[20] Xu CD, Cheng KWE. A survey of distributed power system AC versus DC distributed power system. 2011 4th Int. Conf. Power Electron. Syst. Appl., Ieee; 2011, p. 1–12.
[21] Planas E, Gil-de-Muro A, Andreu J, Kortabarria I, Martínez de Alegría I. General aspects, hierarchical controls and droop methods in microgrids: A review. Renew Sustain Energy Rev 2013;17:147–59. doi:10.1016/j.rser.2012.09.032.
[22] Hossain E, Kabalci E, Bayindir R, Perez R. Microgrid testbeds around the world: State of art. Energy Convers Manag 2014;86:132–53. doi:10.1016/j.enconman.2014.05.012.
[23] Nayar CV, Phillips SJ, James WL, Pryor TL, Remmer D. Novel wind/diesel/battery hybrid energy system. Sol Energy 1993;51:65–78. doi:10.1016/0038-092X(93)90043-N.
[24] Muhammad H.Rashid. Power Electronics Handbook Devices, Circuits and Applications. 3rd Editio. ELSEVIER; 2011.
[25] Adda R, Ray O, Mishra SK, Joshi A. Synchronous-Reference-Frame-Based Control of Switched Boost Inverter for Standalone DC Nanogrid Applications. IEEE Trans Power Electron 2013;28:1219–33.
[26] Ray O, Member S, Mishra S, Member S. Boost-Derived Hybrid Converter with Simultaneous DC and AC Outputs. IEEE Trans Ind Appl 2013;PP. doi:10.1109/TIA.2013.2271874.
[27] Calvillo CF, Sánchez-Miralles Á, Villar J. Energy Management in Smart Cities - A review. To Be Publ 2013.
[28] Sánchez-Miralles Á, Calvillo CF, Martín F, Villar J. Use of Renewable Energy Systems in Smart Cities. Springer International Publishing; 2014. doi:10.1007/978-3-319-03224-5.
[29] Calvillo CF, Sánchez-Miralles Á, Villar J. Distributed Energy Generation in Smart Cities. 2nd Int. Conf. Renew. Energy Res. Appl. - ICRERA 2013. ISBN 978-1-4799-1464-7, Madrid, España: 2013, p. 161–6.
[30] IDAE. Análisis del consumo energético del sector residencial en España. 2011.
[31] Proyecto INDEL. ATLAS de la demanda eléctrica española. 1998.
[32] Gungor VC, Sahin D, Kocak T, Ergut S, Buccella C, Cecati C, et al. A Survey on Smart Grid Potential Applications and Communication Requirements. IEEE Trans Ind
References
Modeling Tools for Planning and Operation of DERs and their Impact in Microgrids and Centralized Resources. 171
Informatics 2013;9:28–42. doi:10.1109/TII.2012.2218253.
[33] Gao J, Xiao Y, Liu J, Liang W, Chen CLP. A survey of communication/networking in Smart Grids. Futur Gener Comput Syst 2012;28:391–404. doi:10.1016/j.future.2011.04.014.
[34] Niyato D, Xiao L, Wang P. Machine-to-machine communications for home energy management system in smart grid. IEEE Commun Mag 2011;49:53–9.
[35] Ancillotti E, Bruno R, Conti M. The Role of Communication Systems in Smart Grids: Architectures, Technical Solutions and Research Challenges. Comput Commun 2013. doi:10.1016/j.comcom.2013.09.004.
[36] Yi P, Iwayemi A, Zhou C. Building Automation Networks for Smart Grids. Int J Digit Multimed Broadcast 2011;2011:1–12. doi:10.1155/2011/926363.
[37] Usman A, Shami SH. Evolution of Communication Technologies for Smart Grid applications. Renew Sustain Energy Rev 2012;19:191–9. doi:10.1016/j.rser.2012.11.002.
[38] Amin R, Martin J. Smart Grid Communication using Next Generation Heterogeneous Wireless Networks. IEEE SmartGridCom, 2012, p. 229–34.
[39] DTE Energy. DTE Smart Grid vision White Paper. 2009.
[40] Zaballos A, Vallejo A, Selga J. Heterogeneous communication architecture for the smart grid. Ieee Netw 2011;25:30–7.
[41] Parikh PP, Kanabar MG, Sidhu TS. Opportunities and challenges of wireless communication technologies for smart grid applications. Power Energy Soc. Gen. Meet. 2010 IEEE, Ieee; 2010, p. 1–7.
[42] Nthontho M, Chowdhury SP, Winberg S. Smart communication networks standards for smart energy management. 2011 IEEE 33rd Int. Telecommun. Energy Conf. INTELEC, Ieee; 2011, p. 1–9.
[43] Lu C, Wu Q. Interconnecting ZigBee and 6LoWPAN wireless sensor networks for smart grid applications. Fifth Int. Conf. Sens. Technol., IEEE; 2011, p. 267–72. doi:10.1109/ICSensT.2011.6136979.
[44] Budjei C, Moraru S. Wireless Communication Standards for intelligent buildings. 21st Int. DAAAM Symp., 2010, p. 489–91.
[45] FP7 Projects. SmartC2Net (Smart Control of Energy Distribution Grids over Heterogeneous Communication Networks): D3.1 Preliminary SmartC2Net Communication Architecture and Interfaces WP3 Adaptive Communication. 2013. doi:10.1016/S0022-3913(12)00047-9.
[46] Brown J, Khan JY. Key performance aspects of an LTE FDD based Smart Grid communications network. Comput Commun 2013;36:551–61. doi:10.1016/j.comcom.2012.12.007.
[47] International Society of Automation. ISA100, Wireless Systems for Automation n.d. https://www.isa.org/isa100/ (accessed July 27, 2015).
[48] OGEMA (Open Gateway Energy Management Alliance) n.d. http://www.ogema.org/
References
172 Francisco Martín Martínez
(accessed July 27, 2015).
[49] Indra. SOFIA project n.d. http://www.indracompany.com/sostenibilidad-e-innovacion/proyectos-innovacion/sofia-objetos-inteligentes-para-aplicaciones-inteli (accessed July 27, 2015).
[50] Lampkin V, Leong W, Olivera L. Building Smarter Planet Solutions with MQTT and IBM WebSphere MQ Telemetry. IBM Redbooks 2012.
[51] European Comission. FIWARE Open APIs for open minds n.d. www.fiware.org (accessed July 28, 2015).
[52] Maryland Energy Administration. Resiliency through Microgrids Task Force Established 2014. http://energy.maryland.gov/documents/ResiliencyThroughMicrogridsTaskForceEstablished.pdf (accessed March 24, 2014).
[53] Sandia National Laboratories. SPIDERS: The Smart Power Infrastructure Demonstration for Energy Reliability and Security. Infrastruct Secur | Electr Energy Assur 2012. http://energy.sandia.gov/wp/wp-content/gallery/uploads/SPIDERS_Fact_Sheet_2012-1431P.pdf (accessed March 24, 2014).
[54] Marnay C, Lai J, Stadler M, Siddiqui A. Added Value of Reliability to a Microgrid: Simulations of Three California Buildings. Cigré Integr. Wide-Scale Renew. Resour. into Power Deliv. Syst., Calfary, Canada: 2009, p. 9.
[55] Costa PM, Matos M a. Assessing the contribution of microgrids to the reliability of distribution networks. Electr Power Syst Res 2009;79:382–9. doi:10.1016/j.epsr.2008.07.009.
[56] Foote CET, Burt GM, Wasiak I, Mienski R, Pawelek R, Gburczyk P, et al. A Power-Quality Management Algorithm for Low-Voltage Grids With Distributed Resources. IEEE Trans Power Deliv 2008;23:1055–62. doi:10.1109/TPWRD.2007.905560.
[57] Costa PM, Matos M a. Avoided losses on LV networks as a result of microgeneration. Electr Power Syst Res 2009;79:629–34. doi:10.1016/j.epsr.2008.09.014.
[58] Gomes MH, Saraiva JT. Allocation of reactive power support, active loss balancing and demand interruption ancillary services in MicroGrids. Electr Power Syst Res 2010;80:1267–76. doi:10.1016/j.epsr.2010.04.013.
[59] Vasquez JC, Guerrero JM, Miret J, Castilla M, Vicuña LG de. Hierarchical Control of Intelligent Microgrids. IEEE Ind Electron Mag 2010:23–9. doi:10.1109/MIE.2010.938720.
[60] Zachar M, Trifkovic M, Daoutidis P. Policy effects on microgrid economics, technology selection, and environmental impact. Comput Chem Eng 2015;81:364–75. doi:10.1016/j.compchemeng.2015.03.012.
[61] Wooldridge M. Intelligent Agents. In: Weiss G, editor. Multiagent Syst., vol. 35, MIT Press; 1999, p. 51. doi:10.1002/humu.22546.
[62] Ramachandran B, Srivastava SK, Edrington CS, Cartes DA. An Intelligent Auction Scheme for Smart Grid Market Using a Hybrid Immune Algorithm. IEEE Trans Ind
References
Modeling Tools for Planning and Operation of DERs and their Impact in Microgrids and Centralized Resources. 173
Electron 2011;58:4603–12.
[63] Logenthiran T, Srinivasan D, Khambadkone AM. Multi-agent system for energy resource scheduling of integrated microgrids in a distributed system. Electr Power Syst Res 2011;81:138–48. doi:10.1016/j.epsr.2010.07.019.
[64] Su W, Wang J. Energy Management Systems in Microgrid Operations. Electr J 2012;25:45–60. doi:10.1016/j.tej.2012.09.010.
[65] Colson CM, Nehrir MH. Algorithms for distributed decision-making for multi-agent microgrid power management. 2011 IEEE Power Energy Soc Gen Meet 2011:1–8.
[66] Soroudi A, Ehsan M. A distribution network expansion planning model considering distributed generation options and techo-economical issues. Energy 2010;35:3364–74. doi:10.1016/j.energy.2010.04.022.
[67] Calvillo CF, Sánchez-Miralles Á, Villar J. Evaluation and optimal scaling of distributed generation systems in a smart city. 8th Int. Conf. Urban Regen. Sustanability ISBN 978-1-84564-746-9, Putrajaya, Malasia: 2013, p. 845–57. doi:10.2495/SC130722.
[68] Calvillo CF, Sánchez-Miralles Á, Villar J. Assessing low voltage network constraints in distributed energy resources planning. Energy 2015;84:783–93. doi:10.1016/j.energy.2015.03.044.
[69] Foley AM, Ó Gallachóir BP, Hur J, Baldick R, McKeogh EJ. A strategic review of electricity systems models. Energy 2010;35:4522–30. doi:10.1016/j.energy.2010.03.057.
[70] Bhattacharyya SC, Timilsina GR. A review of energy system models. Int J Energy Sect Manag 2010;4:494–518. doi:10.1108/17506221011092742.
[71] Connolly D, Lund H, Mathiesen BV, Leahy M. A review of computer tools for analysing the integration of renewable energy into various energy systems. Appl Energy 2010;87:1059–82. doi:10.1016/j.apenergy.2009.09.026.
[72] E+ Project. Intelligent Energy Neighbourhoods n.d. http://www.eplusproject.eu/index.aspx (accessed July 28, 2015).
[73] Krishna RM, Daniel SA. Design methodology for autonomous operation of a Micro-grid. Int. Conf. Electr. Electron. Eng., IEEE; 2009, p. 40–3.
[74] Katiraei F, Member S, Iravani MR, Lehn PW. Micro-Grid Autonomous Operation During and Subsequent to Islanding Process. IEEE Trans Power Deliv 2005;20:248–57. doi:10.1109/TPWRD.2004.835051.
[75] Gouveia C, Moreira J, Moreira CL, Lopes JAP, Member S. Coordinating Storage and Demand Response for Microgrid Emergency Operation. IEEE Trans Smart Grid 2013;4:1898–908.
[76] More Microgrids Project, Microgrids Project. www.microgrids.eu n.d. http://www.microgrids.eu/default.php.
[77] More Microgrid Project. Advanced Architectures and Control Concepts for More Microgrids: WPG . Evaluation of the system performance on power system operation. DG3 & DG4. Report on the technical, social, economic, and environmental
References
174 Francisco Martín Martínez
benefits provided by Microgrids on power system . 2009.
[78] More Microgrids Project. Advanced Architectures and Control Concepts for Deliverable DD4: Definition of Ancillary Services and Short-Term Energy Markets WPD. 2009.
[79] Morais H, Kádár P, Faria P, Vale Z a., Khodr HM. Optimal scheduling of a renewable micro-grid in an isolated load area using mixed-integer linear programming. Renew Energy 2010;35:151–6. doi:10.1016/j.renene.2009.02.031.
[80] Conchado A, Linares P. Gestión activa de la demanda eléctrica doméstica : beneficios y costes. 2008.
[81] Federal Energy Regulatory Commission. Assessment of Demand Response & Advanced Metering. 2012.
[82] Rocky Mountain Institute. Demand Response: An Introduction. Overview of programs, technologies, and lessons learned. 2006.
[83] Capgemini, VAASA ETT, Enerdata. Demand Response : a decisive breakthrough for Europe. 2008.
[84] Van Horn K, Gross G. Demand Response Resources Are Not All They’re Made Out to Be: The Payback Effects Severely Reduce the Reported DRR Economic and Emission Benefits. Electr J 2013;26:86–97. doi:10.1016/j.tej.2013.07.008.
[85] Conchado A, Linares P. Estimación de los beneficios de la gestión activa de la demanda. Revisión del estado del arte y propuestas. Cuad. Económicos ICE, 2010, p. 187–212.
[86] Aghaei J, Alizadeh M-I. Demand response in smart electricity grids equipped with renewable energy sources: A review. Renew Sustain Energy Rev 2013;18:64–72. doi:10.1016/j.rser.2012.09.019.
[87] Ahmad Faruqui, Hledik R. The state of demand response in california. 2007.
[88] International Energy Agency. The power to choose the Demand Response in Liberalised Markets. 2003.
[89] Pourmousavi SA, Nehrir MH. Real-Time Central Demand Response for Primary Frequency Regulation in Microgrids. IEEE Trans Smart Grid 2012;3:1988–96.
[90] Giusti A, Salani M, Di Caro G a., Rizzoli AE, Gambardella LM. Restricted Neighborhood Communication Improves Decentralized Demand-Side Load Management. IEEE Trans Smart Grid 2014;5:92–101. doi:10.1109/TSG.2013.2267396.
[91] Gkatzikis L, Koutsopoulos I, Salonidis T. The Role of Aggregators in Smart Grid Demand Response Markets. IEEE J Sel Areas Commun 2013;31:1247–57.
[92] Kim H, Thottan M. A Two-Stage Market Model for Microgrid Power Transactions via Aggregators 2011;16:101–7. doi:10.1002/bltj.
[93] FP7 Projects. ADDRESS Project n.d. http://www.addressfp7.org/ (accessed July 27, 2015).
[94] EU-DEEP Consortium. EU-DEEP project n.d.
References
Modeling Tools for Planning and Operation of DERs and their Impact in Microgrids and Centralized Resources. 175
http://www.eudeep.com/index.php?id=397 (accessed July 27, 2015).
[95] Guerrero JM, Vasquez JC, Matas J, De Vicuna LG, Castilla M. Hierarchical Control of Droop-Controlled AC and DC Microgrids — A General Approach Toward Standardization. IEEE Trans Ind Electron 2011;58:158–72.
[96] Justo JJ, Mwasilu F, Lee J, Jung J-W. AC-microgrids versus DC-microgrids with distributed energy resources: A review. Renew Sustain Energy Rev 2013;24:387–405. doi:10.1016/j.rser.2013.03.067.
[97] Guerrero JM, Chandorkar M, Lee T, Loh PC. Advanced Control Architectures for Intelligent Microgrids — Part I : Decentralized and Hierarchical Control. IEEE Trans Ind Electron 2013;60:1254–62.
[98] Vandoorn TL, Member S, Meersman B. A Control Strategy for Islanded Microgrids With DC-Link Voltage Control. IEEE Trans POWER Deliv 2011;26:703–13.
[99] Vandoorn TL, Zwaenepoel B, Kooning JDM De, Meersman B, Vandevelde L. Smart microgrids and virtual power plants in a hierarchical control structure. 2nd IEEE PES Int. Conf. Exhib. Innov. Smart Grid Technol., Ieee; 2011, p. 1–7.
[100] Vandoorn TL, Member S, Meersman B, Kooning JDM De, Vandevelde L, Member S. Analogy Between Conventional Grid Control and Islanded Microgrid Control Based on a Global DC-Link Voltage Droop. IEEE Trans POWER Deliv 2012;27:1405–14.
[101] Cvetkovic I, Thacker T, Dong DDD, Francis G, Podosinov V, Boroyevich D, et al. Future home uninterruptible renewable energy system with vehicle-to-grid technology. IEEE Energy Convers. Congr. Expo., San Jose, CA: Ieee; 2009, p. 2675–81.
[102] Peças Lopes J a., Polenz S a., Moreira CL, Cherkaoui R. Identification of control and management strategies for LV unbalanced microgrids with plugged-in electric vehicles. Electr Power Syst Res 2010;80:898–906. doi:10.1016/j.epsr.2009.12.013.
[103] Pérez-arriaga I. THINK project, TOPIC 12: From distribution networks to smart distribution systems : Rethinking the regulation of European DSOs. 2013.
[104] Lund H, Kempton W. Integration of renewable energy into the transport and electricity sectors through V2G. Energy Policy 2008;36:3578–87. doi:10.1016/j.enpol.2008.06.007.
[105] Dallinger D, Krampe D, Wietschel M. Vehicle-to-Grid Regulation Reserves Based on a Dynamic Simulation of Mobility Behavior. IEEE Trans Smart Grid 2011;2:302–13. doi:10.1109/TSG.2011.2131692.
[106] Han S, Han S, Sezaki K. Development of an Optimal Vehicle-to-Grid Aggregator for Frequency Regulation. IEEE Trans Smart Grid 2010;1:65–72.
[107] Sánchez-Miralles Á, Gómez T, Fernández IJ, Calvillo CF. Business Models towards the Effective Integration of Electric Vehicles in the Grid n.d.
[108] Galus MD, Andersson G. Balancing Renewable Energy Source with Vehicle to Grid Services from a Large Fleet of Plug-In Hybrid Electric Vehicles controlled in a Metropolitan Area Distribution Network. ETH Zurich – Power Systems Laboratory Physikstrasse 3, 8092 Zurich Switzerland: 2011.
References
176 Francisco Martín Martínez
[109] Lopes J a P, Soares FJ, Almeida PMR. Integration of Electric Vehicles in the Electric Power System. Proc IEEE 2011;99:168–83.
[110] Binding C, Gantenbein D, Jansen B, Sundstr O. Electric Vehicle Fleet Integration in the Danish EDISON Project - A Virtual Power Plant on the Island of Bornholm 2010:1–8.
[111] Jansen JC, Welle A van der, Nieuwenhout F. Deliverable D3.2.4: The virtual power plant concept from an eco- nomic perspective: updated final report. vol. 31. 2008.
[112] Jansen JJ, Welle AJ van der, Joode J de. The evolving role of the DSO in efficiently accommodating distributed generation. 2007.
[113] van Werven M., Scheepers MJJ. The changing role of distribution system operators in liberalised and decentralising electricity markets. 2005 Int. Conf. Futur. Power Syst., Ieee; 2005, p. 6. doi:10.1109/FPS.2005.204259.
[114] Cossent R, Gómez T, Olmos L. Large-scale integration of renewable and distributed generation of electricity in Spain: Current situation and future needs. Energy Policy 2011;39:8078–87. doi:10.1016/j.enpol.2011.09.069.
[115] National Renewable Energy Laboratory. Energy Analysis - Renewable Electricity Futures Study n.d. http://www.nrel.gov/analysis/re_futures/ (accessed July 27, 2015).
[116] Lehr RL. New Utility Business Models: Utility and Regulatory Models for the Modern Era. Electr J 2013;26. doi:10.1016/j.tej.2013.09.004.
[117] Richter M. Utilities’ business models for renewable energy: A review. Renew Sustain Energy Rev 2012;16:2483–93. doi:10.1016/j.rser.2012.01.072.
[118] Kind P. Disruptive Challenges: Financial implications and strategic responses to a changing retail electric business. 2013.
[119] Casey C, Jones KB. Customer-Centric Leadership in Smart Grid Implementation: Empowering Customers to Make Intelligent Energy Choices. Electr J 2013;26:98–110. doi:10.1016/j.tej.2013.07.004.
[120] Gordijn J, Akkermans H. Business models for distributed generation in a liberalized market environment. Electr Power Syst Res 2007;77:1178–88. doi:10.1016/j.epsr.2006.08.008.
[121] Repo S, Maki K, Jarventausta P, Samuelsson O. ADINE - EU demonstration project of active distribution network. CIRED Semin. 2008 SmartGrids Distrib., Frankfurt, Germany: IEE; 2008, p. 52–52. doi:10.1049/ic:20080457.
[122] Smartgrids Projects. Grid4EU project n.d. http://www.grid4eu.eu/ (accessed July 27, 2015).
[123] Agrell PJ, Bogetoft P, Mikkers M. Smart-grid investments, regulation and organization. Energy Policy 2013;52:656–66. doi:10.1016/j.enpol.2012.10.026.
[124] More Microgrids Project. Advanced Architectures and Control Concepts for More Microgrids: WPH . Impact on the Development of Electricity Infrastructure. DH3 . Business Cases for Microgrids. 2009.
References
Modeling Tools for Planning and Operation of DERs and their Impact in Microgrids and Centralized Resources. 177
[125] FP7 Projects. Neighbourhood Oriented Brokerage Electricity and monitoring system n.d. http://www.ict-nobel.eu/.
[126] Karnouskos S, Ilic D, Goncalves P, Silva D. Using Flexible Energy Infrastructures for Demand Response in a Smart Grid City. 2012 3rd IEEE PES Int. Conf. Exhib. Innov. Smart Grid Technol. (ISGT Eur., Berlin: 2012, p. 1–7.
[127] Lopes F, Rodrigues T, Sousa J. Negotiating Bilateral Contracts in a Multi-agent Electricity Market: A Case Study. 23rd Int. Work. Database Expert Syst. Appl., Ieee; 2012, p. 326–30. doi:10.1109/DEXA.2012.77.
[128] Sánchez-Miralles Á, Fernández IJ, Muñoz A, Portela J, Arranz A, Alvar M. Project for GAMESA: Aggregation control center and embedded system for the energy management of electrical vehicles. n.d.
[129] Sánchez-Miralles Á, Arranz Á, Gómez T, Fernández IJ. Project for IBM: Retailer´s management system for electric vehicles n.d.
[130] Fernández IJ, Calvillo CF, Sánchez-Miralles Á, Boal J. Capacity fade and aging models for electric batteries and optimal charging strategy for electric vehicles. Energy 2013;60:35–43. doi:10.1016/j.energy.2013.07.068.
[131] Gómez T, Momber I, Rivier M, Sánchez-Miralles Á. Regulatory framework and business models for charging plug-in electric vehicles: Infrastructure, agents, and commercial relationships. Energy Policy 2011;39:6360–75. doi:10.1016/j.enpol.2011.07.037.
[132] Giordano V, Fulli G. A business case for Smart Grid technologies : A systemic perspective. Energy Policy 2012;40:252–9. doi:10.1016/j.enpol.2011.09.066.
[133] Hermans P. The changing role of telco services in utilities, driving utilities and telcos to new forms of cooperation. EUTC Conf., Warsov: 2012.
[134] Expert Group 3 - Regulatory Recommendations for Smart Grids Deployment. EG3 First Year Report : Options on handling Smart Grids Data. 2013.
[135] Beer S, Gómez T, Dallinger D, Momber I, Marnay C, Stadler M, et al. An Economic Analysis of Used Electric Vehicle Batteries Integrated Into Commercial Building Microgrids. IEEE Trans Smart Grid 2012;3:517–25. doi:10.1109/TSG.2011.2163091.
[136] Graillot A. TTA: Portfolio African Projects PV hybrid Micro-Grids. 2012.
[137] Mulaudzi S, Qase N. New and Renewable Energy: Mini-grid hybrid viability and replication potential: The Hluleka and Lucingweni pilot projects. Dep Miner Energy Pretoria, New Renew Energy 2008.
[138] Lidula NW a., Rajapakse AD. Microgrids research: A review of experimental microgrids and test systems. Renew Sustain Energy Rev 2011;15:186–202. doi:10.1016/j.rser.2010.09.041.
[139] Agarwal Y, Weng T, Gupta RK. Understanding the role of buildings in a smart microgrid. Des. Autom. Test Eur. Conf. Exhib., Grenoble: IEEE; 2011, p. 1–6. doi:10.1109/DATE.2011.5763195.
[140] Microgrid at Illinois Institute of Technology. Microgrid at Illinois Institute of
References
178 Francisco Martín Martínez
Technology n.d. http://www.iitmicrogrid.net/ (accessed July 27, 2015).
[141] Navigant Research. Military Microgrids n.d. http://www.navigantresearch.com/webinar/military-microgrids-2 (accessed July 27, 2015).
[142] Hatziargyriou N, Asano H, Iravani R, Marnay C. Microgrids: An Overview of Ongoing Research , Development, and Demonstration Projects. IEEE Power Energy Mag 2007;July:78–94.
[143] Project of European Union’s Seventh Programme for Research. Optimus: Optimising energy use in cities through smart decision support systems n.d.
[144] Bracco S, Delfino F, Pampararo F, Robba M, Rossi M. A mathematical model for the optimal operation of the University of Genoa Smart Polygeneration Microgrid: Evaluation of technical, economic and environmental performance indicators. Energy 2014;64:912–22. doi:10.1016/j.energy.2013.10.039.
[145] Bracco S, Delfino F, Pampararo F, Robba M, Rossi M. A dynamic optimization-based architecture for polygeneration microgrids with tri-generation, renewables, storage systems and electrical vehicles. Energy Convers Manag 2015;96:511–20. doi:10.1016/j.enconman.2015.03.013.
[146] Syrri ALA, Martinez Cesena EA, Mancarella P. Contribution of Microgrids to distribution network reliability. 2015 IEEE Eindhoven PowerTech, PowerTech 2015 2015. doi:10.1109/PTC.2015.7232486.
[147] Tenti P, Costabeber A, Mattavelli P, Trombetti D. Distribution loss minimization by token ring control of power electronic interfaces in residential microgrids. IEEE Trans Ind Electron 2012;59:3817–26. doi:10.1109/TIE.2011.2161653.
[148] Bacha S, Picault D, Burger B, Etxeberria-Otadui I, Martins J. Photovoltaics in microgrids: An overview of grid integration and energy management aspects. IEEE Ind Electron Mag 2015;9:33–46. doi:10.1109/MIE.2014.2366499.
[149] Mondal AK, Wang G. Energy Storage Technologies for Solar Photovoltaic Systems. In: Islam RM, Rahman F, Xu W, editors. Adv. Sol. Photovolt. Power Plants, Berlin, Heidelberg: Springer Berlin Heidelberg; 2016, p. 231–51. doi:10.1007/978-3-662-50521-2_9.
[150] Li Z, Wu W, Shahidehpour M, Wang J, Zhang B. Combined heat and power dispatch considering pipeline energy storage of district heating network. IEEE Trans Sustain Energy 2016;7:12–22. doi:10.1109/TSTE.2015.2467383.
[151] Stryi-hipp G. 100 % Renewable Energy Scenario for Frankfurt am Main. 2015.
[152] European Commission. Nearly zero-energy buildings n.d. https://ec.europa.eu/energy/en/topics/energy-efficiency/buildings/nearly-zero-energy-buildings.
[153] European Commission. Zero energy building projects: Intelligent Energy Europe n.d. https://ec.europa.eu/energy/intelligent/projects/en/project-keywords/nearly-zero-energy-buildings-nzeb (accessed October 7, 2015).
[154] Shi W, Xie X, Chu CC, Gadh R. Distributed Optimal Energy Management in
References
Modeling Tools for Planning and Operation of DERs and their Impact in Microgrids and Centralized Resources. 179
Microgrids. IEEE Trans Smart Grid 2015;6:1137–46. doi:10.1109/TSG.2014.2373150.
[155] Calvillo CF, Sánchez-Miralles A, Villar J. Energy management and planning in smart cities. Renew Sustain Energy Rev 2016;55:273–87. doi:10.1016/j.rser.2015.10.133.
[156] Quashie M, Member S, Fellow GJ. Optimal Planning of Urban Microgrids with an Energy Management System 2016:1–5.
[157] Mehleri ED, Sarimveis H, Markatos NC, Papageorgiou LG. A mathematical programming approach for optimal design of distributed energy systems at the neighbourhood level. Energy 2012;44:96–104. doi:10.1016/j.energy.2012.02.009.
[158] Omu A, Choudhary R, Boies A. Distributed energy resource system optimisation using mixed integer linear programming. Energy Policy 2013;61:249–66. doi:10.1016/j.enpol.2013.05.009.
[159] Microgrid Berkeley Laboratory. DER CAM n.d. http://building-microgrid.lbl.gov/ (accessed March 24, 2016).
[160] Girardin L, Marechal F, Dubuis M, Calame-Darbellay N, Favrat D. EnerGis: A geographical information based system for the evaluation of integrated energy conversion systems in urban areas. Energy 2010;35:830–40. doi:10.1016/j.energy.2009.08.018.
[161] Koch S, Ulbig A, Ferruci F. DPG.sim: An innovative software platform for simulation and optimization of active distribution grids for DSOs and Smartgrid researchers. CIRED Work – Rome, 11-12 June 2014 n.d. https://www.adaptricity.com/files/publications/adaptricity_cired_2014.pdf (accessed May 17, 2016).
[162] Bracco S, Dentici G, Siri S. DESOD : a mathematical programming tool to optimally design a distributed energy system. Energy 2016;100:298–309. doi:10.1016/j.energy.2016.01.050.
[163] Katipamula S, Brambley M. Automated diagnostics: improving building system and equipment. Perform Energy User News 1998;23.
[164] MIT Energy Initiative in collaboration with IIT-Comillas. Utility of the future: an MIT Energy Initiative response to an industry in transition (http://energy.mit.edu/research/utility-future-study/). 2016.
[165] Mathieu JL, Dyson M, Callaway DS. Using Residential Electric Loads for Fast Demand Response : The Potential Resource and Revenues , the Costs , and Policy Recommendations. Proc ACEEE Summer Study Build 2012:189–203.
[166] Fan C, Xiao F, Wang S. Development of prediction models for next-day building energy consumption and peak power demand using data mining techniques. Appl Energy 2014;127:1–10. doi:10.1016/j.apenergy.2014.04.016.
[167] Bacher P, Madsen H. Identifying suitable models for the heat dynamics of buildings. Energy Build 2011;43:1511–22. doi:10.1016/j.enbuild.2011.02.005.
[168] Amara F, Agbossou K, Cardenas A, Dubé Y, Kelouwani S. Comparison and Simulation of Building Thermal Models for Effective Energy Management. Smart Grid Renew
References
180 Francisco Martín Martínez
Energy 2015;6:95–112. doi:10.4236/sgre.2015.64009.
[169] Joint Research Centre of the European Comission. PV potential estimation utility n.d. http://re.jrc.ec.europa.eu/pvgis/apps4/pvest.php (accessed December 12, 2014).
[170] Ecomesh – Paneles híbridos de segunda generación n.d. http://ecomesh.es/ (accessed January 16, 2017).
[171] Woodmead Energy Services. Wind Turbine Planning Application n.d. https://woodmeadenergyservices.com/renewable-energy/wind-turbine-planning-application/ (accessed May 20, 2016).
[172] Bracco S, Delfino F, Pampararo F, Robba M, Rossi M. A pilot facility for analysis and simulation of smart microgrids feeding smart buildings. Renew Sustain Energy Rev 2016;58:1247–55. doi:10.1016/j.rser.2015.12.225.
[173] Delfino F, Rossi M, Pampararo F, Barillari L. An Energy Management Platform for Smart Microgrids. Stud. Comput. Intell., vol. 627. Intelligen, 2016, p. 207–25. doi:10.1007/978-3-319-30447-2.
[174] Siemens. SCADA System SIMATIC WinCC - HMI Software n.d.
[175] Siemens. Decentralized Energy Management (DEMS) - Digital Grid n.d.
[176] Gestore Mercati Energetici. Electrical and Thermal prices in Italy n.d. http://www.mercatoelettrico.org/En/Default.aspx (accessed July 7, 2016).
[177] Martín-Martínez F, Sánchez-Miralles A, Rivier M. Prosumers’ optimal DER investments and DR usage for thermal and electrical loads in isolated microgrids. Electr Power Syst Res 2016. doi:10.1016/j.epsr.2016.05.028.
[178] Izquierdo M, Gavira MJ, Lecuona JAA y A. Espesor óptimo del aislante térmico para las viviendas de Madrid. Madrid: n.d.
[179] Cervilla C, Villar J, Campos FA. Bi-level optimization of electricity tariffs and PV distributed generation investments. 2015 12th Int. Conf. Eur. Energy Mark., IEEE; 2015, p. 1–5. doi:10.1109/EEM.2015.7216711.
[180] Díaz CA, Villar J, Campos FA, Reneses J. Electricity market equilibrium based on conjectural variations. Electr Power Syst Res 2010;80:1572–9. doi:10.1016/j.epsr.2010.07.012.
[181] Lawrence Orsini. Brooklyn Microgrid – Community Microgrid n.d. http://brooklynmicrogrid.com/.
[182] Diane Cardwell. Solar Experiment Lets Neighbors Trade Energy Among Themselves. New York Times 2017:1.
[183] Power Ledger -A New Decentralised Energy Marketplace - Power Ledger - Where Power meets Blockchain n.d. https://powerledger.io/ (accessed June 3, 2017).
[184] ME SOLshare n.d. https://www.me-solshare.com/ (accessed June 3, 2017).
[185] Sonnen Community n.d. https://www.sonnenbatterie.de/en/sonnenCommunity (accessed June 3, 2017).
[186] SCANERGY European Project n.d. http://www.scanergy-project.eu/ (accessed June 3, 2017).
References
Modeling Tools for Planning and Operation of DERs and their Impact in Microgrids and Centralized Resources. 181
[187] Microgrid market set to reach $23 billion by 2021 as it prepares to move from test-bed stage to commercialization, says GlobalData | GlobalData Energy n.d. https://energy.globaldata.com/media-center/press-releases/power-and-resources/microgrid-market-set-to-reach-23-billion-by-2021-as-it-prepares-to-move-from-testbed-stage-to-commercialization-says-globaldata (accessed June 4, 2017).
[188] Barquín J, Centeno E, Reneses J. Medium-term generation programming in competitive environments: a new optimisation approach for market equilibrium computing. IEE Proceedings-Generation, Transm Distrib 2004;151:201–12. doi:10.1049/ip-gtd.
[189] Gabriel SA, Conejo AJ, Fuller JD, Hobbs BF, Ruiz C. Complementarity Modeling in Energy Markets. vol. 1. Springer; 2013. doi:10.1007/978-1-4419 -6123-5.
[190] Fred Schweppe, Michael Caramanis, Richard Tabors RB. Spot Pricing of Electricity. vol. 6. 1990. doi:10.1007/978-1-4613-1683-1.
[191] Wogrin S, Centeno E, Barquín J. Generation Expansion Planning in Electricity Markets With Bilevel Mathematical Programming. Escuela Técnica Superior de Ingeniería (ICAI), 2013.
[192] Solar Irradiance n.d. http://re.jrc.ec.europa.eu/pvgis/apps4/pvest.php#.
[193] Datosclima.es. Base de datos Meteorológica. Red principal Estaciones meteorológicas de AEMET n.d. http://datosclima.es/index.htm (accessed May 20, 2016).
[194] Poudineh R, Jamasb T. Distributed generation, storage, demand response and energy efficiency as alternatives to grid capacity enhancement. Energy Policy 2014;67:222–31. doi:10.1016/j.enpol.2013.11.073.
[195] Wang Z, Wang J. Review on implementation and assessment of conservation voltage reduction. IEEE Trans Power Syst 2014;29:1306–15. doi:10.1109/TPWRS.2013.2288518.
[196] Wang Z, Wang J. Self-healing Resilient Distribution Systems based on Sectionlization into Microgrids. IEEE Trans Power Syst Press 2015;30:3139–49.
[197] Hoff TE, Wenger HJ, Farmer BK. Distributed generationAn alternative to electric utility investments in system capacity. Energy Policy 1996;24:137–47. doi:10.1016/0301-4215(95)00152-2.
[198] Pérez-Arriaga IJ, Ruester S, Schwenen S, Battle C, Glachant J-M. From Distribution Networks to Smart Distribution Systems: Rethinking the Regulation of European Electricity DSOs. 2013. doi:10.2870/78510.
[199] Akorede MF, Hizam H, Pouresmaeil E. Distributed energy resources and benefits to the environment. Renew Sustain Energy Rev 2010;14:724–34. doi:10.1016/j.rser.2009.10.025.
[200] Masson G, Briano JI, Baez MJ. Review and analysis of pv self-consumption policies. 2016.
[201] Melorose J, Perroy R, Careas S. Best practices on Renewable Energy Self-
References
182 Francisco Martín Martínez
consumption Accompanying. vol. 1. 2015. doi:10.1017/CBO9781107415324.004.
[202] International Energy Agency (IEA). Technology Roadmap: Solar Photovoltaic Energy. 2014. doi:10.1007/SpringerReference_7300.
[203] Expansion: Economical newspaper. Article: Losses in the spanish electrical system n.d. http://www.expansion.com/accesible/2012/12/14/empresasenergia/1355500914.html.
[204] Spanish Regulation. Orden IET/2444/2014, de 19 de diciembre, por la que se determinan los peajes de acceso de energía eléctrica para 2015. 2014.
[205] Spanish Regulation. Resolución de 8 de junio de 2015, de la Secretaría de Estado de Energía, por la que se aprueba el procedimiento de operación del sistema eléctrico 14.12 «Estimación del coste de los componentes del precio voluntario para el pequeño consumidor». 2015.
[206] NREL: Energy Analysis - Models and Tools n.d. http://www.nrel.gov/analysis/models_tools.html (accessed June 5, 2017).
[207] KEMA. Integration of Renewable Energy in Europe 2014:236.
[208] Domingo CM, Gómez T, Román S, Member S, Sánchez-miralles Á, Pascual J, et al. A Reference Network Model for Large-Scale Street Map Generation 2011;26:190–7.
[209] Chaves-Avila JP, Banez-Chicharro F, Ramos A. Impact of support schemes and market rules on renewable electricity generation and system operation: the Spanish case. IET Renew Power Gener 2017;11:238–44. doi:10.1049/iet-rpg.2016.0246.
[210] Red Eléctrica de España (REE). El sistema eléctrico español / The Spanish electric system. 2014.
[211] Lazard. Lazard’s levelized cost of energy analysis. 2015.
[212] Comisión Nacional de la Energía (CNE). Informe 3/2007 de la CNE relativo a la propuesta de Real Decreto por el que se regula la actividad de producción de energía eléctrica en régimen especial y de determinadas instalaciones de tecnologías asimilables del régimen ordinario. 2007.
[213] Comisión Nacional de los Mercados y la Competencia (CNMC). Informe sobre la propuesta de orden por la que se aprueban los parámetros retributivos de las instalaciones tipo aplicables a determinadas instalaciones de producción de energía eléctrica a partir de fuentes de energía renovables, cogeneración y residuos. 2014.
[214] Meteoclimatic Societat d’Estudis del Temps i el Clima. Meteoclimatic Web Page n.d. http://www.meteoclimatic.net/index (accessed February 15, 2016).
[215] Lazard. Lazard’s levelized cost of storage analysis — version 1.0. 2015.
[216] Palmintier BS, Webster MD. Heterogeneous unit clustering for efficient operational flexibility modeling. IEEE Trans Power Syst 2014;29:1089–98. doi:10.1109/TPWRS.2013.2293127.
[217] Barnes M, Kondoh J, Asano H, Oyarzabal J, Ventakaramanan G, Lasseter R, et al. Real-World MicroGrids-An Overview. 2007 IEEE Int. Conf. Syst. Syst. Eng., Ieee; 2007,
References
Modeling Tools for Planning and Operation of DERs and their Impact in Microgrids and Centralized Resources. 183
p. 1–8. doi:10.1109/SYSOSE.2007.4304255.
[218] Suga M. Nedo’s Smart Grid Related Activities. ADEME-NEDO Work., 2009.
[219] Tatsuya Shinkawa. NEDO and International Activities Presentations 2012.
[220] Torre RDELA, Arrowsmith JE. NEDO, Los Alamos Collaborative Microgrid Research Project Presentation 2011.
[221] McAllister K. Fort Bragg Micro Grid. NC Smart Grid Tech. Forum, n.d.
[222] Du Y, Lu DDC, Cornforth D, James G. A study on the harmonic issues at CSIRO Microgrid. Proc. Int. Conf. Power Electron. Drive Syst., Singapore: 2011, p. 203–7. doi:10.1109/PEDS.2011.6147247.
[223] Collado A. DER-IREC 22 @ Microgrid Tecnología para un nuevo modelo energético. Núcleos en cooperacion ACC10 2012:4–9.
[224] Sempra Energy Utility. SDG & E RDSI Project Overview SDG & E Borrego Springs Microgrid Project Summary 2010.
[225] Cleveland F. Xanthus Consulting International: California DR Integration Projects (San Diego and Marin County) 2008:December.
[226] Universidad Estadual Paulista “Julio de Mesquita Filho.” Microgrids in Brazil. Jeju 2011 Symp. Microgrids, n.d.
[227] Wong S. CanmetENERGY: Microgrid Research Activities in Canada Smart Zones Remote ( Isolated ) Communities Summary. Jeju 2011 Symp. Microgrids, 2011.
[228] Ayoub J. CanmetENERGY, Varennes Research Centre: International R & D Collaboration on Photovoltaic Hybrid Systems within Mini grids 2011:2–5.
[229] Cornforth D. Microgrid Research in Australia CSIRO today : a snapshot, Newcastle, Australia: n.d.
[230] KEMA D-. Power Matching City n.d. https://www.dnvgl.com/technology-innovation/broader-view/sustainable-future/vision-stories/power-matching-city.html (accessed July 27, 2015).
[231] Schneider D. Micro-Grids for Colonias: A Technology Development/Transfer Project Presentation. Texas Cent. Appl. Technol. Eng. Exp. Stn. Texas A&M Univ. Syst., 2010.
[232] MIT Energy Iniciative. The Future of the Electric Grid. 2011.
[233] Universidad Politécnica de Madrid. Servidor de la estación meteorológica del Instituto de Energía Solar, U.P.M. n.d. http://helios.ies-def.upm.es/consulta.aspx (accessed December 7, 2014).