Embed Size (px)
Citation preview

Journal of Environment and Earth Science www.iiste.org ISSN 2224-3216 (Paper) ISSN 2225-0948 (Online) Vol.7, No.6, 2017
57
Modelling Land Surface Temperature from Satellite Data and Trigger by Land Use Land Cover Dynamics using Remote Sensing and GIS Technology, in Debra Tabor District, Ethiopia Mulualem Asfaw Debre Tabor University Faculty of Social Science and Humanity, P.O. Box 272, Debre Tabor, Ethiopia Abstract Rapid changes in the land use/land cover (LULC) of a region have become a major environmental concern in recent times. This has led to unsustainable development with the reduction of green spaces and also changes in local climate. Land surface temperatures(LST) is important in global climate studies, in estimating radiation budgets in heat balance studies and as a control for climate models. The main goal of this paper is to quantify and examine the changes in the Land use/land cover and consequent changes in land surface temperature. Land surface temperature is strongly influenced by the ability of the surface to emit radiation, i.e. surface emissivity. This research was undertaken to analyze the potential of multispectral satellite data to retrieve or estimating land surface temperature over Debre Tabor District, from 1999 to 2014. LANDSAT-5 TM (Landsat Thematic Mapper) and LANDSAT-7 ETM+ (Landsat Enhanced Thematic Mapper) satellite images data of Debre Tabor district acquired on October 23, 1999, October 23, 2006 and November 3, 2014 were selected and used to this research for LULC classification. The thermal infrared bands of the Landsat data were used to retrieve land surface temperature. Supervised classification using Maximum Like Hood Classifier (MLC) was carryout for land use land cover classification and analysis. The result showed that the land use/land cover change was an important driver for Land Surface Temperature increase. Land Surface Temperature of the study area also increased by 0.2714 0c and urban land, cultivated land, bare land has increased its coverage, the reaming shrub land and forest land decreased its coverage within 15-year period interval. The result was shows that impact of land use/land cover on Land Surface Temperature is high. Overall, remote sensing and geographic information system technologies were effective approaches for monitoring and analyzing the changes in Land use land cover and consequent changes in land surface temperature. Keywords: - LULC, LST, GIS, Remote sensing, MLC. 1. INTRODUCTION The environmental and social consequences of predicted climate change are expected to be amplified in urban environments due to their elevated temperatures, which are attributable to a phenomenon known as the Urban Heat Island (UHI) (Farina, 2012). land surface temperature (LST) is important to a range of issues and themes in human life on earth such as to analysis global environmental change, human environment interactions and more specifically to impact of land use and land cover (LULC) dynamics (Anderson, 1976). The world’s urban population was estimated at 3 billion in year 2003 and is expected to rise to 5 billion by year 2030. Hence, there is a need to improve natural environment and maintain the sustainability of cities taking human comfort into consideration (Albaladejo, 1998). Land surface temperature is one of rapidly gaining attention in worldwide because it is directly linked to human health and come from loss of natural resource (Cunningham etal, 2008). Today the most imperative problem in the world is increasing land surface temperature because of dramatic alteration of the natural surface, as natural vegetation is removed and replaced by non-evaporating, non-transpiring surfaces (e.g., stone, metal, concrete, etc.). This refers especially, to the distinct difference of temperature from time to time (Dash, 2005). Land use should be matched with land capability and at the same time it should respect the environment, and global climate systems (UNEP, 1996). land use land cover change changes is one of the most visible results of human’s modification of the terrestrial ecosystem, and it has a significant impact on the local, regional, and global environment (Weng and Losand , 2001). Land cover change is occurring at outstanding rates, affecting an estimated 39 to 50 percent of Earth’s land surface (Sterling and Ducharne, 2008). The process alters biogeochemical cycles and biogeophysical feedbacks that contribute to global climate change (Wallace etal, 2009), loss of wildlife habitat (Jie et al, 2002), decreased biodiversity and reduced soil productivity (Maron, and Fitzsimons, 2007) and altered rainfall and temperature patterns from local to global scales (Marland etal, 2003). The rapid development of thermal infrared remote sensing greatly advanced the exploration of the land surface temperature and land use and land cover dynamics. Land surface temperature is a temperature of the skin surface of land which can be derived from satellite thermal infrared data. Land surface temperature provides an accurate measure for
Journal of Environment and Earth Science www.iiste.org ISSN 2224-3216 (Paper) ISSN 2225-0948 (Online) Vol.7, No.6, 2017
58
energy exchange balance between the Earth and the atmosphere (Zhengming, and Dozier, 1989). Ethiopian land surface is naturally covered by different land cover types which are mainly distributed based on climate patterns. The Ethiopian Forestry Action Program (EFAP, 1994 ) estimated the destruction of forest per year has at present reached 150,000 - 200,000 hectares. This enormous amount of destruction is caused by agricultural extension, saw log production, and collection of fuel wood, civil war and fire. Currently, the forest cover in the country is below 3 percent of the land area compared to 35-40 percent half a century ago. According to Albaladejo, et al, (1998) Changes in land use land cover were accompanied by changes in land surface temperature leading to an increased land surface temperature because of this the abundance of forest was an important factor influencing land surface temperature. Changes in land use land cover affect the ecosystem and biotic diversity of Debre Tabor District, Covered with buildings, roads, and other impervious surfaces, the study areas generally have higher change of land use land cover and have higher absorption of solar radiation and greater thermal capacity and conductivity, leading to a relatively higher surface temperature, according to Amhara meteorological center data the average temperature of the study area in 1999 and 2014 is 15.91 0C and 16.30 0C respectively, based on this data there is an increasing of average temperature by 0.39 0C in 16 year gapes, the dynamics cannot be well understood without knowledge of the land use/cover change that drives them. 2. Materials and Methods 2.1. Description of the Study area Debre Tabor was the capital of Ethiopia under Emperors Tewodros II, before he moved the capital to Magdala, Debre Tabor (lit “Mount Tabor"), formerly spelled Debra-Tabor, and is a town in north-central Ethiopia. After in 1991, the new regime of Ethiopia Debre Tabor is one of district in Debub Gonder zone. Located in the Amhara Region of Ethiopia, about 100 kilometers southeast of Gondar and 50 kilometers east of Lake Tana, this historic town has an average elevation of 2,706 metres (8,878 ft) a. s.l. (figure 1). 2.2. Research methodology 2.2.1. Research design Quantitative research designs were employed for all the data that was used in this study, because the land use land cover of the study area change matrixes was done quantitative and after that the land surface temperature of the study area derived from land sat image was done quantitative finally the two results was taken for relationship and model evaluation analysis. 2.2.2. Sampling Technique The sampling method chosen for this research is stratified random sampling. In stratified sampling, the populations are grouped together on the basis of similarity of spectral characteristics. Stratified random sampling is necessary to make sure that small, but important land covers are represented in the sample (Congalton, 1999). Each land cover and land use category was considered as a stratum. 2.2.3. Sample size Sample of land use and land cover classification was taken by comprising of a number of training pixels, forms a cluster in the feature space. The clusters, as selected by the operator: should form a representative data set for a given class. The number of sample plots (clusters, the sample size of one cluster) was 30 × n, where n, number of bands (Wim, et al 2001) with the maximum of 4 and the minimum of 2 sample units around the center plots was taken. The numbers of samples were designed based on the area proportion but during the fieldwork some adjustment was done for physical barriers and other conditions. The sample unit size was 15-meter radius and a cluster of 5 sample units including the center, which is 120 meter each apart from the center sample units (figure 2). A sample unit covers an area of 111.29 sq.km. A sample of 210 for each 1999, 2006 and 2014 land use land cover classification, that is 30 x number of bands (7), were Stratified randomly selected from the study area. 2.2.4. Materials and software’s The following materials and software’s which was used in this study: GPS, Arc GIS10.3, ERDAS Imagine 2014, SPSS 23 and ENVI 4.8 to analysis land use land cover change detection matrixes and land Surface Temperature. 2.2.5. Methods of data collection The research was use primary and secondary data. The primary data was collected from the study area through filed observation, ground control points, remote sensing data, and land cover field data. Secondary data was collected from various data sources. Satellite Image with the spatial resolution of 30 m used for land use/ land cover and it was downloaded from the website: www.glcf.com, www.landsat.org and www.earthexplorer.usgs.gov. Generally, both primary and secondary data was conducted in three phases: Pre-fieldwork, fieldwork and post fieldwork time. 2.2.6. Methods of data analysis A GIS application was employed for the purpose of managing, analyzing, combining, correlating and mapping

Journal of Environment and Earth Science www.iiste.org ISSN 2224-3216 (Paper) ISSN 2225-0948 (Online) Vol.7, No.6, 2017
59
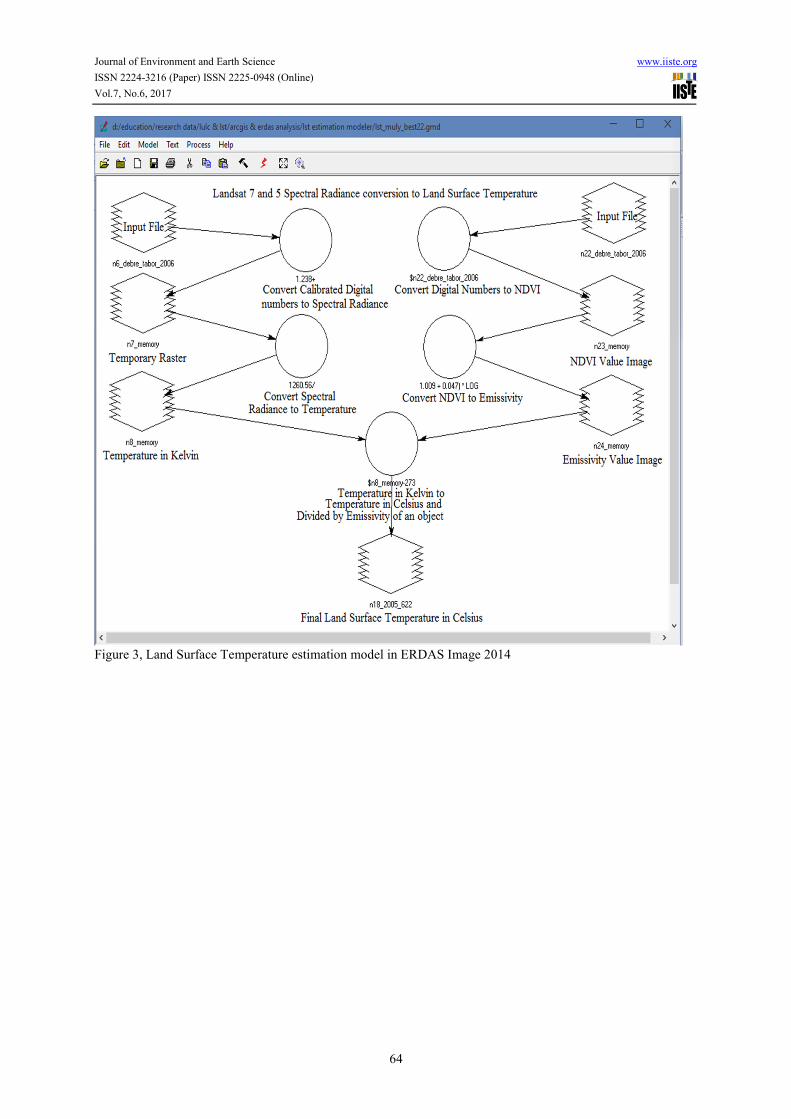
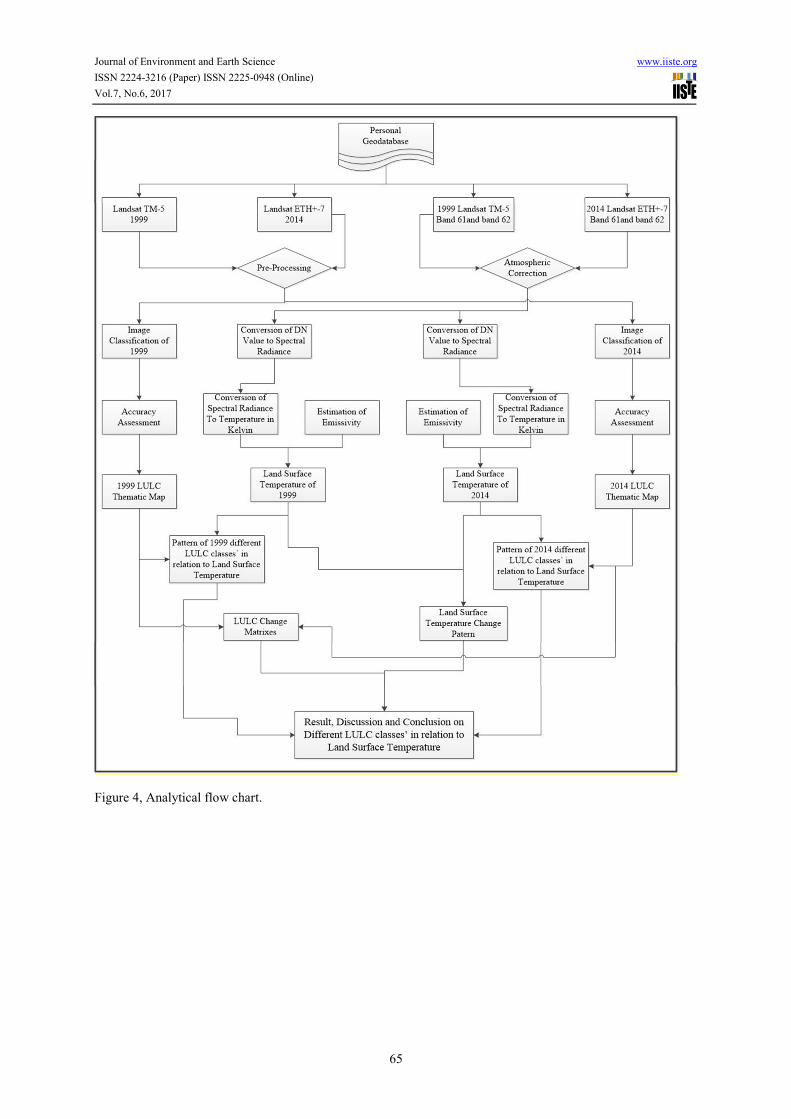
spatial data by using ArcGIS 10.3. Remotely sensed data was processed using ERDAS imagine 2014 and ENVI 4.8 software by applying the basic image preprocessing techniques starting from image rectification, restoration, enhancement, image classification, accuracy assessment and ENVI FLAASH atmospheric correction algorithm. 2.2.6.1. Land use/ land Cover Changes Analyze The image of the study area was extracted from path and row of 169 and 52 respectively. the study area was extracted from the image. The land use and land cover of the study area 1999, 2006 Landsat-5 TM and 2014 landsat-7 ETM+ was classified by using the maximum likelihood classifier algorism, Supervised classification was performing by using 30m image resolution of a color Composite 4, 3, 2. In the remotely sensed image, green (band 2), red (band 3), and near infra-red blue (4) band are represented respectively. This band combination and color selection make identification of land use land cover class easily and clear. 2.2.6.2. Land Surface Temperature Analyze According to Nelson, et al, 2002 of SEBAL (Surface Energy Balance Algorithms for Land) Advanced Training and User’s Manual, Farina, (2012) and Dash et al., (2002) two approaches have been developed to recover LST from multispectral TIR imagery. The first approach utilizes a radiative transfer equation to correct the at sensor radiance to surface radiance, followed by an emissivity model to separate the surface radiance into temperature and emissivity. The second approach applies the split-window technique for sea surfaces to land surfaces temperature. Based on the above two approaches a radiative transfer equation was used in this research because to estimate the emissivity of different objects in the study area. Conversion of the Digital Number (DN) to Spectral Radiance (L) The first step in LST valuation is the conversion of DN values to absolute radiance. The LANDSAT ETM+ images are acquired in either a low or high gain state. The purpose of switching gain states is to maximize the instrument’s 8-bit radiometric resolution without saturating the detectors. For all LANDSAT ETM+ bands, the low gain dynamic range is approximately 1.5 times the high gain dynamic range (Nelson, et al, 2002) When the surface brightness is high, the sensor images in low gain mode. The Digital Number value of the image is converted to the radiance units using the following equation for low gain and high gain mode of band 6 satellite image. �� � �� ���� �� ����� ��� ����� �� ∗ ����� � �������� � �� !"… … …… …… …… …1
where: - Lλ = Radiance at wavelength �, Lmax = Maximum detected spectral radiance for the scene, Lmin = Minimum detected spectral radiance for the scene, QCALMAX = Maximum Quantized and calibrated data digital number = 255, QCALMIN = Minimum quantized and Calibrated data digital Number = 1 for LPGS and QCAL = Digital Number Conversion of Spectral Radiance to Temperature in Kelvin The second step is that conversion of radiance to temperature. The satellite temperature can be calculated under an assumption of unity emissivity and using the pre-launch calibration constants K1 and K2 (NASA, 2002). The conversion formula is: - % � &'ln�&* �+, � 1�… …… …… … …… …… …… …… … …… …… …… …2
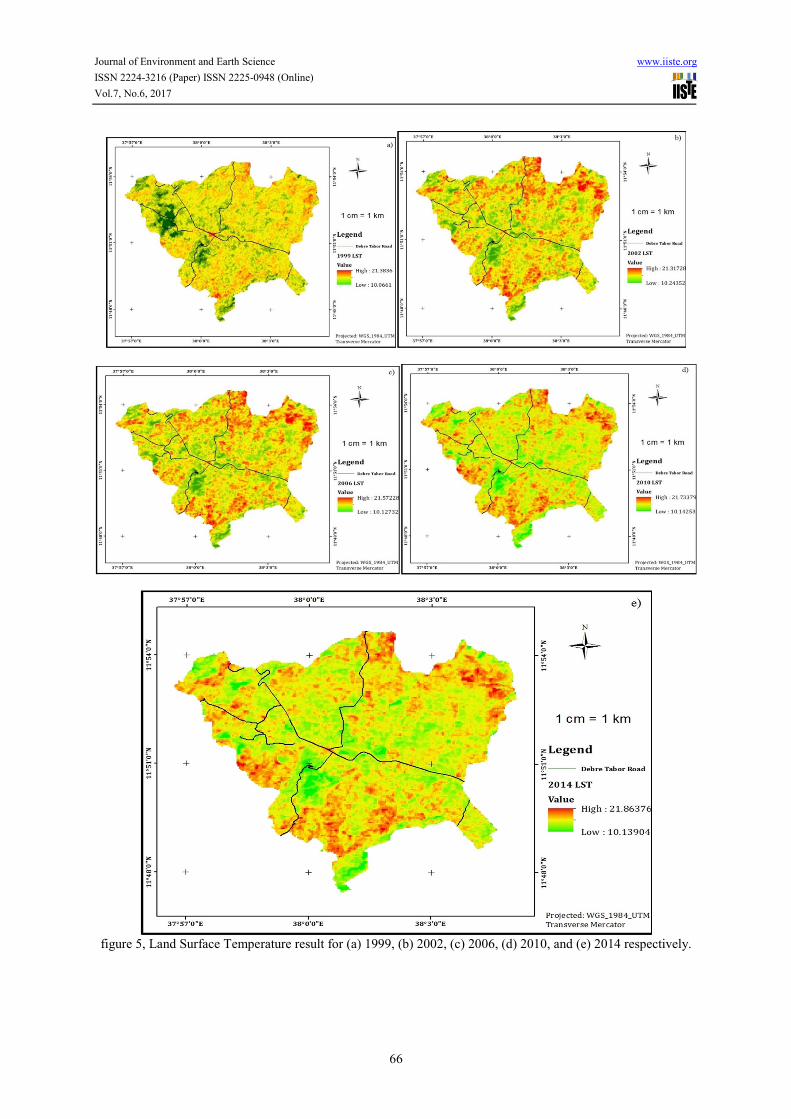
Where T = Effective at-satellite temperature in Kelvin, K1 = Calibration constant 1, K2 = Calibration Constant 2 and Lλ = Spectral Radiance. Estimation of Emissivity An emissivity εo for the 8-14 µm spectral range could be predicted from NDVI (Farina, 2012) and (Nelson, et al, 2002) by using: - ./�0,2� � 1.009 � 0.04789:;<=�0,2�……………………………………………………………> Where: - εo (x, y) = Emissivity of each pixel values and NDVI = (Band4 − Band3)/ (Band4 + Band3) for Landsat image. Surface Kinetic Temperature According to (Farina, 2012) and (Dash, 2005) the final step to convert the radiant temperature to kinetic temperature is;- ?@ � �A�B.CD∗?E and ?E � ?@�A�B.CD……………………………………. 4 Where Tr = Thermal infrared, Tk = Temperature in Kinetic and A = emissivity 3. Result and Discussion 3.1. Land Surface Temperature Estimation using Landsat image 3.1.1. Land Surface Temperature Trends Land Surface Temperature (LST) maps were generated for 1999, 2002, 2006, 2010 and 2014 G.C. Based on the LST model results (figure 5), average land surface temperature value of the study area in

Journal of Environment and Earth Science www.iiste.org ISSN 2224-3216 (Paper) ISSN 2225-0948 (Online) Vol.7, No.6, 2017
60
1999,2002, 2006, 2010 and 2014 are 15, 73 0C, 15.78 0C, 15.85 0C, 15.94 0C and 16 0C respectively, this result shows that there is an increasing of average land surface temperature by 0.05 0C between 1999 and 2002 , 0.07 0C between 2002 and 2006, 0.09 0C between 2006 and 2010 and 0.063 0C between 2010 and 2014, and also 0.2714 0C increasing of an average land surface temperature of the study area between 1999 and 2014 within 15 year gapes. In all the LST result maps (figure 5), the Red color spectrum represents higher land surface temperature, yellow color spectrum represents an average land surface temperature and the green color spectrum indicates low land surface temperature of the study area. The reason that present such kind of spatial distribution of temperature is because of the variability of land use land cover type and different reflectance value of an object. Based on the result of land surface temperature trends in Figure 6, The coefficient value of land surface temperature indicates that variability of temperature is high with year variability. The correlation of temperature and time is 0.99, this implying that temperature has significant positive relationship with time. 3.2. Land Use Land Cover Classifications Land use planning is sometimes misunderstood in Debre Tabor district. According to FAO(1998), Guidelines for Land Use planning, there are five major land use land cover classes in the study area, these are: - Urban land, Shrub land, Cultivated land, Forest land and Bare land. According to Figure 7, land use land cover classified result map and table 1, Matrix of land use and land cover change, the pattern of changes, urban land increased by 10.35% from 1999 to 2014, this show that the expansion of urban land and because of the increasing of urban land the other land use type decreases its coverage, based on the table cultivated land also highly increase by 10.05% from 1999 up to 2014, Bare land also, increases 8.49% in 1999 up to 2014, and shrub land and forest shows highly decrease from 1999 up to 2014 by 17.44% and 11.45% respectively. 3.2.1. Land Use Land Cover Classification Accuracy Assessment The overall accuracies performed in land use land cover classification in the period of 1999, 2006 and 2014 was 95.24 %, 96.19 % and 96.67% respectively, as stated by Anderson, et al (1976) for a reliable land use land cover classification, the minimum overall accuracy value computed from an error matrix should be greater than 85% So, the overall accuracies for both LULC classification were above 85% and it is a reliable land use and land cover classification. 3.2.2. Land use Land Cover Change Pattern and Matrix After all classification was done, by taking the classified land use land cover change in ENVI 4.7 analysis the Land Use Land Cover Change Pattern and Matrix of the study area to see the change and the transfer of one land use to other land use type in the time interval from 1999 to 2014. As it indicated in table 1, Matrix of land use and land cover change only 51.99% of the area that was covered with cultivated land in 1999 remained the same in 2014. The remains (48.01%) was cleared and had changed to other land use cover types in 2014: 16.04% to urban land, 29.09% to bare land, 2.43% to shrub land and 0.44% to forest, as show from the table more than half of cultivation land change to bare land followed to urban land and this show that the study area was degraded, and also 81.52% of the area that was covered with urban land in 1999 remained the same in 2014, the remains 18.48% was changed in to other land use and land cover type: 5.38% to cultivation land, 8.79% to bare land, 3.81% to shrub land and 0.49% to forest. According to Table 1, only 8.15% of the study area that was covered with bare land in 1999 remain the same in 2014 the remains (91.85%) was cleared and had changed to other land use cover types by 2014: 83.69% to Cultivated land, 6.34% to urban land, 1.55% to shrub land and 0.26% to forest, and also 26.65% of the area that was covered with urban land in 1999 remained the same in 2014, the remaining 73.35% was changed in to other land use and land cover type: 44.71% to cultivated land, 18.28% to urban land, 8.80% to bare land and 1.54% to forest. Further, only approximately 29.88% of the area that was covered with shrub land in 1999 was still under the same cover in 2014. The rest (70.12%) was transformed to other LULC types in 2014: 66.01% to cultivated land, 1.93% to urban land, 0.05% to bare land and 0.08% to shrub land. Generally, within 15-year period from 1999 up to 2014, urban land, cultivated land and bare land show that an increasing land use and land cover change coverage pattern by 10.35%, 10.05% and 8.49% respectively. However, the expansion of shrub land and forest land use and land cover shows decrease by 17.44% and 11.45% respectively, based on this result the study area vegetation coverage is highly decrease. 3.3. LST Responses on LULC Change All land use land cover type has different land surface temperature because of the object that cover the land has different reflectance values and because of this it has different spectral value. Based on the above all land use land cover type correlation with land surface temperature value analysis ranks from the highest to the lowest land surface temperature value for more comprise between each land use and land cover type. By extracting the land surface temperature of each land use land cover of the study area, generates the value of each land use land cover

Journal of Environment and Earth Science www.iiste.org ISSN 2224-3216 (Paper) ISSN 2225-0948 (Online) Vol.7, No.6, 2017
61
type land surface temperature. According to figure 13, urban land, bare land, cultivated, shrub land and forest has the highest to the lowest rank of Land surface temperature value respectively. According to table 4, urban land, bare land and cultivated land have a positive gain and correlation value, which means when the area coverage of urban land, bare land and cultivated land increases the land surface Temperature also increases, but within this direct relationship the degree of increasing land surface temperature varies from urban, cultivated and bare land ranks from the highest to the lowest degree of increasing land surface temperature because the regression and correlation value also indicates the strongest and weakens relationships of each class. The remains shrub land and forest, positive gain and negative correlation value, which means when the area coverage of shrub land and forest land increases the land surface Temperature decreases, but the shrub land and forest area coverage is decreased from 1999 up to 2014 and the land surface temperature value increases on these areas. According to figure 9, cultivated land, shrub land, forest, urban land and bare land has the highest to the lowest area coverage in 1999 but in 2006 the area coverage varies to cultivated land, shrub land, urban land, bare land and forest has the highest to the lowest area coverage the only change is that the forest land smallest area coverage and also in 2014 the area coverage varies to cultivated land the first, urban land second, bare land third, shrub land forth and forest fifth from the highest to the lowest area coverage. 4. Conclusion and Recommendation 4.1. Conclusion The research has undertaken to model and evaluate the impact of land use land cover change on land surface temperature in Debre Tabor District, from 1999 up to 2014. The results have shown that the effect of different land use land cover types on land surface temperatures and the main findings of the study have fulfilled the aim and objective of this research. The satellite derived Land Surface Temperature results indicates that there is an increasing of Land surface temperature from 15, 73 0C, 15.78 0C, 15.85 0C, 15.94 0C and 16 0C in 1999, 2002, 2006, 2010 and 2014 year respectively. Generally, an increasing of Land Surface Temperature by 0.2714 0C within 15-year interval from 1999 up to 2014 in the study area. The land use land cover change of the study area, it can be seen that within 15-year period from 1999 up to 2014, urban land, cultivation land and bare land show an increasing land use and land cover change coverage pattern by 10.35%, 10.05% and 8.49% from the total land use land cover coverage respectively. However, because of the increasing urban land, cultivation land and bare land, the expansion of shrub land and forest land coverage pattern show decrease by 17.44% and 11.45% from the total land use land cover coverage respectively. Results also shown that urban land, bare land and cultivation land have a direct relationship with land surface temperature, which means when the area coverage of urban land, bare land and cultivation land increases the land surface Temperature also increases, but within this direct relationship the degree of increasing land surface temperature varies from urban the highest, which was followed by cultivation and bare land. The lowest Land Surface Temperature was recorded in the reaming shrub land and forest land use and land cover type, which has an indirect relationship with LST. 4.2. Recommendation From the finding of the research and conclusion made the researcher would like to recommend the following solution that may alleviate the impact of land use land cover on land surface temperature in the study area. � From the finding that land surface temperature is negatively correlated to vegetation, it is advisable to afforest the regions, especially in highly built up areas and barren land. This will in turn reduce the land surface temperature of the region and thus to a certain extent influence the micro-climate of the region. � It is recommended that for better findings best quality and finer resolution daily satellite images of the study area longer year LST is better to see the change of LST more correctly because Coarser resolution satellite dataset did not give much information of the surface temperature related to heterogeneous and complex urban areas. References Albaladejo, J., M. Martinez-Mena., A. Roldan, and V. Castillo. (1998). Soil degradation and desertification induced by vegetation removal in a semiarid environment. Soil Use and Management 14 (1), 1-5. Anderson, J. R., Hardy, E. E., Roach, J. T., and Witmer, R. E. . (1976). A land use and land cover classification
system for use with remote sensor data. United state: U.S. Geological Survey Professional Paper, p. 964. Anderson, J. R., Hardy, J. T. R and Witmer, R. E. (1976). A land use and land cover classification. A. Pensuk
Journal of Environment and Earth Science www.iiste.org ISSN 2224-3216 (Paper) ISSN 2225-0948 (Online) Vol.7, No.6, 2017
62
and RP Shrestha/GMSARN International Journal 2 , 190. Congalton, R. G. (1999). Assessing the Accuracy of Remotely Sensed Data: Principles and Practices. Inc., Boca Raton, London, New York, Washington DC: CRC press. Cunningham, W. P. and Cunningham, M. A. (2008). Environmental Science: A global concern. New York: McGraw‐Hill. Dash, P. (2005). Land surface temperature and emissivity retrieval from satellite measurements. Germany: University of Karlsruhe, Germany. EFAP. (1994 ). Ministry of Natural Resources Development and Environmental Protection. Ethiopian Forest Action Pan Program. Addis Ababa, Ethiopia . FAO. (1998). Land Cover Classification System (LCCS):Classification Concepts and User Manual. Rome: Environment and Natural Resources Service (SDRN), GCP/RAF/287/ITA Africover – East Africa Project. Farina, A. (2012). Exploring the relationship between land surface temperature and vegetation abundance for urban heat island mitigation in Seville, Spain. LUMA-GIS Thesis nr 15, 2. Jie, C., J. Chen, M. Tan, and Z. Gong. (2002). Soil degradation: a global problem endangering sustainable development. Journal of Geographical Sciences 12 (2), 243-252. Marland, G., R. A. Pielke, M. Apps, R. Avissar, R. A. Betts, K. J. Davis, P. C.Frumhoff, S. T. Jackson, L. A. Joyce, P. Kauppi, J. Katzenberger, K. G. MacDicken, R. P. Neilson, J. O. Niles, S. Niyogi, R. J. Norby, N. Pena, N. Sampson and Y. Xue. (2003). The climatic impacts of land surface change and carbon management, and the implications for climate-change mitigation policy. Climate Policy 3 (2), 149-157. Maron, M., and J. Fitzsimons . (2007). Agricultural intensification and loss of matrix habitat over 23 years in the West Wimmera, south-eastern Australia. Biological Conservation 135 (4) , 587-593. NASA. (2002). LANDSAT Project Science office. Nelson, British Columbia Kimberly, Ralf Waters, Richard Allen, Wim Bastiaanssen, Masahiro Tasumi and Ricardo Trezza. (2002). SEBAL. Netherland: University of Idaho. Sterling and Ducharne. (2008). Comprehensive data set of global land coverchange model applications. Global Biogeochemical Cycles (3): GB3017, 22. UNEP, F. (1996). 0ur land our future. Rome: FAO. Wallace, O. C., J. Qi, P. Heilma, and R. C. Marsett. (2009). Remote sensing for cover change assessment in southeast Arizona. . Journal of Range Management 56(5), 402-409. Weng and Losand (2001). Spatial analysis of urban growth impacts on vegetative greenness with Landsat TM data. Geocarto International 16 (4),, 17–25. Wim H. Bakker Lucas, L. F. Janssen Colin, V. Reeves, Ben G. H. Gorte, Christine Pohl, Michael J. C.Weir, John A. Horn, Anupma Prakash and TsehaieWoldai. (2001). Principle of Remote Sensing, An introductory textbook. Netherlands: The International Institute for Aerospace Survey and Earth Sciences (ITC), Hengelosestraat 99,. Zhengming, W. and Dozier, J. (2009). Land-surface temperature measurement from space: physical principles and inverse modeling. Geoscience and Remote Sensing, IEEE Transactions on 27(3), 268-278.

Journal of Environment and Earth Science www.iiste.org ISSN 2224-3216 (Paper) ISSN 2225-0948 (Online) Vol.7, No.6, 2017
63
Figure 1, map of study area
Figure 2, Sample size
Journal of Environment and Earth Science www.iiste.org ISSN 2224-3216 (Paper) ISSN 2225-0948 (Online) Vol.7, No.6, 2017
64
Figure 3, Land Surface Temperature estimation model in ERDAS Image 2014
Journal of Environment and Earth Science www.iiste.org ISSN 2224-3216 (Paper) ISSN 2225-0948 (Online) Vol.7, No.6, 2017
65
Figure 4, Analytical flow chart.
Journal of Environment and Earth Science www.iiste.org ISSN 2224-3216 (Paper) ISSN 2225-0948 (Online) Vol.7, No.6, 2017
66
figure 5, Land Surface Temperature result for (a) 1999, (b) 2002, (c) 2006, (d) 2010, and (e) 2014 respectively.

Journal of Environment and Earth Science www.iiste.org ISSN 2224-3216 (Paper) ISSN 2225-0948 (Online) Vol.7, No.6, 2017
67
Figure 6, Land Surface Temperature Trends
Figure 7, Land Use Land Cover map (a) for 1999, (b) 2006, and (c) 2014 respectively

Journal of Environment and Earth Science www.iiste.org ISSN 2224-3216 (Paper) ISSN 2225-0948 (Online) Vol.7, No.6, 2017
68
Table 1, Matrix of land use and land cover change in the Debre Tabor district in 1999 up to 2014 Land use Land Cover Class in 2014 (Sq.km) cultivated urban Bare land Shrub land Forest Total area in Sq.km
Land us
e Land C
over Cl
ass in
1999 (S
q.km)
cultivated 23.36 (51.99%) 7.21 (16.04%) 13.07 (29.09%) 1.09 (2.43%) 0.2 (0.44%) 44.93 urban 0.55 (5.38%) 8.34 (81.52%) 0.9 (8.79%) 0.39 (3.81%) 0.05 (0.49%) 10.23 Bare land 6.47 (83.69%) 0.49 (6.34%) 0.63 (8.15%) 0.12 (1.55%) 0.02 (0.26%) 7.73 Shrub land 13.05 (44.71%) 5.34 (18.29%) 2.57 (8.80%) 7.78 (26.65%) 0.45 (1.54%) 29.19 Forest 12.68 (66.01%) 0.37 (1.93%) 0.01 (0.05%) 0.41 (0.08%) 5.74 (29.88%) 19.21 Total area in Sq.km 56.11 21.75 17.18 9.79 6.46 111.29
Table 2, LST value of each LULC type in year category Mean LST in LULC Type Year Urban Land Bare Land Cultivated Land Shrub Land forest 1999 16.85 15.98 15.80 15.27 14.78 2002 16.88 16.49 15.99 15.29 14.79 2006 17.32 16.95 16.08 15.32 14.90 2010 17.75 17.08 16.57 15.49 15.08 2014 17.97 17.14 16.78 15.60 15.47 Table 3, LST differences in year varation with each LULC type LST Difference in Year interval Urban Land Bare Land Cultivation Land Shrub Land Forest 2002- 1999 0.03 0.51 0.19 0.02 0.01 2006 - 2002 0.44 0.46 0.09 0.03 0.11 2010 - 2006 0.43 0.13 0.49 0.17 0.18 2014 - 2010 0.22 0.06 0.21 0.11 0.39 2014 - 1999 1.12 1.16 0.98 0.33 0.69
Figure 8, The relationship between all LULC types with LST.

Journal of Environment and Earth Science www.iiste.org ISSN 2224-3216 (Paper) ISSN 2225-0948 (Online) Vol.7, No.6, 2017
69
Table 4, the gain or loss comparison of each LULC LULC Class Name Avg LST Regression equation Gain (+) or Loss (-) value Regression Value Correlation value Urban Land 17.35 Y= 0.3113x + 16.419 0.9522 0.979015 Bare Land 16.73 Y= 0.291x + 15.856 0.8834 0.900255 Cultivated Land 16.24 Y= 0.2534x + 15.483 0.9469 0.927071 Shrub Land 15.39 Y= 0.0864x + 15.133 0.8881 -0.955346 Forest 15 Y= 0.1679x + 14.5 0.8434 -0.831025
Figure 9, the relationship between LULC and area coverage