Embed Size (px)
Citation preview

Monitoring Aquatic
Contaminants with Time-
averaged Concentrations by
Programmable In Situ Extraction
Rolf U. Halden, PhD, PE
Isaac B. Roll, PhD
October 27, 2015
1

This work was performed under
ESTCP ER-201122
Cost-Effective, Ultra Sensitive Groundwater
Monitoring for Site Remediation and
Management
2

1. Background and
Rationale
2. In Situ Sampler
3. Demonstration
4. Applicability
5. Questions and
Comments
Agenda
3
Photograph: Erin Driver

1. Background and
Rationale
4

• Characterization
drives up to 25% of
remediation
expenditures1,2
• $2 billion/year (US)
• Federal mandates to
reduce energy use,
carbon emission
Sustainability and Economics
25%
Characterization
and Monitoring
Side Remediation Expenditures
(approximately $8 billion/year)
51. Background and Rationale
Photograph: Isaac Roll

• Taking measure
– Sampling method in
the field
– Analytical method in
the lab
• Sources of error
– Sampling: >90%3
– Analytical: <10%
• Training, SOPs,
QA/QC cannot
address all sources
Environmental Characterization
Characterization
And Monitoring
61. Background and Rationale
Photograph: Alizee Jenck

• Preservation
• Mass and volume
– Transportation
– Hazardous waste
• Field extraction
– Improves stability of
analytes4
– Reduces mass,
handling
Liquid Sample Challenges
Characterization
And Monitoring
61. Background and Rationale
Photograph: Isaac Roll

• Discrete sampling
may be too infrequent
• Time-integrated
sampling
– Passive samplers
(weeks)
– Active samplers
(days)
– Reproducibility
Dynamic Environments
Characterization
And Monitoring0
0.5
1
1.5
0 5 10 15 20
C/C
0
Time
Cw
CA Discrete Sample Set A
CB Discrete Sample Set B
0
0.5
1
1.5
0 5 10 15 20
C/C
0
Time
Cw
CR Accumulative Sampler
81. Background and Rationale

Approach• Reduce and manage sampling error
– Active sampler
– Simultaneous, replicate samples
• Eliminate liquid samples
– In situ extraction with off-the-shelf consumables
– Reduce sample mass, improve stability
• Time-integrated sampling
– Programmable sampling rate
– Sampling periods from days to weeks
Characterization
And Monitoring
91. Background and Rationale

2. In Situ Sampler (IS2)
10

Reduce and Manage Error• Precision,
programmable
positive-displacement
pumps
• Six parallel sampling
channels for
simultaneous
replicates
• Autoclavable glass
(5 mL) or plastic
(10 mL) syringes 112. In Situ Sampler (IS2)
Photographs: Isaac Roll

• Solid phase extraction
(SPE)
• Parallel and/or series
extraction
• Commercial, off-the-
shelf cartridges and
sorbents
• Lab methods
become field
methods
Eliminate Liquid Samples
7.5 cm
122. In Situ Sampler (IS2)
Photographs: Isaac Roll

• Programmable
sampling rate
• Timed aliquots or
nearly-continuous
sampling
• Sampling periods
from days to weeks
2. In Situ Sampler (IS2)
13
Time-Integrated Sampling
0
0.5
1
1.5
0 5 10 15 20
C/C
0
Time
Cw
CR Accumulative Sampler
2. In Situ Sampler (IS2)

14
In Situ Sampler (IS2)
140 cm demonstration sampler
(including optional liquid capture)
2. In Situ Sampler (IS2)
Photograph: Sara Murch

3. Demonstration
15

• Shallow, coastal
freshwater aquifer
• Sands, sandy silts
• Chromium-VI
• Demonstration well
– 10-cm diameter
– Water at 4 ft
– Screened 9 – 19 ft
– 0.25 mg/L Cr(VI)
(July 2013)
16
Demonstration: Coronado Island
3. Demonstration
Satellite Image: Google Earth

• 24-hour sampling at
two-hour intervals
• Cr(VI) concentration
fluctuated by ±20%
of mean
• Fluctuation followed
tide
• No observed change
in depth to water
17
Pre-Demonstration Sampling
-1.5
-1.0
-0.5
0.0
0.5
1.0
1.5
0.5
1.0
1.5
2.0
Tid
e (
AM
SL),
Well
(DT
W)
(m)
Concentr
ation (
mg/L
)Chromium(VI)
Tide (AMSL)
Well (DTW)
12:0
0 P
M
12:0
0 A
M
12:0
0 P
M
3. Demonstration

Demonstration Objectives
• Reduce and manage sampling error
– 1.25 mL samples at 2-hr intervals
– 420 mL total
– Triplicate samples
• Eliminate liquid samples
– Parallel SPE and liquid sampling to
demonstrate equivalence
• Time-integrated sampling
– 28-day, 420-mL composite sample
183. Demonstration

19
Demonstration: Coronado Island
3. Demonstration
Photographs: Isaac Roll

20
Demonstration: Coronado Island
3. Demonstration
Photographs: Erin Driver (L) and Isaac Roll (R)

Reduce and Manage Sampling Error
21
• Triplicate samples
provide inter-
sample error (8%)
• Active sampling
improved sampling
rate (RS) precision
(3.4%) versus
passive
samplers7,8,9,10
3. Demonstration
0
10
20
30
40
50
60
70
80
90
100
CSS MESCO POCIS SPMD IS2
(n = 18) (n = 21) (n = 46) (n = 12) (n = 8)
RS
D (
%)
of S
am
plin
g R
ate
Range of RSD (%) Observed for
Sampling Rates
CSS: Constantly Stirred SorbentMESCO: Membrane-Enclosed Sorptive Coating POCIS: Polar Organic Chemical Integrative SamplerSPMD: Semipermeable Membrane DeviceIS2: In Situ Sampler
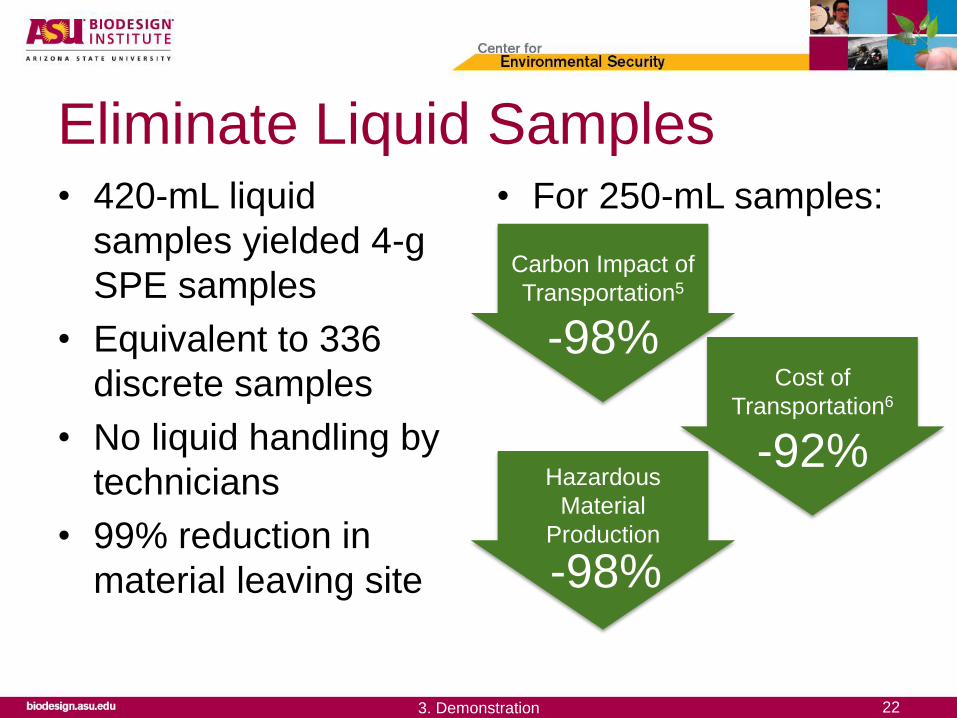
• 420-mL liquid
samples yielded 4-g
SPE samples
• Equivalent to 336
discrete samples
• No liquid handling by
technicians
• 99% reduction in
material leaving site
• For 250-mL samples:
22
Eliminate Liquid Samples
Hazardous
Material
Production
-98%
Cost of
Transportation6
-92%
Carbon Impact of
Transportation5
-98%
3. Demonstration

• 28-day time-
integrated average
• 75% ± 6% recovery
• 8-fold improvement in
reporting limit
23
Time-Integrated Sampling
0.01
0.10
1.00
Day 7 Day 14 Day 28 28-DayAverage
28-DayAverage
Liquid Composite Samples SorbedSamples
Co
nce
ntr
atio
n (
mg
/L)
Total Cr Reporting Limit
3. Demonstration

• Capital
– Research instrument
costs were similar to
available commercial
instruments ($4000)
• Operating
– Technician time in field
observed similar to
other instruments
– Waste and
transportation costs
reduced
24
Comparison of Costs
3. Demonstration
0
2500
5000
7500
IS2 LiquidAutosampler
6-ParameterSonde
BladderPump
US
Do
llars
Capital Cost

4. Applicability
25
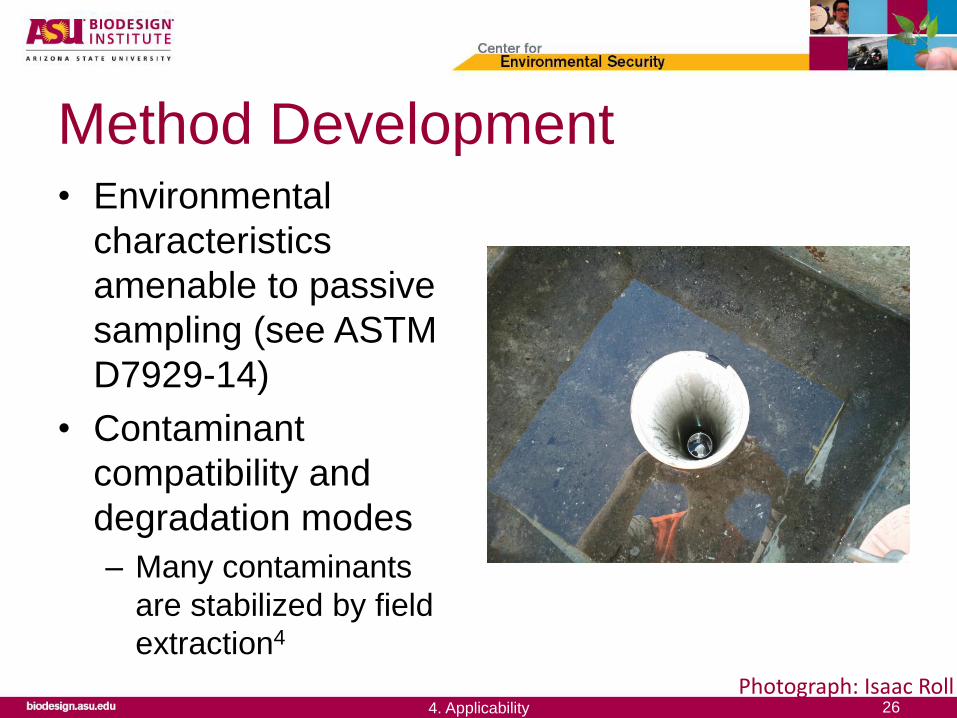
• Environmental
characteristics
amenable to passive
sampling (see ASTM
D7929-14)
• Contaminant
compatibility and
degradation modes
– Many contaminants
are stabilized by field
extraction4
26
Method Development
4. Applicability
Photograph: Isaac Roll

5. Conclusions
27

• In Situ Sampler
– High-precision active
sampling
– Simultaneous replicate
samples
– In situ solid phase
extraction
– Commercial off-the-
shelf consumables
– Long time-base, time-
integrated sampling
– Large sample volume28
Conclusions
Error
CO2
Waste
Cost
5. Conclusions
Photograph: Erin Driver

• ESTCP– Project Sponsor
• NAVFAC Southwest– Case Study Site at Naval
Air Station North Island, San Diego, CA
• Amec Foster Wheeler– Development Study Site
at Former Williams Air Force Base, Mesa, AZ
• ASU Center for Environmental Security Team and Collaborators
29
Acknowledgements
Photograph: Isaac Roll

References1. U. S. Environmental Protection Agency, Cleaning Up the Nation's Waste
Sites: Markets and Technology Trends; EPA 542-R-04-015; Washington,
DC, 2004.
2. Frost & Sullivan, U.S. Soil & Groundwater Remediation Technology Markets
- National Overview; San Antonio, TX, 2005.
3. Zhang, J.; Zhang, C., Sampling and sampling strategies for environmental
analysis. International Journal of Environmental Analytical Chemistry 2012,
92, (4), 466-478.
4. Green, D. R.; Le Pape, D., Stability of hydrocarbon samples on solid-phase
extraction columns. Analytical Chemistry 1987, 59, (5), 699-703.
5. U. S. Environmental Protection Agency, Optional Emissions from
Commuting, Business Travel and Product Transport; EPA430-R-08-006;
Washington, DC, 2008.
6. FedEx, 2015 Service Guide. http://www.fedex.com/serviceguide (July 17,
2015)
30
References7. Vrana, B.; Popp, P.; Paschke, A.; Schüürmann, G., Membrane-Enclosed
Sorptive Coating. An Integrative Passive Sampler for Monitoring Organic
Contaminants in Water. Analytical Chemistry 2001, 73, (21), 5191-5200.
8. Alvarez, D. A.; Petty, J. D.; Huckins, J. N.; Jones‐Lepp, T. L.; Getting, D. T.;
Goddard, J. P.; Manahan, S. E., Development of a passive, in situ,
integrative sampler for hydrophilic organic contaminants in aquatic
environments. Environmental Toxicology and Chemistry 2004, 23, (7), 1640-
1648.
9. Huckins, J. N.; Petty, J. D.; Orazio, C. E.; Lebo, J. A.; Clark, R. C.; Gibson,
V. L.; Gala, W. R.; Echols, K. R., Determination of uptake kinetics (sampling
rates) by lipid-containing semipermeable membrane devices (SPMDs) for
polycyclic aromatic hydrocarbons (PAHs) in water. Environmental Science &
Technology 1999, 33, (21), 3918-3923.
10.Llorca, J.; Gutiérrez, C.; Capilla, E.; Tortajada, R.; Sanjuán, L.; Fuentes, A.;
Valor, I., Constantly stirred sorbent and continuous flow integrative sampler:
New integrative samplers for the time weighted average water monitoring.
Journal of Chromatography A 2009, 1216, (31), 5783-5792.
31

Questions?
32
Photograph: Erin Driver

CorrespondanceRolf U. Halden, PhD, PE
Director, Center for Environmental Security
The Biodesign Institute at Arizona State University
781 E. Terrace Road, Tempe, AZ 85287-5904
Email: [email protected]
Phone: 480-727-0893
33