Embed Size (px)
Citation preview

Information Classification: General
JAMES MONTIER
PARTNER AND SENIOR ASSET ALLOCATION STRATEGIST
GMO
MORNING KEYNOTE: LATE CYCLE LAMENT

Information Classification: General
LATE CYCLE LAMENT
James Montier
Information Classification: General
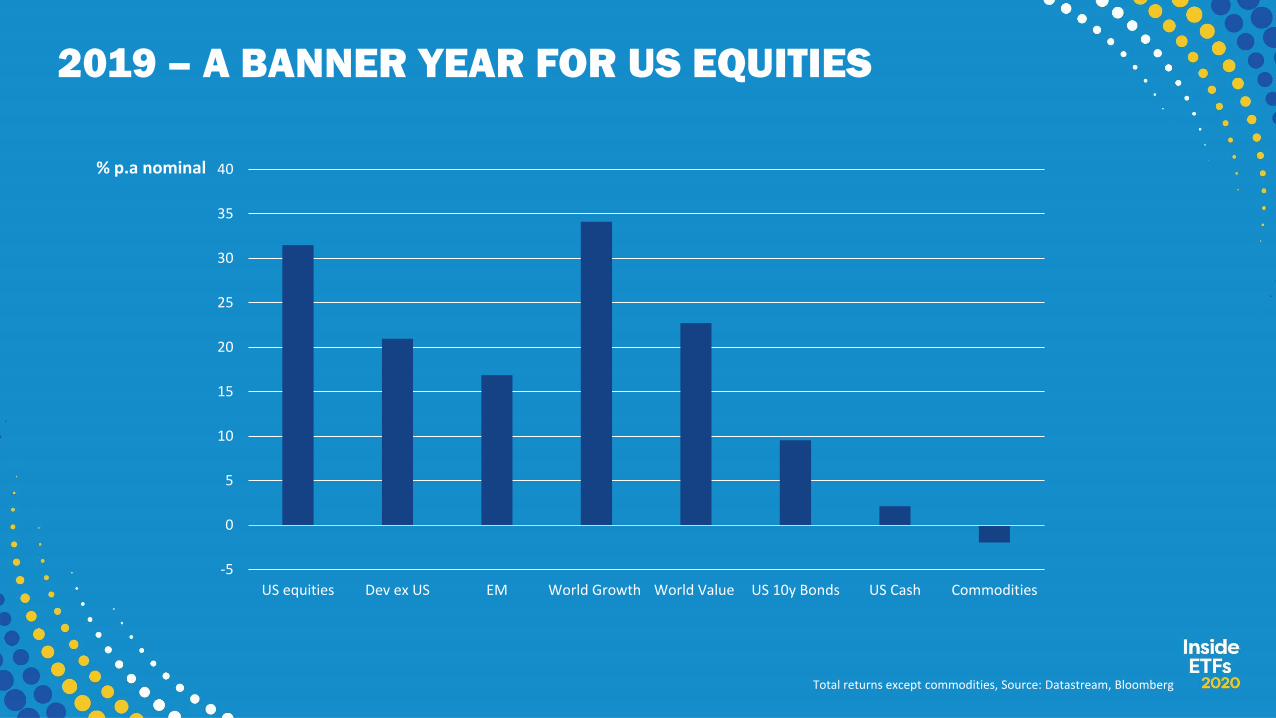
2019 – A BANNER YEAR FOR US EQUITIES
-5
0
5
10
15
20
25
30
35
40
US equities Dev ex US EM World Growth World Value US 10y Bonds US Cash Commodities
% p.a nominal
Total returns except commodities, Source: Datastream, Bloomberg
Information Classification: General
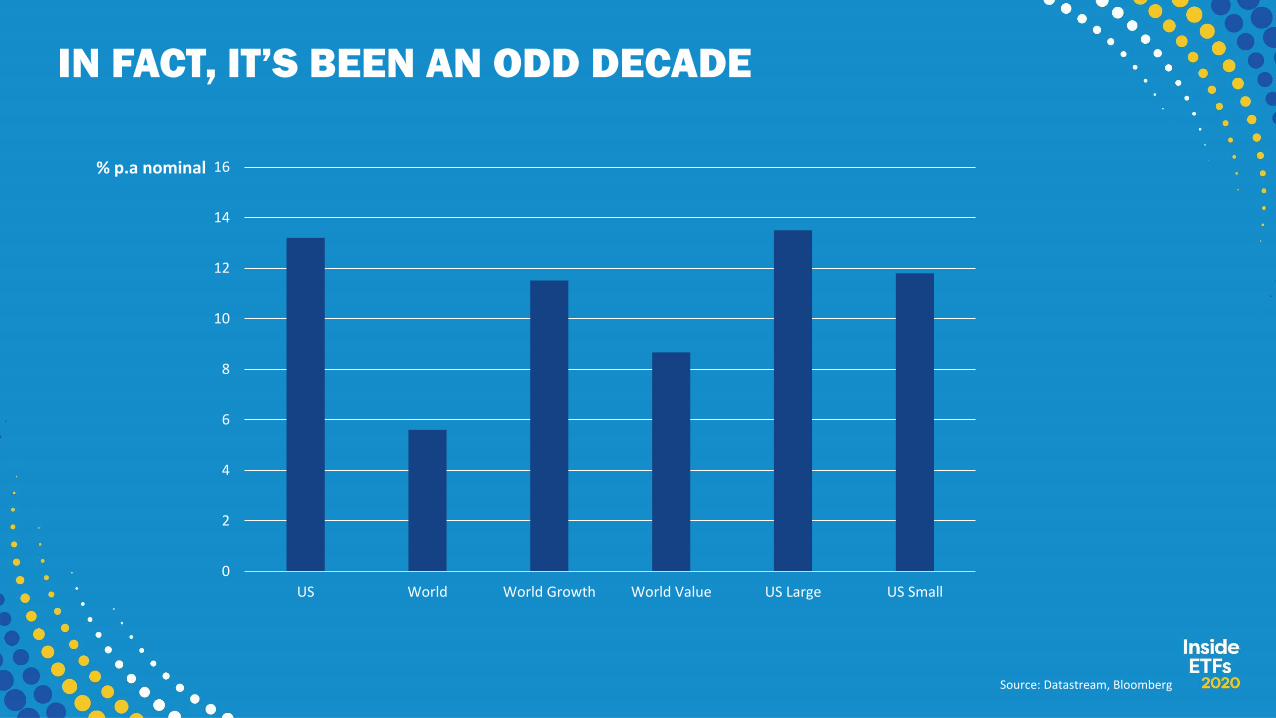
IN FACT, IT’S BEEN AN ODD DECADE
% p.a nominal
Source: Datastream, Bloomberg
0
2
4
6
8
10
12
14
16
US World World Growth World Value US Large US Small
Information Classification: General
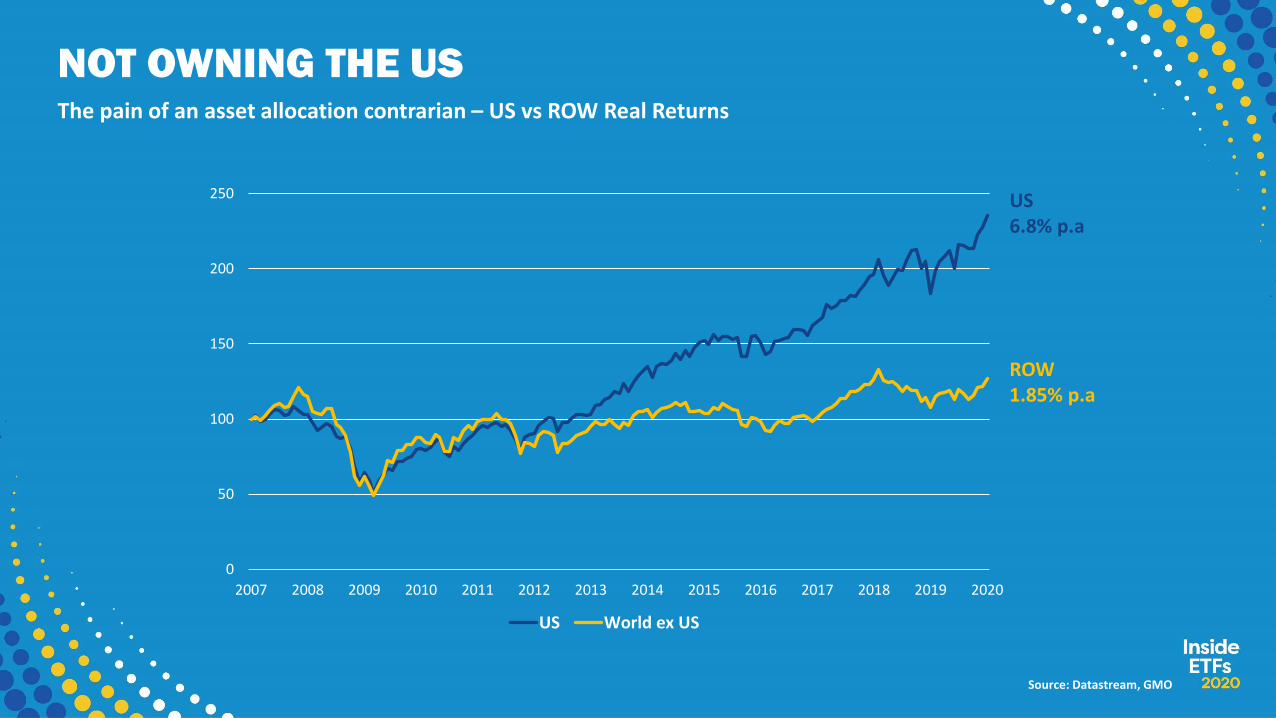
NOT OWNING THE USThe pain of an asset allocation contrarian – US vs ROW Real Returns
0
50
100
150
200
250
2007 2008 2009 2010 2011 2012 2013 2014 2015 2016 2017 2018 2019 2020
US World ex US
Source: Datastream, GMO
US6.8% p.a
ROW1.85% p.a
Information Classification: General
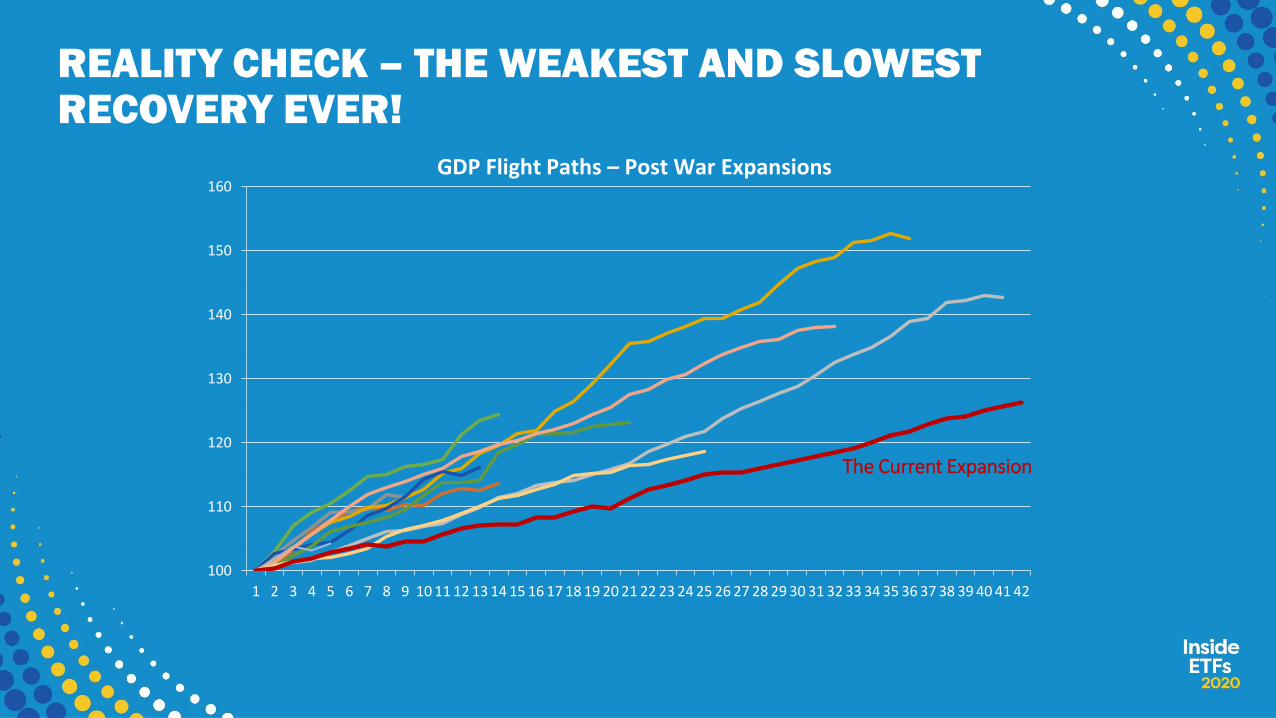
REALITY CHECK – THE WEAKEST AND SLOWEST RECOVERY EVER!
100
110
120
130
140
150
160
1 2 3 4 5 6 7 8 9 10 11 12 13 14 15 16 17 18 19 20 21 22 23 24 25 26 27 28 29 30 31 32 33 34 35 36 37 38 39 40 41 42
The Current Expansion
GDP Flight Paths – Post War Expansions
Information Classification: General
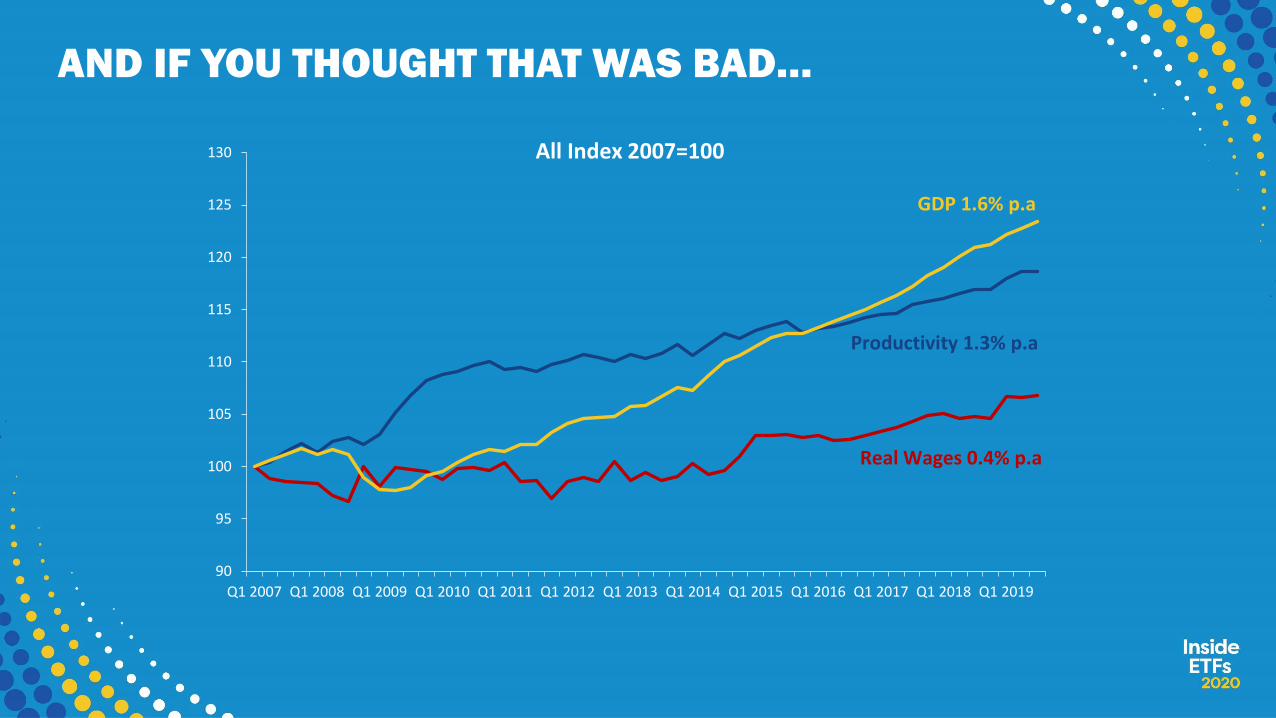
AND IF YOU THOUGHT THAT WAS BAD…
90
95
100
105
110
115
120
125
130
Q1 2007 Q1 2008 Q1 2009 Q1 2010 Q1 2011 Q1 2012 Q1 2013 Q1 2014 Q1 2015 Q1 2016 Q1 2017 Q1 2018 Q1 2019
GDP 1.6% p.a
Productivity 1.3% p.a
Real Wages 0.4% p.a
All Index 2007=100
Information Classification: General
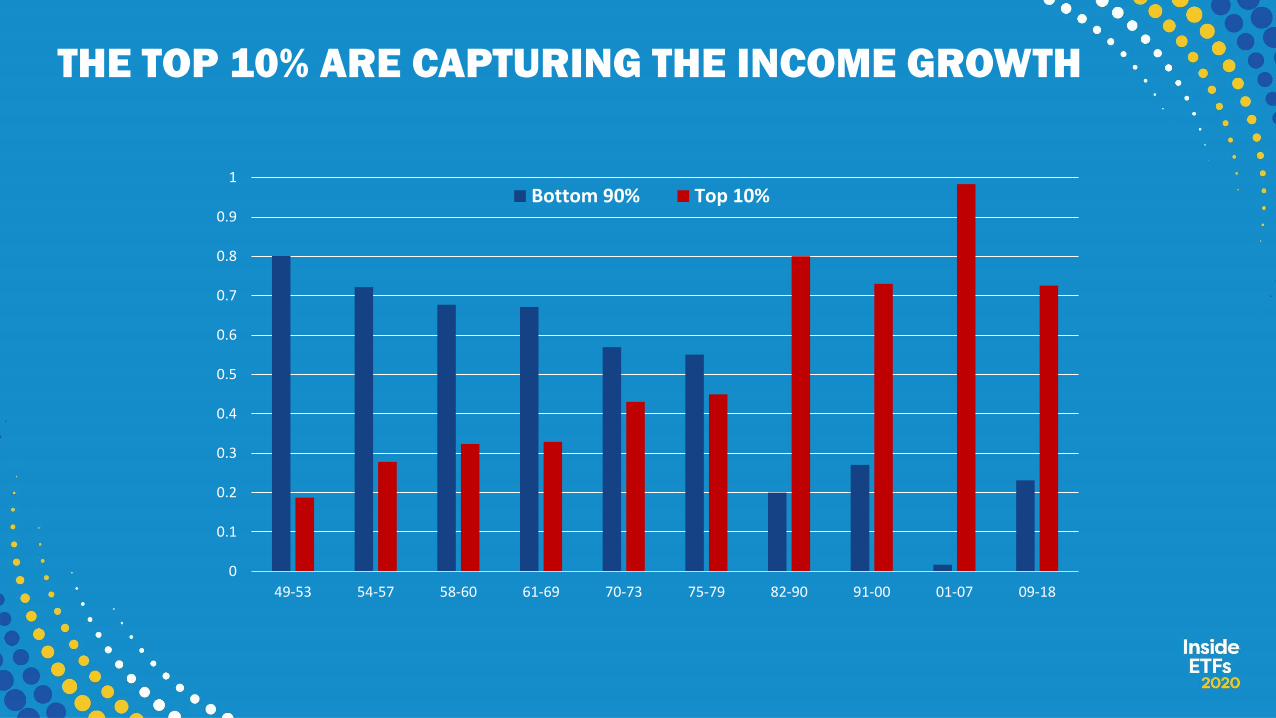
THE TOP 10% ARE CAPTURING THE INCOME GROWTH
0
0.1
0.2
0.3
0.4
0.5
0.6
0.7
0.8
0.9
1
49-53 54-57 58-60 61-69 70-73 75-79 82-90 91-00 01-07 09-18
Bottom 90% Top 10%

Information Classification: General
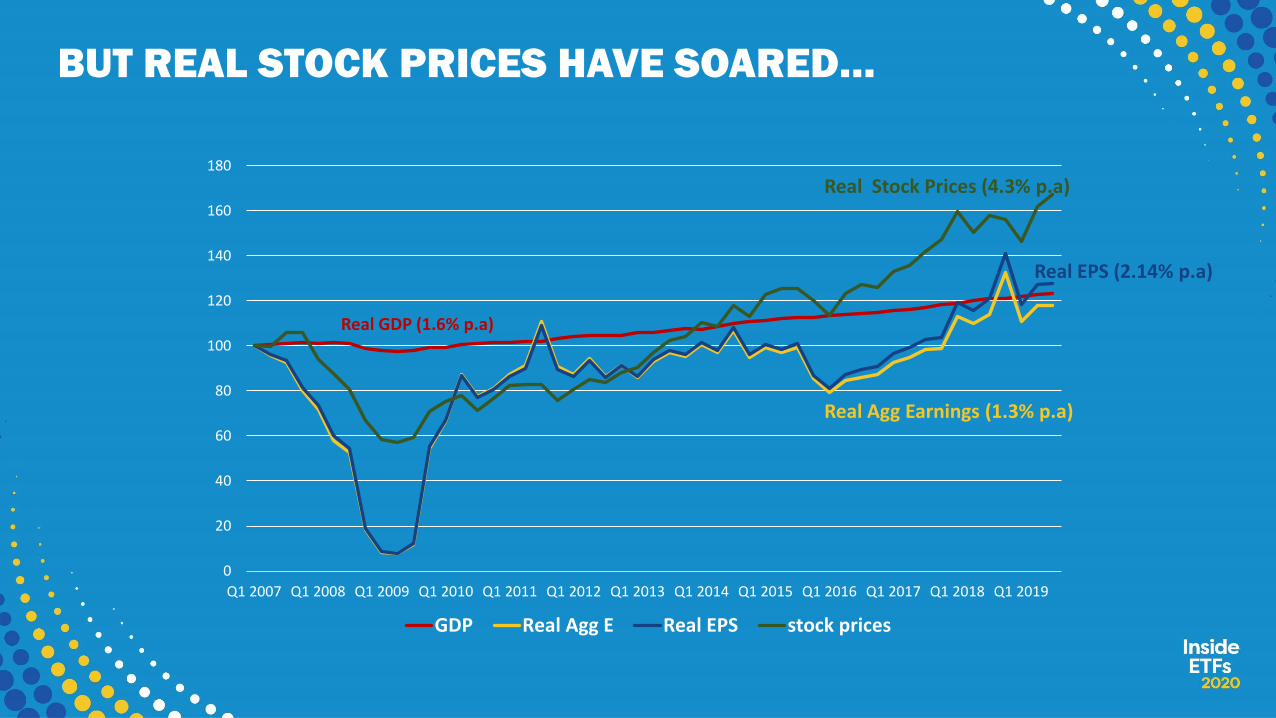
BUT SURELY EPS IS JUST FINE…
0
20
40
60
80
100
120
140
160
Q1 2007 Q1 2008 Q1 2009 Q1 2010 Q1 2011 Q1 2012 Q1 2013 Q1 2014 Q1 2015 Q1 2016 Q1 2017 Q1 2018 Q1 2019
Real GDP (1.6% p.a)
Real Agg Earnings (1.3% p.a)
Real EPS (2.14% p.a)
Indexed Q1 2007 = 100
Information Classification: General
BUT REAL STOCK PRICES HAVE SOARED…
0
20
40
60
80
100
120
140
160
180
Q1 2007 Q1 2008 Q1 2009 Q1 2010 Q1 2011 Q1 2012 Q1 2013 Q1 2014 Q1 2015 Q1 2016 Q1 2017 Q1 2018 Q1 2019
GDP Real Agg E Real EPS stock prices
Real GDP (1.6% p.a)
Real Agg Earnings (1.3% p.a)
Real EPS (2.14% p.a)
Real Stock Prices (4.3% p.a)

Information Classification: General
WHEN WOULD YOU RATHER BUY?
There are three principal phases of a bull market: the first is represented by reviving confidence in the future of business; the second is the response of stock prices to the known improvement in corporate earnings, and the third is the period when speculation is rampant – a period when stocks are advanced on hopes and expectations.
There are three principal phases of a bear market: the first represents the abandonment of the hopes upon which stocks were purchased at inflated prices; the second reflects selling due to decreased business and earnings, and the third is caused by distress selling of sound securities, regardless of their value, by those who must find a cash market for at least a portion of their assets.
– Robert Rhea, The Dow Theory, 1932
Information Classification: General
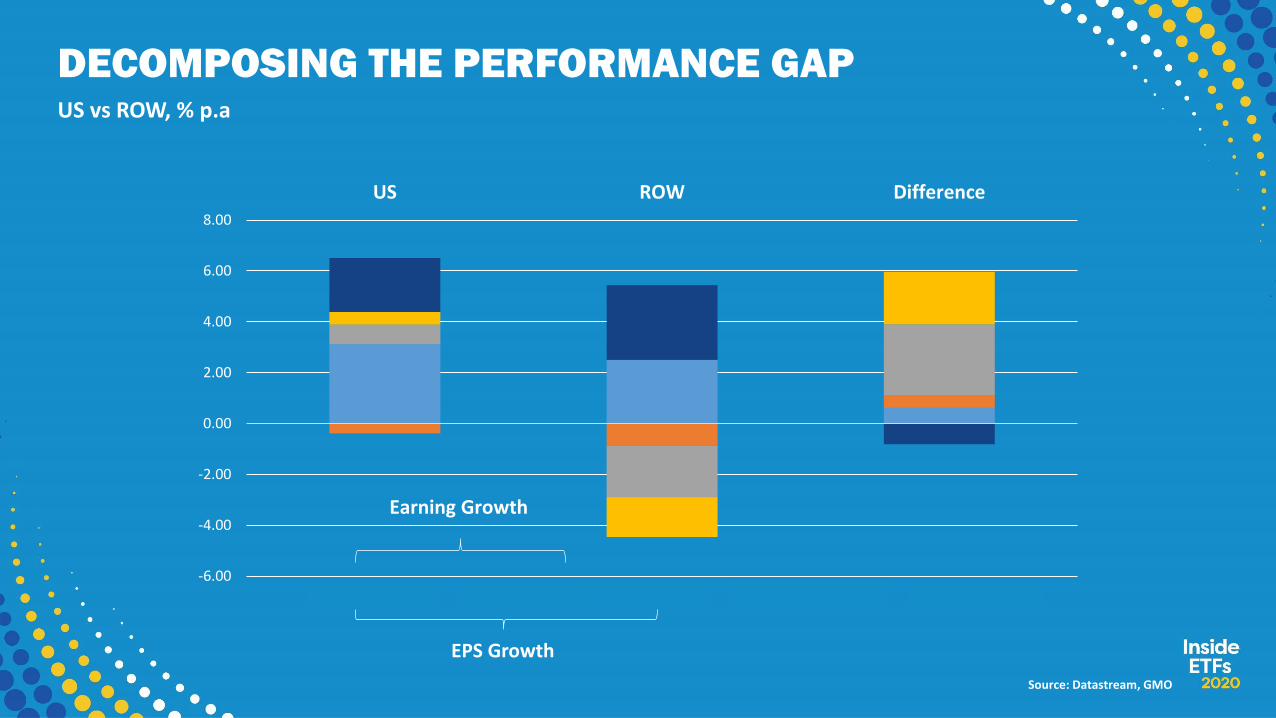
DECOMPOSING THE PERFORMANCE GAPUS vs ROW, % p.a
-6.00
-4.00
-2.00
0.00
2.00
4.00
6.00
8.00
US ROW Difference
Sales growth Margin growth Buybacks Valuation Change Income
Earning Growth
EPS Growth
Source: Datastream, GMO
Information Classification: General
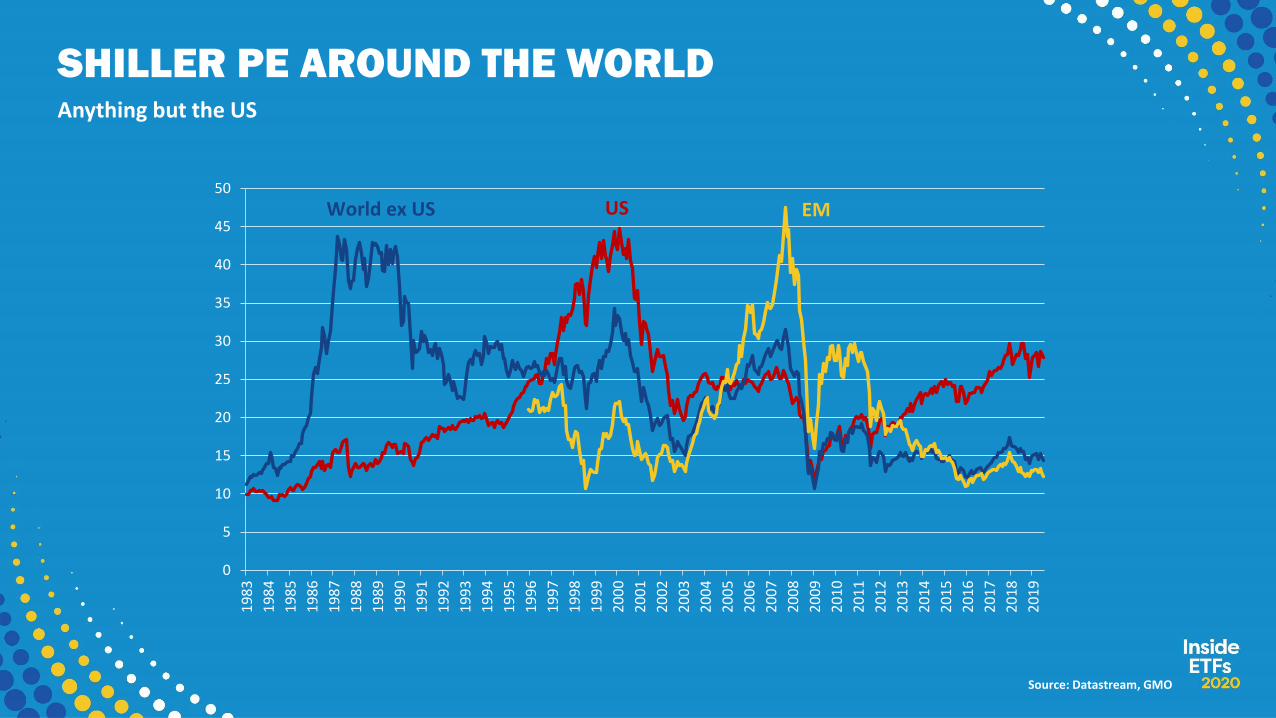
SHILLER PE AROUND THE WORLDAnything but the US
Source: Datastream, GMO
0
5
10
15
20
25
30
35
40
45
50
19
83
19
84
19
85
19
86
19
87
19
88
19
89
19
90
19
91
19
92
19
93
19
94
19
95
19
96
19
97
19
98
19
99
20
00
20
01
20
02
20
03
20
04
20
05
20
06
20
07
20
08
20
09
20
10
20
11
20
12
20
13
20
14
20
15
20
16
20
17
20
18
20
19
USWorld ex US EM
Information Classification: General
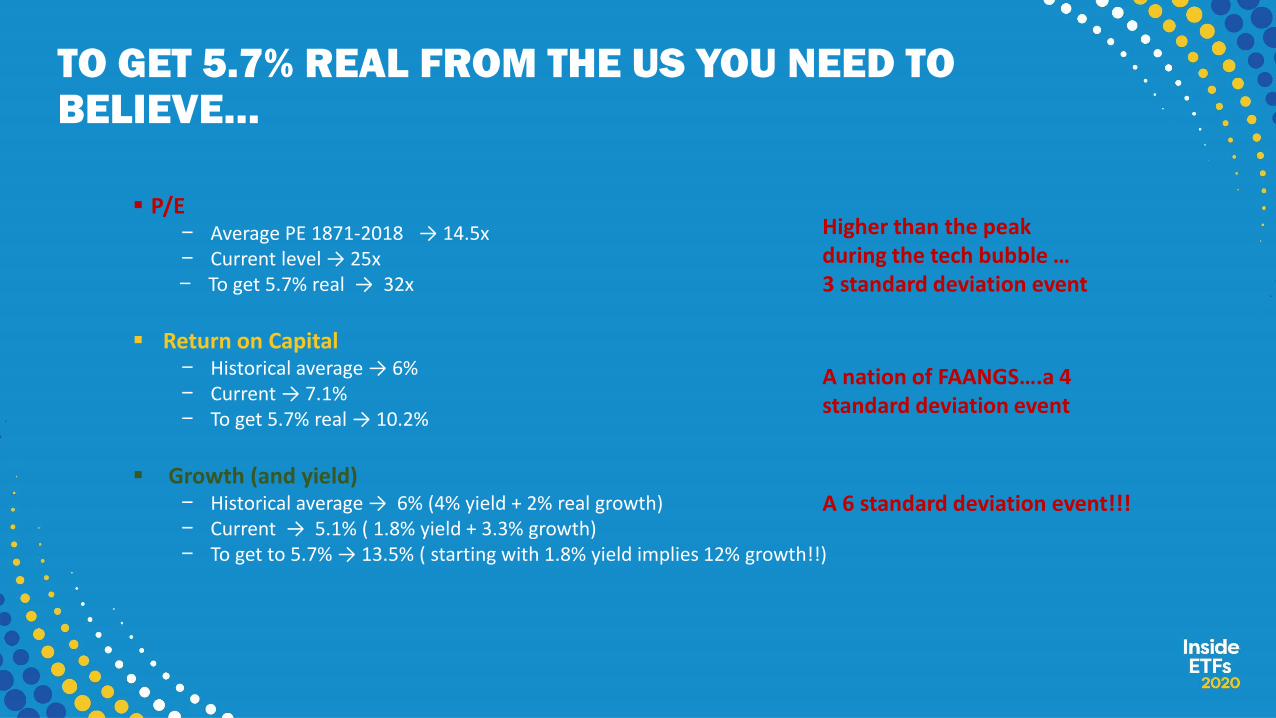
TO GET 5.7% REAL FROM THE US YOU NEED TO BELIEVE…
▪ P/E– Average PE 1871-2018 → 14.5x – Current level → 25x– To get 5.7% real → 32x
▪ Return on Capital– Historical average → 6%– Current → 7.1%– To get 5.7% real → 10.2%
▪ Growth (and yield)– Historical average → 6% (4% yield + 2% real growth)– Current → 5.1% ( 1.8% yield + 3.3% growth) – To get to 5.7% → 13.5% ( starting with 1.8% yield implies 12% growth!!)
Higher than the peak during the tech bubble …3 standard deviation event
A nation of FAANGS….a 4 standard deviation event
A 6 standard deviation event!!!
Information Classification: General
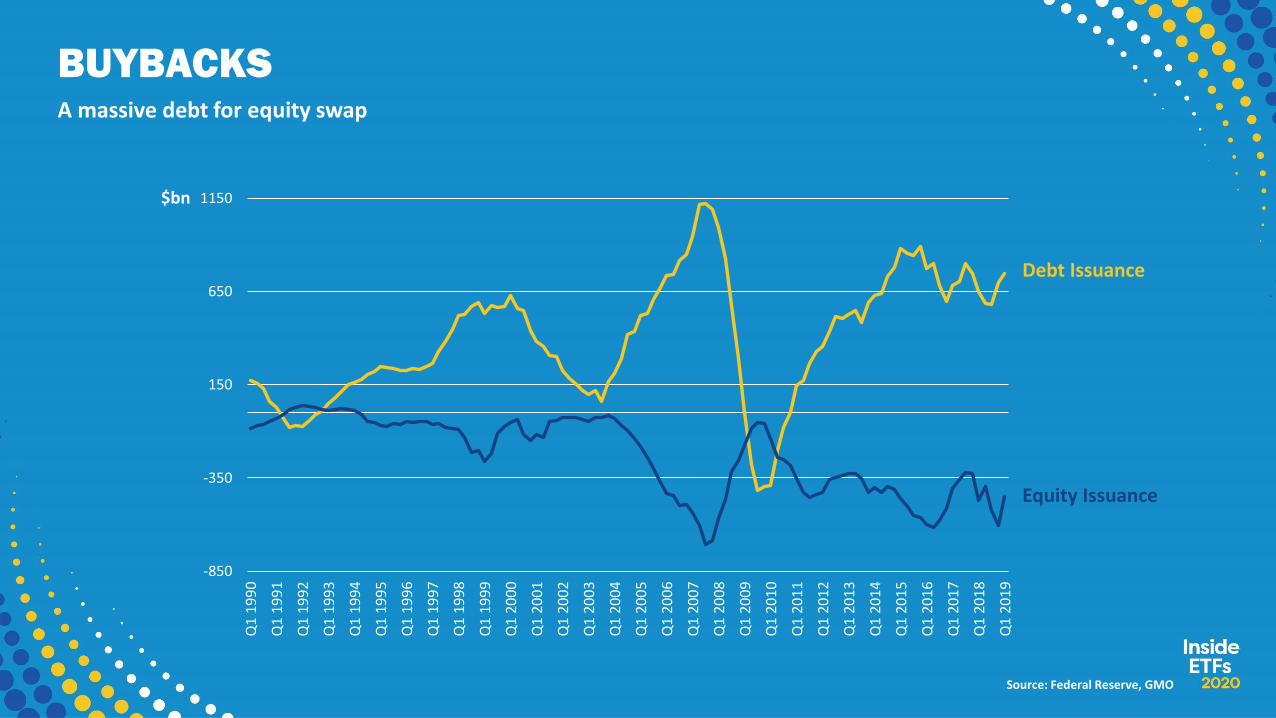
BUYBACKSA massive debt for equity swap
Source: Federal Reserve, GMO
-850
-350
150
650
1150
Q1
19
90
Q1
19
91
Q1
19
92
Q1
19
93
Q1
19
94
Q1
19
95
Q1
19
96
Q1
19
97
Q1
19
98
Q1
19
99
Q1
20
00
Q1
20
01
Q1
20
02
Q1
20
03
Q1
20
04
Q1
20
05
Q1
20
06
Q1
20
07
Q1
20
08
Q1
20
09
Q1
20
10
Q1
20
11
Q1
20
12
Q1
20
13
Q1
20
14
Q1
20
15
Q1
20
16
Q1
20
17
Q1
20
18
Q1
20
19
$bn
Debt Issuance
Equity Issuance
Information Classification: General
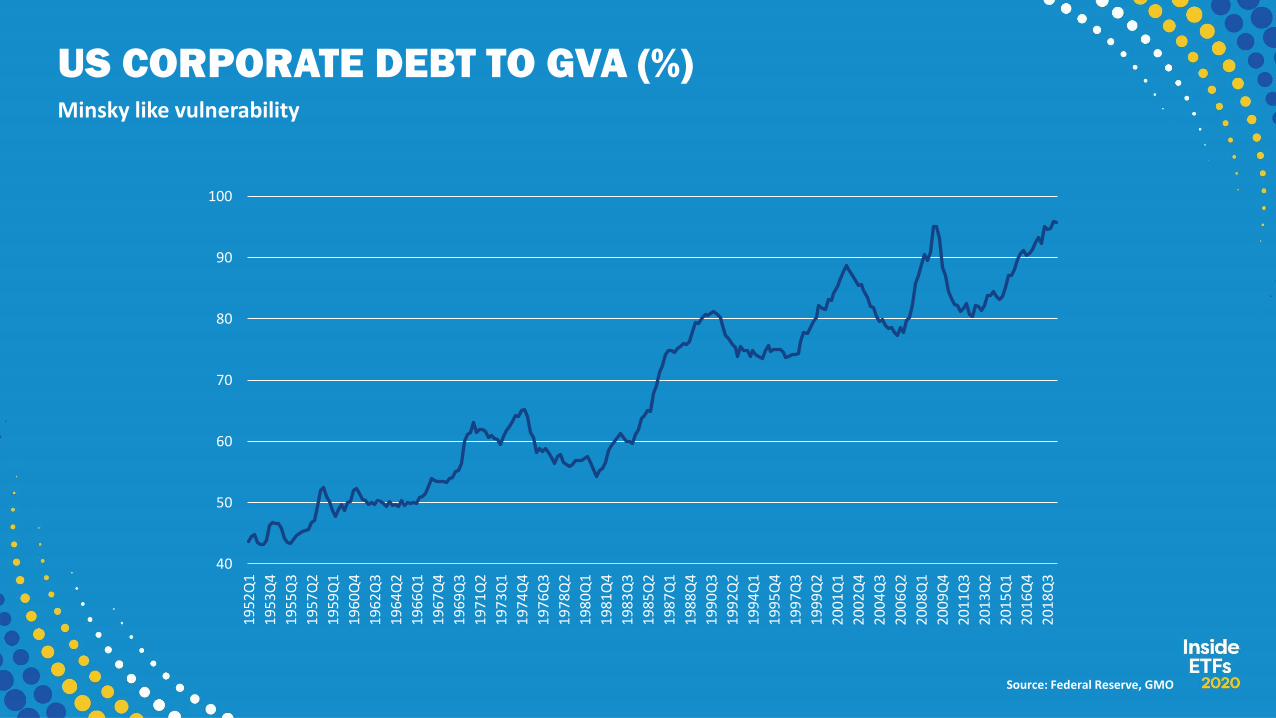
US CORPORATE DEBT TO GVA (%)Minsky like vulnerability
Source: Federal Reserve, GMO
40
50
60
70
80
90
100
19
52
Q1
19
53
Q4
19
55
Q3
19
57
Q2
19
59
Q1
19
60
Q4
19
62
Q3
19
64
Q2
19
66
Q1
19
67
Q4
19
69
Q3
19
71
Q2
19
73
Q1
19
74
Q4
19
76
Q3
19
78
Q2
19
80
Q1
19
81
Q4
19
83
Q3
19
85
Q2
19
87
Q1
19
88
Q4
19
90
Q3
19
92
Q2
19
94
Q1
19
95
Q4
19
97
Q3
19
99
Q2
20
01
Q1
20
02
Q4
20
04
Q3
20
06
Q2
20
08
Q1
20
09
Q4
20
11
Q3
20
13
Q2
20
15
Q1
20
16
Q4
20
18
Q3
Information Classification: General
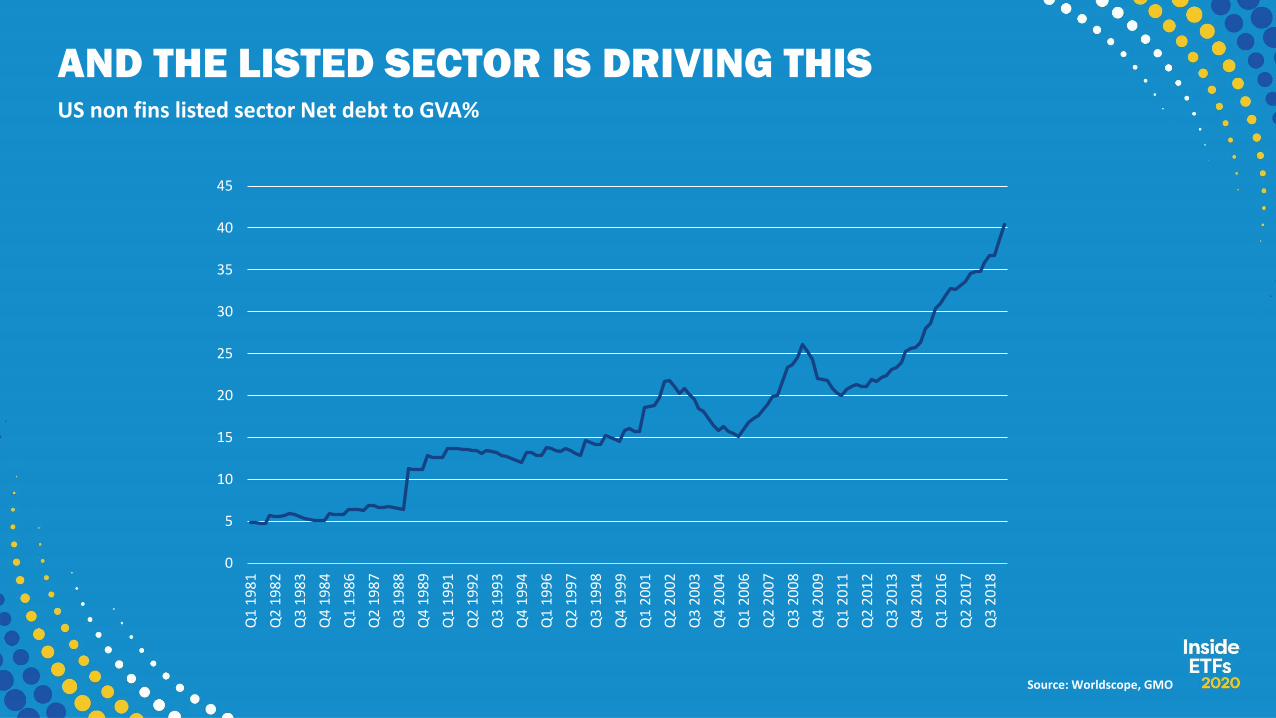
AND THE LISTED SECTOR IS DRIVING THISUS non fins listed sector Net debt to GVA%
Source: Worldscope, GMO
0
5
10
15
20
25
30
35
40
45
Q1
19
81
Q2
19
82
Q3
19
83
Q4
19
84
Q1
19
86
Q2
19
87
Q3
19
88
Q4
19
89
Q1
19
91
Q2
19
92
Q3
19
93
Q4
19
94
Q1
19
96
Q2
19
97
Q3
19
98
Q4
19
99
Q1
20
01
Q2
20
02
Q3
20
03
Q4
20
04
Q1
20
06
Q2
20
07
Q3
20
08
Q4
20
09
Q1
20
11
Q2
20
12
Q3
20
13
Q4
20
14
Q1
20
16
Q2
20
17
Q3
20
18
Information Classification: General
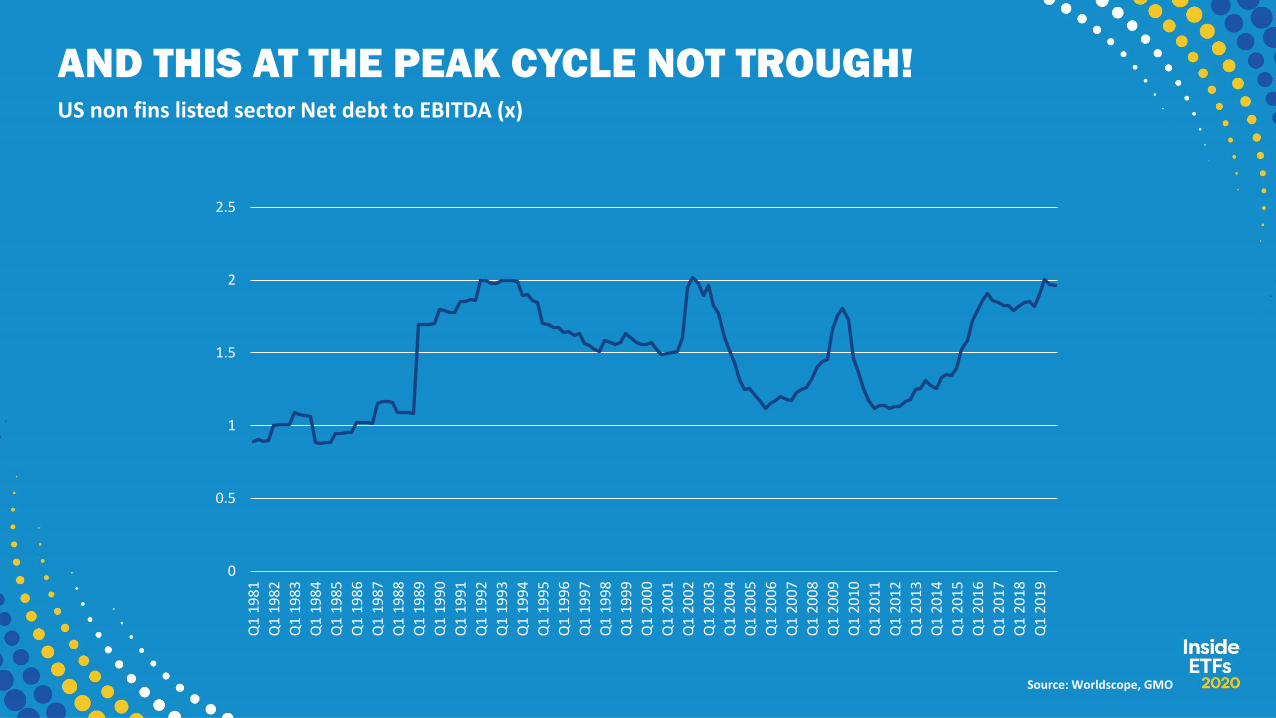
AND THIS AT THE PEAK CYCLE NOT TROUGH!US non fins listed sector Net debt to EBITDA (x)
Source: Worldscope, GMO
0
0.5
1
1.5
2
2.5
Q1
19
81
Q1
19
82
Q1
19
83
Q1
19
84
Q1
19
85
Q1
19
86
Q1
19
87
Q1
19
88
Q1
19
89
Q1
19
90
Q1
19
91
Q1
19
92
Q1
19
93
Q1
19
94
Q1
19
95
Q1
19
96
Q1
19
97
Q1
19
98
Q1
19
99
Q1
20
00
Q1
20
01
Q1
20
02
Q1
20
03
Q1
20
04
Q1
20
05
Q1
20
06
Q1
20
07
Q1
20
08
Q1
20
09
Q1
20
10
Q1
20
11
Q1
20
12
Q1
20
13
Q1
20
14
Q1
20
15
Q1
20
16
Q1
20
17
Q1
20
18
Q1
20
19
Information Classification: General
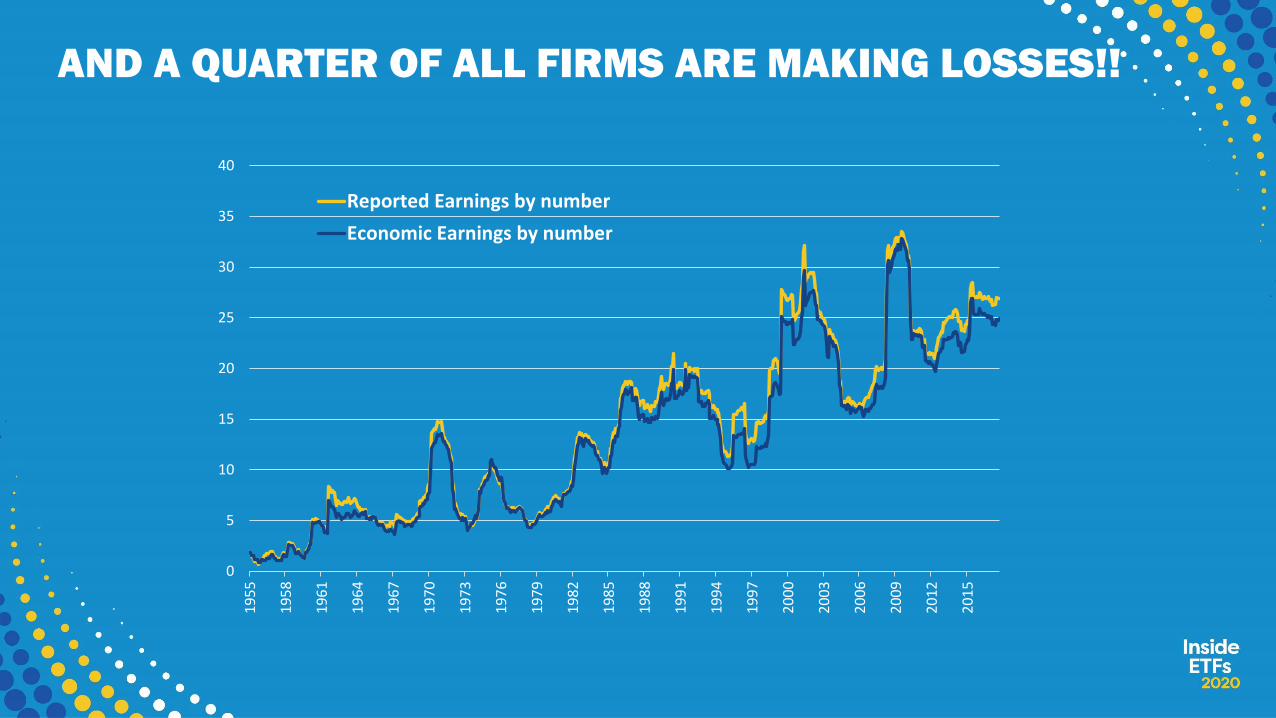
AND A QUARTER OF ALL FIRMS ARE MAKING LOSSES!!
0
5
10
15
20
25
30
35
40
19
55
19
58
19
61
19
64
19
67
19
70
19
73
19
76
19
79
19
82
19
85
19
88
19
91
19
94
19
97
20
00
20
03
20
06
20
09
20
12
20
15
Reported Earnings by number
Economic Earnings by number
Information Classification: General
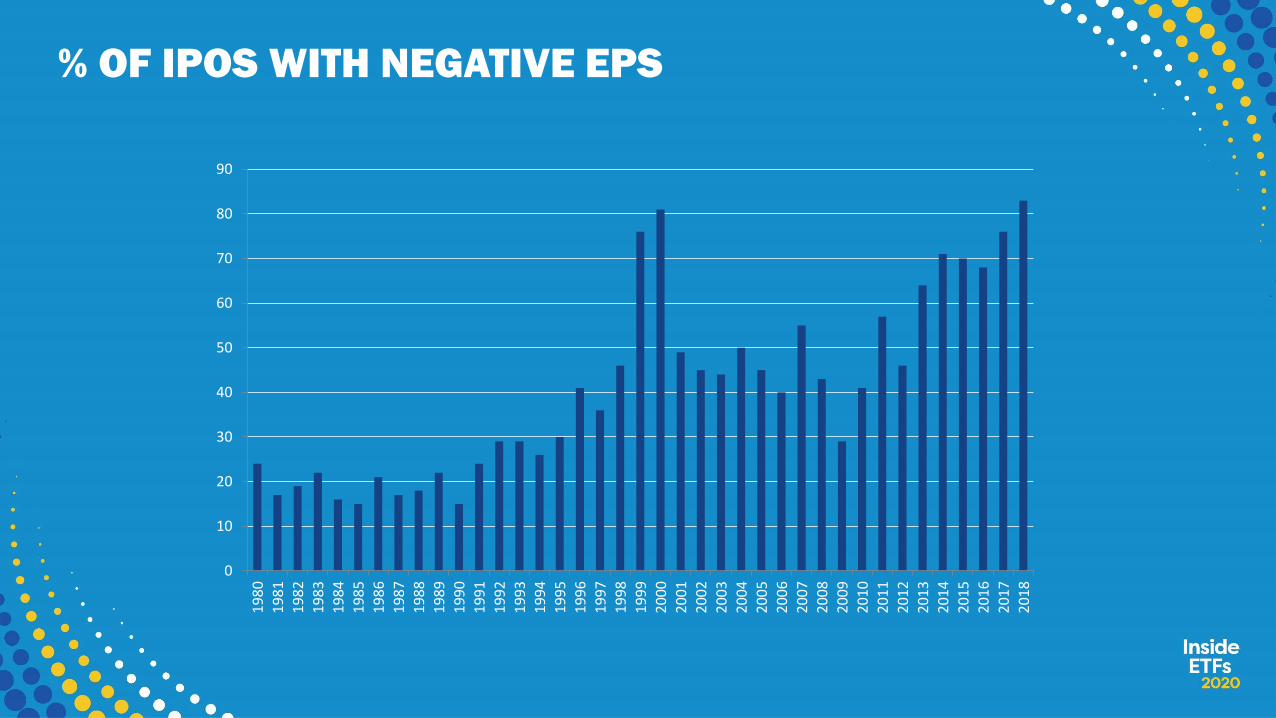
% OF IPOS WITH NEGATIVE EPS
0
10
20
30
40
50
60
70
80
90
19
80
19
81
19
82
19
83
19
84
19
85
19
86
19
87
19
88
19
89
19
90
19
91
19
92
19
93
19
94
19
95
19
96
19
97
19
98
19
99
20
00
20
01
20
02
20
03
20
04
20
05
20
06
20
07
20
08
20
09
20
10
20
11
20
12
20
13
20
14
20
15
20
16
20
17
20
18
Information Classification: General
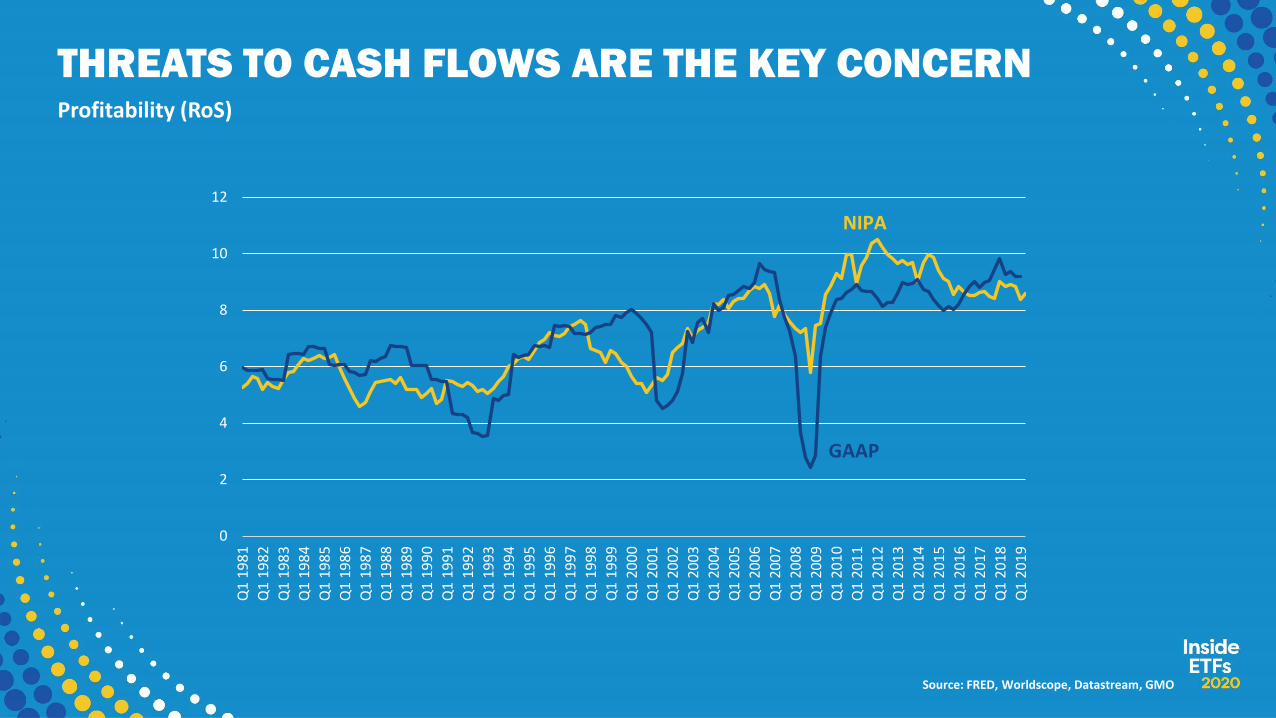
THREATS TO CASH FLOWS ARE THE KEY CONCERNProfitability (RoS)
Source: FRED, Worldscope, Datastream, GMO
0
2
4
6
8
10
12
Q1
19
81
Q1
19
82
Q1
19
83
Q1
19
84
Q1
19
85
Q1
19
86
Q1
19
87
Q1
19
88
Q1
19
89
Q1
19
90
Q1
19
91
Q1
19
92
Q1
19
93
Q1
19
94
Q1
19
95
Q1
19
96
Q1
19
97
Q1
19
98
Q1
19
99
Q1
20
00
Q1
20
01
Q1
20
02
Q1
20
03
Q1
20
04
Q1
20
05
Q1
20
06
Q1
20
07
Q1
20
08
Q1
20
09
Q1
20
10
Q1
20
11
Q1
20
12
Q1
20
13
Q1
20
14
Q1
20
15
Q1
20
16
Q1
20
17
Q1
20
18
Q1
20
19
GAAP
NIPA
Information Classification: General
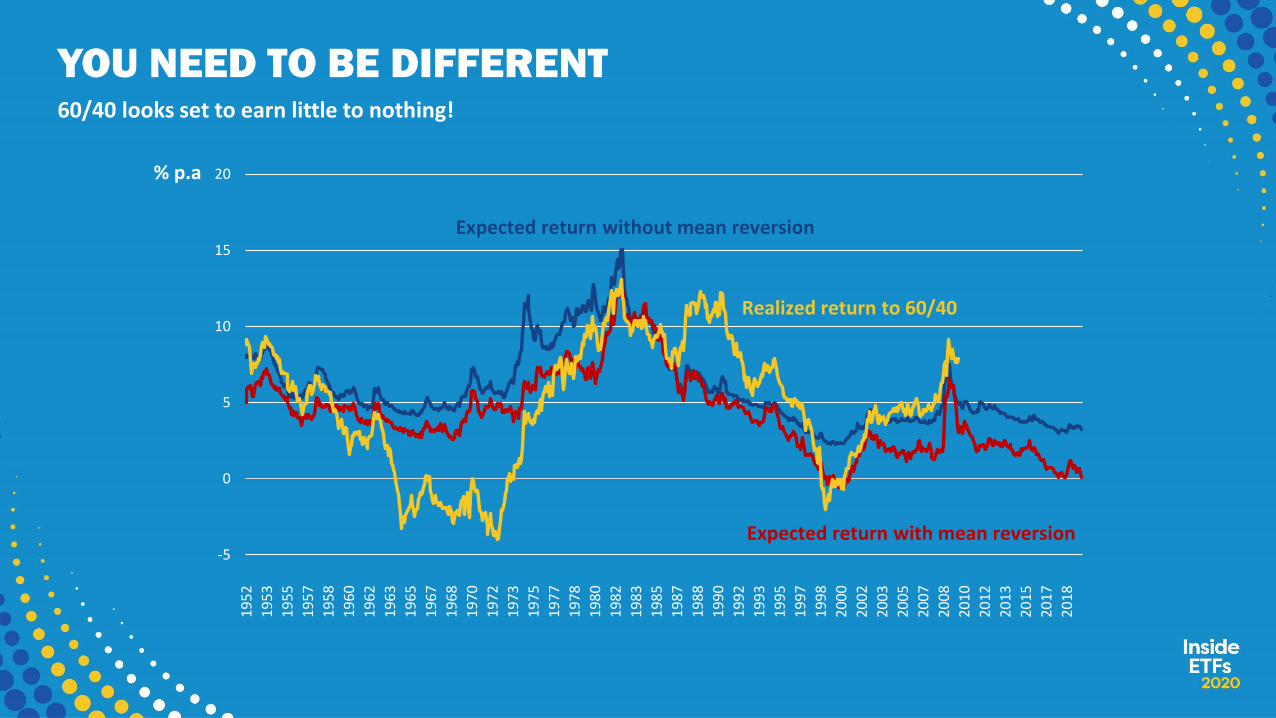
YOU NEED TO BE DIFFERENT60/40 looks set to earn little to nothing!
% p.a
-5
0
5
10
15
20
19
52
.01
19
53
.09
19
55
.05
19
57
.01
19
58
.09
19
60
.05
19
62
.01
19
63
.09
19
65
.05
19
67
.01
19
68
.09
19
70
.05
19
72
.01
19
73
.09
19
75
.05
19
77
.01
19
78
.09
19
80
.05
19
82
.01
19
83
.09
19
85
.05
19
87
.01
19
88
.09
19
90
.05
19
92
.01
19
93
.09
19
95
.05
19
97
.01
19
98
.09
20
00
.05
20
02
.01
20
03
.09
20
05
.05
20
07
.01
20
08
.09
20
10
.05
20
12
.01
20
13
.09
20
15
.05
20
17
.01
20
18
.09
Expected return with mean reversion
Realized return to 60/40
Expected return without mean reversion
Information Classification: General
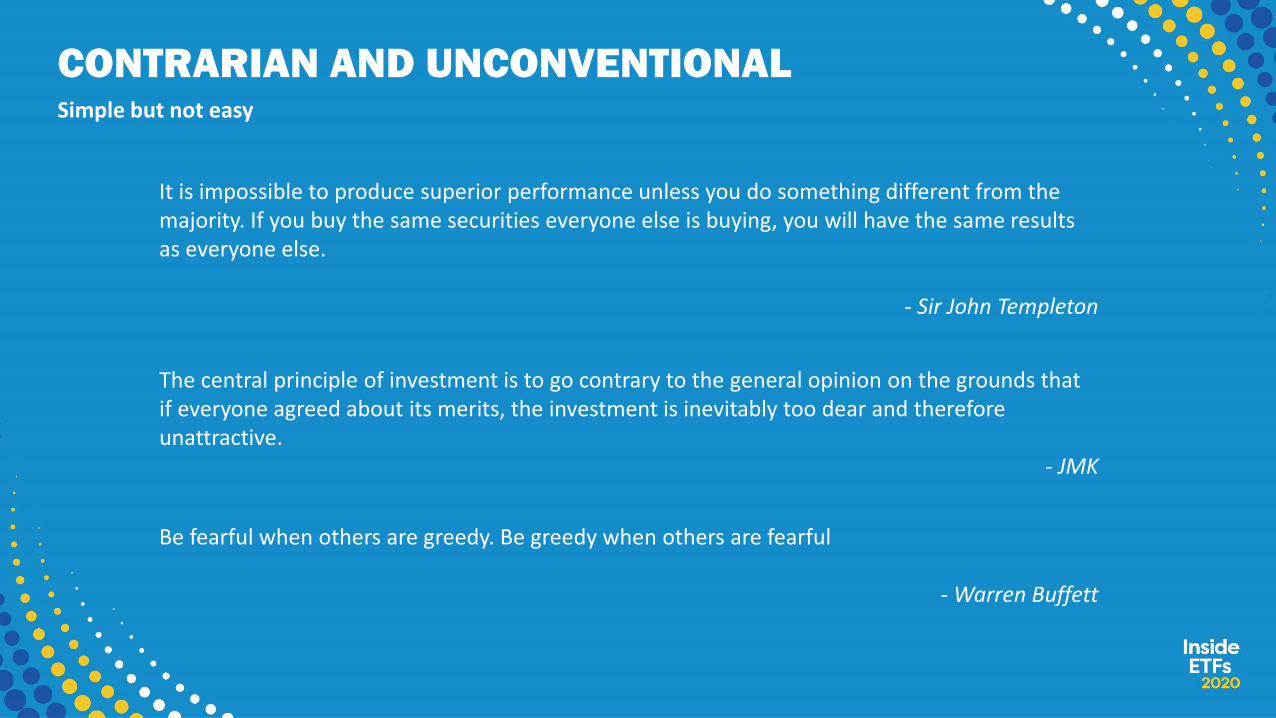
CONTRARIAN AND UNCONVENTIONALSimple but not easy
It is impossible to produce superior performance unless you do something different from the majority. If you buy the same securities everyone else is buying, you will have the same results as everyone else.
- Sir John Templeton
The central principle of investment is to go contrary to the general opinion on the grounds that if everyone agreed about its merits, the investment is inevitably too dear and therefore unattractive.
- JMK
Be fearful when others are greedy. Be greedy when others are fearful
- Warren Buffett

Information Classification: General
HURDLE 1: HUMAN NATURE

Information Classification: General
SAFER AND WARMER IN THE MIDDLE OF THE HERD

Information Classification: General
A MORE ACCURATE COMPARISON
Information Classification: General
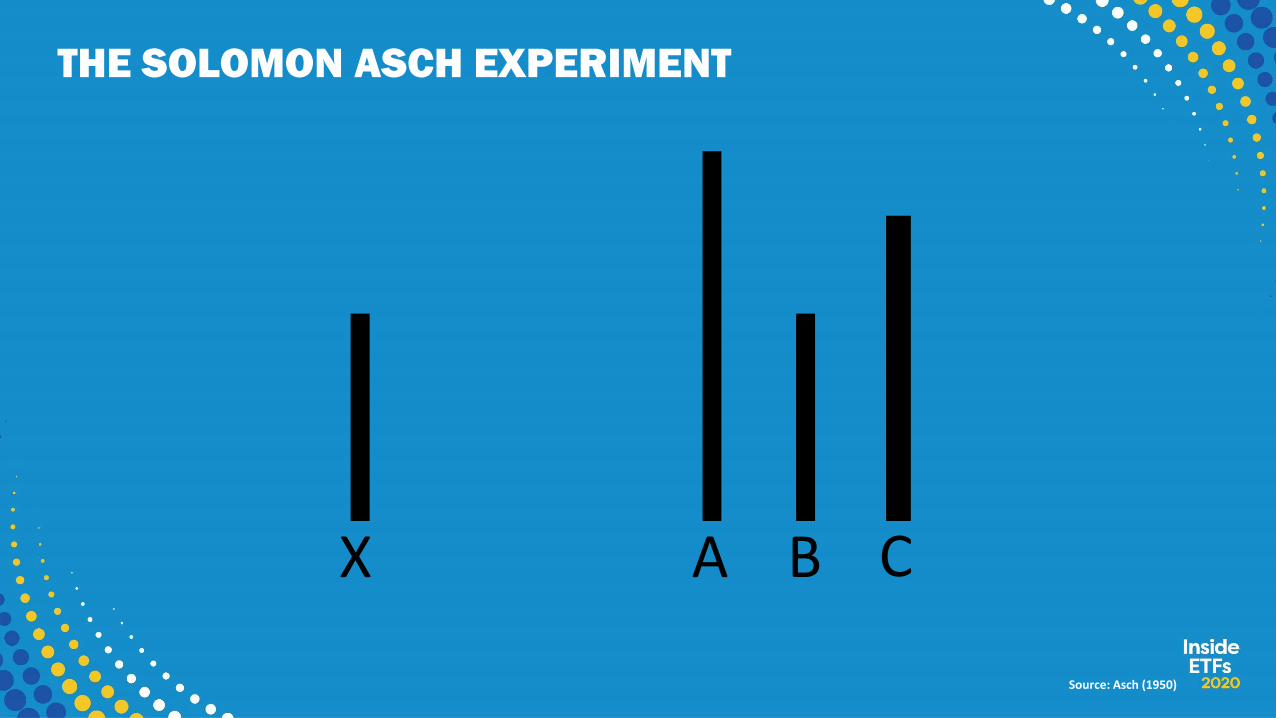
THE SOLOMON ASCH EXPERIMENT
X A B C
Source: Asch (1950)
Information Classification: General
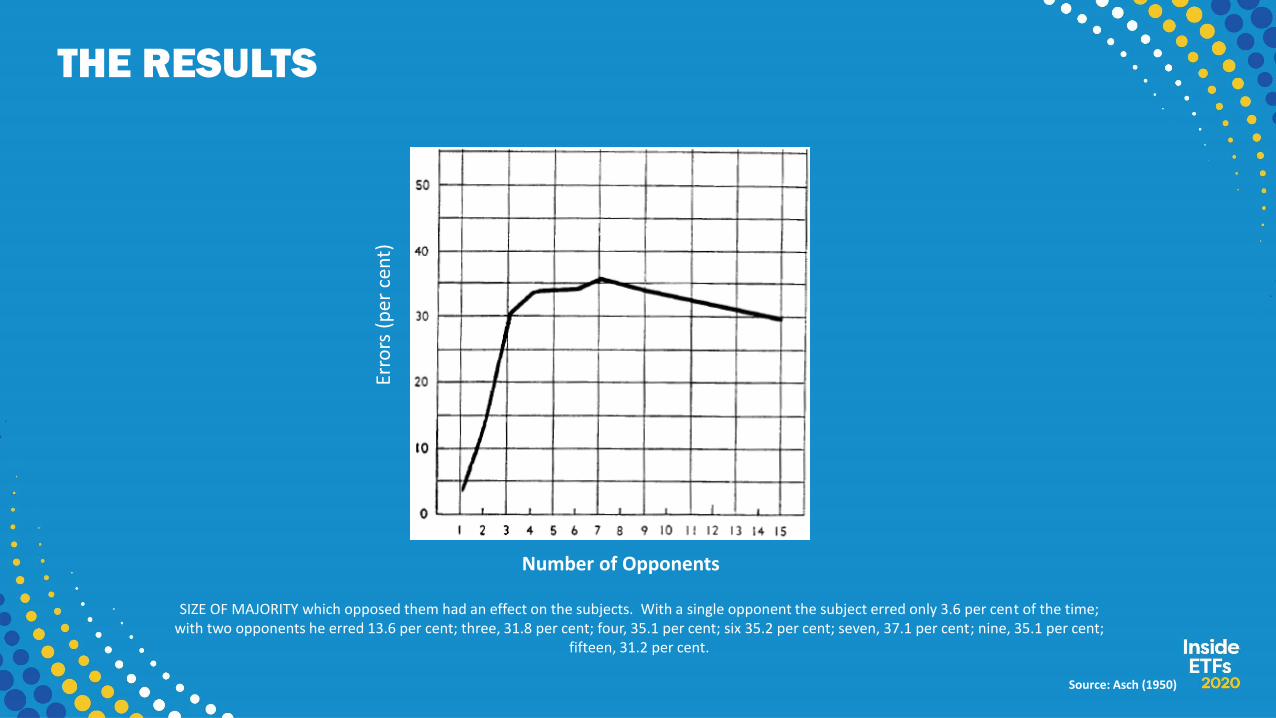
THE RESULTS
Source: Asch (1950)
Number of Opponents
Erro
rs (
per
cen
t)
SIZE OF MAJORITY which opposed them had an effect on the subjects. With a single opponent the subject erred only 3.6 per cent of the time; with two opponents he erred 13.6 per cent; three, 31.8 per cent; four, 35.1 per cent; six 35.2 per cent; seven, 37.1 per cent; nine, 35.1 per cent;
fifteen, 31.2 per cent.

Information Classification: General
SOCIAL PAIN AND PHYSICAL PAIN
Source: Eisenberger and Lieberman (2003)

Information Classification: General
HURDLE 2: INSTITUTIONAL IMPERATIVE

Information Classification: General
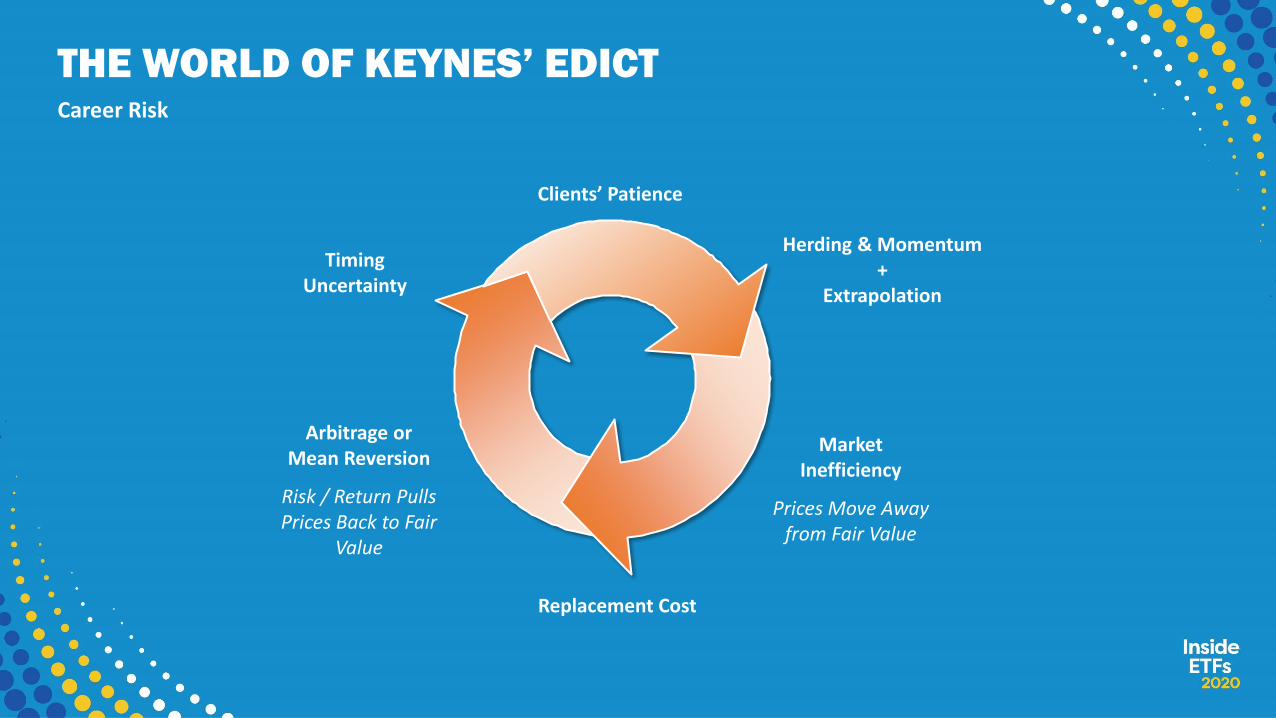
KEYNES’ EDICT
Worldly wisdom teaches that It is better for reputation to fail conventionally then to
succeed unconventionally.
Information Classification: General
THE WORLD OF KEYNES’ EDICTCareer Risk
Market Inefficiency
Prices Move Away from Fair Value
Arbitrage or Mean Reversion
Risk / Return Pulls Prices Back to Fair
Value
Timing Uncertainty
Herding & Momentum+
Extrapolation
Clients’ Patience
Replacement Cost
Information Classification: General
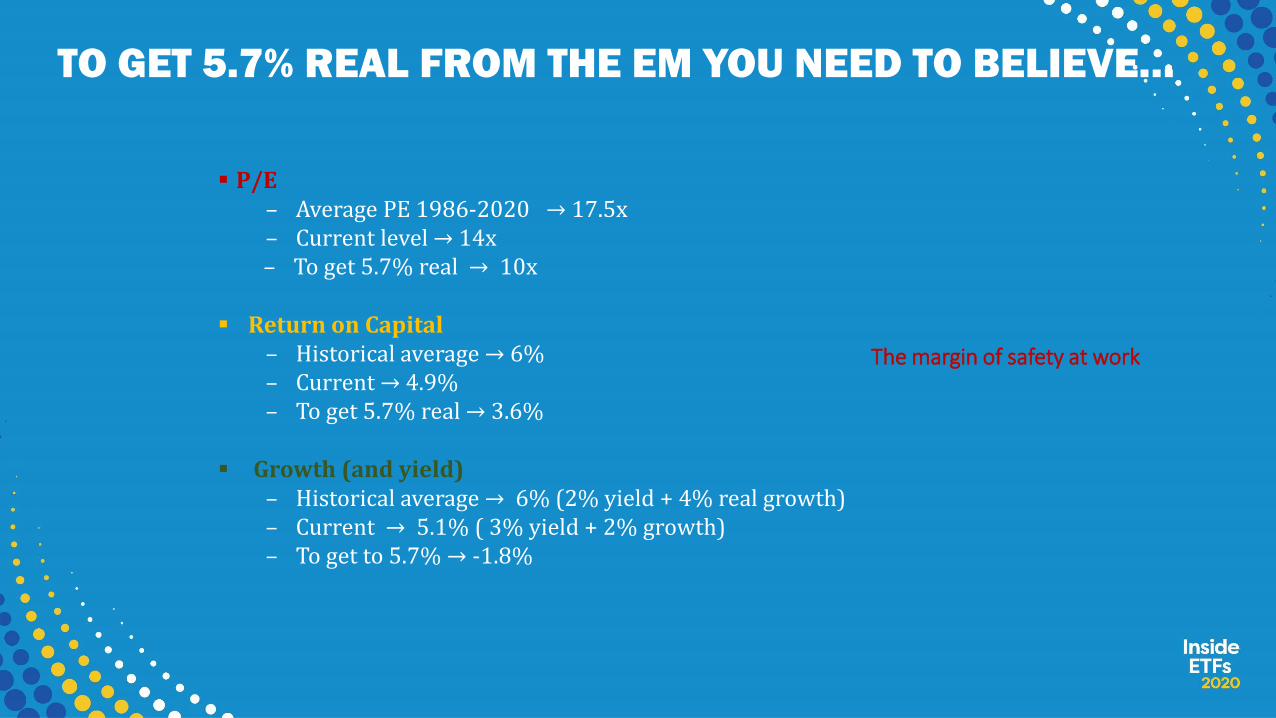
TO GET 5.7% REAL FROM THE EM YOU NEED TO BELIEVE…
▪ P/E– Average PE 1986-2020 → 17.5x – Current level → 14x– To get 5.7% real → 10x
▪ Return on Capital– Historical average → 6%– Current → 4.9%– To get 5.7% real → 3.6%
▪ Growth (and yield)– Historical average → 6% (2% yield + 4% real growth)– Current → 5.1% ( 3% yield + 2% growth) – To get to 5.7% → -1.8%
The margin of safety at work
Information Classification: General
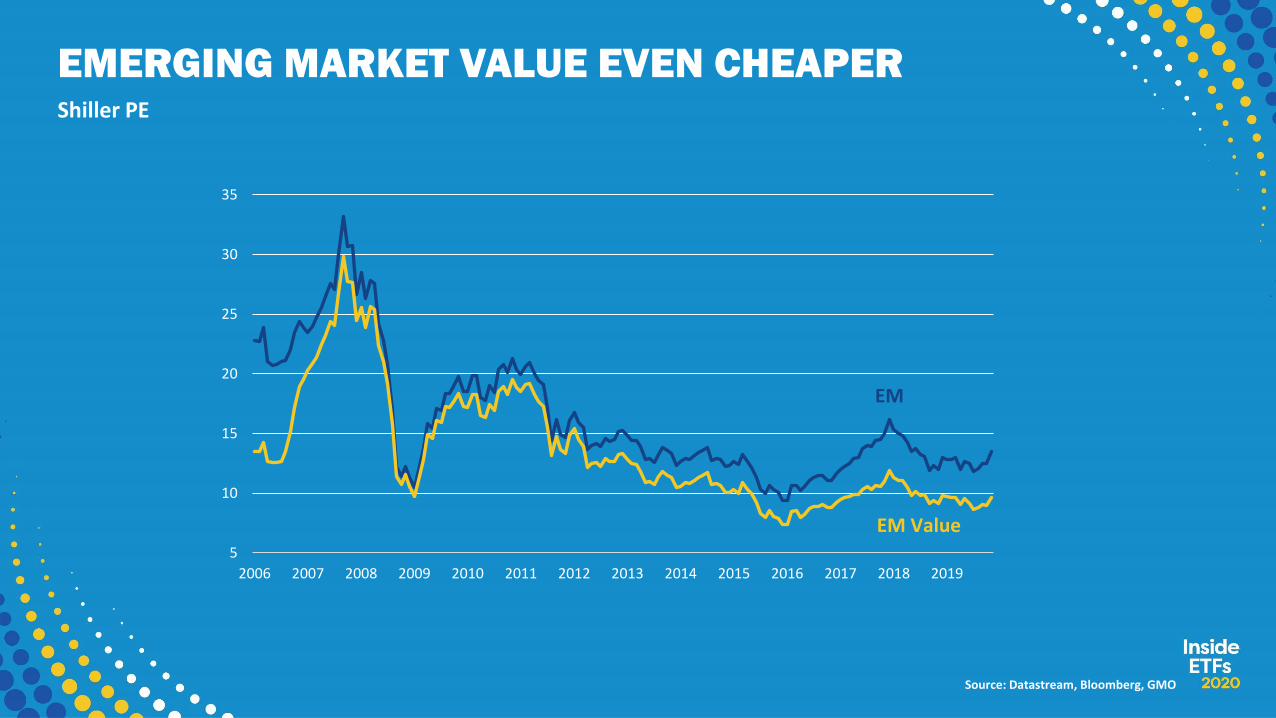
EMERGING MARKET VALUE EVEN CHEAPERShiller PE
Source: Datastream, Bloomberg, GMO
5
10
15
20
25
30
35
2006 2007 2008 2009 2010 2011 2012 2013 2014 2015 2016 2017 2018 2019
EM
EM Value
Information Classification: General
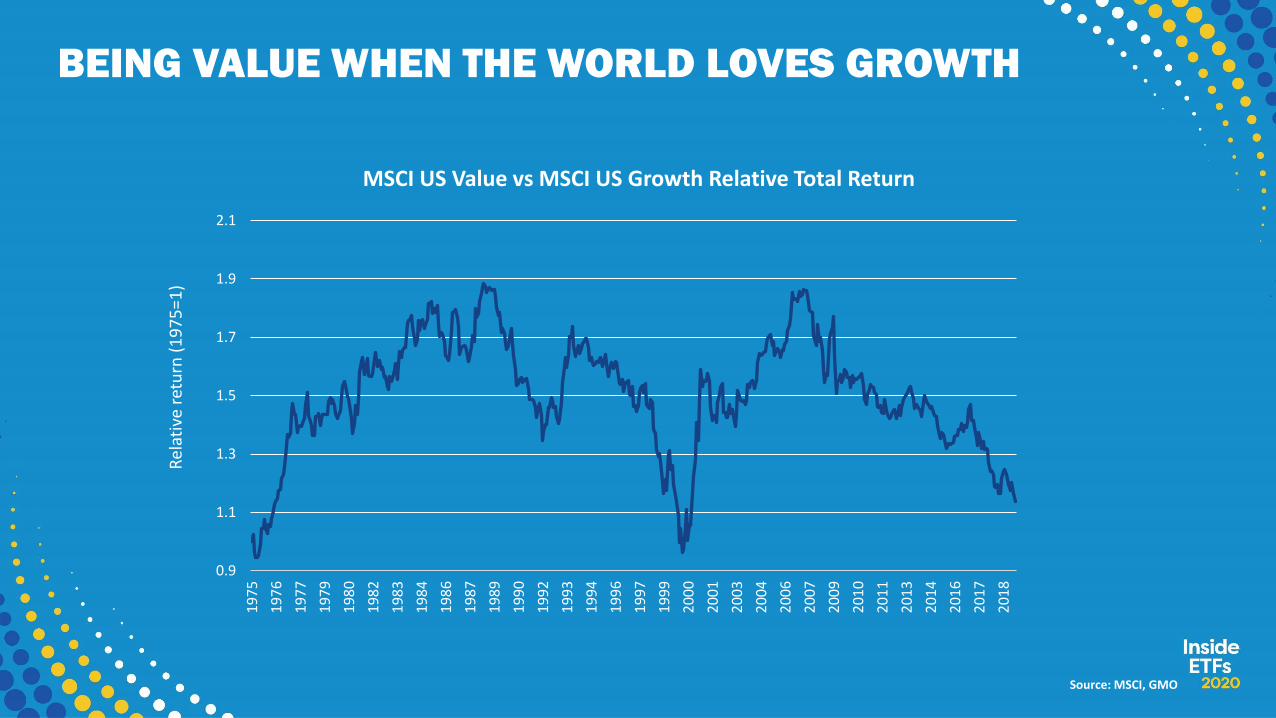
BEING VALUE WHEN THE WORLD LOVES GROWTH
Source: MSCI, GMO
0.9
1.1
1.3
1.5
1.7
1.9
2.1
19
75
19
76
19
77
19
79
19
80
19
82
19
83
19
84
19
86
19
87
19
89
19
90
19
92
19
93
19
94
19
96
19
97
19
99
20
00
20
01
20
03
20
04
20
06
20
07
20
09
20
10
20
11
20
13
20
14
20
16
20
17
20
18
Rel
ativ
e re
turn
(1
97
5=1
)MSCI US Value vs MSCI US Growth Relative Total Return
Information Classification: General
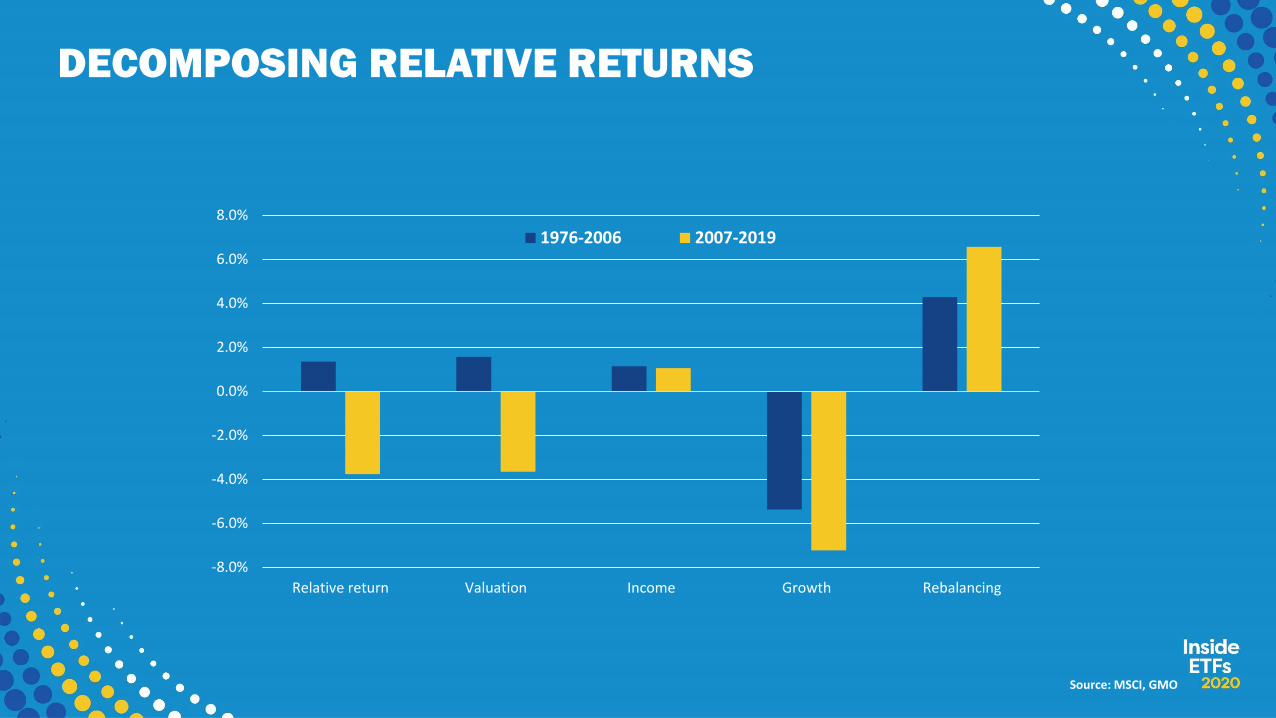
DECOMPOSING RELATIVE RETURNS
Source: MSCI, GMO
-8.0%
-6.0%
-4.0%
-2.0%
0.0%
2.0%
4.0%
6.0%
8.0%
Relative return Valuation Income Growth Rebalancing
1976-2006 2007-2019
Information Classification: General
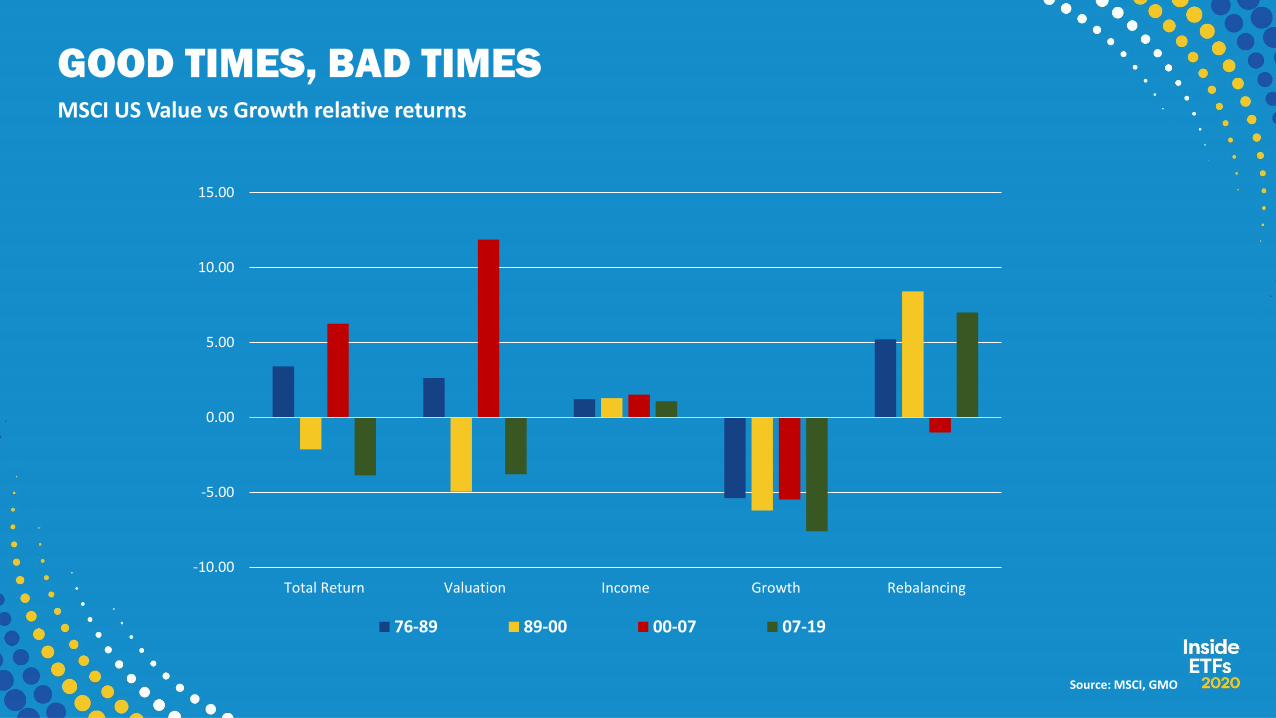
GOOD TIMES, BAD TIMES
Source: MSCI, GMO
MSCI US Value vs Growth relative returns
-10.00
-5.00
0.00
5.00
10.00
15.00
Total Return Valuation Income Growth Rebalancing
76-89 89-00 00-07 07-19
Information Classification: General
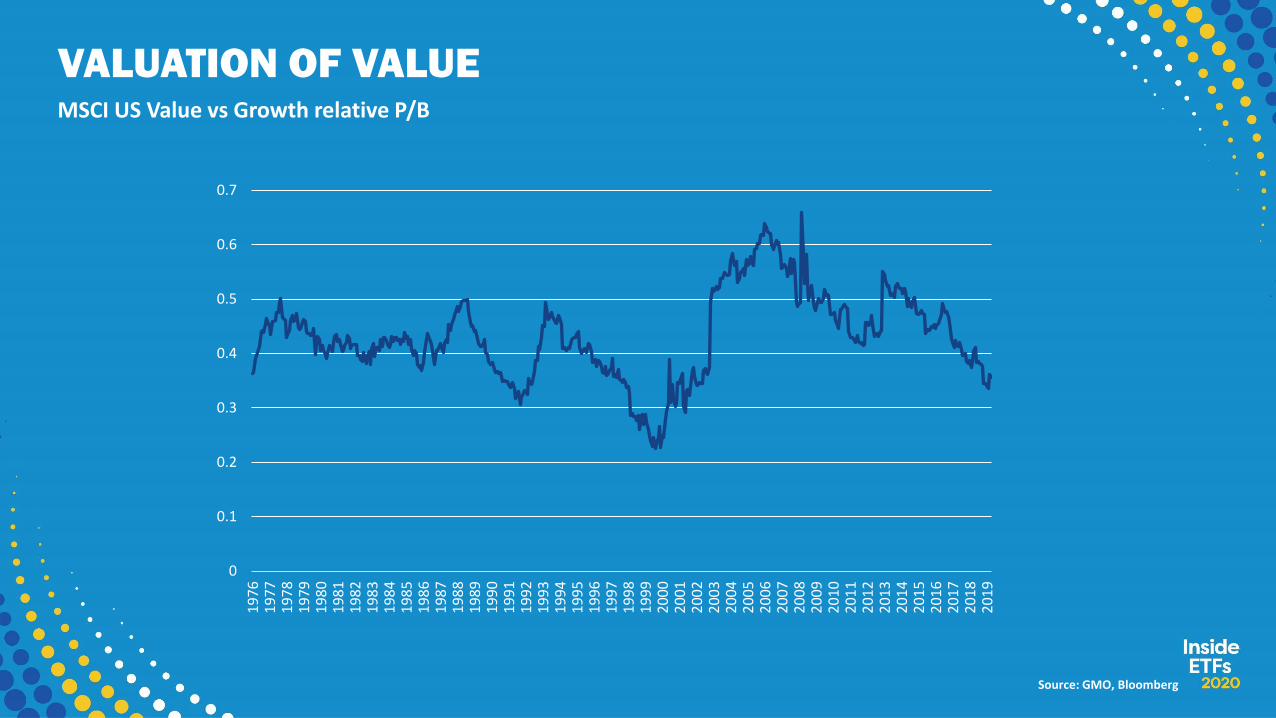
VALUATION OF VALUE
Source: GMO, Bloomberg
MSCI US Value vs Growth relative P/B
0
0.1
0.2
0.3
0.4
0.5
0.6
0.7
19
76
19
77
19
78
19
79
19
80
19
81
19
82
19
83
19
84
19
85
19
86
19
87
19
88
19
89
19
90
19
91
19
92
19
93
19
94
19
95
19
96
19
97
19
98
19
99
20
00
20
01
20
02
20
03
20
04
20
05
20
06
20
07
20
08
20
09
20
10
20
11
20
12
20
13
20
14
20
15
20
16
20
17
20
18
20
19
Information Classification: General
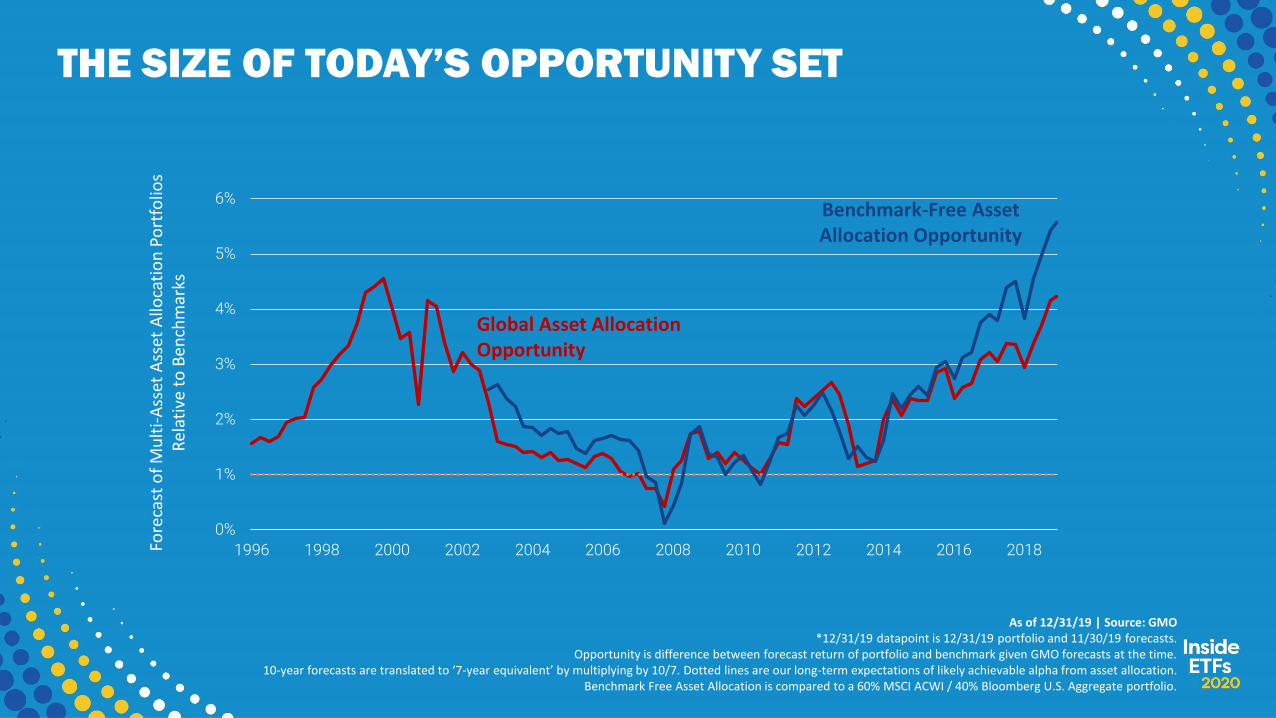
THE SIZE OF TODAY’S OPPORTUNITY SET
As of 12/31/19 | Source: GMO*12/31/19 datapoint is 12/31/19 portfolio and 11/30/19 forecasts.
Opportunity is difference between forecast return of portfolio and benchmark given GMO forecasts at the time.10-year forecasts are translated to ‘7-year equivalent’ by multiplying by 10/7. Dotted lines are our long-term expectations of likely achievable alpha from asset allocation.
Benchmark Free Asset Allocation is compared to a 60% MSCI ACWI / 40% Bloomberg U.S. Aggregate portfolio.
0%
1%
2%
3%
4%
5%
6%
1996 1998 2000 2002 2004 2006 2008 2010 2012 2014 2016 2018
Benchmark-Free Asset Allocation Opportunity
Global Asset Allocation Opportunity
Fore
cast
of
Mu
lti-
Ass
et A
sset
Allo
cati
on
Po
rtfo
lios
Rel
ativ
e to
Ben
chm
arks
Information Classification: General
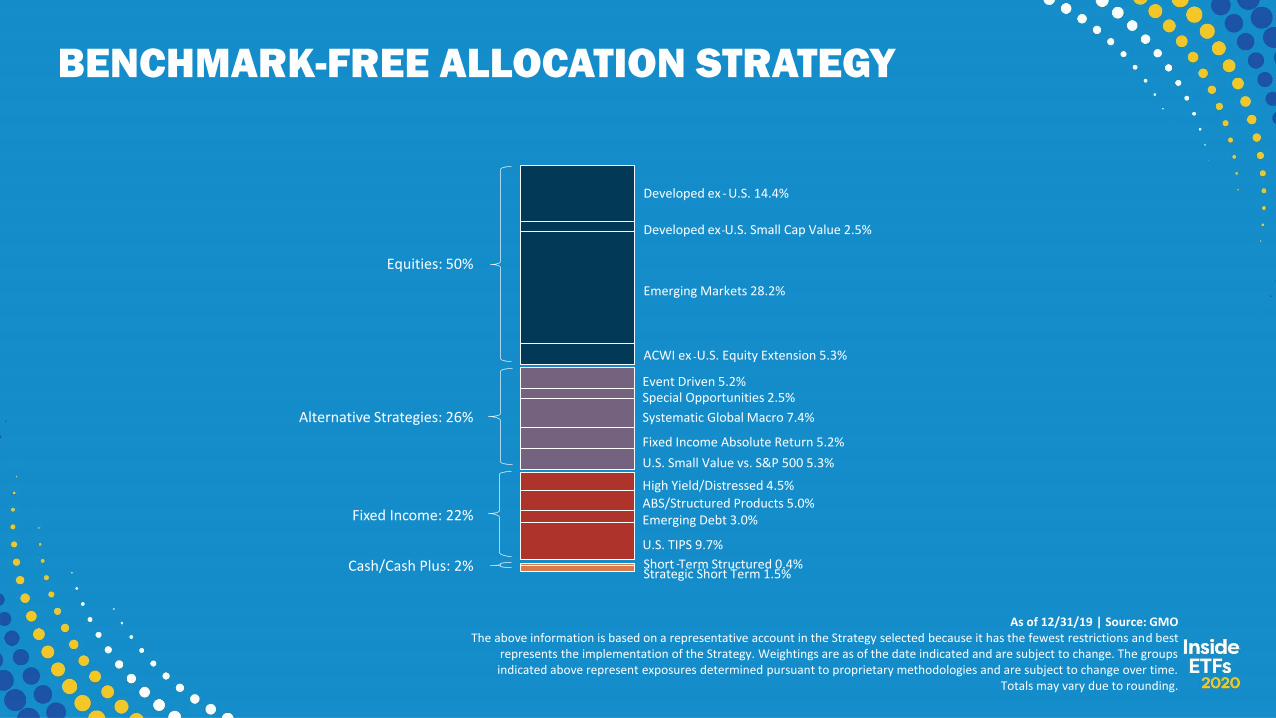
BENCHMARK-FREE ALLOCATION STRATEGY
As of 12/31/19 | Source: GMO The above information is based on a representative account in the Strategy selected because it has the fewest restrictions and best
represents the implementation of the Strategy. Weightings are as of the date indicated and are subject to change. The groups indicated above represent exposures determined pursuant to proprietary methodologies and are subject to change over time.
Totals may vary due to rounding.
Equities: 50%
Cash/Cash Plus: 2%
Fixed Income: 22%
Alternative Strategies: 26%
Developed ex
Systematic Global Macro 7.4%
Developed ex - U.S. 14.4%
Event Driven 5.2%
Emerging Markets 28.2%
Emerging Debt 3.0%ABS/Structured Products 5.0%
Fixed Income Absolute Return 5.2%
Special Opportunities 2.5%
High Yield/Distressed 4.5%
U.S. TIPS 9.7%
Short -Term Structured 0.4%Strategic Short Term 1.5%
ACWI ex -U.S. Equity Extension 5.3%
U.S. Small Value vs. S&P 500 5.3%
-U.S. Small Cap Value 2.5%