Embed Size (px)
Citation preview
I:
MOTION DETECTION AND SIMULATION STUDY ON HUMAN WALKING BEHAVIOR
Cheong Wai Loon
Master of Engineering 2012

PUS31 Khidmat,MakJulBat Akaat:J11lk UNJVERSm MALAYSIA SARAWAf(
MOTION DETECTION AND SIMULATION STUDY ON HUMAN WALKING
BEHAVIOUR
CHEONG W AI LOON
A thesis submitted
in fulfillment ofrequirements for the degree of Master of Engineering
Faculty of Engineering
UNIVERSITI MALAYSIA SARA W AK
2012

,...
To my belovett family, fiancee and friends
•
ACKNOWLEDGEMENT
I would like to take this opportunity to express my thanks and appreciations to people
who support and encourage me in accomplish this project. This research was supported by
Universiti Malaysia Sarawak (UN'IMAS) under Fundamental Research Grant Scheme (FRGS)
through providing good facilities in conducting the research.
First of all, I would like to thank my project supervisor Dr. Syed Tarmizi Syed Shazali
and co-supervisor Mr. Shahrol Mohamaddan for their patient, supervision, guidance and
continuous support throughout the project. My wife, Lee Ruoh Cheng and my beloved
parents, without your support, encouragement and care my whole project would be
incomplete. Besides that I would like to thank my friends who have also supported me and
also helped me throughout the project. Thank you to all the parties involved.
ABSTRACT
~uman walking behaviour modelling is an important topic in different area of studies.
Architects, interior designer and transport engineers want to design and integrated a good
building and facilities with particular emphasis on safety issues for pedestrians especially
during evacuation scenario when emergency. The objective of this project is to analyse the
human walking behaviour from video data, and develop an algorithm for human walking
behaviour and emergency evacuation simulatioy The motion detection system were
developed using Video and Image Processing Blockset in MAT LAB to collect the centroid
coordinate of the pedestrians from the video to analyse the human walking behaviour. The
walking speed and acceleration of the pedestrian are calculated and implemented into the
simulation. The buildings in the simulation are designed in 3D World Studio. The simulation
is developed using DarkBasic Professional with the additional extension of Dark AI. There
are two categories of human in the simulation which are adult and elderly with different
walking speed. Two types of environments are developed in the simulation to study the
human walking behaviour which are empty space and building simulation. The analysis ofthe
simulation is the time travel for each entity to reach destination and total evacuation time in
building simulation. The bottleneck in the building design can be identified from the
observation ofthe building simulation.
11
ABSTRAK
Pemodelan kelakuan berjalan manusia adalah topik yang penting dalam kajian yang
berbeza. Arkitek, pereka dalaman dan jurutera pengangkutan perlu untuk mereka bentuk dan
integrasi bangunan dan kemudahan yang baik dengan memberi penekanan kepada isu-isu
keselamatan untuk pejalan kaki terutamanya semasa senario kecemasan. Objektif projek ini
adalah mengumpul dan menganalisis tingkah laku manusia berjalan kaki dari data video, dan
pembangunan algoritma bagi simulasi tingkah laku manusia yang berjalan dan pemindahan
kecemasan. Sistem pengesanan gerakan telah dibangunkan dengan menggunakan Video and
Image Processing Blockset dalam MATLAB untuk mengambil koordinat sentroid daripada
pejalan kaki dalam video untuk menganalisis tingkah laku manusia yang berjalan. Kelajuan
dan pecutan pejalan kaki telah diki.ra dan dilaksanakan ke dalam simulasi. Reka bentuk
bangunan dalam simulasi direka di 3D World Studio. Simulasi telah dibangunkan
menggunakan DarkBasic Profesional dengan sambungan tambahan Dark AI. Terdapat dua
kategori manusia dalam simulasi iaitu orang dewasa dan warga tua dengan kelajuan berjalan
yang berbeza. Dua jenis persekitaran telah dibangunkan dalam simulasi untuk mengkaji
tingkah laku berjalan manusia iaitu simulasi ruang kosong dan bangunan. Analisis dalam
simulasi adalah masa perjalanan untuk setiap entiti untuk sampai ke destinasi dan jumlah
masa pemindahan dalam simu1asi bangunan. Kesesakan dalam reka bentuk bangunan boleh
dikenal pasti dari pemerhatian simulasi bangunan.
III

Pusat Klaidmal Maklumat Akademi UNlVERSm MALAYSIA SAKAWA](
TABLE OF CONTENTS
ACKNOWLEDGEMENT
ABSTRACT
ABSTRAK
TABLE OF CONTENTS
LIST OF FIGURES
LIST OF TABLES
LIST OF ABBREVIATIONS
Chapter 1 INTRODUCTION
1.1 Background of Study
1.2 Problem Statement
1.3 Objective
Chapter 2 LITERATURE REVIEW
2.1 Introduction
2.2 Image Processing
2.3 Motion Detection
2.4 Anthropometric
2.5 Field ofVision
2.6 Personal Space
2.7 Pedestrian Characteristics
2.7.1 Macroscopic Characteristics
2.7.2 Microscopic Characteristics
IV
Page
11
III
IV
V11
Xli
XIV
3
3
4
5
6
9
11
12
14 I 14
17
2.7 .3 Pedestrian Characteristics Research 19
2 .8 Simulation on Human Walking Behaviour 22
2.9 Summary 24
Chapter 3 METHODOLOGY
3.1 Introduction 25
3.2 Video Data Recording 26
3.2.1 Location Selection 27
3.2.2 Observation Duration 30
3.3 Data Collection (Image Processing) 31
3.4 Data Analysis 32
3.5 Simulation and Modelling Development 33
3.5.1 Empty Space Design 34
3.5.2 Building Design 34
3.6 Summary 35
Chapter 4 DATA COLLECTION AND ANALYSIS
4.l Introduction 36
4.2 Motion 39
4.3 Background Estimation 40
4.4 Segmentation 41
4.5 Detection 44
4.6 Data Analysis 46
4.6.1 Analysis of Location A 47
4.6.2 Analysis of Location B 51
4.7 Results of Real Life Data Collection 53
v
584.8 Discussion
594.9 Summary
Chapter 5 SIMULATIONS AND MODELLING DEVELOPMENT
605.1 Introduction
605.2 Simulation Rules
5.3 Building Designs 63
5.4 Simulation Design 65
5.4.1 Simulation on Empty Space 69
5.4.2 Simulation on Building 74
5.4.3 Help Display in Simulation 78
5.5 Ability ofArtificial Intelligence 82
5.6 Simulation Data Analysis 83
5.7 Summary 85
Chapter 6 RESULTS AND DISCUSSION
6.1 Introduction 86
6.2 Results ofEmpty Space Simulation 87
6.3 Results ofBuilding Simulation 92
6.4 Summary 102
Chapter 7 CONCLUSION AND RECOMMENDATIONS
1037.1 Introduction
1037.2 Conclusion
106
108
7.3 Recommendations
REFERENCES
115APPENDIX A
VI

LIST OF FIGURES
-
Figure Title Page
Figure 2.1 Image processing steps. 5
males (Goldsmith, 1976).
females (Goldsmith, 1976).
bubbles (Hall, 1966).
Estimation Subtraction Method.
Figure 4.2 Simulink Model to Track People.
Figure 2.2 Mean average (50th percentile) dimensions of adult 10
Figure 2.3 Mean average (50th percentile) dimensions of adult 11
Figure 2.4 Diagram of Edward T. Hall's personal reaction 13
Figure 3.1 Flow chart for project methodology. 26
Figure 3.2 Location A. 28
Figure 3.3 Set up location for Location A. 29
Figure 3.4 Location B. 29
Figure 3.5 Set up location for Location B. 30
Figure 3.6 Pedestrian selected space at Location A. 32
Figure 3.7 Pedestrian selected space at Location B. 33
Figure 4.1 Motion Detection Using Periodic Background 37
38
Figure 4.3 Generated Pulse used as Periodic Timer. 39
Figure 4.4 Background Estimation using median. 40
VII
41
42
Figure 4.5 Simulink Model with Background Estimation and
Pulse Generator.
Figure 4.6 (a) Input video image. (b) Background subtraction.
(c) Autothreshold. (d) Dilation and Erosion.
Figure 4.7 Simulink Model in Segmentation.
Figure 4.8 (a) Blobs drawn in the binary image (b) Blobs 44
drawn in the output image with blob counter.
Figure 4.9 Simulink Model in Detection.
Figure 4.10 Simulink Model in Display Result.
Figure 4.11 Analysis ofLocation A.
Figure 4.12 Find coordinate of pedestrian.
Figure 4.13 Analysis of Location B.
Figure 4.14 Trigonometric to calculate lp.
55
Figure 4.16 Graph plotted from Table 4.4.
Figure 4.15 Graph plotted from Table 4.1 .
43
45
46
47
48
51
52
58
Figure 4.17 (a) Background image at 8:47:53AM (b) Tracked 59
image with moving lorry (c) Background image
with static lorry as background at 8:48:20AM (d)
Tracked image with static lorry.
Figure 5.1 Simple Walking Simulation Test. 61
Figure 5.2 Time versus Dark AI speed. 62
Figure 5.3 Building Design I . 64
Figure 5.4 Building Design 2. 64
Figure 5.5 Building Design 3. 65
Vlll

-Figure 5.6 Flow Chart of Simulation. 66
Figure 5.7 Main menu of simulation. 66
Figure 5.8 3D adult human entities. 67
Figure 5.9 3D elderly human entities. 68
Figure 5.10 3D obstacles in the simulation. 68
Figure 5.11 Menu for Empty Space Simulation. 69
Figure 5.12 Simulation ofone-way empty space. 70
Figure 5.13 Flow Chart ofOne-way Empty Space Simulation. 71
Figure 5.14 Flow Chart ofTwo-ways Empty Space Simulation. 73
Figure 5.15 Simulation of two-way empty space. 74
Figure 5.16 Flow Chart of Building Simulation. 75
Figure 5.17 Menu for building simulation. 76
Figure 5.18 Building simulation. 77
Figure 5.19 Destination point in building simulation. 78
Figure 5.20 Help display in simulation. 79
Figure 5.21 Entity path to the destination in red line. 79
Figure 5.22 Obstacles boundary in blinking colour of green and 80
white.
Figure 5.23 View Arcs of entities. 81
Figure 5.24 Avoidance Angles ofentities in green. 81
Figure 5.25 Side view in simulation. 82
Figure 5.26 The shortest path blocked by boxes, AI entities 83
finds another path to the destination point.
IX
87 Figure 6.1 Average Speed versus Total Adult Entities walking
in one-way empty space.
Figure 6.2 Average Speed versus Total Adult Entities walking 88
in two-way empty space.
Figure 6.3 Comparison of adult walking in one-way and two 88
way graph.
Figure 6.4 Average Speed versus Percentage of Elderly in total 90
99 Entities walking in one-way empty space.
Figure 6.5 Average Speed versus Percentage of Elderly in 99 90
Entities walking in two-ways empty space.
Figure 6.6 Comparison of percentage of elderly walking m 91
one-way and two-way graph.
Figure 6.7 Time versus Number of Adult Entities evacuate 92
from Building Design 1.
Figure 6.8 Bottleneck area in Building Design 1. 93
Figure 6.9 Time versus Percentage Elderly m 99 Entities 94
evacuate from Building Design 1.
Figure 6.10 Time versus Number of Adult Entities evacuate 95
from Building Design 2.
Figure 6.11 Bottleneck exit in Building Design 2. 96
Figure 6.12 Time versus Percentage Elderly ill 99 Entities 97
evacuate from Building Design 2.
Figure 6.13 Time versus Number of Adult Entities evacuate 98
from Building Design 3.
x

Figure 6.14 Bottleneck exit in Building Design 3. 99
Figure 6.15 Time versus Percentage Elderly ill 99 Entities 100
evacuate from Building Design 3.
Figure 6.16 Comparison of total evacuation time in different 101
building design.
Figure 6.17 Comparison of total evacuation time versus 101
percentage of elderly in different building design
simulation.
Xl
,.....
LIST OF TABLES
Table Title
Table 2.1
Table 2.2
Table 3.1
Table 4.1
Table 4.2
Table 4.3
Table 4.4
Table 5.1
Table A-I
Table A-2
Table A-3
Table A-4
Table A-5
Table A-6
Types of Spaces (Hall, 1966).
Comparison pedestrian characteristics of several
previous studies (Teknomo, 2002).
The schedule for videos recording.
The classification of pedestrians speed data.
Median, Average, Standard Deviation and Variance
of pedestrians speed in Location A and Location B.
Median, Average, Standard Deviation and Variance
of pedestrians' deceleration.
Classification of pedestrians' deceleration data.
Time to travel 800 pixels with Dark AI speed.
Pedestrians' speed at Location A.
Pedestrians' speed at Location B.
Pedestrians' deceleration from analysis of the
observation in video.
Results of adults walking one-way in empty space.
Results of adults walking two-ways in empty space.
Results of percentage elderly in total 99 entities
walking in one-way of empty space.
xu
Page
14
21
31
54
56
57
57
62
116
118
119
120
121
122

123 Table A-7 Results of percentage elderly in total 99 entities
walking in two-way of empty space.
Table A-8 Results ofadults walking in Building Design 1. 124
walking in Building Design 1.
walking in Building Design 2.
walking in Building Design 3.
Table A-9 Results of percentage elderly in total 99 entities 125
Table A-I 0 Results of adults walking in Building Design 2. 126
Table A-II Results of percentage elderly in total 99 entities 127
Table A-12 Results of adults walking in Building Design 3. 128
Table A-13 Results of percentage eldedy in total 99 entities 129
Xlll

Abbreviations
a, b, Ip
AI
e TFI
E
E
et(t )
FCSIT
FE
FPS
f(x. y)
f(x. y. tJ
k
Ie;
L
1.0
Lc
Ld
La
Lp
LIST OF ABBREVIATIONS
Meaning
Pixel at coordinate i
Length [m]
Artificial intelligence
Central of Teaching Facilities I
Ratio ofenlargement for each pixel
Efficiency measure [m/ s]
Direction into which pedestrian i is driven at time t [s]
Faculty of Computer Science and Information Technology
Faculty of Engineering
Frame per second
Function of two variables
Function of two variables at time ti [s]
Pedestrian traffic density [ped/m2]
Traffic jam density [ped/ m2 ]
Length [m]
Length from start of the frame until the pedestrian trap [m]
Original length in centimeter [cm]
Length at d [pixel]
Real distance [m]
Total length [pixel]
XIV

-
!
LII
Lx
10
M
N
q
qi
R
r
RL
Tp
SAD
T
t
t/"
ttut
[J
u
~f
UNIMAS
V
VA
Vi
Length at u [pixel]
Enlargement of length of pedestrian walking at the coordinate
[m]
Travel distance of pedestrian in one second in centimeter [cm]
Area module [m2Iped]
Number of pedestrians observed [ped]
Flow rate [pedl minI m]
Deceleration of ilh pedestrian [rnIs2]
Ratio
Ratio of enlargement in length from up to down
Ratio oforiginal length
Ratio of enlargement at pixel yp
Sum ofabsolute difference
Observation time [s]
A verage travel time [s]
Time of pedestrian i'h to go in [s]
Time of pedestrian i'h to go out [s]
Uncomfortableness measure [ped- I]
Space mean speed [rnIs]
Free flow speed [rnImin]
Universiti Malaysia Sarawak
Time mean speed [ml s]
Average speed ofeach pedestrian [rnIs]
Instantaneous speed of the ith pedestrian [m/s]
xv

w
Xc
X;, 9!,~, Yt
y
Yp
Intended velocity of pedestrian i [m/s]
Velocity of pedestrian i at time t [m/s]
Width [m]
Width from down until coordinate of pedestrian [m]
Coordinate x
Coordinate x of the pedestrian in centimeter [cm]
Time average from t/ to t2 [s]
Coordinate x of the pedestrian in pixel
Coordinate y
Average coordinate y of a pedestrian
XVI
CHAPTER!
INTRODUCTION
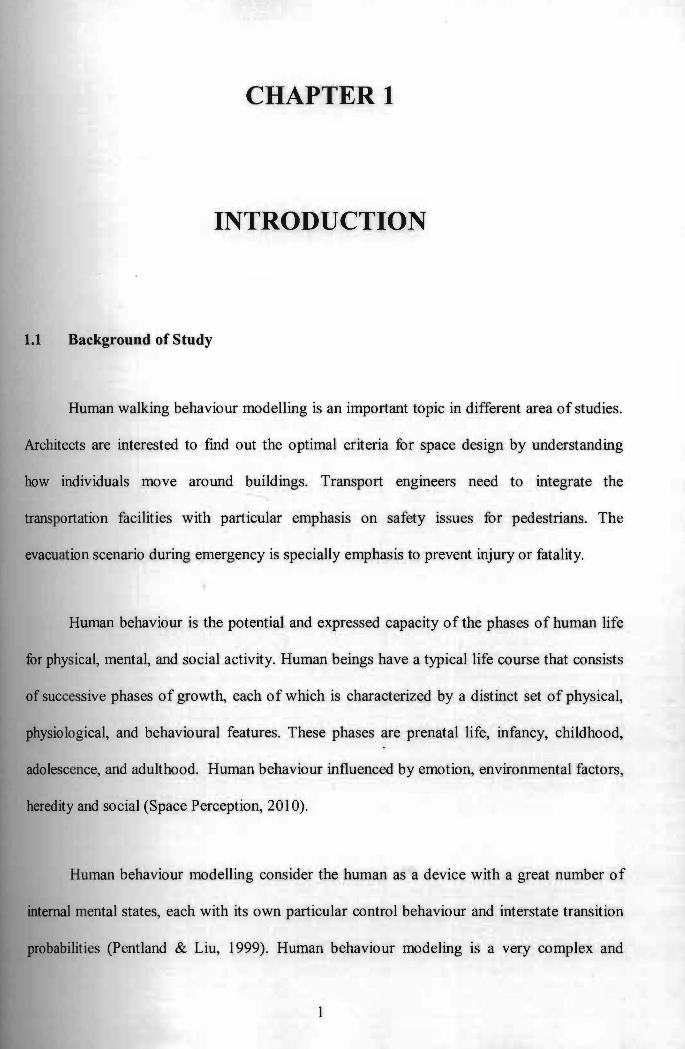
1.1 Background of Study
Human walking behaviour modelling is an important topic in different area of studies.
Architects are interested to fmd out the optimal criteria for space design by understanding
how individuals move around buildings. Transport engineers need to integrate the
transportation facilities with particular emphasis on safety issues for pedestrians. The
evacuation scenario during emergency is specially emphasis to prevent injury or fatality.
Human behaviour is the potential and expressed capacity of the phases of human life
for physical, mental, and social activity. Human beings have a typical life course that consists
of successive phases of growth, each of which is characterized by a distinct set of physical,
physio logical, and behavioural features. These phases are prenatal life, infancy, childhood,
adolescence, and adulthood. Human behaviour influenced by emotion, environmental factors,
heredity and social (Space Perception, 20 10).
Human behaviour modelling consider the human as a device with a great number of
internal mental states, each with its own particular control behaviour and interstate transition
probabilities (Pentland & Liu, 1999). Human behaviour modeling is a very complex and
varies with different people. In the project, some of the factor are considered and used to
simplify the research. By using human behaviour modelling or human behaviour simulations,
the movement of the human can be predicted with different situation or environment. The
designer can design the layout of the building by knowing the walking flow of the human and
make sure human able to go to the destination in the shortest time.
The traffic flow characteristics could be divided into two categories which are
microscopic level and macroscopic level. Microscopic level invo lves individual pedestrian
characteristics such as individual speed and individual interaction. Macroscopic level
involved all pedestrian movements in pedestrian facilities aggregated into flow, average speed
and area module. Macroscopic pedestrian studies concern on space allocation for pedestrians
in the pedestrian facilities. While microscopic pedestrian studies on every pedestrian as an
indjvidual and the behaviour of pedestrian interaction is measured (Teknomo, 2002).
Simulation was using computer software to represent the dynamic responses of one
system by the behaviour ofanother system modeled after it. A simulation uses a mathematical
description, or model, of a rea) system in the form of a computer program composed of
equations that duplicate the functional relationships within the real system. The resulting
mathematical dynamics form an analog of the behaviou~ of the real system, with the results
presented in the form ofdata when the program is running (Computer Simulation, 20 10).
The objective of the studies is to evaluate the human walking behaviour and the
effects of a proposed facilities and building design before its implementation. The
implementation of a design without pedestrian studies might lead to a very costly trial and
error and waste of time. Trial and error could be done in the simulation analysis level to
2

check the bottleneck or the problem ofthe building affecting the human walking flow. If the
analysis could prove a good performance, the design of the facilities and building can be
implemented which can save cost and time of building design before the building is
constructed.
1.2 Problem Statement
Presented models of automated data collection using image processing for pedestrian
movement is particularly hard to collect (Antonini & Bierlaire, 2006). Automated data
collection system is required to collect the pedestrian walking data. The awareness of
environmental problems has increased and the need for physical fitness encouraged the
demand to analysis, simulating and enhances the design of pedestrian facilities and building to
improve the safety and performance of the building (Teknomo, 2002).
1.3 Objective
The objectives ofthis project are:
l. To analyse the human walking behaviour from video data.
2. To develop an algorithm source code for human walking behaviour detection using
MAT LAB software.
3. To develop an algorithm source code for human walking behaviour and emergency
evacuation simulation using DarkBasic Professional software.
3

CHAPTER 2
LITERA TURE REVIEW
2.1 Introduction
Human walking behaviour is different between types of people due to different
factors. Factors that affect the walking speeds of pedestrians are the personal characteristics of
pedestrians (age, gender, size, health, etc.), characteristics of the trip (walking purpose, route
familiarity, luggage, trip length), properties of the infrastructure (type, grade, attractiveness of
environment, shelter), and environmental characteristics (ambient, and weather conditions)
(Daamen & Hoogendoorn, 2003).
The objective of this project is to analyse the walking behaviour by using motion
detection in the video and simulate the walking behaviour of human being. The previous
researches on the subject are reviewed to find the rules and behaviour pattern of the human
walking. The gathered information from the video data and previous research help in the
design phase of the simulation work. The studies are to evaluate the effect of a proposed
policy ofbuilding and facilities before its implementation.
4

Pusat Khidmat MakiuDiat Akademlh UNIVERsm MALAYSIA SARAWA]{
1.1 Image Processing
Image processing is a processing of digital images using computer techniques such as
analyzing, enhancing, compressing and reconstructing of image captured through scanning or
digital photography (Image processing, 2009). Most image processing using techniques to
processing image which is distinct as two-dimensional function, f(x, y), where x and y are
spatial (plane) coordinates (Gonzalez & Woods, 2008).
The teps in the image processing were image acquisition by importing the image or
directly from digital photography, analysis and manipulation of the image by accomplished
using various specialized software application, and output of the image (Image processing,
2009). The image processing steps is shown in Figure 2.1.
Image sensing Image Object ~ ~ and acquisition segmentation recognition
Figure 2.1: Image processing steps.
Image sensing and acquisition is the ftrst step in image processing. It is captured using
a video camera and a digitizing system to store the image data for subsequent analysis. Image
captured from the subject of interest is obtained by dividing the area into a matrix of discrete
picture elements which is called pixel where each element has a value that is proportional to
the light intensity of that portion of the scene where each pixel is converted into its equivalent
digital value by an Analog to Digital Convertor (ADC) (Groover, 2008).
5