Embed Size (px)
Citation preview
238
American Economic Review: Papers & Proceedings 2012, 102(3): 238–244http://dx.doi.org/10.1257/aer.102.3.238
Natural disasters cause significant loss of life and property damage. In 2005, Hurricane Katrina destroyed large sections of New Orleans, resulting in the death of thousands. This salient disaster highlights the fact that millions of peo-ple choose to live in geographical areas that are at risk of natural disasters. In fact, the attraction of coastal living has encouraged more people to move to areas at risk from hurricanes and flood-ing, resulting in greater economic costs of disas-ters over time (Rappaport and Sachs 2003; Kahn 2005; Pielke, Jr. et al. 2008). Many forecasters predict that climate change will only exacerbate these risks.
Exposure to natural disaster risk is a func-tion both of an individual’s private choices and of governmental decisions over land use zon-ing and infrastructure investment. Government actions intended to protect the public can reduce the incentive to engage in private self-protec-tion. An intuitive example of such “crowding out” is the building of new sea walls in New Orleans. More people will stay in or move to a
Coping with EConomiC and EnvironmEntal ShoCkS: inStitutionS and outComES‡
Moving to Higher Ground: Migration Response to Natural Disasters in the Early Twentieth Century †
By Leah Platt Boustan, Matthew E. Kahn, and Paul W. Rhode*
‡Discussants: Joseph Ferrie, Northwestern University; Robert Topel, University of Chicago; David Zilberman, University of California-Berkeley.
* Boustan: UCLA Dept. of Economics, 8283 Bunche Hall, Los Angeles, CA 90095 (e-mail: [email protected]); Kahn: UCLA Inst. of the Environment, La Kretz Hall, Suite 300, Box 951496, Los Angeles, CA 90095 (e-mail: [email protected]); Rhode: University of Michigan, Dept. of Economics, 205 Lorch Hall, 611 Tappan Street, Ann Arbor, MI 48109 (e-mail: [email protected]). We thank Katherine Eriksson for able research assistance and acknowledge funding from the Center for Economic History at UCLA. Participants at the November 2011 UCLA Economic History miniconference and the 2012 American Economics Association meetings provided useful comments.
† To view additional materials, visit the article page at http://dx.doi.org/10.1257/aer.102.3.238.
risky area if they believe that sea walls will be built. In this case, government investment can displace self-protection against risk (Peltzman 1975; Kousky, Luttmer, and Zeckhauser 2006). Such efforts could be disastrous if the public is overly optimistic about engineers’ ability to pro-tect the public.
In this paper, we examine one form of private self-protection, net migration away from disas-ter-struck areas, during the 1920s and 1930s, a period before the advent of coordinated federal disaster management. In this era, disaster relief was directed by the American Red Cross (ARC). We use ARC documents to compile all major natural disasters from 1920 to 1940, including floods and tornadoes, the most common types of disaster events, and earthquakes and hurricanes. We measure migration activity using two new panel datasets of Census sources, the first fol-lowing individuals from 1920 to 1930 and the second tracking location from 1935 to 1940. We find that, on net, young men move away from areas hit by tornadoes but are attracted to areas experiencing floods. One explanation for this difference is that early efforts by the Army Corps of Engineers to protect against future flooding may have counteracted the private migration response to flood activity.
Migration away from tornado-struck areas is consistent with Hornbeck (forthcoming), which documents out-migration from the Dust Bowl in the mid-1930s. This historical pattern is in sharp contrast to Deryugina (2011), which finds no net population change in counties struck by hurri-canes in the 1980s and 1990s. Instead, affected counties receive $356 (2008 dollars) per capita in immediate disaster aid and $670 per capita in additional federal transfers over the next 10 years. The paper speculates that these federal
ContEntS
Coping with EConomiC and EnvironmEntal ShoCkS: inStitutionS and outComES‡ 238
Moving to Higher Ground: Migration Response to Natural Disasters in the Early Twentieth Century † 238
I. Data on Natural Disasters and Migration Activity, 1920–40 239
A. Data on Natural Disasters 239
B. Migration Data 240
II. Estimation Strategy and Results 240
A. Conditional Logit Models of Migration 240
B. Results 241
III. Conclusion 242
REFERENCES 243
VOL. 102 NO. 3 239MigRAtiON REsPONsE tO NAtuRAL DisAstERs iN thE EARLy twENtiEth CENtuRy
transfers may create moral hazard encourag-ing households to stay in risky areas.1 An unin-tended consequence of the growth in disaster relief and government investment in protective infrastructure may have been to expose more people to risk as they chose to move to (or not to leave) disaster-prone areas.
I. Data on Natural Disasters and Migration Activity, 1920–40
A. Data on Natural Disasters
The 1920s and 1930s witnessed numerous major natural disasters.2 Deadly tornadoes rav-aged Missouri, Illinois, and Indiana in 1925, and Mississippi and Georgia in 1936; a 6.4-mag-nitude earthquake struck near Long Beach, California in 1933; massive flooding affected the lower Mississippi valley in 1927 and the Ohio and Mississippi river valleys in 1937; and serious hurricanes hit Florida in 1926 and 1928 and New England and New York in 1938.
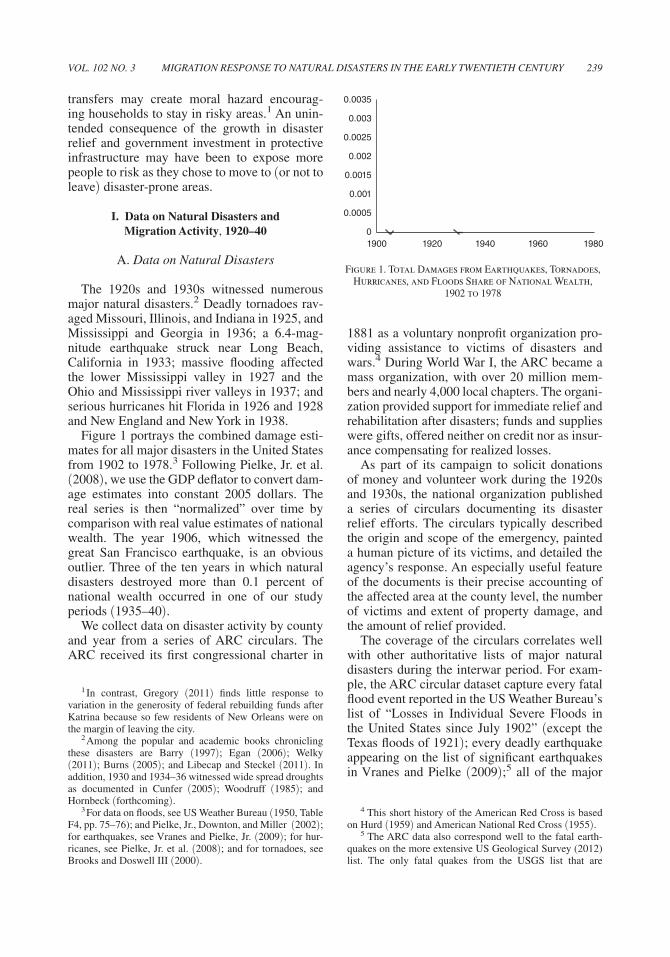
Figure 1 portrays the combined damage esti-mates for all major disasters in the United States from 1902 to 1978.3 Following Pielke, Jr. et al. (2008), we use the GDP deflator to convert dam-age estimates into constant 2005 dollars. The real series is then “normalized” over time by comparison with real value estimates of national wealth. The year 1906, which witnessed the great San Francisco earthquake, is an obvious outlier. Three of the ten years in which natural disasters destroyed more than 0.1 percent of national wealth occurred in one of our study periods (1935–40).
We collect data on disaster activity by county and year from a series of ARC circulars. The ARC received its first congressional charter in
1 In contrast, Gregory (2011) finds little response to variation in the generosity of federal rebuilding funds after Katrina because so few residents of New Orleans were on the margin of leaving the city.
2 Among the popular and academic books chronicling these disasters are Barry (1997); Egan (2006); Welky (2011); Burns (2005); and Libecap and Steckel (2011). In addition, 1930 and 1934–36 witnessed wide spread droughts as documented in Cunfer (2005); Woodruff (1985); and Hornbeck (forthcoming).
3 For data on floods, see US Weather Bureau (1950, Table F4, pp. 75–76); and Pielke, Jr., Downton, and Miller (2002); for earthquakes, see Vranes and Pielke, Jr. (2009); for hur-ricanes, see Pielke, Jr. et al. (2008); and for tornadoes, see Brooks and Doswell III (2000).
1881 as a voluntary nonprofit organization pro-viding assistance to victims of disasters and wars.4 During World War I, the ARC became a mass organization, with over 20 million mem-bers and nearly 4,000 local chapters. The organi-zation provided support for immediate relief and rehabilitation after disasters; funds and supplies were gifts, offered neither on credit nor as insur-ance compensating for realized losses.
As part of its campaign to solicit donations of money and volunteer work during the 1920s and 1930s, the national organization published a series of circulars documenting its disaster relief efforts. The circulars typically described the origin and scope of the emergency, painted a human picture of its victims, and detailed the agency’s response. An especially useful feature of the documents is their precise accounting of the affected area at the county level, the number of victims and extent of property damage, and the amount of relief provided.
The coverage of the circulars correlates well with other authoritative lists of major natural disasters during the interwar period. For exam-ple, the ARC circular dataset capture every fatal flood event reported in the US Weather Bureau’s list of “Losses in Individual Severe Floods in the United States since July 1902” (except the Texas floods of 1921); every deadly earthquake appearing on the list of significant earthquakes in Vranes and Pielke (2009);5 all of the major
4 This short history of the American Red Cross is based on Hurd (1959) and American National Red Cross (1955).
5 The ARC data also correspond well to the fatal earth-quakes on the more extensive US Geological Survey (2012) list. The only fatal quakes from the USGS list that are
Figure 1. Total Damages from Earthquakes, Tornadoes, Hurricanes, and Floods Share of National Wealth,
1902 to 1978
0.0035
0.003
0.0025
0.002
0.0015
0.001
0.0005
01900 1920 1940 1960 1980
MAy 2012240 AEA PAPERs AND PROCEEDiNgs
hurricanes and many of the lesser storms in Piekle, Jr. et al. (2008); and all of the major tor-nadoes in Brooks and Doswell (2000).6
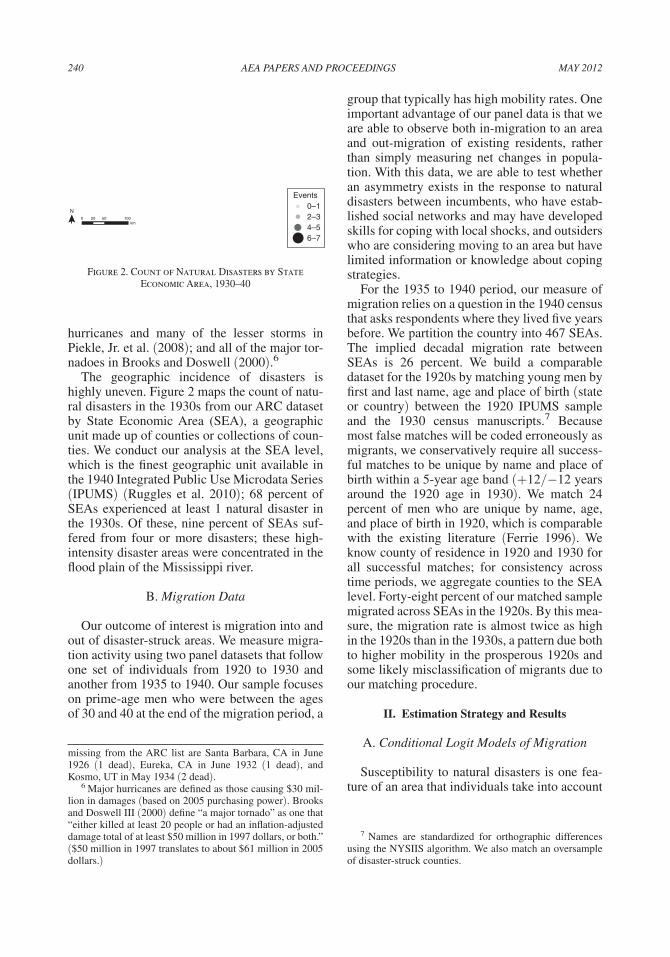
The geographic incidence of disasters is highly uneven. Figure 2 maps the count of natu-ral disasters in the 1930s from our ARC dataset by State Economic Area (SEA), a geographic unit made up of counties or collections of coun-ties. We conduct our analysis at the SEA level, which is the finest geographic unit available in the 1940 Integrated Public Use Microdata Series (IPUMS) (Ruggles et al. 2010); 68 percent of SEAs experienced at least 1 natural disaster in the 1930s. Of these, nine percent of SEAs suf-fered from four or more disasters; these high-intensity disaster areas were concentrated in the flood plain of the Mississippi river.
B. Migration Data
Our outcome of interest is migration into and out of disaster-struck areas. We measure migra-tion activity using two panel datasets that follow one set of individuals from 1920 to 1930 and another from 1935 to 1940. Our sample focuses on prime-age men who were between the ages of 30 and 40 at the end of the migration period, a
missing from the ARC list are Santa Barbara, CA in June 1926 (1 dead), Eureka, CA in June 1932 (1 dead), and Kosmo, UT in May 1934 (2 dead).
6 Major hurricanes are defined as those causing $30 mil-lion in damages (based on 2005 purchasing power). Brooks and Doswell III (2000) define “a major tornado” as one that “either killed at least 20 people or had an inflation-adjusted damage total of at least $50 million in 1997 dollars, or both.” ($50 million in 1997 translates to about $61 million in 2005 dollars.)
group that typically has high mobility rates. One important advantage of our panel data is that we are able to observe both in-migration to an area and out-migration of existing residents, rather than simply measuring net changes in popula-tion. With this data, we are able to test whether an asymmetry exists in the response to natural disasters between incumbents, who have estab-lished social networks and may have developed skills for coping with local shocks, and outsiders who are considering moving to an area but have limited information or knowledge about coping strategies.
For the 1935 to 1940 period, our measure of migration relies on a question in the 1940 census that asks respondents where they lived five years before. We partition the country into 467 SEAs. The implied decadal migration rate between SEAs is 26 percent. We build a comparable dataset for the 1920s by matching young men by first and last name, age and place of birth (state or country) between the 1920 IPUMS sample and the 1930 census manuscripts.7 Because most false matches will be coded erroneously as migrants, we conservatively require all success-ful matches to be unique by name and place of birth within a 5-year age band (+12/−12 years around the 1920 age in 1930). We match 24 percent of men who are unique by name, age, and place of birth in 1920, which is comparable with the existing literature (Ferrie 1996). We know county of residence in 1920 and 1930 for all successful matches; for consistency across time periods, we aggregate counties to the SEA level. Forty-eight percent of our matched sample migrated across SEAs in the 1920s. By this mea-sure, the migration rate is almost twice as high in the 1920s than in the 1930s, a pattern due both to higher mobility in the prosperous 1920s and some likely misclassification of migrants due to our matching procedure.
II. Estimation Strategy and Results
A. Conditional Logit Models of Migration
Susceptibility to natural disasters is one fea-ture of an area that individuals take into account
7 Names are standardized for orthographic differences using the NYSIIS algorithm. We also match an oversample of disaster-struck counties.
Figure 2. Count of Natural Disasters by State Economic Area, 1930–40
N0 20 50 100
km
0–12–34–56–7
Events
VOL. 102 NO. 3 241MigRAtiON REsPONsE tO NAtuRAL DisAstERs iN thE EARLy twENtiEth CENtuRy
when making location choices. Imagine a sim-ple model of location choice in an open system of cities with no migration costs. If everyone has identical preferences defined over location-specific attributes such as unemployment risk and real earnings (net of housing prices), basic hedonic compensating differentials theory pre-dicts that wages and rents will adjust across geo-graphical areas to sketch out the representative agent’s indifference curve (Rosen 2002). If an area faces higher natural disaster risk, and this is common knowledge, then real wages will be higher and rents will be lower to compensate individuals for locating in such a risky area.
In reality, the assumptions in the simple model sketched above are unlikely to hold. For example, individuals face migration costs. In addition, people are not fully informed about the natural disaster risk facing different regions of the country, particularly in the 1920s and 1930s, when national information was less read-ily available.8 In this sense, recent natural disas-ters were likely to be “new news” in this period. Rational expectations studies of local labor markets, such as Topel (1986), highlight that migrants respond to shocks that are unexpected and are more likely to move if they believe that the shock is permanent.
A disaster event bundles together new infor-mation about local risks, damage to short-run quality of life, and perhaps a positive shock to labor demand due to rebuilding and new con-struction. To study how recent disasters affect migration patterns, we estimate an augmented version of a standard migration model that embodies gravity effects (that is, distance from one’s origin location to every possible SEA destination) and other SEA attributes such as climate and local labor market opportunities. Our innovation is to introduce measures of recent disaster shocks as additional place-based attribute.
In particular, we estimate a series of condi-tional logits for the 1920s and 1930s, the out-come of which is an indicator variable that equals one if the individual chooses to live in SEA j. For illustration, equation (1) presents our estimating equation for the 1935 to 1940 time period for a man who lived in SEA l in 1935. In
8 Only 37 percent of American households had a radio in 1930.
this equation, Z is a vector of attributes of some potential location SEA j, Dist is the mileage dis-tance between SEA l and SEA j and Disasters is a vector of disaster counts for SEA j in the previous decade:
Pr (choose j in 1940 | in l in 1935)
= exp( B 1 Z j + B 2 Dis t jl + B 3 Disaster s j ) ____
∑ m=1 467
e xp( B 1 Z m + B 2 Dis t ml + B 3 Disaster s m ) .
The main explanatory variable of interest is a count of disaster events by type in the SEA over the previous decade. Disaster types include earthquakes, hurricanes, floods, and tornadoes. In some specifications, we also include disaster counts in the previous decade as a measure of baseline risk against which recent disasters may reflect “new news.”9
Other SEA-level controls included in the Z vector are the logarithm of total population and of land area; the black population share; a qua-dratic in latitude and in longitude, which captures variation in temperature and other climatic condi-tions; a dummy variable equal to one for SEAs with some coastal exposure; and a proxy for cur-rent and lagged decadal employment growth. Control variables are measured in the base year. Following Bartik (1991), our proxy for employ-ment growth uses base-year industrial composi-tion of employment in the SEA to weight national trends in employment growth by industry. We also include a quartic in distance between SEA j and all other possible SEA locations l.
B. Results
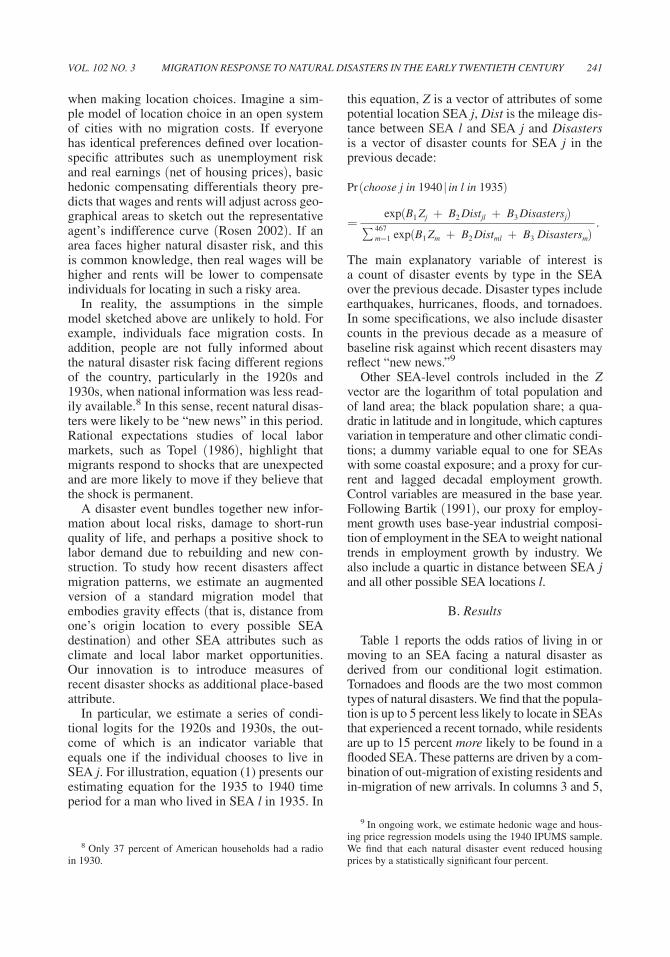
Table 1 reports the odds ratios of living in or moving to an SEA facing a natural disaster as derived from our conditional logit estimation. Tornadoes and floods are the two most common types of natural disasters. We find that the popula-tion is up to 5 percent less likely to locate in SEAs that experienced a recent tornado, while residents are up to 15 percent more likely to be found in a flooded SEA. These patterns are driven by a com-bination of out-migration of existing residents and in-migration of new arrivals. In columns 3 and 5,
9 In ongoing work, we estimate hedonic wage and hous-ing price regression models using the 1940 IPUMS sample. We find that each natural disaster event reduced housing prices by a statistically significant four percent.
MAy 2012242 AEA PAPERs AND PROCEEDiNgs
we reestimate the conditional logit for samples of men who moved between SEAs, allowing us to focus on factors that affect the decision to migrate into an SEA. We continue to find that in-migrants are attracted to flooded areas and shy away from areas recently hit by a tornado. In-migrants appear to be more responsive in avoiding tornado activity than are existing residents.
The migration response to floods and torna-does is notably similar across the two time peri-ods, despite differences in data construction. We hesitate to interpret the observed response to hurricanes and earthquakes given their rarity. For example, in the 1920s, the observed migra-tion response to hurricanes is likely picking up rapid in-migration to Florida for other reasons. For brevity, coefficients on the other controls are not shown. These controls show that, as today, migrants in the 1920s and 1930s were attracted to areas with higher current and lagged local-labor demand. Migrants also sought warmer winters and cooler summers.
The disparity in the migration response to floods and tornadoes is consistent with nascent public efforts at flood control beginning in the 1910s. Following the Great Mississippi Flood of 1927, Congress passed the Flood Control Act of 1928 authorizing the Army Corps of Engineers to construct an extensive system of levees. Similarly, in response to the 1937 flood of the
Ohio and Mississippi river valleys, the federal government commissioned a series of storage reservoirs to prevent future flooding. Although these infrastructure projects were targeted at areas with high population density, they may have also reduced the flood risk associated with the fertile farm land proximate to the river val-leys. In contrast, in this period, tornadoes were associated with high fatality especially because localities had yet to install early warning sys-tems (Simmons and Sutter 2011).
III. Conclusion
This paper has investigated the role of natural disaster shocks in determining gross migration flows, controlling for other place-based features. Using two micro datasets, we documented that in the 1920s and 1930s population was repelled from tornado-prone areas, with a larger effect on potential in-migrants than on existing residents, while flood events were associated with net in-migration. The differential migration responses by disaster type raises the question of whether public efforts at disaster mitigation counteract individual migration decisions. The nascent investment in rebuilding and protecting flood-prone areas could provide one example of public investment crowding out private self-protection (i.e., migration).
Table 1—Effect of Natural Disasters on Location Choice, Odds Ratios from Conditional Logit Models, 1920–40
Num. SEAs,1920–30
1920–30Full sample
1920–30Movers only
1935–40Full sample
1935–40Movers only
Flood count 95 1.150 1.065 1.076 1.030(10.28) (2.92) (4.05) (2.22)
Tornado count 48 1.010 0.997 0.964 0.860 (0.46) (−0.08) (−2.05) (−8.88)
Hurricane count 5 1.378 1.466 0.907 1.028(3.93) (5.01) (−3.24) (0.98)
Earthquake count 5 0.947 0.877 0.997 0.997(−0.70) (−1.21) (−0.14) (−0.16)
Controls Yes Yes Yes Yes
Notes: Column 1 reports the number of SEAs (out of 467) affected by each disaster type in the 1920s. For columns 2–5, cells report odds ratios from conditional logit models with z-statistics in parenthesis. Other controls (not reported) include the loga-rithm of total population and of land area; the black population share; a quadratic in latitude and in longitude; a dummy vari-able equal to one for SEAs with some coastal exposure; a proxy for employment growth in the SEA; total disaster count in the previous or subsequent decade; and a quartic in distance between the SEA of origin and the current SEA. Columns 2 and 5 restrict the sample to men who moved away from their origin SEA. All estimations are based on 15,000 randomly selected men.
VOL. 102 NO. 3 243MigRAtiON REsPONsE tO NAtuRAL DisAstERs iN thE EARLy twENtiEth CENtuRy
In future work, we plan to explore the role of New Deal disaster management more directly by exploiting variation across SEAs in fed-eral expenditures and representation on key congressional committees. We predict that residents of areas that received federal lar-gesse after a disaster in the 1930s will be less likely to move out and that new arrivals may be more likely to move in, while residents of areas that benefited less from New Deal spend-ing will continue to use migration as a means of self-protection.
REFERENCES
American National Red Cross. 1955. the Red Cross Activities of the American People dur-ing 75 years, 1881 through 1995. Washing-ton, DC: American National Red Cross.
Bartik, Timothy J. 1991. who Benefits from state and Local Economic Development Pol-icies? Kalamazoo, MI: Upjohn Institute.
Barry, John M. 1997. Rising tide: the great Mississippi Flood of 1927 and how it Changed America. New York: Touchstone.
Brooks, Harold E., and Charles A. Doswell III. 2000. “Normalized Damage from Major Tornadoes in the United States: 1890–1999.” weather and Forecasting 16: 168–76.
Burns, Cherie. 2005. the great hurricane, 1938. New York: Grove Press.
Cunfer, Geoff. 2005. On the great Plains, Agri-culture and Environment. College Station, TX: Texas A&M University Press.
Deryugina, Tatyana. 2011. “The Dynamic Effects of Hurricanes in the US: The Role of Non-Disaster Transfer Payments.” Unpublished.
Egan, Timothy. 2006. the worst hard time: the untold story of those who survived the great American Dust Bowl. New York: Houghton-Mifflin.
Ferrie, Joseph P. 1996. “A New Sample of Males Linked from the Public Use Micro-data Sample of the 1850 U.S. Federal Cen-sus of Population to the 1860 U.S. Federal Census Manuscript Schedules.” historical Methods 29 (4): 141–56.
Gregory, Jesse. 2011. “The Impact of Rebuild-ing Grants and Wage Subsidies on the Resettlement Choices of Hurricane Katrina Victims.” Unpublished.
Hornbeck, Richard. Forthcoming. “The Enduring
Impact of the American Dust Bowl: Short and Long-run Adjustments to Environ-mental Catastrophe.” American Economic Review.
Hurd, Charles. 1959. Compact history of the American Red Cross. New York: Hawthorn Books.
Kahn, Matthew E. 2005. “The Death Toll from Natural Disasters: The Role of Income, Geography, and Institutions.” Review of Eco-nomics and statistics 87 (2): 271–84.
Kousky, Carolyn, Erzo F. P. Luttmer, and Rich-ard J. Zeckhauser. 2006. “Private Investment and Government Protection.” Journal of Risk and uncertainty 33 (1): 73–100.
Libecap, Gary D., and Richard H. Steckel, eds. 2011. the Economics of Climate Change: Adaptations Past and Present. Chicago: Uni-versity of Chicago Press.
Peltzman, Sam. 1975. “The Effects of Automo-bile Safety Regulation.” Journal of Political Economy 83 (4): 677–725.
Pielke, Jr., Roger A., Mary W. Downton, and J. Zoe Barnard Miller. 2002. Flood Damage in the united states, 1926–2000: A Reanaly-sis of National weather service Estimates. Boulder, CO: University Corporation for Atmospheric Research.
Pielke, Jr., Roger A., Joel Gratz, Christopher W. Landsea, Douglas Collins, Mark A. Saun-ders, and Rade Musulin. 2008. “Normalized Hurricane Damages in the United States: 1900–2005.” Natural hazards Review 9 (1): 29–42.
Rappaport, Jordan, and Jeffrey D. Sachs. 2003. “The United States as a Coastal Nation.” Journal of Economic growth 8 (1): 5–46.
Rosen, Sherwin. 2002. “Markets and Diversity.” American Economic Review 92 (1): 1–15.
Ruggles, Stephen J., Trent Alexander, Katie Genadek, Ronald Goeken, Matthew B. Schro-eder, and Matthew Sobek. 2010. integrated Public use Microdata series: Version 5.0 [Machine-readable database]. Minneapolis: University of Minnesota.
Simmons, Kevin M., and Daniel Sutter. 2011. Economic and societal impacts of tornadoes. Boston: American Meteorological Society.
Topel, Robert H. 1986. “Local Labor Markets.” Journal of Political Economy 94 (3): S111–43.
US Geological Survey. 2012. “Earthquakes.” http://earthquake.usgs.gov/earthquakes/ (accessed November 15, 2011).

MAy 2012244 AEA PAPERs AND PROCEEDiNgs
US Weather Bureau. 1950. Climatological Data: National summary. Washington, DC: Gov-ernment Printing Office.
Vranes, K., and Roger A. Pielke, Jr. 2009. “Normalized Earthquake Damage and Fatali-ties in the United States: 1900–2005.” Natural hazards Review 1: 84–101.
Welky, David. 2011. the thousand-year Flood: the Ohio-Mississippi Disaster of 1937. Chicago: University of Chicago Press.
Woodruff, Nan Elizabeth. 1985. As Rare as Rain: Federal Relief in the great southern Drought of 1930–31. Urbana, Illinois: University of Illinois Press.

![DEFENSE SUPPORT OF CIVIL AUTHORITIES: DOD MISSION …The Special Congressional Committee report on Hurricane Katrina stated, “[Katrina] was the most destructive natural disaster](https://img.pdfslide.net/doc/110x75/5f048ed27e708231d40e9030/defense-support-of-civil-authorities-dod-mission-the-special-congressional-committee.jpg)