Embed Size (px)
Citation preview
Multiplexed LC-MS/MS SRM Assay for Parathyroid Hormone (PTH) and Variants: Correlation with Current Clinical Immunoassay MethodsBryan Krastins1, Mary F Lopez1, Amol Prakash1, David Sarracino1, Dobrin Nedlekov1, David R Barnidge2, Randall W Nelson3, Paul Oran3, Linda Benson2, Robert H Berger2, Jolaine Twentyman2, Ravinder J Singh2, Andrew Hoofnagle4
1Thermo Fisher Scientific BRIMS Center, Cambridge, MA, USA; 2Mayo Clinic College of Medicine, Rochester, MN 3Arizona State U, Tempe, AZ; 4U of Washington, Seattle, WA USA
2 Multiplexed LC-MS/MS SRM Assay for Parathyroid Hormone (PTH) and Variants: Correlation with Current Clinical Immunoassay Methods
TSQ Vantage
Multiplexed LC-MS/MS SRM Assay for Parathyroid Hormone (PTH) and Variants: Correlation with Current Clinical Immunoassay MethodsBryan Krastins1, Mary F Lopez1, Amol Prakash1, David Sarracino1, Dobrin Nedlekov1, David R Barnidge2, Randall W Nelson3, Paul Oran3, Linda Benson2, Robert H Berger2, Jolaine Twentyman2, Ravinder J Singh2,Andrew Hoofnagle4
1Thermo Fisher Scientific BRIMS Center, Cambridge, MA, USA 2Mayo Clinic College of Medicine, Rochester, MN 3Arizona State U, Tempe, AZ 4U of Washington, Seattle, WA USA
For Research Use Only. Not for use in diagnostic procedures.All trademarks are the property of Thermo Fisher Scientific and its subsidiaries.This information is not intended to encourage use of these products in any manners that might infringe the intellectual property rights of others.
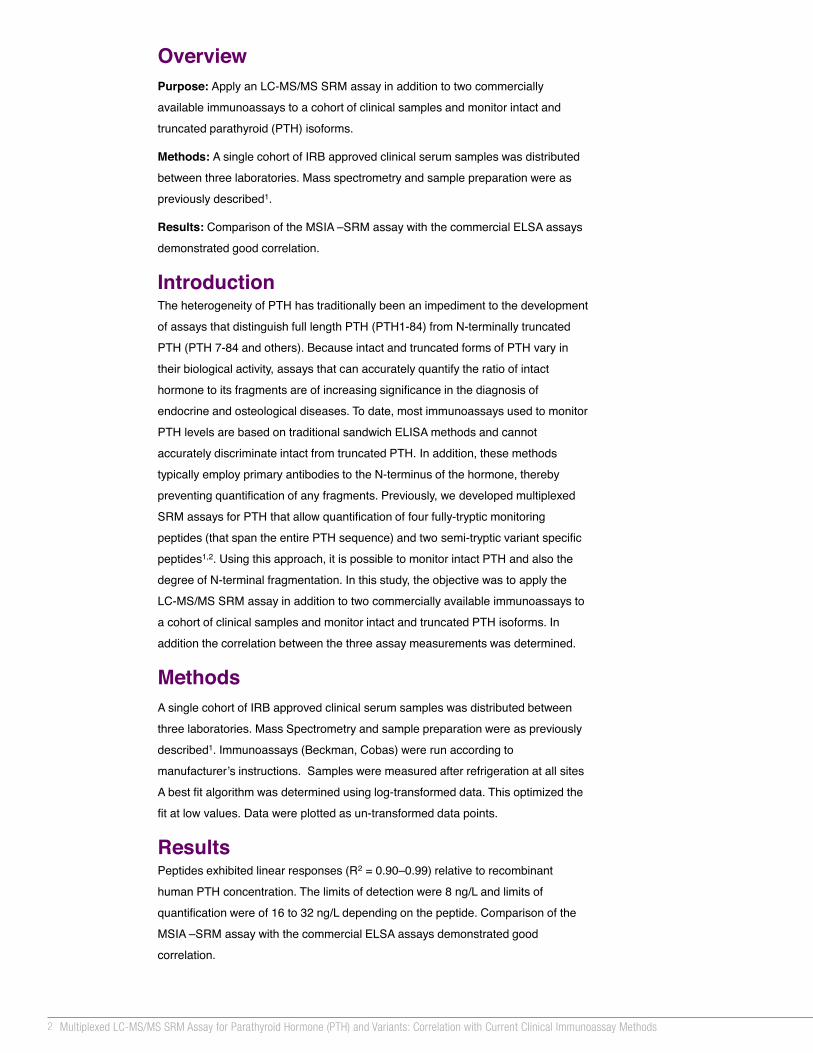
Overview Purpose: Apply an LC-MS/MS SRM assay in addition to two commercially
available immunoassays to a cohort of clinical samples and monitor intact and
truncated parathyroid (PTH) isoforms.
Methods: A single cohort of IRB approved clinical serum samples was distributed
between three laboratories. Mass spectrometry and sample preparation were as
previously described1.
Results: Comparison of the MSIA –SRM assay with the commercial ELSA assays
demonstrated good correlation.
IntroductionThe heterogeneity of PTH has traditionally been an impediment to the development
of assays that distinguish full length PTH (PTH1-84) from N-terminally truncated
PTH (PTH 7-84 and others). Because intact and truncated forms of PTH vary in
their biological activity, assays that can accurately quantify the ratio of intact
hormone to its fragments are of increasing significance in the diagnosis of
endocrine and osteological diseases. To date, most immunoassays used to monitor
PTH levels are based on traditional sandwich ELISA methods and cannot
accurately discriminate intact from truncated PTH. In addition, these methods
typically employ primary antibodies to the N-terminus of the hormone, thereby
preventing quantification of any fragments. Previously, we developed multiplexed
SRM assays for PTH that allow quantification of four fully-tryptic monitoring
peptides (that span the entire PTH sequence) and two semi-tryptic variant specific
peptides1,2. Using this approach, it is possible to monitor intact PTH and also the
degree of N-terminal fragmentation. In this study, the objective was to apply the
LC-MS/MS SRM assay in addition to two commercially available immunoassays to
a cohort of clinical samples and monitor intact and truncated PTH isoforms. In
addition the correlation between the three assay measurements was determined.
MethodsA single cohort of IRB approved clinical serum samples was distributed between
three laboratories. Mass Spectrometry and sample preparation were as previously
described1. Immunoassays (Beckman, Cobas) were run according to
manufacturer’s instructions. Samples were measured after refrigeration at all sites
A best fit algorithm was determined using log-transformed data. This optimized the
fit at low values. Data were plotted as un-transformed data points.
ResultsPeptides exhibited linear responses (R2 = 0.90–0.99) relative to recombinant
human PTH concentration. The limits of detection were 8 ng/L and limits of
quantification were of 16 to 32 ng/L depending on the peptide. Comparison of the
MSIA –SRM assay with the commercial ELSA assays demonstrated good
correlation.
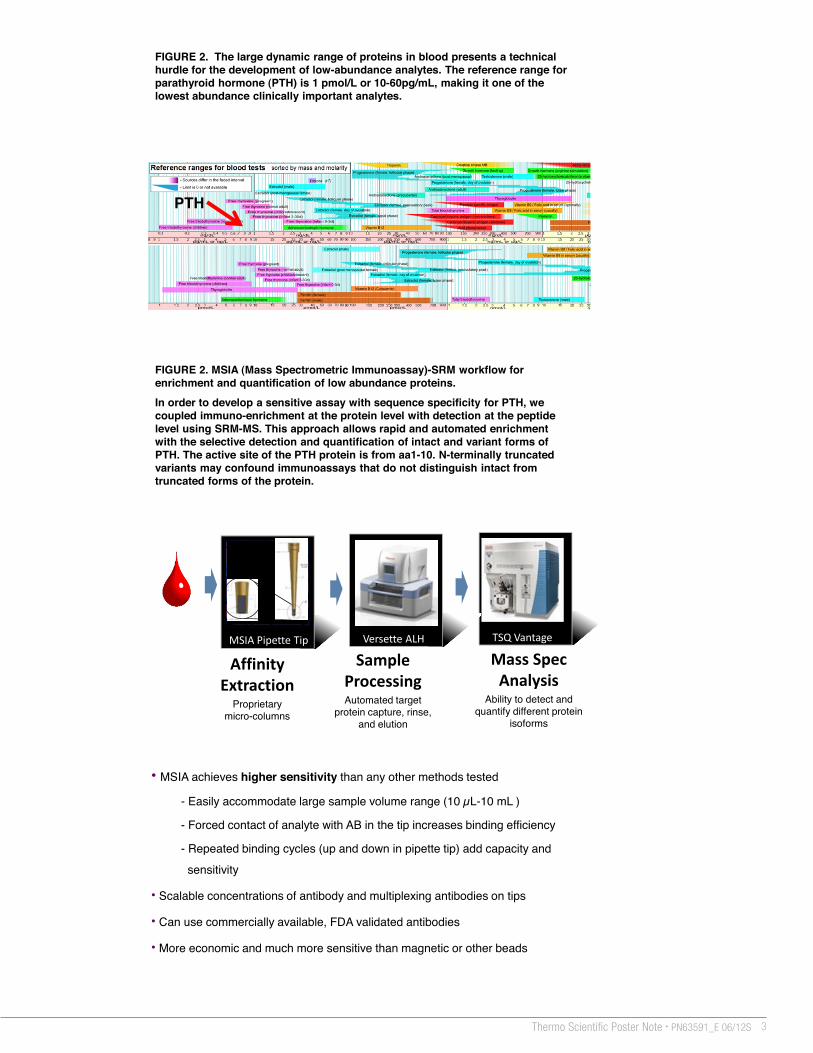
FIGURE 2. MSIA (Mass Spectrometric Immunoassay)-SRM workflow for enrichment and quantification of low abundance proteins.
In order to develop a sensitive assay with sequence specificity for PTH, we coupled immuno-enrichment at the protein level with detection at the peptide level using SRM-MS. This approach allows rapid and automated enrichment with the selective detection and quantification of intact and variant forms of PTH. The active site of the PTH protein is from aa1-10. N-terminally truncated variants may confound immunoassays that do not distinguish intact from truncated forms of the protein.
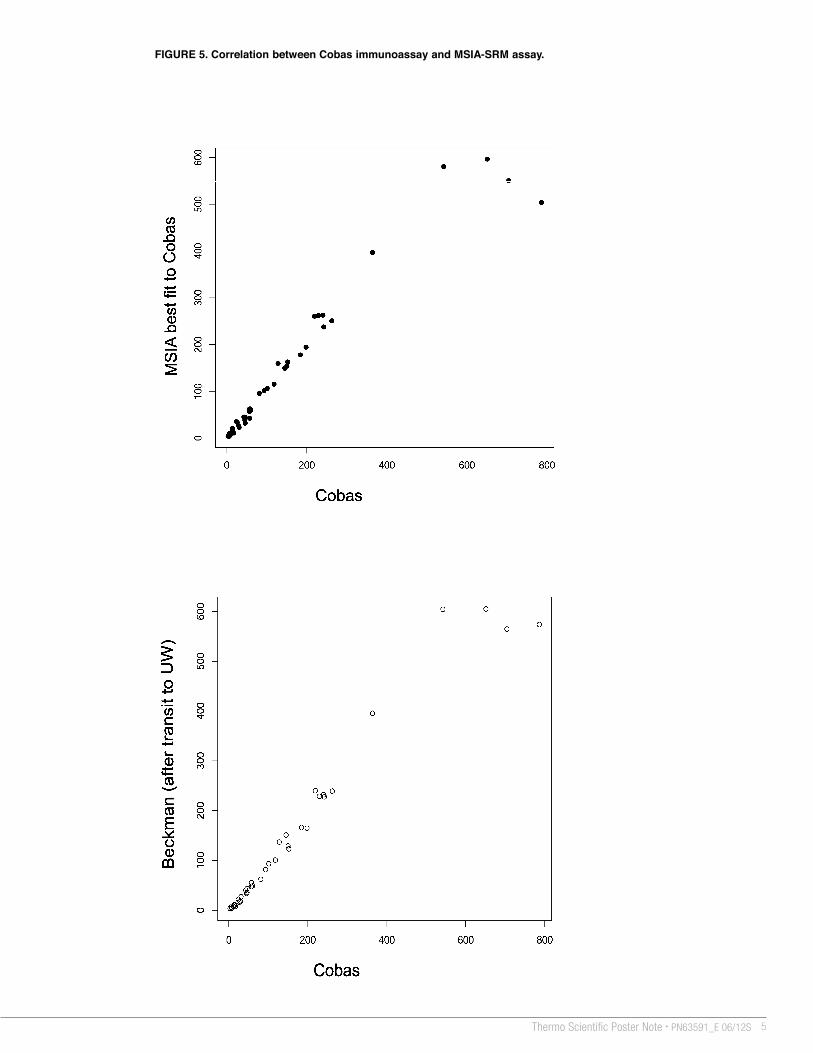
FIGURE 2. Correlation between Beckman and Cobas immunoassays.
FIGURE 5. Correlation between Cobas immunoassay and MSIA-SRM assay.
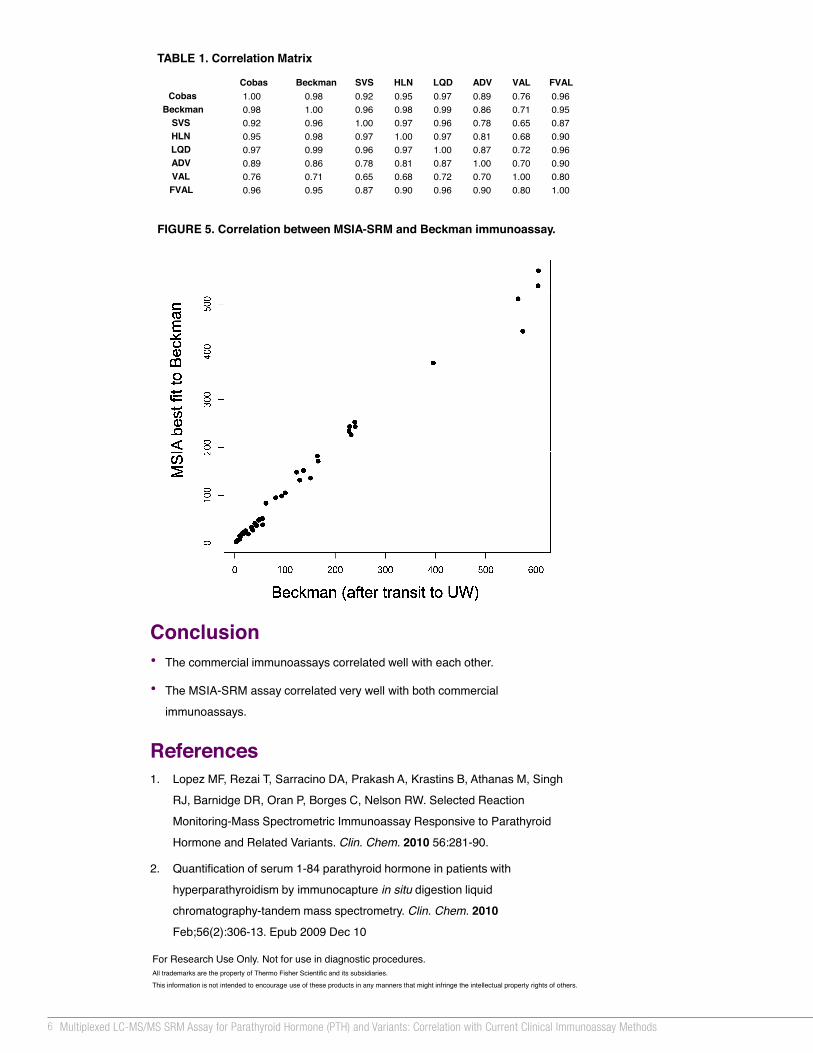
Conclusion• The commercial immunoassays correlated well with each other.
• The MSIA-SRM assay correlated very well with both commercial
immunoassays.
References1. Lopez MF, Rezai T, Sarracino DA, Prakash A, Krastins B, Athanas M, Singh
RJ, Barnidge DR, Oran P, Borges C, Nelson RW. Selected Reaction
Monitoring-Mass Spectrometric Immunoassay Responsive to Parathyroid
Hormone and Related Variants. Clin. Chem. 2010 56:281-90.
2. Quantification of serum 1-84 parathyroid hormone in patients with
hyperparathyroidism by immunocapture in situ digestion liquid
chromatography-tandem mass spectrometry. Clin. Chem. 2010Feb;56(2):306-13. Epub 2009 Dec 10
TABLE 1. Correlation Matrix
Affinity Extraction
Proprietary micro-columns
Sample ProcessingAutomated target
protein capture, rinse, and elution
Mass Spec Analysis
Ability to detect and quantify different protein
isoforms
MSIA Pipette Tip Versette ALH
• MSIA achieves higher sensitivity than any other methods tested
- Easily accommodate large sample volume range (10 µL-10 mL )
- Forced contact of analyte with AB in the tip increases binding efficiency
- Repeated binding cycles (up and down in pipette tip) add capacity and
sensitivity
• Scalable concentrations of antibody and multiplexing antibodies on tips
• Can use commercially available, FDA validated antibodies
• More economic and much more sensitive than magnetic or other beads
PTH Variant MapResidue Number
N 20 40 60 80
Variant orFragment
[1-84][7-84][34-84][37-84][38-84][45-84]
[28-84][48-84][34-77][37-77][38-77]
[1-13][7-13][14-20][28-44][34-44][73-80]
SVSEIQLMHNLGK
LMHNLGKHLNSMER LQDVHNFVALGAPLAPR
FVALGAPLAPRADVNVLTK
Variant specific
FIGURE 3. Previous top down analyses of PTH in clinical samples revealed a large degree of heterogeneity and truncated variants, principally at the N terminus (1). In order to quantify intact and truncated forms, we chose 4 fully tryptic and 3 semi-tryptic (variant specific) peptides for the multiplexed SRM assay.
PTH
FIGURE 4. Ten point calibration curve for peptide SVSEIQLMHNLGK. The values ranged from 0-2000pg/mL. CV’s of triplicate points ranged from 1-19%. The R2 was 0.978. Calibration curves for peptides HLNSMER, ADVNVLTK and LQDVHNFVALGAPLAPR demonstrated similar linearity and precision.
FIGURE 2. The large dynamic range of proteins in blood presents a technical hurdle for the development of low-abundance analytes. The reference range for parathyroid hormone (PTH) is 1 pmol/L or 10-60pg/mL, making it one of the lowest abundance clinically important analytes.
FIGURE 5. Correlation between MSIA-SRM and Beckman immunoassay.
Cobas Beckman SVS HLN LQD ADV VAL FVALCobas 1.00 0.98 0.92 0.95 0.97 0.89 0.76 0.96
Beckman 0.98 1.00 0.96 0.98 0.99 0.86 0.71 0.95SVS 0.92 0.96 1.00 0.97 0.96 0.78 0.65 0.87HLN 0.95 0.98 0.97 1.00 0.97 0.81 0.68 0.90LQD 0.97 0.99 0.96 0.97 1.00 0.87 0.72 0.96ADV 0.89 0.86 0.78 0.81 0.87 1.00 0.70 0.90VAL 0.76 0.71 0.65 0.68 0.72 0.70 1.00 0.80FVAL 0.96 0.95 0.87 0.90 0.96 0.90 0.80 1.00
3Thermo Scientific Poster Note • PN63591_E 06/12S
TSQ Vantage
Multiplexed LC-MS/MS SRM Assay for Parathyroid Hormone (PTH) and Variants: Correlation with Current Clinical Immunoassay MethodsBryan Krastins1, Mary F Lopez1, Amol Prakash1, David Sarracino1, Dobrin Nedlekov1, David R Barnidge2, Randall W Nelson3, Paul Oran3, Linda Benson2, Robert H Berger2, Jolaine Twentyman2, Ravinder J Singh2,Andrew Hoofnagle4
1Thermo Fisher Scientific BRIMS Center, Cambridge, MA, USA 2Mayo Clinic College of Medicine, Rochester, MN 3Arizona State U, Tempe, AZ 4U of Washington, Seattle, WA USA
For Research Use Only. Not for use in diagnostic procedures.All trademarks are the property of Thermo Fisher Scientific and its subsidiaries.This information is not intended to encourage use of these products in any manners that might infringe the intellectual property rights of others.
Overview Purpose: Apply an LC-MS/MS SRM assay in addition to two commercially
available immunoassays to a cohort of clinical samples and monitor intact and
truncated parathyroid (PTH) isoforms.
Methods: A single cohort of IRB approved clinical serum samples was distributed
between three laboratories. Mass spectrometry and sample preparation were as
previously described1.
Results: Comparison of the MSIA –SRM assay with the commercial ELSA assays
demonstrated good correlation.
IntroductionThe heterogeneity of PTH has traditionally been an impediment to the development
of assays that distinguish full length PTH (PTH1-84) from N-terminally truncated
PTH (PTH 7-84 and others). Because intact and truncated forms of PTH vary in
their biological activity, assays that can accurately quantify the ratio of intact
hormone to its fragments are of increasing significance in the diagnosis of
endocrine and osteological diseases. To date, most immunoassays used to monitor
PTH levels are based on traditional sandwich ELISA methods and cannot
accurately discriminate intact from truncated PTH. In addition, these methods
typically employ primary antibodies to the N-terminus of the hormone, thereby
preventing quantification of any fragments. Previously, we developed multiplexed
SRM assays for PTH that allow quantification of four fully-tryptic monitoring
peptides (that span the entire PTH sequence) and two semi-tryptic variant specific
peptides1,2. Using this approach, it is possible to monitor intact PTH and also the
degree of N-terminal fragmentation. In this study, the objective was to apply the
LC-MS/MS SRM assay in addition to two commercially available immunoassays to
a cohort of clinical samples and monitor intact and truncated PTH isoforms. In
addition the correlation between the three assay measurements was determined.
MethodsA single cohort of IRB approved clinical serum samples was distributed between
three laboratories. Mass Spectrometry and sample preparation were as previously
described1. Immunoassays (Beckman, Cobas) were run according to
manufacturer’s instructions. Samples were measured after refrigeration at all sites
A best fit algorithm was determined using log-transformed data. This optimized the
fit at low values. Data were plotted as un-transformed data points.
ResultsPeptides exhibited linear responses (R2 = 0.90–0.99) relative to recombinant
human PTH concentration. The limits of detection were 8 ng/L and limits of
quantification were of 16 to 32 ng/L depending on the peptide. Comparison of the
MSIA –SRM assay with the commercial ELSA assays demonstrated good
correlation.
FIGURE 2. MSIA (Mass Spectrometric Immunoassay)-SRM workflow for enrichment and quantification of low abundance proteins.
In order to develop a sensitive assay with sequence specificity for PTH, we coupled immuno-enrichment at the protein level with detection at the peptide level using SRM-MS. This approach allows rapid and automated enrichment with the selective detection and quantification of intact and variant forms of PTH. The active site of the PTH protein is from aa1-10. N-terminally truncated variants may confound immunoassays that do not distinguish intact from truncated forms of the protein.
FIGURE 2. Correlation between Beckman and Cobas immunoassays.
FIGURE 5. Correlation between Cobas immunoassay and MSIA-SRM assay.
Conclusion• The commercial immunoassays correlated well with each other.
• The MSIA-SRM assay correlated very well with both commercial
immunoassays.
References1. Lopez MF, Rezai T, Sarracino DA, Prakash A, Krastins B, Athanas M, Singh
RJ, Barnidge DR, Oran P, Borges C, Nelson RW. Selected Reaction
Monitoring-Mass Spectrometric Immunoassay Responsive to Parathyroid
Hormone and Related Variants. Clin. Chem. 2010 56:281-90.
2. Quantification of serum 1-84 parathyroid hormone in patients with
hyperparathyroidism by immunocapture in situ digestion liquid
chromatography-tandem mass spectrometry. Clin. Chem. 2010Feb;56(2):306-13. Epub 2009 Dec 10
TABLE 1. Correlation Matrix
Affinity Extraction
Proprietary micro-columns
Sample ProcessingAutomated target
protein capture, rinse, and elution
Mass Spec Analysis
Ability to detect and quantify different protein
isoforms
MSIA Pipette Tip Versette ALH
• MSIA achieves higher sensitivity than any other methods tested
- Easily accommodate large sample volume range (10 µL-10 mL )
- Forced contact of analyte with AB in the tip increases binding efficiency
- Repeated binding cycles (up and down in pipette tip) add capacity and
sensitivity
• Scalable concentrations of antibody and multiplexing antibodies on tips
• Can use commercially available, FDA validated antibodies
• More economic and much more sensitive than magnetic or other beads
PTH Variant MapResidue Number
N 20 40 60 80
Variant orFragment
[1-84][7-84][34-84][37-84][38-84][45-84]
[28-84][48-84][34-77][37-77][38-77]
[1-13][7-13][14-20][28-44][34-44][73-80]
SVSEIQLMHNLGK
LMHNLGKHLNSMER LQDVHNFVALGAPLAPR
FVALGAPLAPRADVNVLTK
Variant specific
FIGURE 3. Previous top down analyses of PTH in clinical samples revealed a large degree of heterogeneity and truncated variants, principally at the N terminus (1). In order to quantify intact and truncated forms, we chose 4 fully tryptic and 3 semi-tryptic (variant specific) peptides for the multiplexed SRM assay.
PTH
FIGURE 4. Ten point calibration curve for peptide SVSEIQLMHNLGK. The values ranged from 0-2000pg/mL. CV’s of triplicate points ranged from 1-19%. The R2 was 0.978. Calibration curves for peptides HLNSMER, ADVNVLTK and LQDVHNFVALGAPLAPR demonstrated similar linearity and precision.
FIGURE 2. The large dynamic range of proteins in blood presents a technical hurdle for the development of low-abundance analytes. The reference range for parathyroid hormone (PTH) is 1 pmol/L or 10-60pg/mL, making it one of the lowest abundance clinically important analytes.
FIGURE 5. Correlation between MSIA-SRM and Beckman immunoassay.
Cobas Beckman SVS HLN LQD ADV VAL FVALCobas 1.00 0.98 0.92 0.95 0.97 0.89 0.76 0.96
Beckman 0.98 1.00 0.96 0.98 0.99 0.86 0.71 0.95SVS 0.92 0.96 1.00 0.97 0.96 0.78 0.65 0.87HLN 0.95 0.98 0.97 1.00 0.97 0.81 0.68 0.90LQD 0.97 0.99 0.96 0.97 1.00 0.87 0.72 0.96ADV 0.89 0.86 0.78 0.81 0.87 1.00 0.70 0.90VAL 0.76 0.71 0.65 0.68 0.72 0.70 1.00 0.80FVAL 0.96 0.95 0.87 0.90 0.96 0.90 0.80 1.00

4 Multiplexed LC-MS/MS SRM Assay for Parathyroid Hormone (PTH) and Variants: Correlation with Current Clinical Immunoassay Methods
TSQ Vantage
Multiplexed LC-MS/MS SRM Assay for Parathyroid Hormone (PTH) and Variants: Correlation with Current Clinical Immunoassay MethodsBryan Krastins1, Mary F Lopez1, Amol Prakash1, David Sarracino1, Dobrin Nedlekov1, David R Barnidge2, Randall W Nelson3, Paul Oran3, Linda Benson2, Robert H Berger2, Jolaine Twentyman2, Ravinder J Singh2,Andrew Hoofnagle4
1Thermo Fisher Scientific BRIMS Center, Cambridge, MA, USA 2Mayo Clinic College of Medicine, Rochester, MN 3Arizona State U, Tempe, AZ 4U of Washington, Seattle, WA USA
For Research Use Only. Not for use in diagnostic procedures.All trademarks are the property of Thermo Fisher Scientific and its subsidiaries.This information is not intended to encourage use of these products in any manners that might infringe the intellectual property rights of others.
Overview Purpose: Apply an LC-MS/MS SRM assay in addition to two commercially
available immunoassays to a cohort of clinical samples and monitor intact and
truncated parathyroid (PTH) isoforms.
Methods: A single cohort of IRB approved clinical serum samples was distributed
between three laboratories. Mass spectrometry and sample preparation were as
previously described1.
Results: Comparison of the MSIA –SRM assay with the commercial ELSA assays
demonstrated good correlation.
IntroductionThe heterogeneity of PTH has traditionally been an impediment to the development
of assays that distinguish full length PTH (PTH1-84) from N-terminally truncated
PTH (PTH 7-84 and others). Because intact and truncated forms of PTH vary in
their biological activity, assays that can accurately quantify the ratio of intact
hormone to its fragments are of increasing significance in the diagnosis of
endocrine and osteological diseases. To date, most immunoassays used to monitor
PTH levels are based on traditional sandwich ELISA methods and cannot
accurately discriminate intact from truncated PTH. In addition, these methods
typically employ primary antibodies to the N-terminus of the hormone, thereby
preventing quantification of any fragments. Previously, we developed multiplexed
SRM assays for PTH that allow quantification of four fully-tryptic monitoring
peptides (that span the entire PTH sequence) and two semi-tryptic variant specific
peptides1,2. Using this approach, it is possible to monitor intact PTH and also the
degree of N-terminal fragmentation. In this study, the objective was to apply the
LC-MS/MS SRM assay in addition to two commercially available immunoassays to
a cohort of clinical samples and monitor intact and truncated PTH isoforms. In
addition the correlation between the three assay measurements was determined.
MethodsA single cohort of IRB approved clinical serum samples was distributed between
three laboratories. Mass Spectrometry and sample preparation were as previously
described1. Immunoassays (Beckman, Cobas) were run according to
manufacturer’s instructions. Samples were measured after refrigeration at all sites
A best fit algorithm was determined using log-transformed data. This optimized the
fit at low values. Data were plotted as un-transformed data points.
ResultsPeptides exhibited linear responses (R2 = 0.90–0.99) relative to recombinant
human PTH concentration. The limits of detection were 8 ng/L and limits of
quantification were of 16 to 32 ng/L depending on the peptide. Comparison of the
MSIA –SRM assay with the commercial ELSA assays demonstrated good
correlation.
FIGURE 2. MSIA (Mass Spectrometric Immunoassay)-SRM workflow for enrichment and quantification of low abundance proteins.
In order to develop a sensitive assay with sequence specificity for PTH, we coupled immuno-enrichment at the protein level with detection at the peptide level using SRM-MS. This approach allows rapid and automated enrichment with the selective detection and quantification of intact and variant forms of PTH. The active site of the PTH protein is from aa1-10. N-terminally truncated variants may confound immunoassays that do not distinguish intact from truncated forms of the protein.
FIGURE 2. Correlation between Beckman and Cobas immunoassays.
FIGURE 5. Correlation between Cobas immunoassay and MSIA-SRM assay.
Conclusion• The commercial immunoassays correlated well with each other.
• The MSIA-SRM assay correlated very well with both commercial
immunoassays.
References1. Lopez MF, Rezai T, Sarracino DA, Prakash A, Krastins B, Athanas M, Singh
RJ, Barnidge DR, Oran P, Borges C, Nelson RW. Selected Reaction
Monitoring-Mass Spectrometric Immunoassay Responsive to Parathyroid
Hormone and Related Variants. Clin. Chem. 2010 56:281-90.
2. Quantification of serum 1-84 parathyroid hormone in patients with
hyperparathyroidism by immunocapture in situ digestion liquid
chromatography-tandem mass spectrometry. Clin. Chem. 2010Feb;56(2):306-13. Epub 2009 Dec 10
TABLE 1. Correlation Matrix
Affinity Extraction
Proprietary micro-columns
Sample ProcessingAutomated target
protein capture, rinse, and elution
Mass Spec Analysis
Ability to detect and quantify different protein
isoforms
MSIA Pipette Tip Versette ALH
• MSIA achieves higher sensitivity than any other methods tested
- Easily accommodate large sample volume range (10 µL-10 mL )
- Forced contact of analyte with AB in the tip increases binding efficiency
- Repeated binding cycles (up and down in pipette tip) add capacity and
sensitivity
• Scalable concentrations of antibody and multiplexing antibodies on tips
• Can use commercially available, FDA validated antibodies
• More economic and much more sensitive than magnetic or other beads
PTH Variant MapResidue Number
N 20 40 60 80
Variant orFragment
[1-84][7-84][34-84][37-84][38-84][45-84]
[28-84][48-84][34-77][37-77][38-77]
[1-13][7-13][14-20][28-44][34-44][73-80]
SVSEIQLMHNLGK
LMHNLGKHLNSMER LQDVHNFVALGAPLAPR
FVALGAPLAPRADVNVLTK
Variant specific
FIGURE 3. Previous top down analyses of PTH in clinical samples revealed a large degree of heterogeneity and truncated variants, principally at the N terminus (1). In order to quantify intact and truncated forms, we chose 4 fully tryptic and 3 semi-tryptic (variant specific) peptides for the multiplexed SRM assay.
PTH
FIGURE 4. Ten point calibration curve for peptide SVSEIQLMHNLGK. The values ranged from 0-2000pg/mL. CV’s of triplicate points ranged from 1-19%. The R2 was 0.978. Calibration curves for peptides HLNSMER, ADVNVLTK and LQDVHNFVALGAPLAPR demonstrated similar linearity and precision.
FIGURE 2. The large dynamic range of proteins in blood presents a technical hurdle for the development of low-abundance analytes. The reference range for parathyroid hormone (PTH) is 1 pmol/L or 10-60pg/mL, making it one of the lowest abundance clinically important analytes.
FIGURE 5. Correlation between MSIA-SRM and Beckman immunoassay.
Cobas Beckman SVS HLN LQD ADV VAL FVALCobas 1.00 0.98 0.92 0.95 0.97 0.89 0.76 0.96
Beckman 0.98 1.00 0.96 0.98 0.99 0.86 0.71 0.95SVS 0.92 0.96 1.00 0.97 0.96 0.78 0.65 0.87HLN 0.95 0.98 0.97 1.00 0.97 0.81 0.68 0.90LQD 0.97 0.99 0.96 0.97 1.00 0.87 0.72 0.96ADV 0.89 0.86 0.78 0.81 0.87 1.00 0.70 0.90VAL 0.76 0.71 0.65 0.68 0.72 0.70 1.00 0.80FVAL 0.96 0.95 0.87 0.90 0.96 0.90 0.80 1.00
5Thermo Scientific Poster Note • PN63591_E 06/12S
TSQ Vantage
Multiplexed LC-MS/MS SRM Assay for Parathyroid Hormone (PTH) and Variants: Correlation with Current Clinical Immunoassay MethodsBryan Krastins1, Mary F Lopez1, Amol Prakash1, David Sarracino1, Dobrin Nedlekov1, David R Barnidge2, Randall W Nelson3, Paul Oran3, Linda Benson2, Robert H Berger2, Jolaine Twentyman2, Ravinder J Singh2,Andrew Hoofnagle4
1Thermo Fisher Scientific BRIMS Center, Cambridge, MA, USA 2Mayo Clinic College of Medicine, Rochester, MN 3Arizona State U, Tempe, AZ 4U of Washington, Seattle, WA USA
For Research Use Only. Not for use in diagnostic procedures.All trademarks are the property of Thermo Fisher Scientific and its subsidiaries.This information is not intended to encourage use of these products in any manners that might infringe the intellectual property rights of others.
Overview Purpose: Apply an LC-MS/MS SRM assay in addition to two commercially
available immunoassays to a cohort of clinical samples and monitor intact and
truncated parathyroid (PTH) isoforms.
Methods: A single cohort of IRB approved clinical serum samples was distributed
between three laboratories. Mass spectrometry and sample preparation were as
previously described1.
Results: Comparison of the MSIA –SRM assay with the commercial ELSA assays
demonstrated good correlation.
IntroductionThe heterogeneity of PTH has traditionally been an impediment to the development
of assays that distinguish full length PTH (PTH1-84) from N-terminally truncated
PTH (PTH 7-84 and others). Because intact and truncated forms of PTH vary in
their biological activity, assays that can accurately quantify the ratio of intact
hormone to its fragments are of increasing significance in the diagnosis of
endocrine and osteological diseases. To date, most immunoassays used to monitor
PTH levels are based on traditional sandwich ELISA methods and cannot
accurately discriminate intact from truncated PTH. In addition, these methods
typically employ primary antibodies to the N-terminus of the hormone, thereby
preventing quantification of any fragments. Previously, we developed multiplexed
SRM assays for PTH that allow quantification of four fully-tryptic monitoring
peptides (that span the entire PTH sequence) and two semi-tryptic variant specific
peptides1,2. Using this approach, it is possible to monitor intact PTH and also the
degree of N-terminal fragmentation. In this study, the objective was to apply the
LC-MS/MS SRM assay in addition to two commercially available immunoassays to
a cohort of clinical samples and monitor intact and truncated PTH isoforms. In
addition the correlation between the three assay measurements was determined.
MethodsA single cohort of IRB approved clinical serum samples was distributed between
three laboratories. Mass Spectrometry and sample preparation were as previously
described1. Immunoassays (Beckman, Cobas) were run according to
manufacturer’s instructions. Samples were measured after refrigeration at all sites
A best fit algorithm was determined using log-transformed data. This optimized the
fit at low values. Data were plotted as un-transformed data points.
ResultsPeptides exhibited linear responses (R2 = 0.90–0.99) relative to recombinant
human PTH concentration. The limits of detection were 8 ng/L and limits of
quantification were of 16 to 32 ng/L depending on the peptide. Comparison of the
MSIA –SRM assay with the commercial ELSA assays demonstrated good
correlation.
FIGURE 2. MSIA (Mass Spectrometric Immunoassay)-SRM workflow for enrichment and quantification of low abundance proteins.
In order to develop a sensitive assay with sequence specificity for PTH, we coupled immuno-enrichment at the protein level with detection at the peptide level using SRM-MS. This approach allows rapid and automated enrichment with the selective detection and quantification of intact and variant forms of PTH. The active site of the PTH protein is from aa1-10. N-terminally truncated variants may confound immunoassays that do not distinguish intact from truncated forms of the protein.
FIGURE 2. Correlation between Beckman and Cobas immunoassays.
FIGURE 5. Correlation between Cobas immunoassay and MSIA-SRM assay.
Conclusion• The commercial immunoassays correlated well with each other.
• The MSIA-SRM assay correlated very well with both commercial
immunoassays.
References1. Lopez MF, Rezai T, Sarracino DA, Prakash A, Krastins B, Athanas M, Singh
RJ, Barnidge DR, Oran P, Borges C, Nelson RW. Selected Reaction
Monitoring-Mass Spectrometric Immunoassay Responsive to Parathyroid
Hormone and Related Variants. Clin. Chem. 2010 56:281-90.
2. Quantification of serum 1-84 parathyroid hormone in patients with
hyperparathyroidism by immunocapture in situ digestion liquid
chromatography-tandem mass spectrometry. Clin. Chem. 2010Feb;56(2):306-13. Epub 2009 Dec 10
TABLE 1. Correlation Matrix
Affinity Extraction
Proprietary micro-columns
Sample ProcessingAutomated target
protein capture, rinse, and elution
Mass Spec Analysis
Ability to detect and quantify different protein
isoforms
MSIA Pipette Tip Versette ALH
• MSIA achieves higher sensitivity than any other methods tested
- Easily accommodate large sample volume range (10 µL-10 mL )
- Forced contact of analyte with AB in the tip increases binding efficiency
- Repeated binding cycles (up and down in pipette tip) add capacity and
sensitivity
• Scalable concentrations of antibody and multiplexing antibodies on tips
• Can use commercially available, FDA validated antibodies
• More economic and much more sensitive than magnetic or other beads
PTH Variant MapResidue Number
N 20 40 60 80
Variant orFragment
[1-84][7-84][34-84][37-84][38-84][45-84]
[28-84][48-84][34-77][37-77][38-77]
[1-13][7-13][14-20][28-44][34-44][73-80]
SVSEIQLMHNLGK
LMHNLGKHLNSMER LQDVHNFVALGAPLAPR
FVALGAPLAPRADVNVLTK
Variant specific
FIGURE 3. Previous top down analyses of PTH in clinical samples revealed a large degree of heterogeneity and truncated variants, principally at the N terminus (1). In order to quantify intact and truncated forms, we chose 4 fully tryptic and 3 semi-tryptic (variant specific) peptides for the multiplexed SRM assay.
PTH
FIGURE 4. Ten point calibration curve for peptide SVSEIQLMHNLGK. The values ranged from 0-2000pg/mL. CV’s of triplicate points ranged from 1-19%. The R2 was 0.978. Calibration curves for peptides HLNSMER, ADVNVLTK and LQDVHNFVALGAPLAPR demonstrated similar linearity and precision.
FIGURE 2. The large dynamic range of proteins in blood presents a technical hurdle for the development of low-abundance analytes. The reference range for parathyroid hormone (PTH) is 1 pmol/L or 10-60pg/mL, making it one of the lowest abundance clinically important analytes.
FIGURE 5. Correlation between MSIA-SRM and Beckman immunoassay.
Cobas Beckman SVS HLN LQD ADV VAL FVALCobas 1.00 0.98 0.92 0.95 0.97 0.89 0.76 0.96
Beckman 0.98 1.00 0.96 0.98 0.99 0.86 0.71 0.95SVS 0.92 0.96 1.00 0.97 0.96 0.78 0.65 0.87HLN 0.95 0.98 0.97 1.00 0.97 0.81 0.68 0.90LQD 0.97 0.99 0.96 0.97 1.00 0.87 0.72 0.96ADV 0.89 0.86 0.78 0.81 0.87 1.00 0.70 0.90VAL 0.76 0.71 0.65 0.68 0.72 0.70 1.00 0.80FVAL 0.96 0.95 0.87 0.90 0.96 0.90 0.80 1.00
6 Multiplexed LC-MS/MS SRM Assay for Parathyroid Hormone (PTH) and Variants: Correlation with Current Clinical Immunoassay Methods
TSQ Vantage
Multiplexed LC-MS/MS SRM Assay for Parathyroid Hormone (PTH) and Variants: Correlation with Current Clinical Immunoassay MethodsBryan Krastins1, Mary F Lopez1, Amol Prakash1, David Sarracino1, Dobrin Nedlekov1, David R Barnidge2, Randall W Nelson3, Paul Oran3, Linda Benson2, Robert H Berger2, Jolaine Twentyman2, Ravinder J Singh2,Andrew Hoofnagle4
1Thermo Fisher Scientific BRIMS Center, Cambridge, MA, USA 2Mayo Clinic College of Medicine, Rochester, MN 3Arizona State U, Tempe, AZ 4U of Washington, Seattle, WA USA
For Research Use Only. Not for use in diagnostic procedures.All trademarks are the property of Thermo Fisher Scientific and its subsidiaries.This information is not intended to encourage use of these products in any manners that might infringe the intellectual property rights of others.
Overview Purpose: Apply an LC-MS/MS SRM assay in addition to two commercially
available immunoassays to a cohort of clinical samples and monitor intact and
truncated parathyroid (PTH) isoforms.
Methods: A single cohort of IRB approved clinical serum samples was distributed
between three laboratories. Mass spectrometry and sample preparation were as
previously described1.
Results: Comparison of the MSIA –SRM assay with the commercial ELSA assays
demonstrated good correlation.
IntroductionThe heterogeneity of PTH has traditionally been an impediment to the development
of assays that distinguish full length PTH (PTH1-84) from N-terminally truncated
PTH (PTH 7-84 and others). Because intact and truncated forms of PTH vary in
their biological activity, assays that can accurately quantify the ratio of intact
hormone to its fragments are of increasing significance in the diagnosis of
endocrine and osteological diseases. To date, most immunoassays used to monitor
PTH levels are based on traditional sandwich ELISA methods and cannot
accurately discriminate intact from truncated PTH. In addition, these methods
typically employ primary antibodies to the N-terminus of the hormone, thereby
preventing quantification of any fragments. Previously, we developed multiplexed
SRM assays for PTH that allow quantification of four fully-tryptic monitoring
peptides (that span the entire PTH sequence) and two semi-tryptic variant specific
peptides1,2. Using this approach, it is possible to monitor intact PTH and also the
degree of N-terminal fragmentation. In this study, the objective was to apply the
LC-MS/MS SRM assay in addition to two commercially available immunoassays to
a cohort of clinical samples and monitor intact and truncated PTH isoforms. In
addition the correlation between the three assay measurements was determined.
MethodsA single cohort of IRB approved clinical serum samples was distributed between
three laboratories. Mass Spectrometry and sample preparation were as previously
described1. Immunoassays (Beckman, Cobas) were run according to
manufacturer’s instructions. Samples were measured after refrigeration at all sites
A best fit algorithm was determined using log-transformed data. This optimized the
fit at low values. Data were plotted as un-transformed data points.
ResultsPeptides exhibited linear responses (R2 = 0.90–0.99) relative to recombinant
human PTH concentration. The limits of detection were 8 ng/L and limits of
quantification were of 16 to 32 ng/L depending on the peptide. Comparison of the
MSIA –SRM assay with the commercial ELSA assays demonstrated good
correlation.
FIGURE 2. MSIA (Mass Spectrometric Immunoassay)-SRM workflow for enrichment and quantification of low abundance proteins.
In order to develop a sensitive assay with sequence specificity for PTH, we coupled immuno-enrichment at the protein level with detection at the peptide level using SRM-MS. This approach allows rapid and automated enrichment with the selective detection and quantification of intact and variant forms of PTH. The active site of the PTH protein is from aa1-10. N-terminally truncated variants may confound immunoassays that do not distinguish intact from truncated forms of the protein.
FIGURE 2. Correlation between Beckman and Cobas immunoassays.
FIGURE 5. Correlation between Cobas immunoassay and MSIA-SRM assay.
Conclusion• The commercial immunoassays correlated well with each other.
• The MSIA-SRM assay correlated very well with both commercial
immunoassays.
References1. Lopez MF, Rezai T, Sarracino DA, Prakash A, Krastins B, Athanas M, Singh
RJ, Barnidge DR, Oran P, Borges C, Nelson RW. Selected Reaction
Monitoring-Mass Spectrometric Immunoassay Responsive to Parathyroid
Hormone and Related Variants. Clin. Chem. 2010 56:281-90.
2. Quantification of serum 1-84 parathyroid hormone in patients with
hyperparathyroidism by immunocapture in situ digestion liquid
chromatography-tandem mass spectrometry. Clin. Chem. 2010Feb;56(2):306-13. Epub 2009 Dec 10
TABLE 1. Correlation Matrix
Affinity Extraction
Proprietary micro-columns
Sample ProcessingAutomated target
protein capture, rinse, and elution
Mass Spec Analysis
Ability to detect and quantify different protein
isoforms
MSIA Pipette Tip Versette ALH
• MSIA achieves higher sensitivity than any other methods tested
- Easily accommodate large sample volume range (10 µL-10 mL )
- Forced contact of analyte with AB in the tip increases binding efficiency
- Repeated binding cycles (up and down in pipette tip) add capacity and
sensitivity
• Scalable concentrations of antibody and multiplexing antibodies on tips
• Can use commercially available, FDA validated antibodies
• More economic and much more sensitive than magnetic or other beads
PTH Variant MapResidue Number
N 20 40 60 80
Variant orFragment
[1-84][7-84][34-84][37-84][38-84][45-84]
[28-84][48-84][34-77][37-77][38-77]
[1-13][7-13][14-20][28-44][34-44][73-80]
SVSEIQLMHNLGK
LMHNLGKHLNSMER LQDVHNFVALGAPLAPR
FVALGAPLAPRADVNVLTK
Variant specific
FIGURE 3. Previous top down analyses of PTH in clinical samples revealed a large degree of heterogeneity and truncated variants, principally at the N terminus (1). In order to quantify intact and truncated forms, we chose 4 fully tryptic and 3 semi-tryptic (variant specific) peptides for the multiplexed SRM assay.
PTH
FIGURE 4. Ten point calibration curve for peptide SVSEIQLMHNLGK. The values ranged from 0-2000pg/mL. CV’s of triplicate points ranged from 1-19%. The R2 was 0.978. Calibration curves for peptides HLNSMER, ADVNVLTK and LQDVHNFVALGAPLAPR demonstrated similar linearity and precision.
FIGURE 2. The large dynamic range of proteins in blood presents a technical hurdle for the development of low-abundance analytes. The reference range for parathyroid hormone (PTH) is 1 pmol/L or 10-60pg/mL, making it one of the lowest abundance clinically important analytes.
FIGURE 5. Correlation between MSIA-SRM and Beckman immunoassay.
Cobas Beckman SVS HLN LQD ADV VAL FVALCobas 1.00 0.98 0.92 0.95 0.97 0.89 0.76 0.96
Beckman 0.98 1.00 0.96 0.98 0.99 0.86 0.71 0.95SVS 0.92 0.96 1.00 0.97 0.96 0.78 0.65 0.87HLN 0.95 0.98 0.97 1.00 0.97 0.81 0.68 0.90LQD 0.97 0.99 0.96 0.97 1.00 0.87 0.72 0.96ADV 0.89 0.86 0.78 0.81 0.87 1.00 0.70 0.90VAL 0.76 0.71 0.65 0.68 0.72 0.70 1.00 0.80FVAL 0.96 0.95 0.87 0.90 0.96 0.90 0.80 1.00

Thermo Fisher Scientific, San Jose, CA USA is ISO Certified.
PN63591_E 06/12S
Africa-Other +27 11 570 1840Australia +61 3 9757 4300Austria +43 1 333 50 34 0Belgium +32 53 73 42 41Canada +1 800 530 8447China +86 10 8419 3588Denmark +45 70 23 62 60
Europe-Other +43 1 333 50 34 0Finland/Norway/Sweden +46 8 556 468 00France +33 1 60 92 48 00Germany +49 6103 408 1014India +91 22 6742 9434Italy +39 02 950 591
Japan +81 45 453 9100Latin America +1 561 688 8700Middle East +43 1 333 50 34 0Netherlands +31 76 579 55 55New Zealand +64 9 980 6700Russia/CIS +43 1 333 50 34 0South Africa +27 11 570 1840
Spain +34 914 845 965Switzerland +41 61 716 77 00UK +44 1442 233555USA +1 800 532 4752
www.thermoscientific.com©2012 Thermo Fisher Scientific Inc. All rights reserved. ISO is a trademark of the International Standards Organization. All other trademarks are the property of Thermo Fisher Scientific Inc. and its subsidiaries. This information is presented as an example of the capabilities of Thermo Fisher Scientific Inc. products. It is not intended to encourage use of these products in any manners that might infringe the intellectual property rights of others. Specifications, terms and pricing are subject to change. Not all products are available in all countries. Please consult your local sales representative for details.


![4. PARATHYROID HORMONE.ppt [Read-Only]ocw.usu.ac.id/.../mk_end_slide_parathyroid_hormone.pdf · Parathyroid Hormone (PTH) Peptide hormone secreted by parathyroid glands, which are](https://img.pdfslide.net/doc/110x75/5fd9a3fa6d8805309b4bc740/4-parathyroid-read-onlyocwusuacidmkendslideparathyroidhormonepdf.jpg)