Embed Size (px)
Citation preview

Munich Personal RePEc Archive
Liveable city froman economic
perspective
Antonescu, Daniela
Institute of National Economy
7 April 2017
Online at https://mpra.ub.uni-muenchen.de/79144/
MPRA Paper No. 79144, posted 18 May 2017 04:42 UTC

1
Liveable city from an economic perspective
Author: Antonescu Daniela
Institute of National Economy, Romanian Academy (ROMANIA)

2
Abstract
The purpose of this article is to provide an overall image of what a liveable
city is. Starting from the theoretical aspects presented in the first part of this
work, and ending up with the practical ones, an attempt was made to
provide an answer to the following question: why are some cities more
attractive than others and what criteria should be fulfilled in order for the
life of a city’s inhabitants to be considered qualitative, and that city to be
deemed liveable. For a city to be liveable, it is bound to fulfil several
conditions, the most important ones being related to economy, environment,
infrastructure (healthcare, transport, education etc.), and also to aesthetics &
culture, ambient, ways of spending leisure time, safety of life, vicinity etc.
Albeit there is no generally accepted concept of Liveable City, a series of
methodologies recognised globally provide an assessment of this very
aspect (many of them sharing the same elements). In this article, by means
of the Liveability indices, cities are classified into several categories. The
cities listed in one category are shown to be present in almost all the other
categories, on positions that are similar. Hence, the city of Tokyo can be
found in five out of six categories proposed by the international
organisations which elaborated such methodologies, along with the City of
London (in four out of six categories) and with New York City (in four out
of six categories) etc. In Romania, the cities that might be classified as
liveable are: Bucharest, Cluj-Napoca, Timisoara, Brasov, Constanța and
Sibiu. The Capital City of Romania, i.e. Bucharest, is ranked the 28th
in a
List of European Capital Cities, being outranked by Cities like Sofia,
Lisbon or Budapest, which means it still does not fulfil many of the criteria
for a liveable city.
Keywords: liveability, sustainable development, liveable city, urban
economy

3
1. Introduction The process of world urbanisation is obvious, according to international reports (prepared
by the World Bank, by the European Commission etc.) which show a significant increase,
in the last three decades, of the urban population: from 42.93% in 1990, to 53.86% in 20151
(3.943 billion inhabitants). According to specialists, the growth trend will continue, so that
by 2030, approximately 70% of the world population will live in cities.
Romania is also part of this active urbanisation phenomenon, the urban population reaching
approximately 54.56% in 2015 (10.82 million inhabitants), yet with a much less aggressive
growth trend registered in the reference period (in 1990, the percentage was 53.22%).
Despite this trend, for the capital-city – Bucharest, the trend are to diminishing the total
resident population (-2.38%), for the period 2012-2016, from 2.158 millions inhabitants to
2.107 millions.
In the European Union, this percentage exceeds the global value, reaching (in 2015) the
value of 74.8% (381.23 million inhabitants) from the total population, the growth trend
being obvious in comparison with 1990, when the percentage was 70.7%.
This growth trend of the urban population, and particularly from large cities, represents a
phenomenon that mankind has undergone for some time, and which entails a particular
level as regards the quality of life and the individual well-being.
At the same time, the acute urbanisation phenomenon has also given rise to the enhanced
role that cities play from an economic perspective, as they are considered actual economic
growth engines, which contribute to an increased mobility of manpower and to (financial,
technological, innovative and alike) capital. It is well-known that cities hold over 80% of
the Global Gross Domestic product (GDP) (McKinsey Global Institute).
Practically, in a globalised world, cities become economic competitors, joining the
increased competitive struggle, aiming at boosting their attractiveness to inhabitants and
companies, no matter the means. But the attractiveness of cities is closely related to the
concept of “liveability”, which thus becomes a fundamental characteristic of the worldwide competitive struggle to attract resources of any kind, as this is known to contribute to the
local economic growth, economic resilience, social & cultural innovation, improved
standard of living. Moreover, competition between cities is regarded as a strategic
competition between nations, turning cities into the epicentre of economic, social, cultural
advantage etc.
For this reason, an increasing growth has been ascertained in recent years as regards the
interest for the liveability of cities, both from the part of the academic environment, and
from that of the policy-makers, which on the one hand, has determined the promotion of
certain methodologies of assessment of the liveability level, and on the other hand, the
launch of some proper urban policies, meant to contribute to the growth of this significant
quality of present modern cities.
The methodologies launched at international level are based on the elaboration of certain
indices aiming at assessing the relative position that cities occupy, function of the obtained
values. The indices are built on the basis of certain indicators which measure the multi-
dimensional aspects of human well-being, namely: personal mobility, security,
environment, urban aesthetics, good governance, cultural actions etc. Further on, there is a
presentation of the means of assessment of a city’s liveability level, along with the results
obtained subsequent to the conduct of certain international surveys and research activities.
2. Defining “liveability” – related literature There is no generally accepted form/formula for the concept of liveability, yet it has several
qualitative and quantitative facets. This concept depends on two other concepts, which
render its definition possible: quality of life and well-being.
1 http://data.worldbank.org/indicator/SP.URB.TOTL.IN.ZS

4
Frequently used in the ‘80s and ‘90s in the USA, this concept was initially approached in
close connection with the urban community that it would define / characterise, on the
background of the issues generated by city extension and growing dependency upon
vehicles (cars). The surveys and analyses conducted with respect to the concept of
liveability attempted to identify the elements underlying competitiveness at city level,
trying to inform the authorities with regard to the living conditions, so as to attract human
and financial / entrepreneurial capital. In his study entitled The Cities and the Creative
Class2, Richard Florida, a renowned economist, supported the idea that cities need a
“people climate”, namely an environment where the city inhabitants can feel comfortable
and where they can fulfil their life aspirations.
From a social perspective, the concept of liveability has tried to bring equity in the
limelight, while from an economic viewpoint, its purpose was to contribute to the making
of beneficial policies for all inhabitants, and particularly for those who are underprivileged.
The use of the concept of liveability has called for the recognition of other concepts, such as
the concepts of sustainable-city, smart-city, global-city, perfect-city, fastest-city, which are
strongly interdependent (but which cannot be entirely overlapped). More often than not, the
concept of liveability is considered to represent one of the fundamental elements of
sustainability (along with economic performances, environmental protection and good
governance).
In the period after 1990, the interventions (discussions) with respect to the liveability of
cities have become more and more frequent, because the inhabitants of urban areas have
become aware of the fact that, besides the advantages related to economy, infrastructure
and alike, a city should first and foremost be a place for them to live, to raise their children
and to age in a pleasant way. As a matter of fact, most of the definitions of this concept
focus on a certain standard for the quality of life, a standard aimed at by all cities and by
their inhabitants.
In order to provide a definition for this concept, several approaches are necessary, but the
majority of those who analyse it agree with the idea that, for a city to be liveable, it does
not depend very much on the statute of the country to which it belongs (developed or less
developed country), but this characteristic rather refers to the attractiveness of the city,
given by social activities, economic solidity, entrepreneurial environment etc. It becomes
obvious that the concept of city liveability is difficult to measure, despite the
acknowledgment of certain joint elements: cost of living, quality of life, happiness, well-
being etc. From this perspective, the concept of liveable city should fulfil three main
functions, which finally provide the prosperity of the entire city (Figure 1):
1. Economic: high productive rate, low costs, significant income and economic
results.
2. Material & functional (proper urban infrastructure and services; clean
environment).
3. Technical & apolitical (good governance, experts, specialists, town-planners,
economists, architects etc. available for coming up with development strategies in
line with the global trends and with the local requirements).
2 Florida R. (2002), The Cities and Creative Class,
http://creativeclass.com/rfcgdb/articles/4%20Cities%20and%20the%20Creative%20Class.

5
Figure 1: Urban prosperity
Source: https://www.siemens.com/innovation/en/home/pictures-of-the-
future/infrastructure-and-finance/livable-and-sustainable-cities-facts-and-forecasts-
economic-imbalances-are-growing-in-cities-worldwide.html
3. Means of assessing the liveability index. International rankings For the purpose of assessing an economic or social phenomenon of high complexity, an
index is usually elaborated so as to provide a synthetic expression of such phenomenon, on
the basis of several indicators.
As regards the measurement of the liveability level, the literature specialised in this field
provides a series of Indices, calculated by various international bodies on the basis of
several well-known methodologies, indices which are used at specific moments (annually,
as a rule) in to order to perform the liveability rankings of cities around the world, based on
a rigorous selection and on certain official statistical data. A synthetic presentation of such
indices is provided below:
1 The Global Power City Index3, elaborated by Mori Memorial Foundation, known as the
Mori Index, provides the ranking of cities at global scale, considering their “magnetism”,
which means their ability to attract creative individuals and companies from every
continent, and to use their assets in domains such as economic & social security and
environmental protection. The Mori Index provides a general assessment of the power held
by 40 leading cities worldwide, based on six main functions: economic, research &
development, cultural interaction, environment and accessibility, considered to represent
the driving force of cities. The performed analyses envisages the global players which lead
the urban activities carried out in their cities, namely the Manager, the Researcher, the
Artist, the Visitor and the Resident (Table 1).
Table 1: Economic and Research Function- the Main Indicators Function Grup de indicatori Indicators
“Market Size“ Nominal GDP
GDP per Capita
GDP Growth Rate
Level of Economic Freedom
Total Market Value of Listed Shares on Stock
Exchanges
World’s Top 300 Companies
“Market Attractiveness”
“Economic Vitality”
“Human Capital”
“Business
Environment”
3 http://mori-m-foundation.or.jp/english/ius2/gpci2/index.shtml

6
ECONOMIC Total Employment
Number of Employees in Service Industry for
Business Enterp rises
Wage Level
Ease of Securing Human Resources
Office Space per Desk
Corporate Tax Rate
Level of Political, Economic and Business Risk
“Ease of Doing Business”
RESEARCH
AND
DEVELOPM
ENT
“Academic Resources” Number of Researchers
World’s Top 200 Universities
Academic Performance in Mathematics and Science
Readiness for Accepting Researchers
Research and Development Expenditure
Number of Registered Industrial Property Rights
(Patents)
Number of Winners of Highly-Reputed Prizes
(Science and Technology-Related Fields)
Interaction Opportunities between Researchers
“Research Background”
“Research Achievement”
Source: http://mori-m-foundation.or.jp/pdf/GPCI2016_en.pdf
Given the Mori Index values, developed on the basis of economic and of research &
development indicators, the global ranking of cities (the top 10 cities of the world) is given
below (Table 2).
Table 2: Economic and Research Function- Index Ranking, 2016 year
The
place
Economy Index Value The
place
Research &
development
Index Value
1 Tokyo 311.0 1 New York 215.8
2 London 307.5 2 Tokyo 162.9
3 New York 298.7 3 London 162.4
4 Beijing 297.5 4 Los Angeles 145.7
5 Hong Kong 278.1 5 Seoul 122.7
6 Singapore 261.3 6 Boston 118.4
7 Shanghai 261.1 7 Singapore 112.0
8 Zurich 254.6 8 Paris 111.9
9 Seoul 239.8 9 San Francisco 111.0
10 Sydney 230.4 10 Chicago 99.6
Source: http://mori-m-foundation.or.jp/pdf/GPCI2016_en.pdf
2 The Global Cities Index is proposed and calculated by Foreign Policy Magazine, The
Chicago Council on Global Affairs, A.T. Kearney (2010), being known as the Foreign
Policy Index.
This index assesses the current performance of cities based on 13 indicators from the
following domains: economic (25%), individual well-being (25%), governance (25%) and
innovation (25%), providing a follow-up of the evolution of 125 cities worldwide. From an
economic perspective, the indicators subject to analysis are the GDP and the long-term
investments. They are supplemented by the following innovative indicators: patent, private
investments and business incubators. This index is calculated in two ways: the Global
Cities Index and the Global Cities Outlook, whose values and rankings are presented below
(Table 3).

7
Table 3: Global Cities Index and Global Cities Outlook, 2016
Locul
ocupat
City Global
Cities
Index
Locul
ocupat
City Global Cities
Outlook
1 London 52.7 1 San Francisco 70.6
2 New York 62.,5 2 New York 70.4
3 Paris 54.5 3 Boston 67.8
4 Tokyo 46.7 4 London 67.1
5 Hong Kong 44.2 5 Huston 61.0
6 Los Angeles 38.2 6 Atlanta 61.0
7 Chicago 38.0 7 Stockholm 60.6
8 Singapore 37.9 8 Amsterdam 60.4
9 Bejing 36.0 9 Munich 60.1
10 Washington DC 34.7 10 Zurich 59.4
Source:
https://www.atkearney.com/documents/10192/8178456/Global+Cities+2016.pdf/8139cd44-
c760-4a93-ad7d-11c5d347451a
An important position in the above mentioned ranking is held by the Global Elite, namely
the cities holding the highest ranking in both classifications (i.e. the Global Cities Index and
the Global Cities Outlook). Usually, these cities have an average population of 8.8 million
inhabitants and a total GDP of USD 7.3 trillion.
Moreover, in the aforementioned reports, two other categories of cities are mentioned,
namely the Perfect Cities and the Fastest Cities. An example of perfect city is Genoa, while
Sydney, Melbourne and Brussels are examples of fastest cities.
3 The Global Cities Index, proposed by Frank Knight4 (Citi Private Bank), known as the
Knight Frank Index. In his assessment report, Knight proposes an approach mainly focused
on economic aspects and on the human perception of the degree of liveability (the so-called
people-centric approach). In other words, the driving force of urban development consists
of finance, aerospace industry, consumer and / or processed goods, and the most important
asset of all, educated and creative manpower. Consequently, the real estate activities
become more and more attractive against the background of building an environment which
attracts and preserves its inhabitants.
4 The Global City Competitiveness Index, proposed by Economist Intelligence Unit (EIU)
and by Citi-Group, known as the EIU-Competitiveness Index.
In the first stage of its elaboration, this index envisaged the geographical / spatial
characteristics of cities, grouped into six fields (25% of the Index), as well as the specific
characteristics, grouped into five major domains: stability, health, culture, environment,
education and infrastructure (75% of the Index).
Afterwards, other domains were also included, such as: shape of cities (expansion, extent,
green space size), geographical location of cities (natural characteristics, isolation or
connectivity), culture-related aspects and pollution level. Such space features are assessed
in relation to 70 cities, by means of the Liveability Index, based on the following main
selection criteria: population size, geographical distribution, and also the fact that all
residents benefit from the city’s natural resources, but suffer from air pollution. The top 10
city ranking performed on a global scale, elaborated on the basis of the Liveability Index
value, is presented in Table 4.
4 Frank, K. (2011), The Wealth Report: A Global Perspective on Prime Property and
Wealth [online] http://www.knightfrank.com/wealthreport/2011/images/brochure.pdf.

8
Table 4: Best cities ranking (EIU), at global level, in 2016
Locul City Spatial
Adjusted
Livability
Index
RANK -
Spatial
Adjusted
Livability
Index
EIU Livability
index (from
city sample
used)
Change in
rank
1 Hong Kong 87.8 1 10 9
2 Amsterdam 87.4 2 8 6
3 Osaka 87.4 3 3 0
4 Paris 87.1 4 5 1
5 Sydney 86.0 5 2 -3
6 Stockholm 86.0 6 4 -2
7 Berlin 85.9 7 7 0
8 Toronto 85.4 8 1 -7
9 Munich 85.1 9 9 0
10 Tokyo 84.4 10 6 -4
Source: A special report from the Economist Intelligence Unit Global Cities Index and
Global Cities Outlook, 2016
5 The Quality of Living Index, proposed by MERCER, known as The MERCER Index.
The Mercer Index is calculated on the basis of 39 factors grouped into ten categories, which
contain all the key elements that can be used to describe the quality of life with respect to
450 cities. The calculation methodology for the MERCER index is based on the following
elements:
to determine the tangible values of qualitative perception with regard to the
assessed objectives;
to select the factors which represent the criteria considered to be the most relevant;
to establish the differences in terms of the quality of life among the cities subject
to analysis;
to calculate the Index on a City-by-City basis (one-to-one comparison), in order to
provide a synthesis of the differences between two such cities;
to determine the Quality of Life Index for cities.
The MERCER Index is based on the following categories of indicators: consumer goods,
economic environment, housing, medical and health considerations, natural environment,
political and social environment, public services and transport, recreation, schools and
education and socio-cultural environment.
In 2016, the city ranking based on the MERCER Index values is as follows: 1 - Vienna
(Austria), 2 – Zurich (Switzerland), 3 – Auckland (New Zealand), 4 – Munich (Germany),
5 – Vancouver (Canada), 6 – Dusseldorf (Germany), 7 – Frankfurt (Germany), 8 – Geneva
(Switzerland), 9 – Copenhagen (Denmark) and 10 – Basel (Switzerland).
4. Bucharest - the most liveable city in Romania The Capital City Romania, i.e. Bucharest, is currently considered as the most liveable city
in the country, followed by Cluj-Napoca,Timișoara, Brașov, Constanța and Sibiu.
Despite the fact that Bucharest is not listed in any of the above-mentioned rankings, it is
one of the most attractive cities in Romania, due to its location in the Bucharest – Ilfov
region, one of the most important EU-28 regions. In this region, the GDP value per
inhabitant amounted to EUR 35,500 in 2014, being ranked the 40th out of the 276 EU
regions (in the first 15%) (Figure 2).

9
25200 31800
28300
30700
34300
33400
33900
35600
2007
2008
2009
2010
2011
2012
2013
2014
Evolution of GDP per capita (PPS) in Bucharest - Ilfov region, in period 2008-2014
Bucharest-Ilfov region
Figure 2: Evolution of GDP per capita (PPS) in Bucharest Ilfov region, in period 2007-
2014
Source: Author computations
Meanwhile, evolution permanent resident population decreased by about -2.38% in 2016
comparatively 2012, and for usual resident population with -2.25% for the same period
(Figure 3). This trend is an obviously process of urbanization of the capital city.
2158758 2148098 21340302110878 2107399
1886866 1875389 1865563 1853402 1844312
1650000
1700000
1750000
1800000
1850000
1900000
1950000
2000000
2050000
2100000
2150000
2200000
2012 2013 2014 2015 2016
Demographic evolution in Bucharest Municipality, 2012-2016 (no.)
Permanent resident population Usual resident population
Figure 3: Demographic evolution in Bucharest Municipality, 2012-2016 (no.) Source: http://statistici.insse.ro/shop/index.jsp?page=tempo3&lang=ro&ind=POP105A
If the GDP value per inhabitant provides a certain comfort for Bucharest inhabitants, from
an economic perspective, in terms of the quality of life, there are certain shortcomings,
which need time to be remedied and which affect the liveability level of this city.
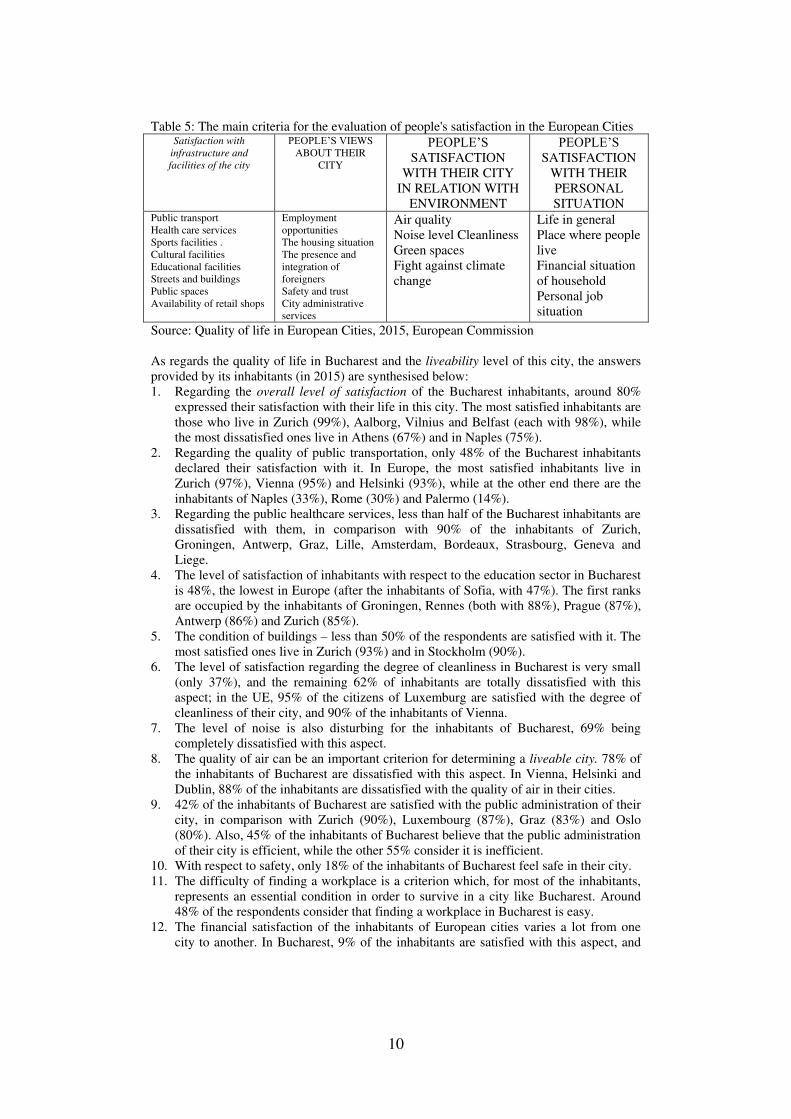
In order to provide an assessment of how liveable Bucharest is, below are given the results
of a Report elaborated by the European Commission in 2015 under the title Quality of life
in European Cities, and which concerns 83 EU cities, the criteria underlying such analysis
being given in Table 5.
10
Table 5: The main criteria for the evaluation of people's satisfaction in the European Cities Satisfaction with
infrastructure and
facilities of the city
PEOPLE’S VIEWS
ABOUT THEIR
CITY
PEOPLE’S SATISFACTION
WITH THEIR CITY
IN RELATION WITH
ENVIRONMENT
PEOPLE’S SATISFACTION
WITH THEIR
PERSONAL
SITUATION Public transport
Health care services
Sports facilities .
Cultural facilities
Educational facilities
Streets and buildings
Public spaces
Availability of retail shops
Employment
opportunities
The housing situation
The presence and
integration of
foreigners
Safety and trust
City administrative
services
Air quality
Noise level Cleanliness
Green spaces
Fight against climate
change
Life in general
Place where people
live
Financial situation
of household
Personal job
situation
Source: Quality of life in European Cities, 2015, European Commission
As regards the quality of life in Bucharest and the liveability level of this city, the answers
provided by its inhabitants (in 2015) are synthesised below:
1. Regarding the overall level of satisfaction of the Bucharest inhabitants, around 80%
expressed their satisfaction with their life in this city. The most satisfied inhabitants are
those who live in Zurich (99%), Aalborg, Vilnius and Belfast (each with 98%), while
the most dissatisfied ones live in Athens (67%) and in Naples (75%).
2. Regarding the quality of public transportation, only 48% of the Bucharest inhabitants
declared their satisfaction with it. In Europe, the most satisfied inhabitants live in
Zurich (97%), Vienna (95%) and Helsinki (93%), while at the other end there are the
inhabitants of Naples (33%), Rome (30%) and Palermo (14%).
3. Regarding the public healthcare services, less than half of the Bucharest inhabitants are
dissatisfied with them, in comparison with 90% of the inhabitants of Zurich,
Groningen, Antwerp, Graz, Lille, Amsterdam, Bordeaux, Strasbourg, Geneva and
Liege.
4. The level of satisfaction of inhabitants with respect to the education sector in Bucharest
is 48%, the lowest in Europe (after the inhabitants of Sofia, with 47%). The first ranks
are occupied by the inhabitants of Groningen, Rennes (both with 88%), Prague (87%),
Antwerp (86%) and Zurich (85%).
5. The condition of buildings – less than 50% of the respondents are satisfied with it. The
most satisfied ones live in Zurich (93%) and in Stockholm (90%).
6. The level of satisfaction regarding the degree of cleanliness in Bucharest is very small
(only 37%), and the remaining 62% of inhabitants are totally dissatisfied with this
aspect; in the UE, 95% of the citizens of Luxemburg are satisfied with the degree of
cleanliness of their city, and 90% of the inhabitants of Vienna.
7. The level of noise is also disturbing for the inhabitants of Bucharest, 69% being
completely dissatisfied with this aspect.
8. The quality of air can be an important criterion for determining a liveable city. 78% of
the inhabitants of Bucharest are dissatisfied with this aspect. In Vienna, Helsinki and
Dublin, 88% of the inhabitants are dissatisfied with the quality of air in their cities.
9. 42% of the inhabitants of Bucharest are satisfied with the public administration of their
city, in comparison with Zurich (90%), Luxembourg (87%), Graz (83%) and Oslo
(80%). Also, 45% of the inhabitants of Bucharest believe that the public administration
of their city is efficient, while the other 55% consider it is inefficient.
10. With respect to safety, only 18% of the inhabitants of Bucharest feel safe in their city.
11. The difficulty of finding a workplace is a criterion which, for most of the inhabitants,
represents an essential condition in order to survive in a city like Bucharest. Around
48% of the respondents consider that finding a workplace in Bucharest is easy.
12. The financial satisfaction of the inhabitants of European cities varies a lot from one
city to another. In Bucharest, 9% of the inhabitants are satisfied with this aspect, and

11
approximately 55% are relatively satisfied. The level of financial satisfaction is
maximum in Zurich (92%) and minimum in Athens (33%).
Given the above-mentioned statistics, one can conclude that, despite the fact that the level
of development of Bucharest is superior to that of other cities in Romania, the degree of
satisfaction of the inhabitants of this city is relatively low. Even if the overall level of
satisfaction is 80% among its inhabitants, the other problems (low quality public healthcare
services, high degree of air pollution, infrastructure, education system which needs
improvement), endanger the liveability feature of this city, and intense efforts are necessary
in order to remedy such problems.
In terms of the overall perception dynamics, the level of satisfaction with respect to life in
Bucharest decreased in 2015, in comparison with 2013, from 83% to 80%, which shows a
negative trend as regards the quality of life in the Capital City of Romania.
5. Conclusions The purpose of this article is to provide an overall image of what liveable cities are. Starting
from the theoretical aspects presented in the first part of this work, and ending up with the
practical ones, an attempt was made to provide an answer to the following question: why
are some cities more attractive than others and what criteria should be fulfilled in order for
the life of a city’s inhabitants to be considered qualitative, and that city to be deemed
liveable. For a city to be liveable, it is bound to fulfil several conditions, the most important
ones being related to economy, environment, infrastructure (healthcare, transport, education
etc.), and also to aesthetics & culture. The economic aspects are not always revealing for
the liveability level, unless they are accompanied by positive effects on the overall quality
of life.
Albeit there is no generally accepted concept of Liveability Index, one can ascertain that the
cities ranked on the first positions worldwide are found in most methodologies identified in
this study. Hence, the city of Tokyo can be found in five out of six categories
(methodologies) proposed by international organisations, along with the City of London (in
four out of six categories) and with New York City (in four out of six categories) (Table 7).
Table 7: Global Cities Ranking regarding to different Livability Index, 2016 The
pla
ce
Economy
2016
Research &
development
2016
Global
Cities
Index
2016
Global
Cities
Outlook
2016
Spatial
Adjusted
Livability
Index
2016
EIU
Livability
index
1 Tokyo New York London San
Francisco
Hong
Kong
Toronto
2 London Tokyo New York New York Amsterda
m
Sydney
3 New York London Paris Boston Osaka Osaka
4 Beijing Los Angeles Tokyo London Paris Stockholm
5 Hong Kong Seoul Hong
Kong
Huston Sydney Paris
6 Singapore Boston Los
Angeles
Atlanta Stockhol
m
Tokyo
7 Shanghai Singapore Chicago Stockholm Berlin Berlin
8 Zurich Paris Singapore Amsterdam Toronto Amsterda
m
9 Seoul San
Francisco
Bejing Munich Munich Munich
10 Sydney Chicago Washingt
on DC
Zurich Tokyo Hong
Kong
Source: Author computations

12
In Romania, the cities that might be classified as liveable are: Bucharest, Cluj-Napoca,
Timișoara, Brașov, Constanța and Sibiu. The Capital City of Romania, i.e. Bucharest, is ranked the 28th in a List of European Capital Cities, being outranked by Cities like Sofia,
Lisbon or Budapest, which means it still does not fulfil many of the criteria for a liveable
city.

13
REFERENCES
[1] Alberti, M. (2000), Urban form and ecosystem dynamics: empirical evidence and
practical implications. William K, Burton E, & Jenks, M. (eds.). Achieving sustainable
urban form. London: E. & F.N. Spon.
[2] Berta, N., (2008), Le concept d’externalit´e de l’´economie externe` a”l’interaction
directe”: quelques probl`emes de d´efinition. Documents de travail du Centre d’Economie
de la Sorbonne, 2008. ISSN: 1955-611X. 2008.
[3] Bohm, P. (1987), External Economies”, in The New Palgrave: A Dictionary of
Economics, London and New York, Macmillan and Stockton, 261-63.
[4] Buchanan, J. M. (1966), “Joint Supply, Externality and Optimality”, Economica, Nov.,
vol. 33, 404-15.
[5] Buchanan, J. M.; Stubblebine, W. C. (1962), “Externality”, Economica, vol. 29, 371-
84.
[6] Florida, R. (2002), The Cities and Creative Class,
http://creativeclass.com/rfcgdb/articles/4%20Cities%20and%20the%20Creative%20Class.p
df.
[7] Frank, K. (2011), The Wealth Report: A Global Perspective on Prime Property and
Wealth, http://www.knightfrank.com/wealthreport/2011/images/brochure.pdf
[8] Glaeser, E. (2011), Triumph of the City: How our Greatest Invention Makes US
Richer, Smarter.
[9] Girardet, H. (2004), Cities people planet: liveable cities for a sustainable world. West
Sussex, UK: John Wiley & Sons Ltd.
[10] Jacobs, J. (1969), The economy of city, Random House, New York.
[11] Kearney, A.T. (2010), The Urban Elite: The A.T. Kearney Global Cities Index 2010
[online], http://www.atkearney.com/images/global/pdf/Urban_Elite-GCI_2010.pdf.
[12] Ley, A.; Newton, P. (2010), Creating and sustaining liveable cities’, in
Kallidaikurichi, S.
[13] Luque-Martinez, T.,Munoz-Leiva, F. (2005) City benchmarking: a methodological
proposal referring specifically to Granada’ Cities, Vol. 22, No. 6, pp.411–423.
[14] Lyndhurst, B. (2004), Liveability & Sustainable Development: Bad Habits & Hard
Choices, July, Final Report for the UK Office of the Deputy Prime Minister.
[15] Nijkamp, P., Verhoef, E., Externalities in the Urban Economy,
https://papers.tinbergen.nl/03078.pdf.
[16] Remy J., (2015), L'espace, un objet central de la sociologie, Toulouse, Erès, coll. «
érès poche - Sociétés urbaines et rurales », 2015, 183 p., préface de Maurice Blanc, ISBN:
978-2-7492-4899-8.

14
[17] Yuen, B. (Eds.): Developing Living Cities: From Analysis to Action, World Scientific,
Singapore.
[18] AARP Public Policy Institute, Livable Communities: An Evaluation Guide.
[19] https://www.cardiffpartnership.co.uk/wp-content/uploads/ITEM-4-APP-A-Draft-
Liveable-City-Report-2017.pdf
[20] Quality of life in European Cities, 2015, European Commission.
[21] https://www.imercer.com/content/mobility/rankings/d147852/index.html
[22] A special Report from the Economist Intelligence Unit - Global Cities Index and
Global Cities Outlook, 2016.
[23] http://statistici.insse.ro/shop/