Embed Size (px)
Citation preview

Prepared for:
Consultants:
Reference:
Musculoskeletal Disorder Strategy 2017 – 2022 2019 short-term outcome evaluation Report
October, 2019
Kristy Charlton, Claudia Swientek
David Donnelly, Matthew Johnson, Annaleise Lee
J2843
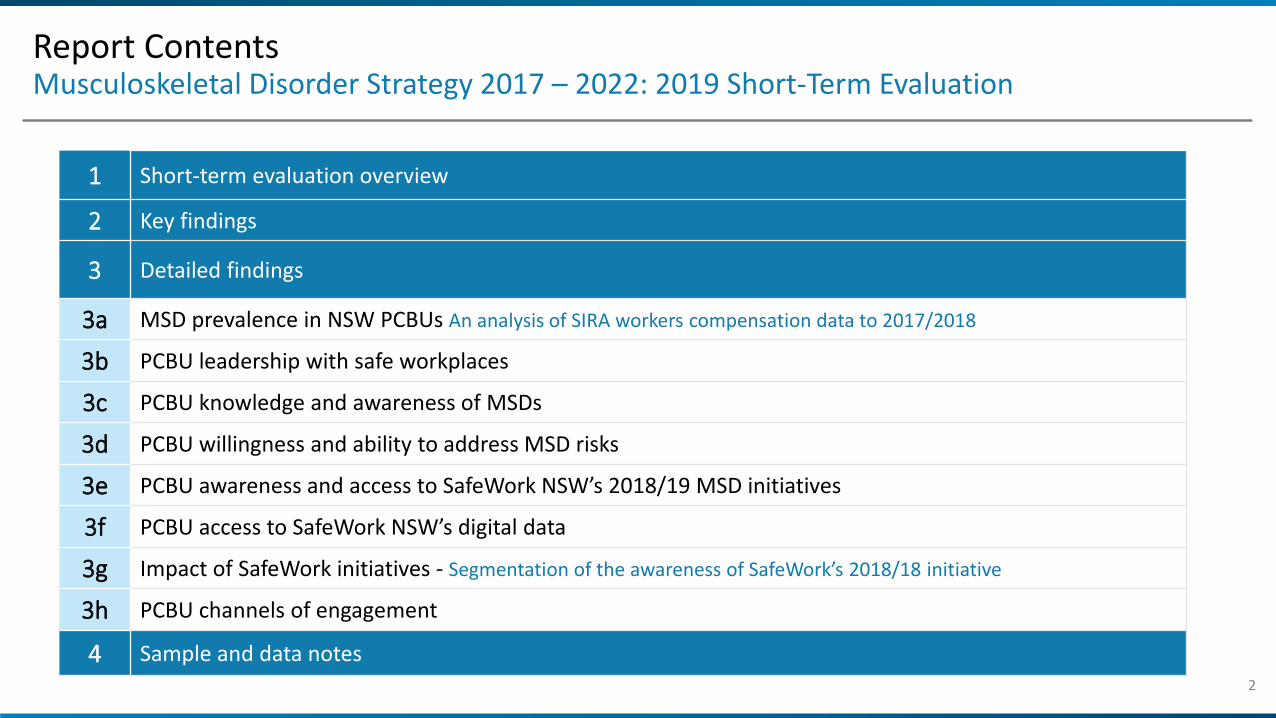
Report ContentsMusculoskeletal Disorder Strategy 2017 – 2022: 2019 Short-Term Evaluation
2
1 Short-term evaluation overview
2 Key findings
3 Detailed findings
3a MSD prevalence in NSW PCBUs An analysis of SIRA workers compensation data to 2017/2018
3b PCBU leadership with safe workplaces
3c PCBU knowledge and awareness of MSDs
3d PCBU willingness and ability to address MSD risks
3e PCBU awareness and access to SafeWork NSW’s 2018/19 MSD initiatives
3f PCBU access to SafeWork NSW’s digital data
3g Impact of SafeWork initiatives - Segmentation of the awareness of SafeWork’s 2018/18 initiative
3h PCBU channels of engagement
4 Sample and data notes

www.instinctandreason.com
Short-term evaluation overview
Background, methodology, objectives
1
Background Context for the 2019 short-term evaluation
4
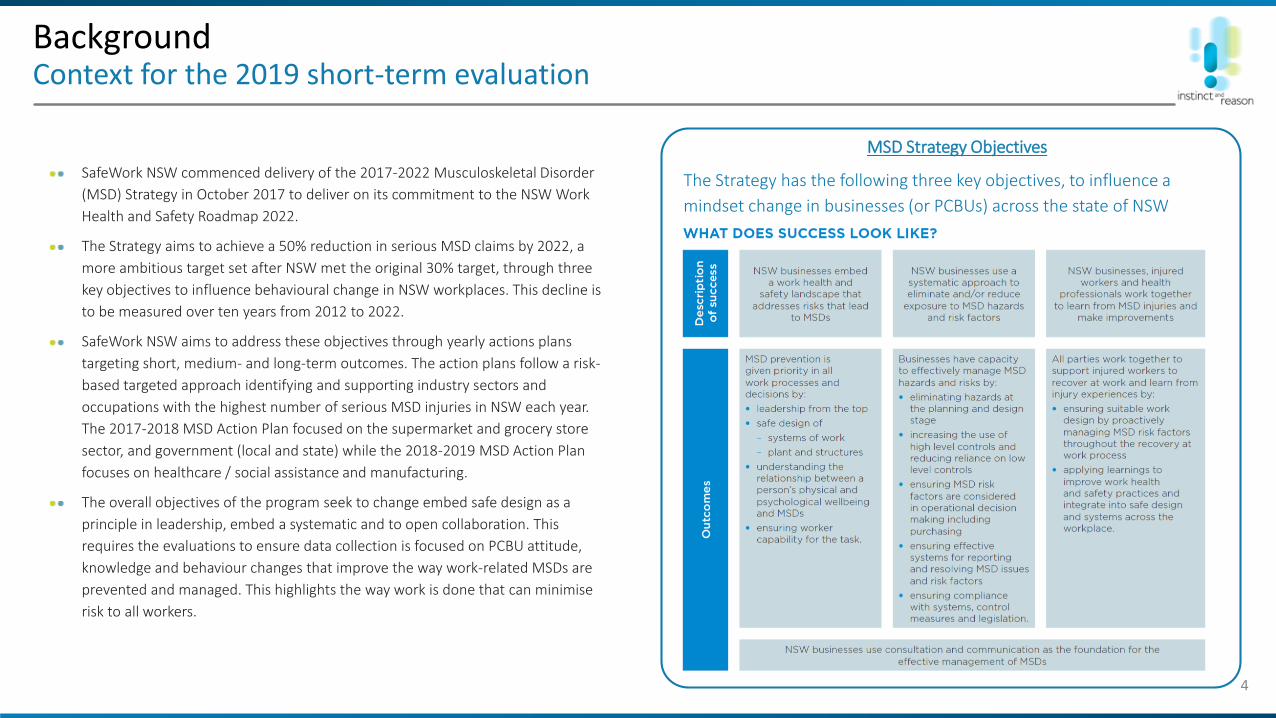
SafeWork NSW commenced delivery of the 2017-2022 Musculoskeletal Disorder
(MSD) Strategy in October 2017 to deliver on its commitment to the NSW Work
Health and Safety Roadmap 2022.
The Strategy aims to achieve a 50% reduction in serious MSD claims by 2022, a
more ambitious target set after NSW met the original 30% target, through three
key objectives to influence behavioural change in NSW workplaces. This decline is
to be measured over ten years from 2012 to 2022.
SafeWork NSW aims to address these objectives through yearly actions plans
targeting short, medium- and long-term outcomes. The action plans follow a risk-
based targeted approach identifying and supporting industry sectors and
occupations with the highest number of serious MSD injuries in NSW each year.
The 2017-2018 MSD Action Plan focused on the supermarket and grocery store
sector, and government (local and state) while the 2018-2019 MSD Action Plan
focuses on healthcare / social assistance and manufacturing.
The overall objectives of the program seek to change embed safe design as a
principle in leadership, embed a systematic and to open collaboration. This
requires the evaluations to ensure data collection is focused on PCBU attitude,
knowledge and behaviour changes that improve the way work-related MSDs are
prevented and managed. This highlights the way work is done that can minimise
risk to all workers.
MSD Strategy Objectives
The Strategy has the following three key objectives, to influence a
mindset change in businesses (or PCBUs) across the state of NSW
Background Context for the 2019 short-term evaluation
5
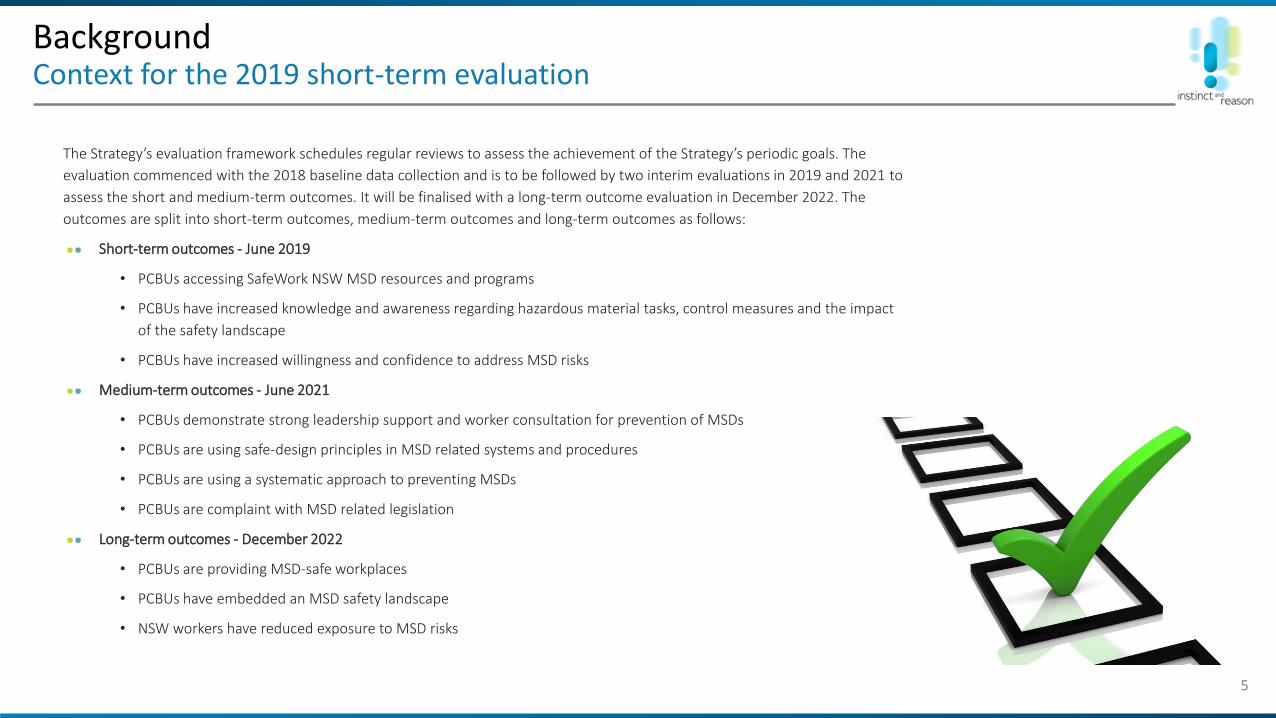
The Strategy’s evaluation framework schedules regular reviews to assess the achievement of the Strategy’s periodic goals. The
evaluation commenced with the 2018 baseline data collection and is to be followed by two interim evaluations in 2019 and 2021 to
assess the short and medium-term outcomes. It will be finalised with a long-term outcome evaluation in December 2022. The
outcomes are split into short-term outcomes, medium-term outcomes and long-term outcomes as follows:
Short-term outcomes - June 2019
• PCBUs accessing SafeWork NSW MSD resources and programs
• PCBUs have increased knowledge and awareness regarding hazardous material tasks, control measures and the impact
of the safety landscape
• PCBUs have increased willingness and confidence to address MSD risks
Medium-term outcomes - June 2021
• PCBUs demonstrate strong leadership support and worker consultation for prevention of MSDs
• PCBUs are using safe-design principles in MSD related systems and procedures
• PCBUs are using a systematic approach to preventing MSDs
• PCBUs are complaint with MSD related legislation
Long-term outcomes - December 2022
• PCBUs are providing MSD-safe workplaces
• PCBUs have embedded an MSD safety landscape
• NSW workers have reduced exposure to MSD risks

Background Context for the 2019 short-term evaluation (situation analysis)
6
The 2018 Baseline Evaluation – where did we stand and where does the evaluation need to go?
The 2018 Baseline Evaluation provides a starting point for the rest of the evaluation. Specifically:
Downward trend in the incidence rate and claims (to financial year 2016/17) could not be attributed to the Strategy -> largely because the there was a downward trend
before the implementation of the strategy in October 2017.
Development of Strategy was evidence-based and consultative, but further promotion was required to increase reach and the understanding of the need to change
behaviour.
Limited data on what initiatives were working as the Baseline showed 29% awareness of SWNSW MSD initiatives (59% used), with limited capacity to determine the
impact of initiatives. The 2019 Evaluation needed to understand potential reasons for this and any impact of higher awareness. It was understood that an engagement
plan being developed, with planned funding for an MSD awareness campaign.
A change in focus for the Evaluation to outcome focused results for SWNSW on PCBU attitude, knowledge and behaviours to improve risks; this is to move away from
segment (e.g. specific employee segments focus such as gender, age, body location) focus of the Baseline Evaluation.
Also, there needs to be an understanding on the physical injury as well as the impact of psychological risk to MSDs, as expressed by SafeWork NSW. The 2019 evaluation will
need to test the level of awareness and knowledge of psychological impacts on MSD-related claims among PCBUs, as well as the effectiveness of implementing initiatives.
The 2019 evaluation needs to create new baseline readings that measure progress on medium-term and long-term outcomes not currently available. The previous material in the 2018 baseline evaluation do not adequately cover PCBU leadership and consultation changes, safe-design changes, systematic approach changes and legislative changes. This be included with respect of existing baseline evaluation measurements that track key evaluation measures; such as awareness, knowledge and willingness to change. This is with the aim to ensure changes over the last 12 months have a greater chance of being attributed to the strategy.
Background The purpose and objectives of the 2019 short-term evaluation
7
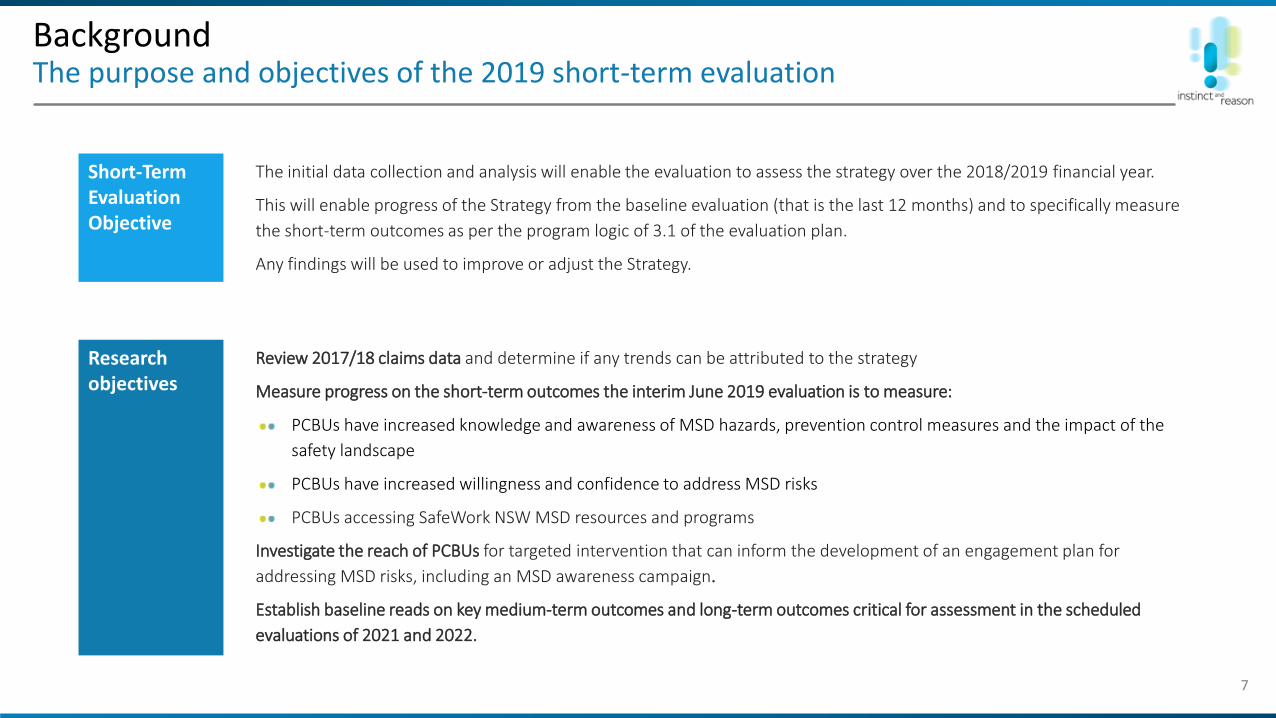
Research objectives
Review 2017/18 claims data and determine if any trends can be attributed to the strategy
Measure progress on the short-term outcomes the interim June 2019 evaluation is to measure:
PCBUs have increased knowledge and awareness of MSD hazards, prevention control measures and the impact of the
safety landscape
PCBUs have increased willingness and confidence to address MSD risks
PCBUs accessing SafeWork NSW MSD resources and programs
Investigate the reach of PCBUs for targeted intervention that can inform the development of an engagement plan for
addressing MSD risks, including an MSD awareness campaign.
Establish baseline reads on key medium-term outcomes and long-term outcomes critical for assessment in the scheduled
evaluations of 2021 and 2022.
Short-Term Evaluation Objective
The initial data collection and analysis will enable the evaluation to assess the strategy over the 2018/2019 financial year.
This will enable progress of the Strategy from the baseline evaluation (that is the last 12 months) and to specifically measure
the short-term outcomes as per the program logic of 3.1 of the evaluation plan.
Any findings will be used to improve or adjust the Strategy.
Methodology OverviewKey objectives per phase
8
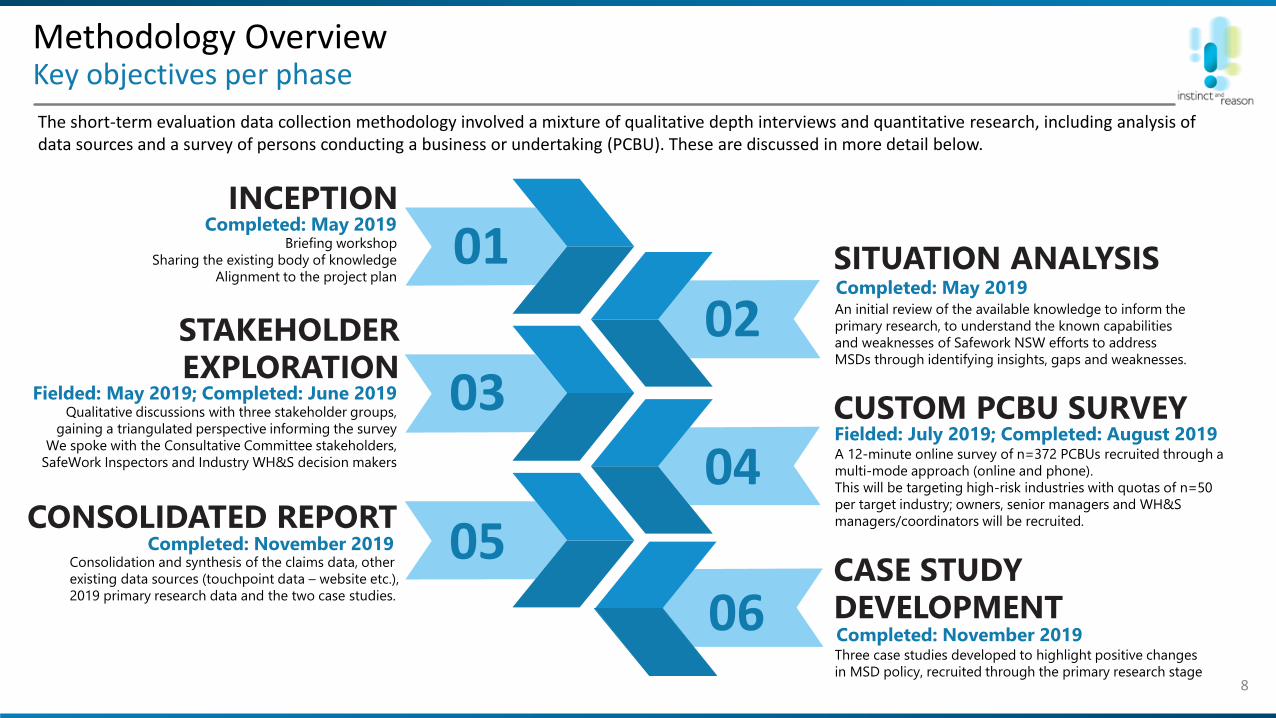
An initial review of the available knowledge to inform the
primary research, to understand the known capabilities
and weaknesses of Safework NSW efforts to address
MSDs through identifying insights, gaps and weaknesses.
01
03
05
04
02
INCEPTION
STAKEHOLDER EXPLORATION
SITUATION ANALYSIS
CUSTOM PCBU SURVEY
CASE STUDY DEVELOPMENT
A 12-minute online survey of n=372 PCBUs recruited through a
multi-mode approach (online and phone).
This will be targeting high-risk industries with quotas of n=50
per target industry; owners, senior managers and WH&S
managers/coordinators will be recruited.
Briefing workshop
Sharing the existing body of knowledge
Alignment to the project plan
Qualitative discussions with three stakeholder groups,
gaining a triangulated perspective informing the survey
We spoke with the Consultative Committee stakeholders,
SafeWork Inspectors and Industry WH&S decision makers
Three case studies developed to highlight positive changes
in MSD policy, recruited through the primary research stage
06
CONSOLIDATED REPORT
Consolidation and synthesis of the claims data, other
existing data sources (touchpoint data – website etc.),
2019 primary research data and the two case studies.
The short-term evaluation data collection methodology involved a mixture of qualitative depth interviews and quantitative research, including analysis of data sources and a survey of persons conducting a business or undertaking (PCBU). These are discussed in more detail below.
Completed: May 2019
Completed: May 2019
Fielded: May 2019; Completed: June 2019
Fielded: July 2019; Completed: August 2019
Completed: November 2019
Completed: November 2019
Methodology detail – Phase 2 situation analysisQuantitative data sources reviewed
9
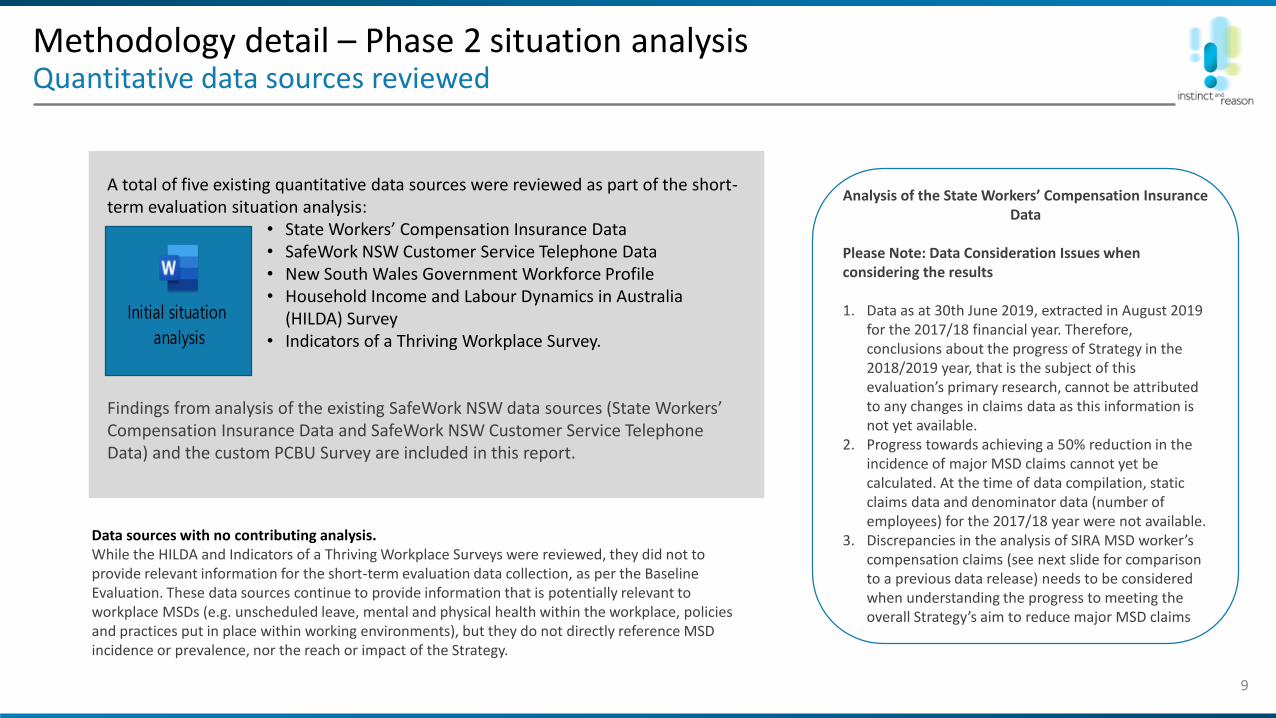
A total of five existing quantitative data sources were reviewed as part of the short-term evaluation situation analysis:
• State Workers’ Compensation Insurance Data• SafeWork NSW Customer Service Telephone Data• New South Wales Government Workforce Profile• Household Income and Labour Dynamics in Australia
(HILDA) Survey• Indicators of a Thriving Workplace Survey.
Findings from analysis of the existing SafeWork NSW data sources (State Workers’ Compensation Insurance Data and SafeWork NSW Customer Service Telephone Data) and the custom PCBU Survey are included in this report.
Data sources with no contributing analysis.While the HILDA and Indicators of a Thriving Workplace Surveys were reviewed, they did not to provide relevant information for the short-term evaluation data collection, as per the Baseline Evaluation. These data sources continue to provide information that is potentially relevant to workplace MSDs (e.g. unscheduled leave, mental and physical health within the workplace, policies and practices put in place within working environments), but they do not directly reference MSD incidence or prevalence, nor the reach or impact of the Strategy.
Initial situation
analysis
Analysis of the State Workers’ Compensation Insurance Data
Please Note: Data Consideration Issues when considering the results
1. Data as at 30th June 2019, extracted in August 2019 for the 2017/18 financial year. Therefore, conclusions about the progress of Strategy in the 2018/2019 year, that is the subject of this evaluation’s primary research, cannot be attributed to any changes in claims data as this information is not yet available.
2. Progress towards achieving a 50% reduction in the incidence of major MSD claims cannot yet be calculated. At the time of data compilation, static claims data and denominator data (number of employees) for the 2017/18 year were not available.
3. Discrepancies in the analysis of SIRA MSD worker’s compensation claims (see next slide for comparison to a previous data release) needs to be considered when understanding the progress to meeting the overall Strategy’s aim to reduce major MSD claims
Methodology detail – Phase 2 situation analysisKey considerations for the 2019 Evaluation
10
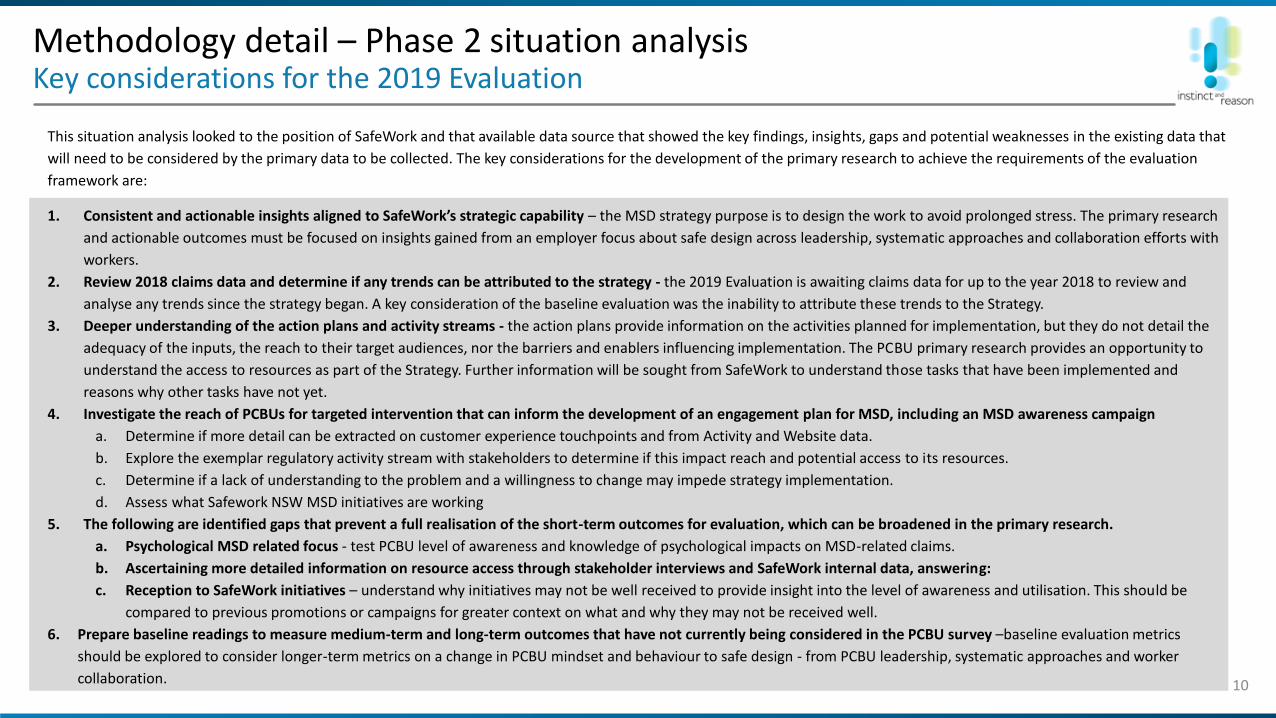
This situation analysis looked to the position of SafeWork and that available data source that showed the key findings, insights, gaps and potential weaknesses in the existing data that
will need to be considered by the primary data to be collected. The key considerations for the development of the primary research to achieve the requirements of the evaluation
framework are:
1. Consistent and actionable insights aligned to SafeWork’s strategic capability – the MSD strategy purpose is to design the work to avoid prolonged stress. The primary research
and actionable outcomes must be focused on insights gained from an employer focus about safe design across leadership, systematic approaches and collaboration efforts with
workers.
2. Review 2018 claims data and determine if any trends can be attributed to the strategy - the 2019 Evaluation is awaiting claims data for up to the year 2018 to review and
analyse any trends since the strategy began. A key consideration of the baseline evaluation was the inability to attribute these trends to the Strategy.
3. Deeper understanding of the action plans and activity streams - the action plans provide information on the activities planned for implementation, but they do not detail the
adequacy of the inputs, the reach to their target audiences, nor the barriers and enablers influencing implementation. The PCBU primary research provides an opportunity to
understand the access to resources as part of the Strategy. Further information will be sought from SafeWork to understand those tasks that have been implemented and
reasons why other tasks have not yet.
4. Investigate the reach of PCBUs for targeted intervention that can inform the development of an engagement plan for MSD, including an MSD awareness campaign
a. Determine if more detail can be extracted on customer experience touchpoints and from Activity and Website data.
b. Explore the exemplar regulatory activity stream with stakeholders to determine if this impact reach and potential access to its resources.
c. Determine if a lack of understanding to the problem and a willingness to change may impede strategy implementation.
d. Assess what Safework NSW MSD initiatives are working
5. The following are identified gaps that prevent a full realisation of the short-term outcomes for evaluation, which can be broadened in the primary research.
a. Psychological MSD related focus - test PCBU level of awareness and knowledge of psychological impacts on MSD-related claims.
b. Ascertaining more detailed information on resource access through stakeholder interviews and SafeWork internal data, answering:
c. Reception to SafeWork initiatives – understand why initiatives may not be well received to provide insight into the level of awareness and utilisation. This should be
compared to previous promotions or campaigns for greater context on what and why they may not be received well.
6. Prepare baseline readings to measure medium-term and long-term outcomes that have not currently being considered in the PCBU survey –baseline evaluation metrics
should be explored to consider longer-term metrics on a change in PCBU mindset and behaviour to safe design - from PCBU leadership, systematic approaches and worker
collaboration.

Methodology detail – Phase 3 stakeholder explorationHow we completed the stakeholder qualitative exploration
11
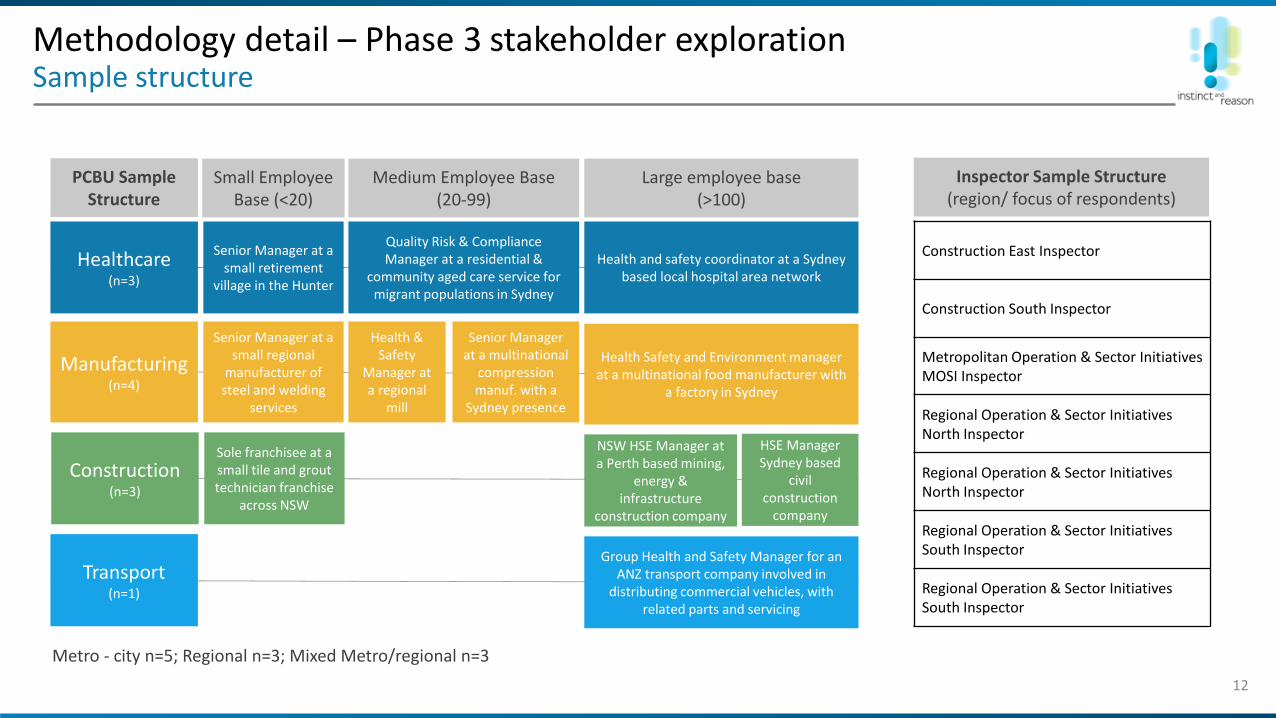
7 telephone in-depth interviews with SNSW Inspectors:• Held from June 3 to June 7 • 2 x North Inspectors, 2 x South Inspectors, 2 x Construction Inspectors, 1 x Metro Inspector• To gain a front-line, practical perspective on the issue of MSDs in the workplace, and the Strategy’s implementation
1 focus group session with members of the MSD consultative committee: • Held on June 4 at the SafeWork NSW Musculoskeletal Disorder - Consultative Group meeting• The purpose was to gain a deeper understanding of expert perception on MSD issues and the ideal outcome for the strategy
11 telephone in-depth interviews with high-risk industries; interviewees had WH&S decision-making responsibilities:• Held from 31 May 2019 to 17 June 2019 (18 days)• 3 x Healthcare, 4 x Manufacturing, 3 x Construction, 1 x Transport• To gain an industry perspective on those factors impacting the awareness and prioritisation of musculoskeletal injuries. This
perspective was sought from those with no SafeWork interaction and those without any interaction.
This reports contains the results of discussion with three separate stakeholder groups, where different perspectives were sought to help inform the 2019 Short-Term Evaluation:
Methodology detail – Phase 3 stakeholder explorationSample structure
12
Senior Manager at a small retirement
village in the Hunter
Senior Manager at a small regional
manufacturer of steel and welding
services
Quality Risk & Compliance Manager at a residential &
community aged care service for migrant populations in Sydney
Health and safety coordinator at a Sydney based local hospital area network
Health & Safety
Manager at a regional
mill
Health Safety and Environment manager at a multinational food manufacturer with
a factory in Sydney
HSE Manager Sydney based
civil construction
company
Group Health and Safety Manager for an ANZ transport company involved in
distributing commercial vehicles, with related parts and servicing
Small Employee Base (<20)
Medium Employee Base (20-99)
Large employee base (>100)
Healthcare (n=3)
Manufacturing(n=4)
Construction(n=3)
Transport(n=1)
Senior Manager at a multinational
compression manuf. with a
Sydney presence
NSW HSE Manager at a Perth based mining,
energy & infrastructure
construction company
Sole franchisee at a small tile and grout technician franchise
across NSW
Metro - city n=5; Regional n=3; Mixed Metro/regional n=3
PCBU Sample Structure
Inspector Sample Structure(region/ focus of respondents)
Construction East Inspector
Construction South Inspector
Metropolitan Operation & Sector Initiatives MOSI Inspector
Regional Operation & Sector Initiatives North Inspector
Regional Operation & Sector Initiatives North Inspector
Regional Operation & Sector Initiatives South Inspector
Regional Operation & Sector Initiatives South Inspector
Methodology detail – phase 4 custom PCBU surveyHow we completed the stakeholder quantitative survey
13
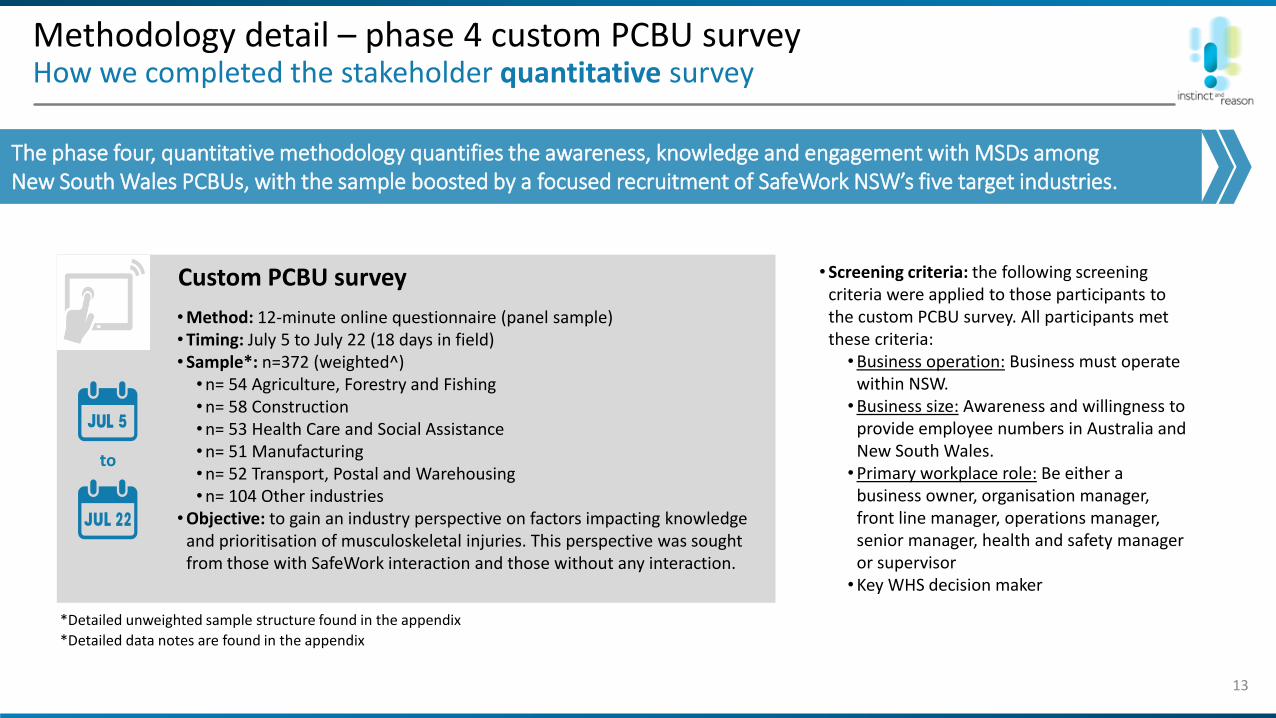
•Method: 12-minute online questionnaire (panel sample)•Timing: July 5 to July 22 (18 days in field)• Sample*: n=372 (weighted^)•n= 54 Agriculture, Forestry and Fishing•n= 58 Construction•n= 53 Health Care and Social Assistance•n= 51 Manufacturing•n= 52 Transport, Postal and Warehousing•n= 104 Other industries
•Objective: to gain an industry perspective on factors impacting knowledge and prioritisation of musculoskeletal injuries. This perspective was sought from those with SafeWork interaction and those without any interaction.
Custom PCBU survey
to
The phase four, quantitative methodology quantifies the awareness, knowledge and engagement with MSDs among New South Wales PCBUs, with the sample boosted by a focused recruitment of SafeWork NSW’s five target industries.
*Detailed unweighted sample structure found in the appendix
• Screening criteria: the following screening criteria were applied to those participants to the custom PCBU survey. All participants met these criteria:•Business operation: Business must operate
within NSW.•Business size: Awareness and willingness to
provide employee numbers in Australia and New South Wales.•Primary workplace role: Be either a
business owner, organisation manager, front line manager, operations manager, senior manager, health and safety manager or supervisor•Key WHS decision maker
*Detailed data notes are found in the appendix
Methodology detail – phase 4 custom PCBU surveyHow we completed the stakeholder quantitative survey
14
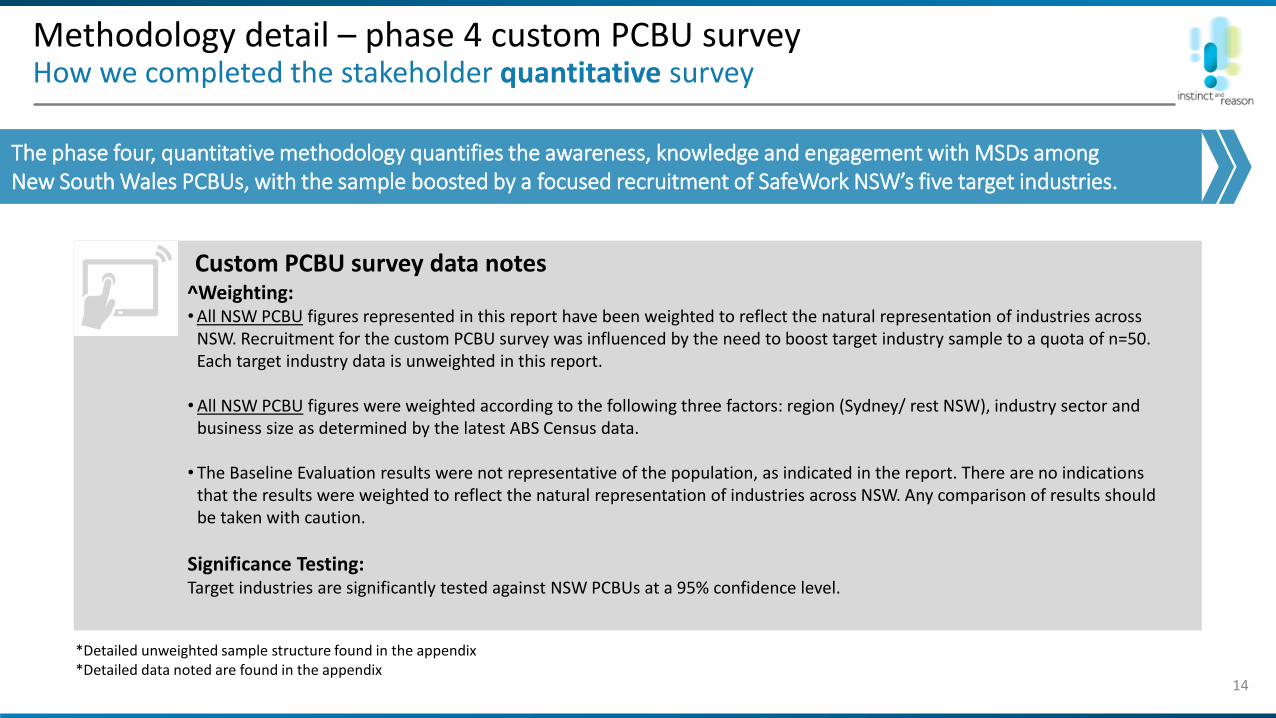
The phase four, quantitative methodology quantifies the awareness, knowledge and engagement with MSDs among New South Wales PCBUs, with the sample boosted by a focused recruitment of SafeWork NSW’s five target industries.
*Detailed unweighted sample structure found in the appendix*Detailed data noted are found in the appendix
Custom PCBU survey data notes^Weighting: •All NSW PCBU figures represented in this report have been weighted to reflect the natural representation of industries across
NSW. Recruitment for the custom PCBU survey was influenced by the need to boost target industry sample to a quota of n=50. Each target industry data is unweighted in this report.
•All NSW PCBU figures were weighted according to the following three factors: region (Sydney/ rest NSW), industry sector and business size as determined by the latest ABS Census data.
• The Baseline Evaluation results were not representative of the population, as indicated in the report. There are no indications that the results were weighted to reflect the natural representation of industries across NSW. Any comparison of results should be taken with caution.
Significance Testing: Target industries are significantly tested against NSW PCBUs at a 95% confidence level.

www.instinctandreason.com
Key findings
2
16
Short-term Evaluation Key FindingsThe Strategy is improving its reach, and positively impacts those who know about it…
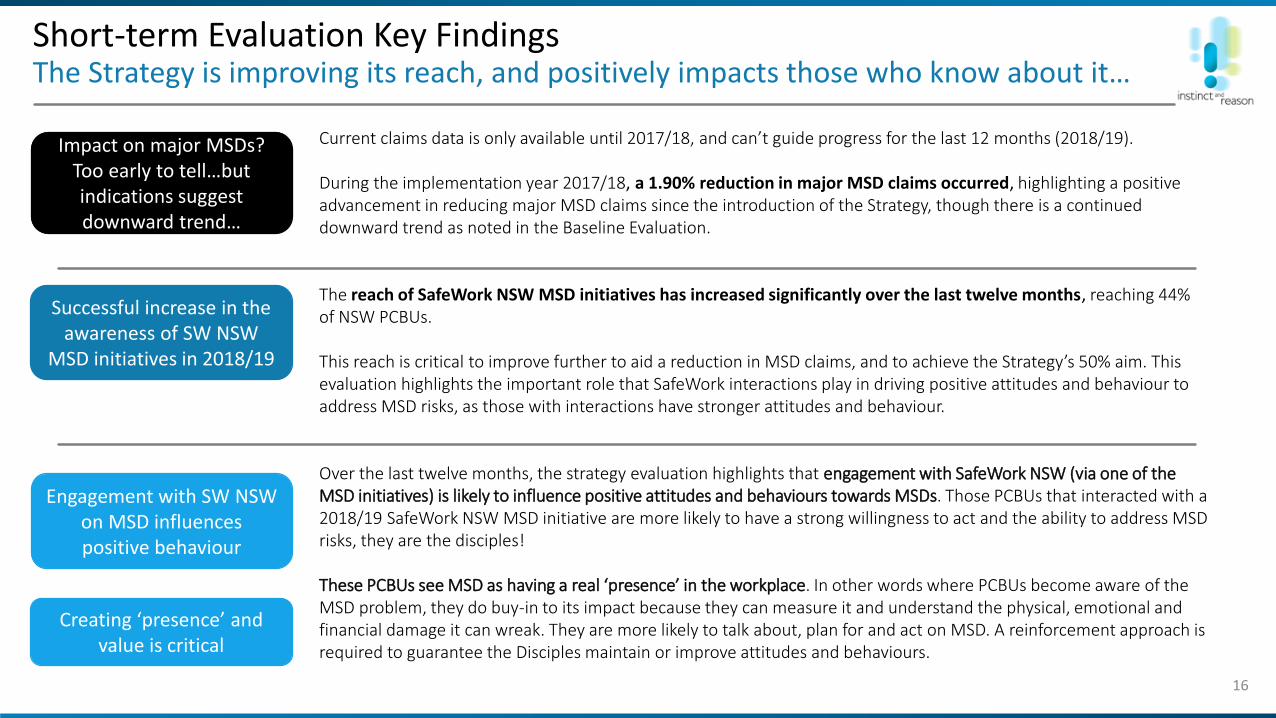
Current claims data is only available until 2017/18, and can’t guide progress for the last 12 months (2018/19).
During the implementation year 2017/18, a 1.90% reduction in major MSD claims occurred, highlighting a positive advancement in reducing major MSD claims since the introduction of the Strategy, though there is a continued downward trend as noted in the Baseline Evaluation.
The reach of SafeWork NSW MSD initiatives has increased significantly over the last twelve months, reaching 44% of NSW PCBUs.
This reach is critical to improve further to aid a reduction in MSD claims, and to achieve the Strategy’s 50% aim. This evaluation highlights the important role that SafeWork interactions play in driving positive attitudes and behaviour to address MSD risks, as those with interactions have stronger attitudes and behaviour.
Over the last twelve months, the strategy evaluation highlights that engagement with SafeWork NSW (via one of the MSD initiatives) is likely to influence positive attitudes and behaviours towards MSDs. Those PCBUs that interacted with a 2018/19 SafeWork NSW MSD initiative are more likely to have a strong willingness to act and the ability to address MSD risks, they are the disciples!
These PCBUs see MSD as having a real ‘presence’ in the workplace. In other words where PCBUs become aware of the MSD problem, they do buy-in to its impact because they can measure it and understand the physical, emotional and financial damage it can wreak. They are more likely to talk about, plan for and act on MSD. A reinforcement approach is required to guarantee the Disciples maintain or improve attitudes and behaviours.
Engagement with SW NSW on MSD influences positive behaviour
Creating ‘presence’ and value is critical
Successful increase in the awareness of SW NSW
MSD initiatives in 2018/19
Impact on major MSDs?Too early to tell…but indications suggest downward trend…
17
Short-term Evaluation Key Findings…but the Strategy is not reaching enough PCBUs, and lacks presence in many
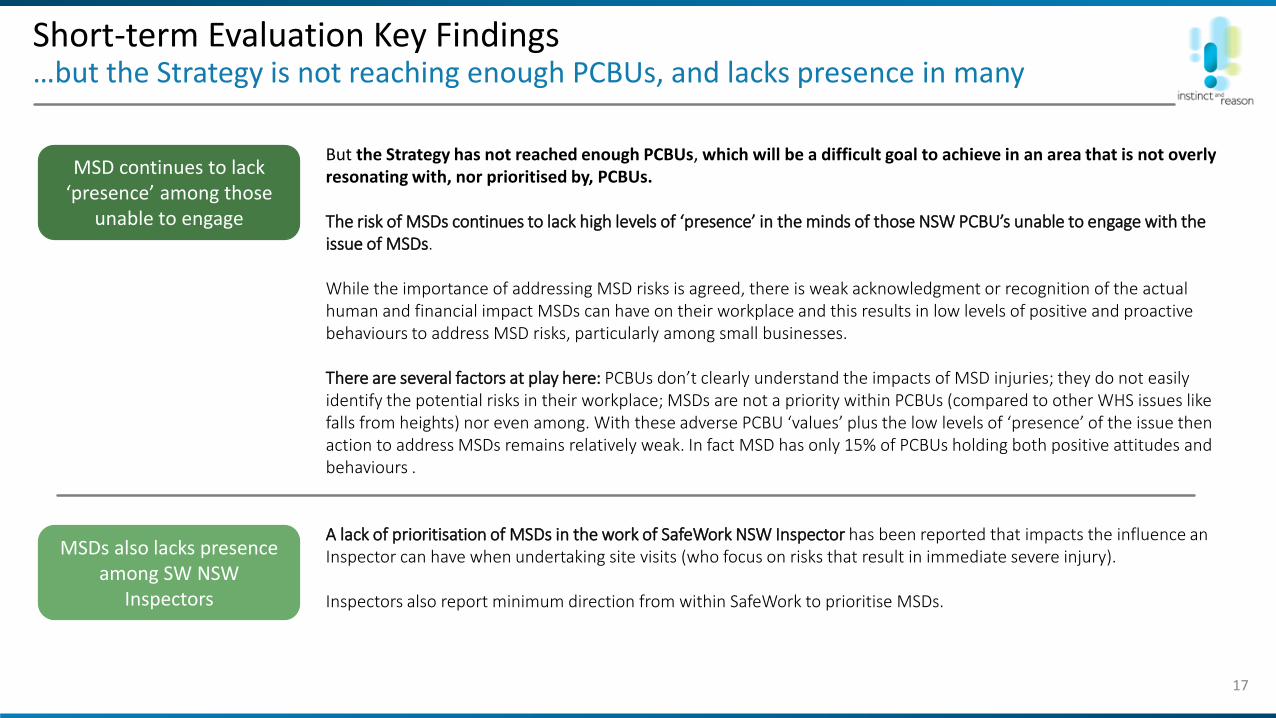
But the Strategy has not reached enough PCBUs, which will be a difficult goal to achieve in an area that is not overly resonating with, nor prioritised by, PCBUs.
The risk of MSDs continues to lack high levels of ‘presence’ in the minds of those NSW PCBU’s unable to engage with the issue of MSDs.
While the importance of addressing MSD risks is agreed, there is weak acknowledgment or recognition of the actual human and financial impact MSDs can have on their workplace and this results in low levels of positive and proactive behaviours to address MSD risks, particularly among small businesses.
There are several factors at play here: PCBUs don’t clearly understand the impacts of MSD injuries; they do not easily identify the potential risks in their workplace; MSDs are not a priority within PCBUs (compared to other WHS issues like falls from heights) nor even among. With these adverse PCBU ‘values’ plus the low levels of ‘presence’ of the issue then action to address MSDs remains relatively weak. In fact MSD has only 15% of PCBUs holding both positive attitudes and behaviours .
A lack of prioritisation of MSDs in the work of SafeWork NSW Inspector has been reported that impacts the influence an Inspector can have when undertaking site visits (who focus on risks that result in immediate severe injury).
Inspectors also report minimum direction from within SafeWork to prioritise MSDs.
MSD continues to lack ‘presence’ among those
unable to engage
MSDs also lacks presence among SW NSW
Inspectors
18
Short-term Evaluation Key FindingsOpportunity exists to improve the influence of initiatives
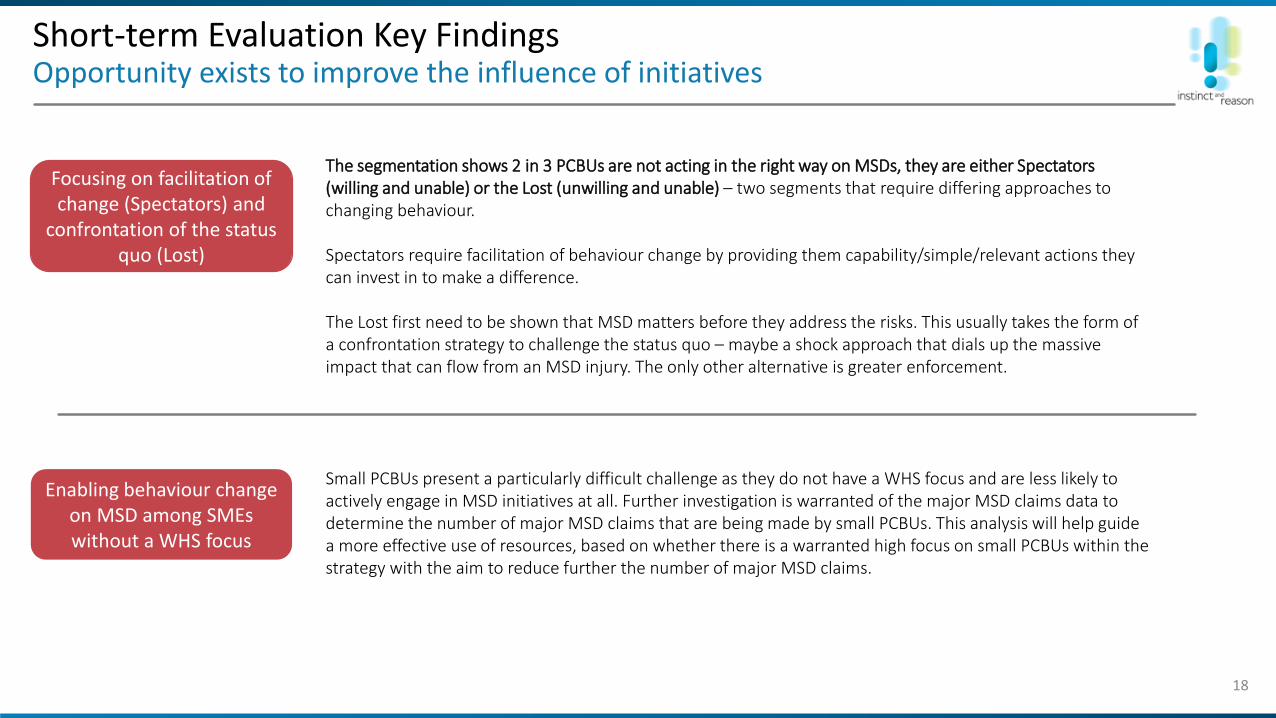
The segmentation shows 2 in 3 PCBUs are not acting in the right way on MSDs, they are either Spectators (willing and unable) or the Lost (unwilling and unable) – two segments that require differing approaches to changing behaviour.
Spectators require facilitation of behaviour change by providing them capability/simple/relevant actions they can invest in to make a difference.
The Lost first need to be shown that MSD matters before they address the risks. This usually takes the form of a confrontation strategy to challenge the status quo – maybe a shock approach that dials up the massive impact that can flow from an MSD injury. The only other alternative is greater enforcement.
Small PCBUs present a particularly difficult challenge as they do not have a WHS focus and are less likely to actively engage in MSD initiatives at all. Further investigation is warranted of the major MSD claims data to determine the number of major MSD claims that are being made by small PCBUs. This analysis will help guide a more effective use of resources, based on whether there is a warranted high focus on small PCBUs within the strategy with the aim to reduce further the number of major MSD claims.
Focusing on facilitation of change (Spectators) and
confrontation of the status quo (Lost)
Enabling behaviour change on MSD among SMEs without a WHS focus
19
Short-term Evaluation Key FindingsMSD prevalence in NSW PCBUs
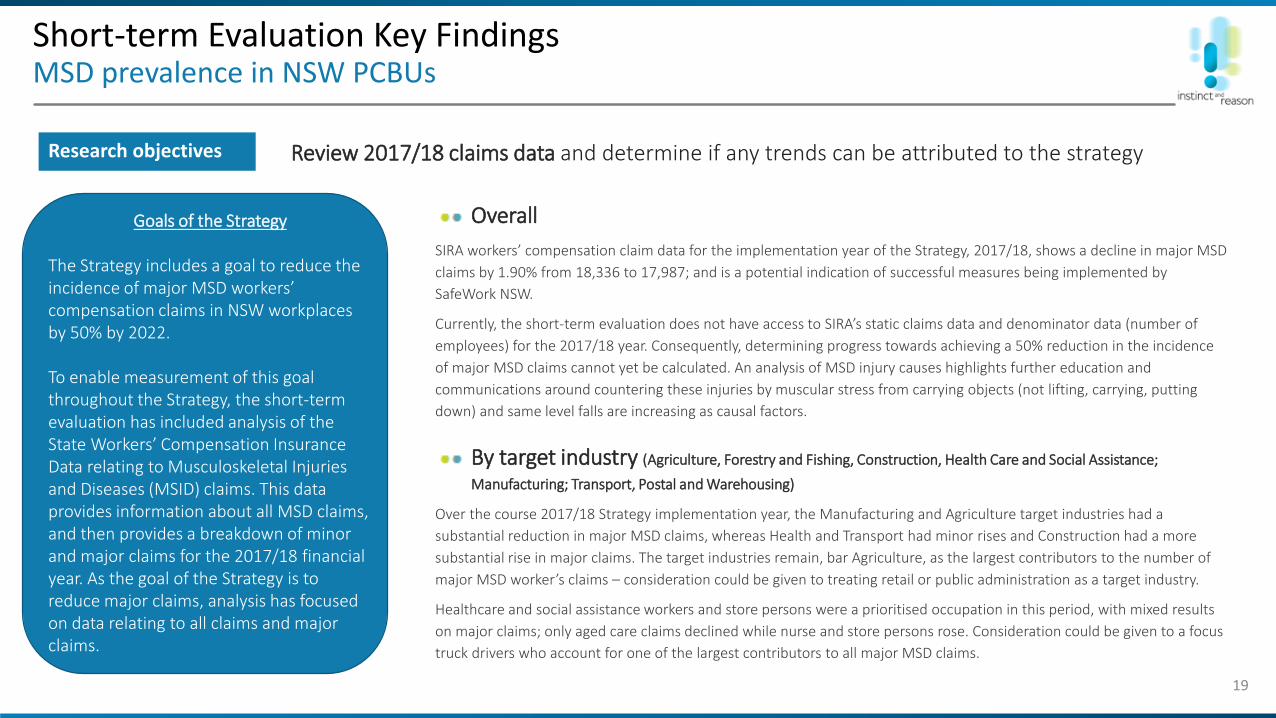
Research objectives Review 2017/18 claims data and determine if any trends can be attributed to the strategy
Overall
SIRA workers’ compensation claim data for the implementation year of the Strategy, 2017/18, shows a decline in major MSD
claims by 1.90% from 18,336 to 17,987; and is a potential indication of successful measures being implemented by
SafeWork NSW.
Currently, the short-term evaluation does not have access to SIRA’s static claims data and denominator data (number of
employees) for the 2017/18 year. Consequently, determining progress towards achieving a 50% reduction in the incidence
of major MSD claims cannot yet be calculated. An analysis of MSD injury causes highlights further education and
communications around countering these injuries by muscular stress from carrying objects (not lifting, carrying, putting
down) and same level falls are increasing as causal factors.
By target industry (Agriculture, Forestry and Fishing, Construction, Health Care and Social Assistance;
Manufacturing; Transport, Postal and Warehousing)
Over the course 2017/18 Strategy implementation year, the Manufacturing and Agriculture target industries had a
substantial reduction in major MSD claims, whereas Health and Transport had minor rises and Construction had a more
substantial rise in major claims. The target industries remain, bar Agriculture, as the largest contributors to the number of
major MSD worker’s claims – consideration could be given to treating retail or public administration as a target industry.
Healthcare and social assistance workers and store persons were a prioritised occupation in this period, with mixed results
on major claims; only aged care claims declined while nurse and store persons rose. Consideration could be given to a focus
truck drivers who account for one of the largest contributors to all major MSD claims.
Goals of the Strategy
The Strategy includes a goal to reduce the incidence of major MSD workers’ compensation claims in NSW workplaces by 50% by 2022.
To enable measurement of this goal throughout the Strategy, the short-term evaluation has included analysis of the State Workers’ Compensation Insurance Data relating to Musculoskeletal Injuries and Diseases (MSID) claims. This data provides information about all MSD claims, and then provides a breakdown of minor and major claims for the 2017/18 financial year. As the goal of the Strategy is to reduce major claims, analysis has focused on data relating to all claims and major claims.
20
Short-term Evaluation Key FindingsAre PCBUs accessing SafeWork NSW MSD resources?
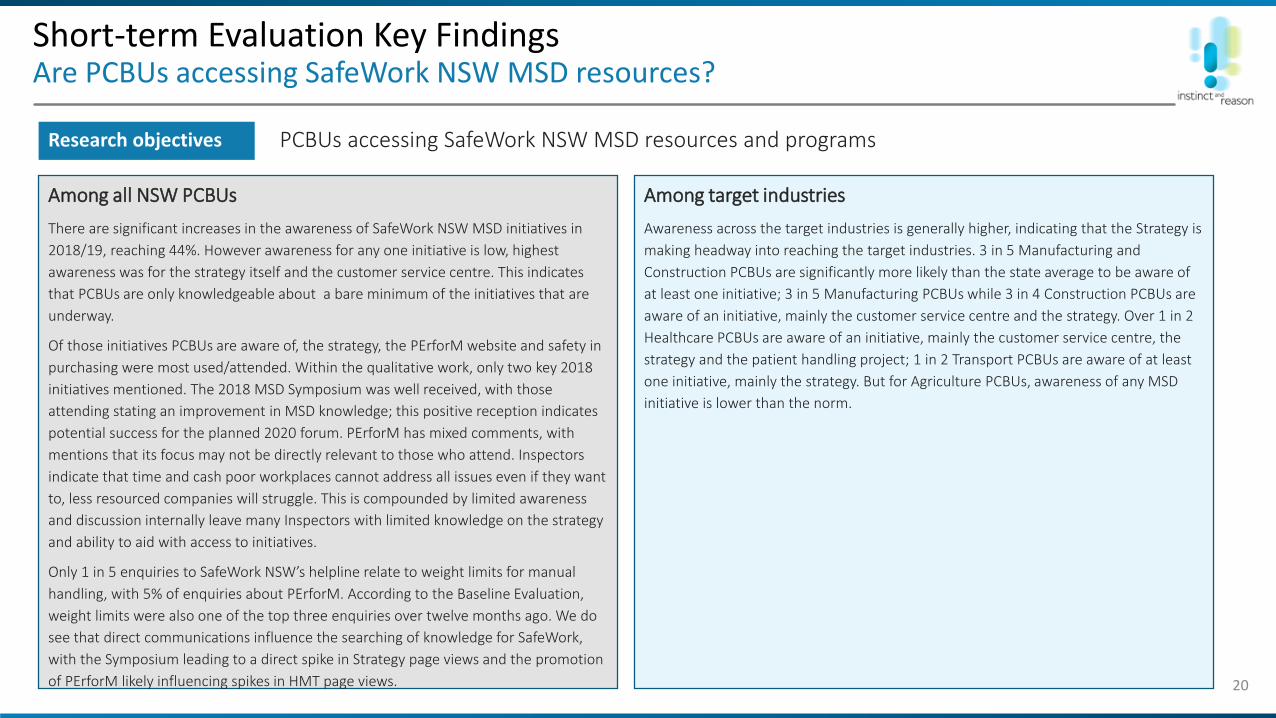
Research objectives PCBUs accessing SafeWork NSW MSD resources and programs
Among target industries
Awareness across the target industries is generally higher, indicating that the Strategy is
making headway into reaching the target industries. 3 in 5 Manufacturing and
Construction PCBUs are significantly more likely than the state average to be aware of
at least one initiative; 3 in 5 Manufacturing PCBUs while 3 in 4 Construction PCBUs are
aware of an initiative, mainly the customer service centre and the strategy. Over 1 in 2
Healthcare PCBUs are aware of an initiative, mainly the customer service centre, the
strategy and the patient handling project; 1 in 2 Transport PCBUs are aware of at least
one initiative, mainly the strategy. But for Agriculture PCBUs, awareness of any MSD
initiative is lower than the norm.
Among all NSW PCBUs
There are significant increases in the awareness of SafeWork NSW MSD initiatives in
2018/19, reaching 44%. However awareness for any one initiative is low, highest
awareness was for the strategy itself and the customer service centre. This indicates
that PCBUs are only knowledgeable about a bare minimum of the initiatives that are
underway.
Of those initiatives PCBUs are aware of, the strategy, the PErforM website and safety in
purchasing were most used/attended. Within the qualitative work, only two key 2018
initiatives mentioned. The 2018 MSD Symposium was well received, with those
attending stating an improvement in MSD knowledge; this positive reception indicates
potential success for the planned 2020 forum. PErforM has mixed comments, with
mentions that its focus may not be directly relevant to those who attend. Inspectors
indicate that time and cash poor workplaces cannot address all issues even if they want
to, less resourced companies will struggle. This is compounded by limited awareness
and discussion internally leave many Inspectors with limited knowledge on the strategy
and ability to aid with access to initiatives.
Only 1 in 5 enquiries to SafeWork NSW’s helpline relate to weight limits for manual
handling, with 5% of enquiries about PErforM. According to the Baseline Evaluation,
weight limits were also one of the top three enquiries over twelve months ago. We do
see that direct communications influence the searching of knowledge for SafeWork,
with the Symposium leading to a direct spike in Strategy page views and the promotion
of PErforM likely influencing spikes in HMT page views.

21
Short-term Evaluation Key FindingsWhat is the impact of SafeWork initiatives and how can PCBUs be engaged?
Research objectives
Investigate the reach of PCBUs for targeted intervention that can inform the development of an
engagement plan for addressing MSD risks, including an MSD awareness campaign.
Channels of engagement
NSW PCBUs are most likely to source WHS information and MSD information from the SafeWork NSW website; although nearly 1 in 4 PCBUs have no idea how the information is sourced for MSD. This is particularly pronounced among those not aware of MSD initiative, with 4 out of 5 unaware of where to go for MSD information which presents communication challenges and opportunities.
The SafeWork NSW website, industry magazines, emails and email newspapers and word of mouth sources appear to be the most channels for driving awareness. Word of mouth sources i.e. peers, colleagues, businesses, industry consultants have the potential to drive engagement with PCBUs around MSDs and ultimately lead them to utilize other information channels such as the SafeWork NSW website. Opportunities exist to link businesses with key opinion leaders and experts as a way of driving engagement and raising awareness.
NSW PCBUs are requesting best practice information be provided, with further education and training as well. Manufacturer PCBUs stand out on educations/training and site visits. 1 in 5 PCBUs do not see a need for SafeWork’s involvement.
Awareness segmentation
When determining the impact of being aware of 2018/19 SafeWork initiatives, there is
a direct relationship between positive MSD behaviour in the business and those NSW
PCBUs that are aware of the 2018/19 initiatives.
While those unable to engage are not likely to be show that behaviour and therefore
require facilitation and confrontation to change behaviour if they do not become aware
of the initiatives SafeWork NSW is doing. Furthermore, there is distinct relationship on
the willingness to address MSD risks among those who have engaged with a SafeWork
initiative. Those who engage are significantly more likely to have positive behaviour as
well, while those who haven’t are likely to indicate negative behaviour changes.
Awareness of MSD initiatives is lower amongst small businesses and given workplaces
with greater focus on WHS are more likely to be aware of MSD Initiatives, facilitating or
confronting small businesses into action may be a key strategy moving forward. We can
see from other results among those aware that there is a greater buy-in to the impact
and willingness, and therefore the related actions to address MSD risks when a
workplace has interacted with SafeWork on MSDs. Interestingly, those PCBUs that have
interacted are significantly more likely to state that MSDs have declined within their
workplace as they are more likely to believe in the impact MSDs have.
22
Short-term Evaluation Key FindingsWhat is the level of knowledge and awareness of MSD risks?
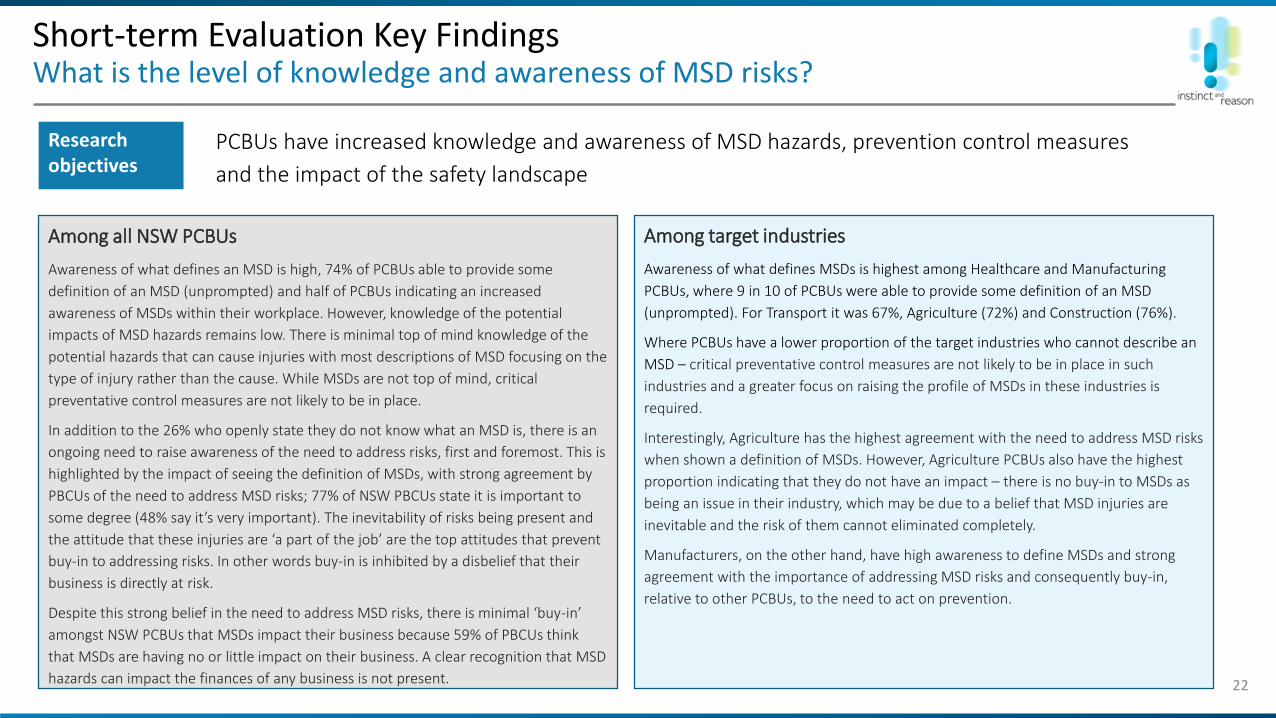
Research objectives
PCBUs have increased knowledge and awareness of MSD hazards, prevention control measures
and the impact of the safety landscape
Among target industries
Awareness of what defines MSDs is highest among Healthcare and Manufacturing
PCBUs, where 9 in 10 of PCBUs were able to provide some definition of an MSD
(unprompted). For Transport it was 67%, Agriculture (72%) and Construction (76%).
Where PCBUs have a lower proportion of the target industries who cannot describe an
MSD – critical preventative control measures are not likely to be in place in such
industries and a greater focus on raising the profile of MSDs in these industries is
required.
Interestingly, Agriculture has the highest agreement with the need to address MSD risks
when shown a definition of MSDs. However, Agriculture PCBUs also have the highest
proportion indicating that they do not have an impact – there is no buy-in to MSDs as
being an issue in their industry, which may be due to a belief that MSD injuries are
inevitable and the risk of them cannot eliminated completely.
Manufacturers, on the other hand, have high awareness to define MSDs and strong
agreement with the importance of addressing MSD risks and consequently buy-in,
relative to other PCBUs, to the need to act on prevention.
Among all NSW PCBUs
Awareness of what defines an MSD is high, 74% of PCBUs able to provide some
definition of an MSD (unprompted) and half of PCBUs indicating an increased
awareness of MSDs within their workplace. However, knowledge of the potential
impacts of MSD hazards remains low. There is minimal top of mind knowledge of the
potential hazards that can cause injuries with most descriptions of MSD focusing on the
type of injury rather than the cause. While MSDs are not top of mind, critical
preventative control measures are not likely to be in place.
In addition to the 26% who openly state they do not know what an MSD is, there is an
ongoing need to raise awareness of the need to address risks, first and foremost. This is
highlighted by the impact of seeing the definition of MSDs, with strong agreement by
PBCUs of the need to address MSD risks; 77% of NSW PBCUs state it is important to
some degree (48% say it’s very important). The inevitability of risks being present and
the attitude that these injuries are ‘a part of the job’ are the top attitudes that prevent
buy-in to addressing risks. In other words buy-in is inhibited by a disbelief that their
business is directly at risk.
Despite this strong belief in the need to address MSD risks, there is minimal ‘buy-in’
amongst NSW PCBUs that MSDs impact their business because 59% of PBCUs think
that MSDs are having no or little impact on their business. A clear recognition that MSD
hazards can impact the finances of any business is not present.

23
Short-term Evaluation Key FindingsWhat is the willingness to address MSD risks?
Research objectives PCBUs have increased willingness and confidence to address MSD risks
Among target industries
In the short-term evaluation, willingness to address MSD risk is significantly higher for
manufacturing PCBUs, where 3 in 4 PCBUs are willing; all other target industries remain
close to the state average. Similarly, manufacturing PCBUs have significantly higher
injuries, indicating that higher knowledge of MSDs could lead to a higher awareness
and greater likelihood to report an MSD injury. While the majority of PCBUs state injury
rates have remained constant; Manufacturing and Construction PCBUs have
significantly higher mentions of decreasing MSD injuries. Among the target industries, a
significantly higher number of Manufacturing, Construction and Healthcare PCBUs are
making changes.
There are strong associations between the target industries and the type of changes occurring in the last 12 moths. Healthcare is associated with offering training to prevent MSDs and with measuring and recording MSD injuries. Manufacturing is associated closely with staff consultation to reduce /eliminate actions & redesigning jobs. Construction is linked with increasing mentions of MSD risks to workers (toolbox) meetings, and then to awareness of the cost to the workplace.
The perceptual map of factors preventing action on MSDs reinforces the qualitative insights that clear associations exist in the barriers each target industry faces. Healthcare PCBUs have pressure to meet deadlines, changes are costly, workers prioritise getting the job done and put customer needs first. Manufacturers PCBUs have a lack of time to focus on the issue and Agriculture PCBUs don’t know the solution and see other risks as more important. Whereas Construction and Transport PCBUs don’t see MSD injuries as costing much, with workers not caring about the risks.
Among all NSW PCBUs
In the short-term evaluation, willingness to address MSD risk has been measured
across all PCBUs (which was not completed in the baseline evaluation). Currently,
willingness to address MSD risks is moderate among NSW PCBUs, with 1 in 2 indicating
a desire to do so while 3 in 10 are neither willing nor unwilling.
This willingness is likely influencing behavioural changes for MSDs in the last 12
months. Within the last 6 months, only half of NSW PCBUs indicate they have made at
least one change to a control measure to address MSD risks. This is relatively consistent
across each control types. This lack of change in in MSD controls is likely affected by a
lack of experience in dealing with MSDs; only 2 in 5 NSW PCBUs state an MSD injury
has occurred in the last 12 months within their business. This is largely
neck/back/shoulder pains.
More broadly, recognition of behavioural and attitudinal changes on MSDs vary over
the last twelve months, but with no more than half of NSW PCBUs noticing changes to
any one factor. This includes the key factors of staff consultation to reduce MSDs and
to redesign jobs.
Contrapuntally, more than half of PCBUs have not noticed any positive changes and key
barriers remain to proactive action on MSD risks. This evaluation highlighted that
pressure to meet deadlines, prioritising customer needs overrides their own needs, are
all key barriers PCBUs have identified in preventing more action on MSDs.
24
Short-term Evaluation Key FindingsPCBU focus on workplace, health and safety and MSDs
Research objectives
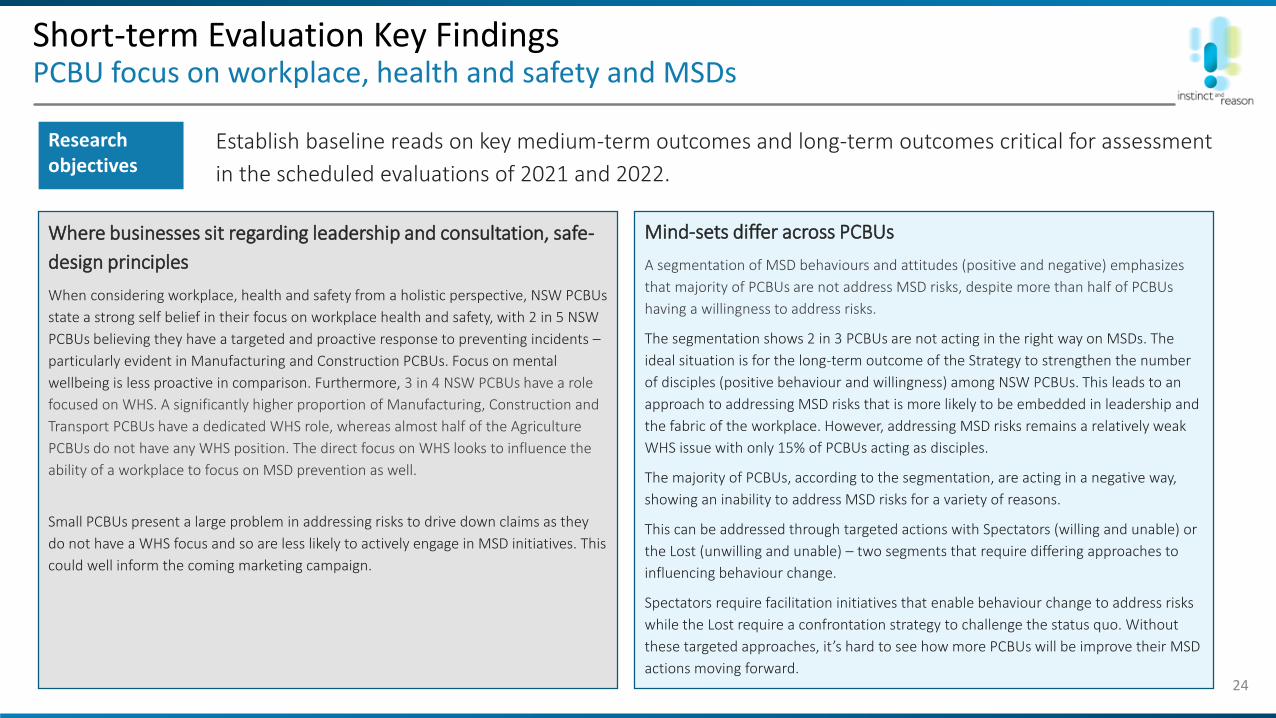
Establish baseline reads on key medium-term outcomes and long-term outcomes critical for assessment
in the scheduled evaluations of 2021 and 2022.
Mind-sets differ across PCBUs
A segmentation of MSD behaviours and attitudes (positive and negative) emphasizes
that majority of PCBUs are not address MSD risks, despite more than half of PCBUs
having a willingness to address risks.
The segmentation shows 2 in 3 PCBUs are not acting in the right way on MSDs. The
ideal situation is for the long-term outcome of the Strategy to strengthen the number
of disciples (positive behaviour and willingness) among NSW PCBUs. This leads to an
approach to addressing MSD risks that is more likely to be embedded in leadership and
the fabric of the workplace. However, addressing MSD risks remains a relatively weak
WHS issue with only 15% of PCBUs acting as disciples.
The majority of PCBUs, according to the segmentation, are acting in a negative way,
showing an inability to address MSD risks for a variety of reasons.
This can be addressed through targeted actions with Spectators (willing and unable) or
the Lost (unwilling and unable) – two segments that require differing approaches to
influencing behaviour change.
Spectators require facilitation initiatives that enable behaviour change to address risks
while the Lost require a confrontation strategy to challenge the status quo. Without
these targeted approaches, it’s hard to see how more PCBUs will be improve their MSD
actions moving forward.
Where businesses sit regarding leadership and consultation, safe-
design principles
When considering workplace, health and safety from a holistic perspective, NSW PCBUs
state a strong self belief in their focus on workplace health and safety, with 2 in 5 NSW
PCBUs believing they have a targeted and proactive response to preventing incidents –
particularly evident in Manufacturing and Construction PCBUs. Focus on mental
wellbeing is less proactive in comparison. Furthermore, 3 in 4 NSW PCBUs have a role
focused on WHS. A significantly higher proportion of Manufacturing, Construction and
Transport PCBUs have a dedicated WHS role, whereas almost half of the Agriculture
PCBUs do not have any WHS position. The direct focus on WHS looks to influence the
ability of a workplace to focus on MSD prevention as well.
Small PCBUs present a large problem in addressing risks to drive down claims as they
do not have a WHS focus and so are less likely to actively engage in MSD initiatives. This
could well inform the coming marketing campaign.

www.instinctandreason.com
Detailed Findings
3
www.instinctandreason.com
MSD prevalence in NSW PCBUs
3a
An analysis of SIRA workers compensation data to 2017/2018

27
At the time of delivering the 2019 Short-term Evaluation report, only 2016/17 incidence rates are available to determine progress towards the NSW WHS Roadmap target for reducing major MSDs. These incidence figures indicate NSW remains on track to achieve a 50% reduction by 2022, with an ongoing decline in claims keeping the trajectory below the reduction required to achieve targets. 2017/18 claims data will be available in January 2020, where any incidence can be measured against the required trajectory for 2017/18 to assess the Strategy’s 2017 implementation year (Strategy launch in October 2017, some tasks commenced in July 2017).
MSD prevalence in NSW PCBUsTrend in incidence rates for MSD (2016/17 claims data)
Source: State Insurance Regulatory Authority - Data as at 30th June 2019, extracted in August 2019 for the 2017/18 financial year
Analysis of the State Workers’ Compensation Insurance Data
Please Note: Data Consideration Issues
The SW NSW target was based on incidence of serious claims and developed based on a methodology to assess progress against targets which mirrored the SafeWork Australia methodology.
All remaining claims data in this report is data as at 30th June 2019, extracted in August 2019 for the 2017/18 financial year. With incidence rates only shown for 2016/17, conclusions on the 2018/2019 progress of Strategy (i.e. the last 12 months of the Strategy’s work) cannot be attributed to any changes in claims data as this information is not yet available.
28
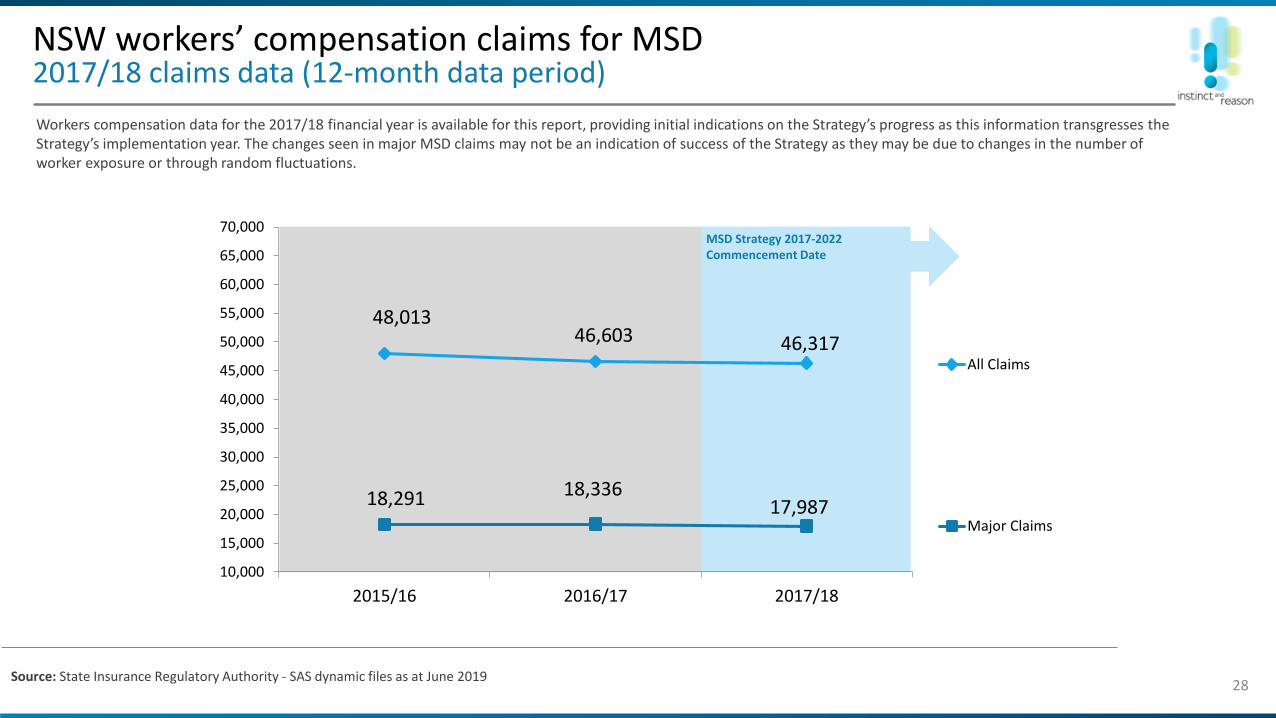
Workers compensation data for the 2017/18 financial year is available for this report, providing initial indications on the Strategy’s progress as this information transgresses theStrategy’s implementation year. The changes seen in major MSD claims may not be an indication of success of the Strategy as they may be due to changes in the number of worker exposure or through random fluctuations.
NSW workers’ compensation claims for MSD 2017/18 claims data (12-month data period)
Source: State Insurance Regulatory Authority - SAS dynamic files as at June 2019
48,01346,603 46,317
18,291 18,33617,987
10,000
15,000
20,000
25,000
30,000
35,000
40,000
45,000
50,000
55,000
60,000
65,000
70,000
2015/16 2016/17 2017/18
All Claims
Major Claims
MSD Strategy 2017-2022 Commencement Date
29
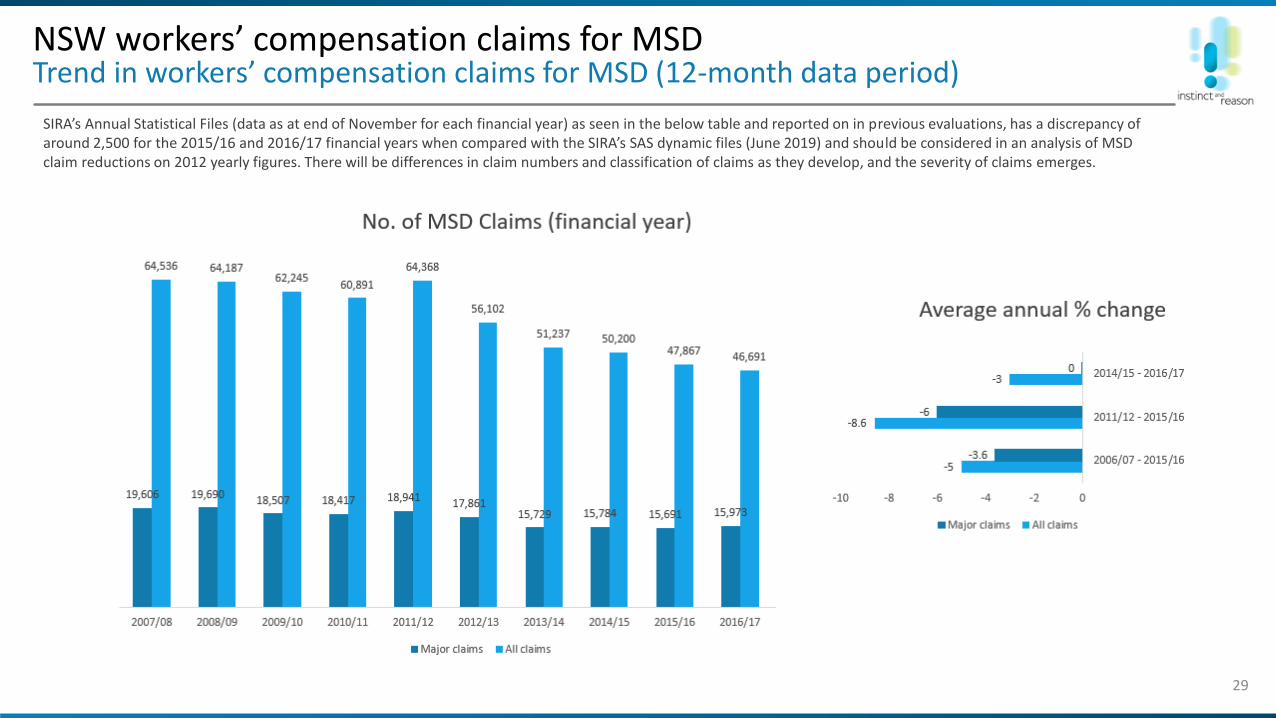
SIRA’s Annual Statistical Files (data as at end of November for each financial year) as seen in the below table and reported on in previous evaluations, has a discrepancy of around 2,500 for the 2015/16 and 2016/17 financial years when compared with the SIRA’s SAS dynamic files (June 2019) and should be considered in an analysis of MSD claim reductions on 2012 yearly figures. There will be differences in claim numbers and classification of claims as they develop, and the severity of claims emerges.
NSW workers’ compensation claims for MSDTrend in workers’ compensation claims for MSD (12-month data period)
30
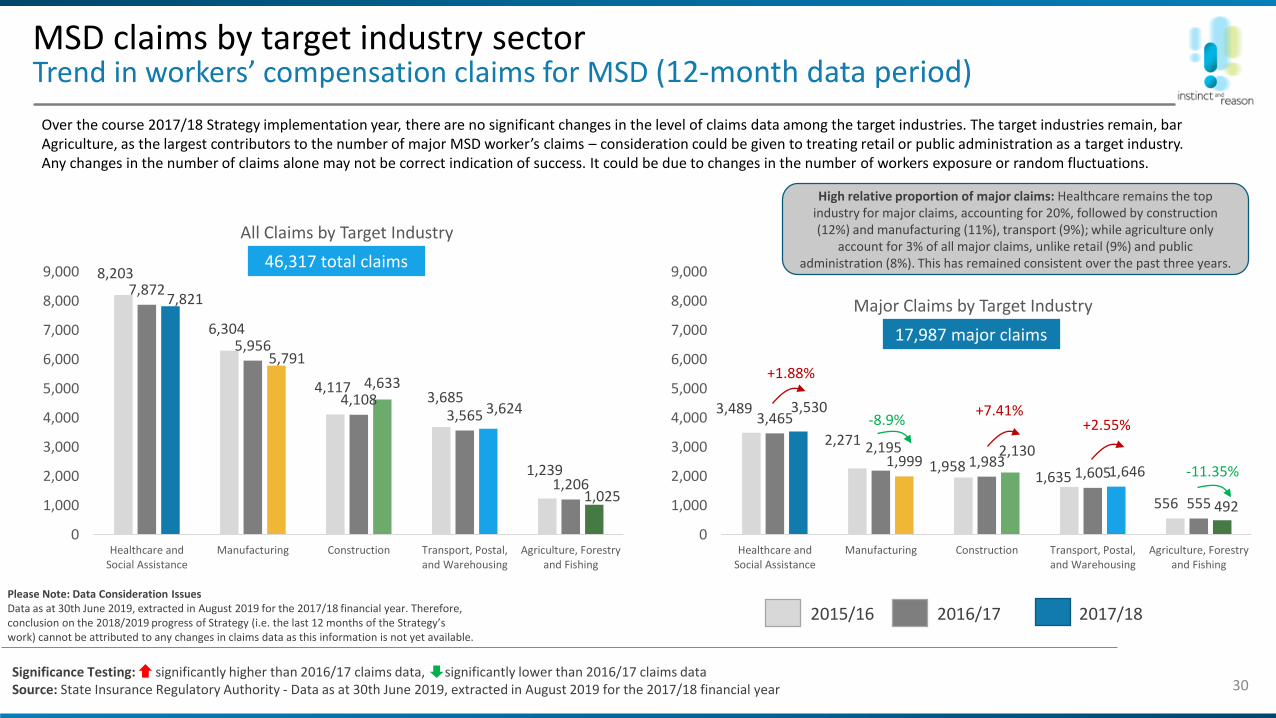
Over the course 2017/18 Strategy implementation year, there are no significant changes in the level of claims data among the target industries. The target industries remain, bar Agriculture, as the largest contributors to the number of major MSD worker’s claims – consideration could be given to treating retail or public administration as a target industry. Any changes in the number of claims alone may not be correct indication of success. It could be due to changes in the number of workers exposure or random fluctuations.
MSD claims by target industry sectorTrend in workers’ compensation claims for MSD (12-month data period)
2017/182016/17
High relative proportion of major claims: Healthcare remains the top industry for major claims, accounting for 20%, followed by construction (12%) and manufacturing (11%), transport (9%); while agriculture only
account for 3% of all major claims, unlike retail (9%) and public administration (8%). This has remained consistent over the past three years.
8,203
6,304
4,1173,685
1,239
7,872
5,956
4,1083,565
1,206
7,821
5,791
4,633
3,624
1,025
0
1,000
2,000
3,000
4,000
5,000
6,000
7,000
8,000
9,000
Healthcare andSocial Assistance
Manufacturing Construction Transport, Postal,and Warehousing
Agriculture, Forestryand Fishing
All Claims by Target Industry
2015/16
3,489
2,271
1,9581,635
556
3,465
2,1951,983
1,605
555
3,530
1,9992,130
1,646
492
0
1,000
2,000
3,000
4,000
5,000
6,000
7,000
8,000
9,000
Healthcare andSocial Assistance
Manufacturing Construction Transport, Postal,and Warehousing
Agriculture, Forestryand Fishing
Major Claims by Target Industry
+1.88%
+7.41%+2.55% -8.9%
-11.35%
Source: State Insurance Regulatory Authority - Data as at 30th June 2019, extracted in August 2019 for the 2017/18 financial year
46,317 total claims
17,987 major claims
Please Note: Data Consideration IssuesData as at 30th June 2019, extracted in August 2019 for the 2017/18 financial year. Therefore, conclusion on the 2018/2019 progress of Strategy (i.e. the last 12 months of the Strategy’s work) cannot be attributed to any changes in claims data as this information is not yet available.
Significance Testing: significantly higher than 2016/17 claims data, significantly lower than 2016/17 claims dataSource: State Insurance Regulatory Authority - Data as at 30th June 2019, extracted in August 2019 for the 2017/18 financial year
31
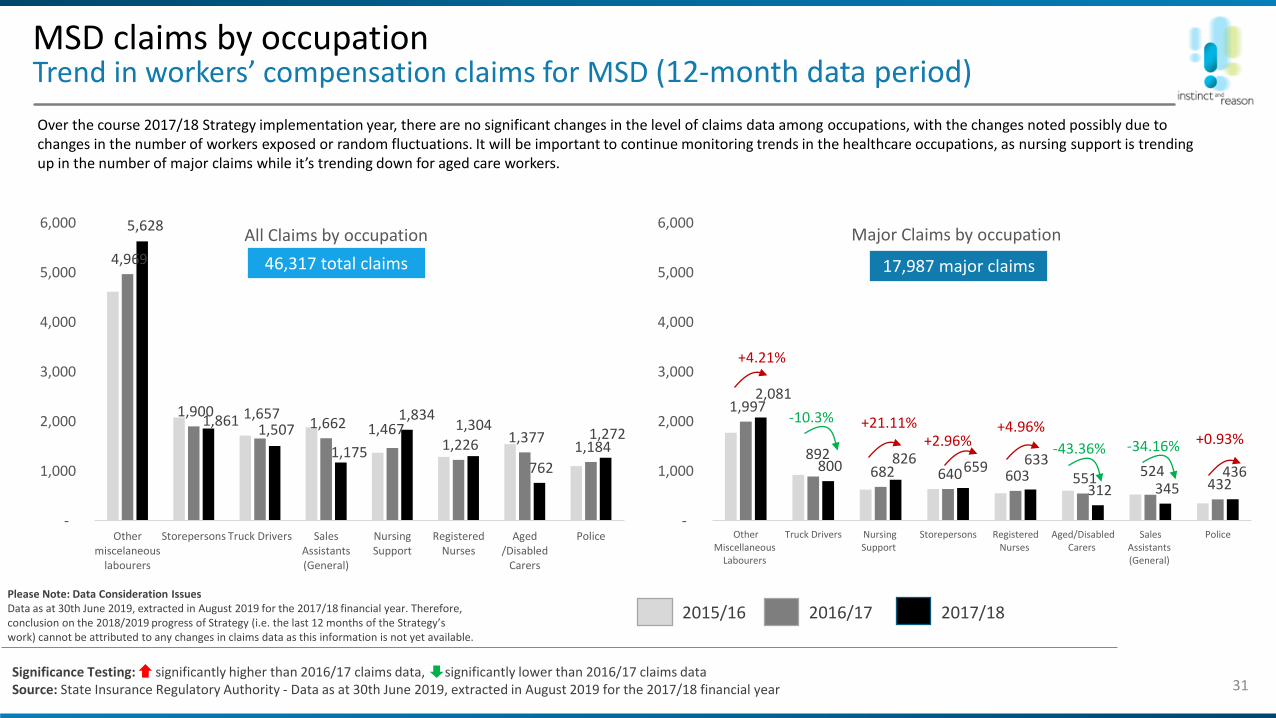
Over the course 2017/18 Strategy implementation year, there are no significant changes in the level of claims data among occupations, with the changes noted possibly due to changes in the number of workers exposed or random fluctuations. It will be important to continue monitoring trends in the healthcare occupations, as nursing support is trending up in the number of major claims while it’s trending down for aged care workers.
MSD claims by occupationTrend in workers’ compensation claims for MSD (12-month data period)
2017/182016/17
4,969
1,900 1,657 1,662 1,467
1,226 1,377 1,184
5,628
1,861 1,507
1,175
1,834 1,304
762
1,272
-
1,000
2,000
3,000
4,000
5,000
6,000
Othermiscelaneous
labourers
Storepersons Truck Drivers SalesAssistants(General)
NursingSupport
RegisteredNurses
Aged/Disabled
Carers
Police
All Claims by occupation
2015/16
1,997
892 682 640 603 551 524
432
2,081
800 826 659 633
312 345 436
-
1,000
2,000
3,000
4,000
5,000
6,000
OtherMiscellaneous
Labourers
Truck Drivers NursingSupport
Storepersons RegisteredNurses
Aged/DisabledCarers
SalesAssistants(General)
Police
Major Claims by occupation
+4.96% +21.11%+2.96%
+4.21%
+0.93%
-10.3%
-43.36% -34.16%
46,317 total claims 17,987 major claims
Please Note: Data Consideration IssuesData as at 30th June 2019, extracted in August 2019 for the 2017/18 financial year. Therefore, conclusion on the 2018/2019 progress of Strategy (i.e. the last 12 months of the Strategy’s work) cannot be attributed to any changes in claims data as this information is not yet available.
Significance Testing: significantly higher than 2016/17 claims data, significantly lower than 2016/17 claims dataSource: State Insurance Regulatory Authority - Data as at 30th June 2019, extracted in August 2019 for the 2017/18 financial year

32
Over the course 2017/18 Strategy implementation year, there are no significant changes in the level of claims data among the mechanisms of action for major MSD injuries; the changes noted could be due to changes in the number of workers exposed or random fluctuations. Muscular stress (from both handling objects and no objects being handled) and same level falls account for 7 in 10 major MSD injuries in 2017/18; education and communications around countering these movements could be a point of focus moving forward.
MSD claims by mechanism of actionTrend in workers’ compensation claims for MSD (12-month data period)
11,095 10,119 10,675
10,088 9,782 9,144
7,683 7,634 7,860
4,830 4,805 4,586
14,317 14,263 14,052
0%
10%
20%
30%
40%
50%
60%
70%
80%
90%
100%
2015/16 2016/17 2017/18
All Claims by mechanism of action
Other Muscular stress with no objects being handled Falls on the same level Muscular stress while lifting, carrying, or putting down objects Muscular stress while handling objects other than lifting, carrying or putting down
46,317
4,345 4,016 4,165
4,050 4,053 3,720
3,017 3,047 3,133
1,724 1,852 1,729
5,155 5,368 5,240
0%
10%
20%
30%
40%
50%
60%
70%
80%
90%
100%
2015/16 2016/17 2017/18
Major Claims by mechanism of action
-6.64%
-8.22%
+2.82%
+3.71%
Total claims 46,60348,013 17,987Major claims 18,33618,291
Please Note: Data Consideration IssuesData as at 30th June 2019, extracted in August 2019 for the 2017/18 financial year. Therefore, conclusion on the 2018/2019 progress of Strategy (i.e. the last 12 months of the Strategy’s work) cannot be attributed to any changes in claims data as this information is not yet available.
Significance Testing: significantly higher than 2016/17 claims data, significantly lower than 2016/17 claims dataSource: State Insurance Regulatory Authority - Data as at 30th June 2019, extracted in August 2019 for the 2017/18 financial year
33
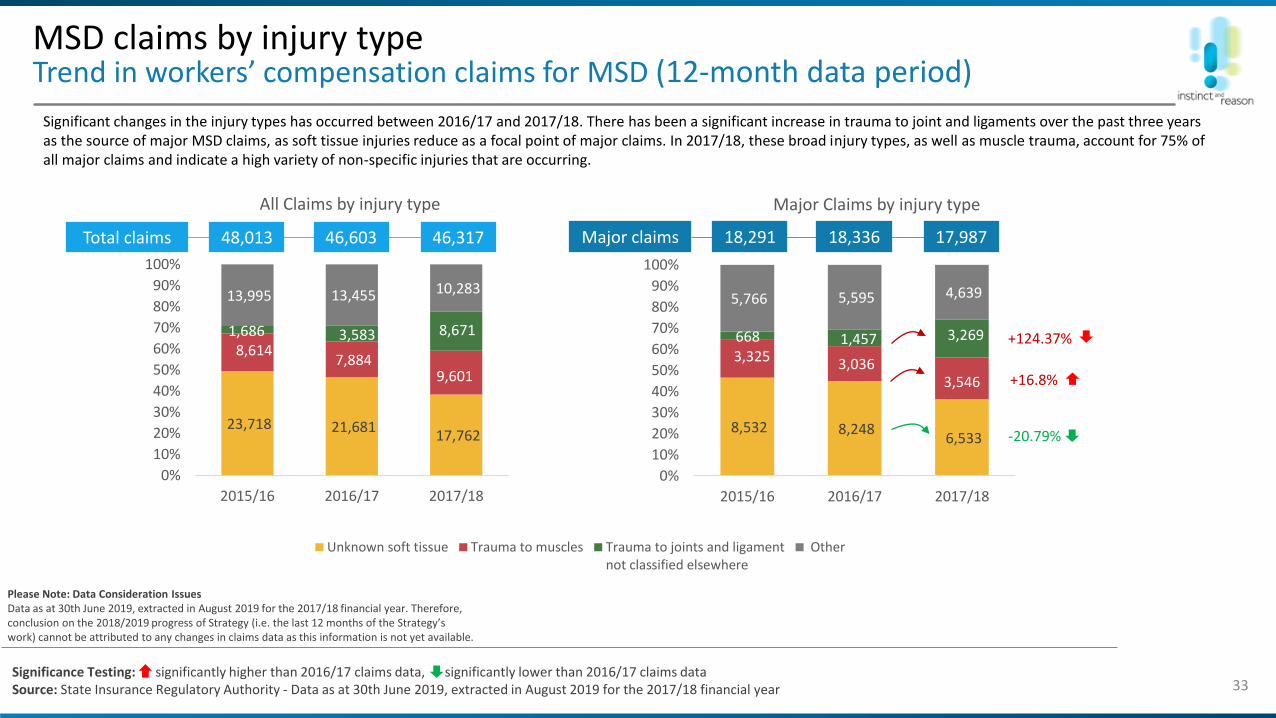
Significant changes in the injury types has occurred between 2016/17 and 2017/18. There has been a significant increase in trauma to joint and ligaments over the past three years as the source of major MSD claims, as soft tissue injuries reduce as a focal point of major claims. In 2017/18, these broad injury types, as well as muscle trauma, account for 75% of all major claims and indicate a high variety of non-specific injuries that are occurring.
MSD claims by injury typeTrend in workers’ compensation claims for MSD (12-month data period)
23,718 21,681 17,762
8,614 7,884
9,601
1,686 3,583 8,671
13,995 13,455 10,283
0%
10%
20%
30%
40%
50%
60%
70%
80%
90%
100%
2015/16 2016/17 2017/18
All Claims by injury type
Unknown soft tissue Trauma to muscles Trauma to joints and ligamentnot classified elsewhere
Other
8,532 8,248 6,533
3,325 3,036 3,546
668 1,457 3,269
5,766 5,595 4,639
0%
10%
20%
30%
40%
50%
60%
70%
80%
90%
100%
2015/16 2016/17 2017/18
Major Claims by injury type
46,317Total claims 46,60348,013 17,987Major claims 18,33618,291
-20.79%
+16.8%
+124.37%
Please Note: Data Consideration IssuesData as at 30th June 2019, extracted in August 2019 for the 2017/18 financial year. Therefore, conclusion on the 2018/2019 progress of Strategy (i.e. the last 12 months of the Strategy’s work) cannot be attributed to any changes in claims data as this information is not yet available.
Significance Testing: significantly higher than 2016/17 claims data, significantly lower than 2016/17 claims dataSource: State Insurance Regulatory Authority - Data as at 30th June 2019, extracted in August 2019 for the 2017/18 financial year
www.instinctandreason.com
3b
PCBU leadership with safe workplacesLeadership support, worker consultation and safe-design principles
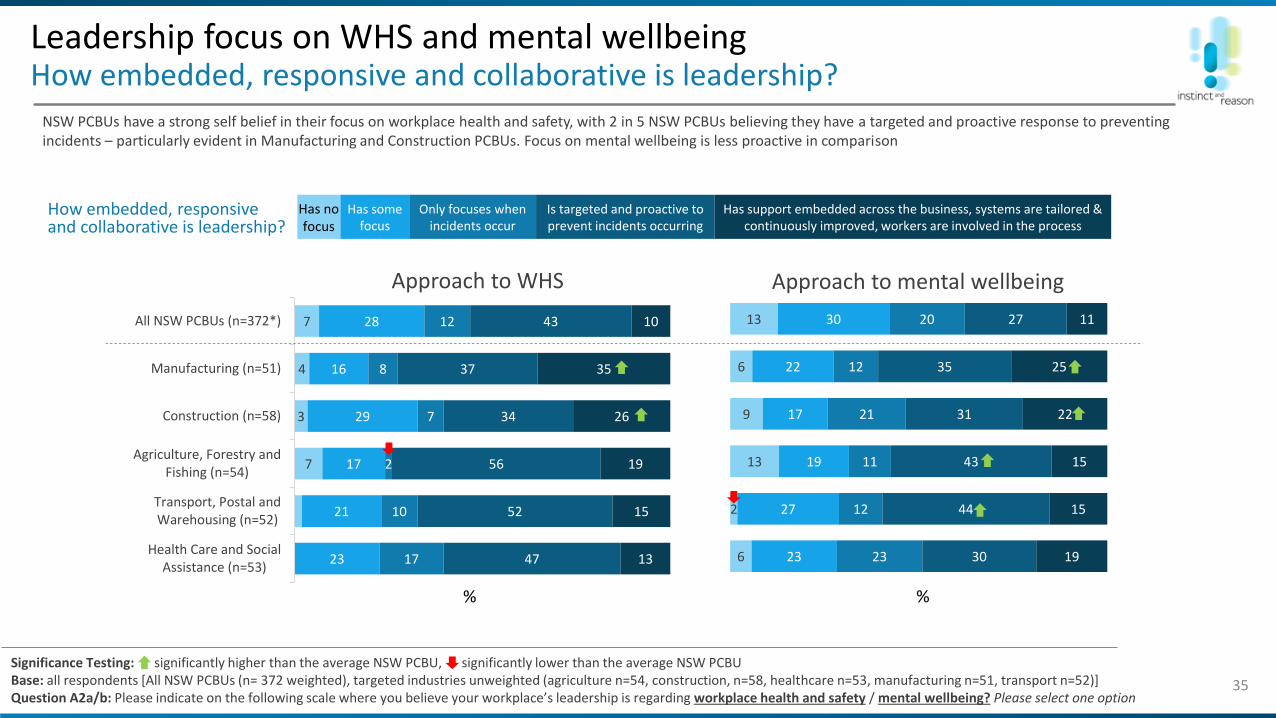
Leadership focus on WHS and mental wellbeingHow embedded, responsive and collaborative is leadership?
35
Significance Testing: significantly higher than the average NSW PCBU, significantly lower than the average NSW PCBUBase: all respondents [All NSW PCBUs (n= 372 weighted), targeted industries unweighted (agriculture n=54, construction, n=58, healthcare n=53, manufacturing n=51, transport n=52)]Question A2a/b: Please indicate on the following scale where you believe your workplace’s leadership is regarding workplace health and safety / mental wellbeing? Please select one option
NSW PCBUs have a strong self belief in their focus on workplace health and safety, with 2 in 5 NSW PCBUs believing they have a targeted and proactive response to preventing incidents – particularly evident in Manufacturing and Construction PCBUs. Focus on mental wellbeing is less proactive in comparison
7
3
4
7
23
21
17
29
16
28
17
10
2
7
8
12
47
52
56
34
37
43
13
15
19
26
35
10
Health Care and SocialAssistance (n=53)
Transport, Postal andWarehousing (n=52)
Agriculture, Forestry andFishing (n=54)
Construction (n=58)
Manufacturing (n=51)
All NSW PCBUs (n=372*)
6
2
13
9
6
13
23
27
19
17
22
30
23
12
11
21
12
20
30
44
43
31
35
27
19
15
15
22
25
11
Approach to WHS Approach to mental wellbeing
% %
Has no focus
Has some focus
Only focuses when incidents occur
Is targeted and proactive to prevent incidents occurring
Has support embedded across the business, systems are tailored & continuously improved, workers are involved in the process
How embedded, responsive and collaborative is leadership?

YES
NoYes, solely responsible
Yes, but the role is not solely focused
Construction(n=58)
919
60 31
Manufacturing(n=51)
8614
61 25
Transport, Postal and Warehousing (n=52)
8515
52 33
Health Care and Social Assistance (n=53)
8515
38 47
Agriculture, Forestry and Fishing(n=54)
5446
19 35
Leadership focus on WHSAllocation of a specific staff position or role responsible for WHS
36
Significance Testing: significantly higher than the average NSW PCBU, significantly lower than the average NSW PCBUBase: all respondents [All NSW PCBUs (n= 372 weighted), targeted industries unweighted (agriculture n=54, construction, n=58, healthcare n=53, manufacturing n=51, transport n=52)] Question A1: Does your organisation have a specific staff position or role that is responsible for health and safety? Please select one option
Yes, solely responsible, 32
Yes, but the role is not solely focused, 41
No, 27
73%
Almost 3 in 4 NSW PCBUs have a role focused on WHS, but only ~1 in 3 have a role solely responsible for WHS. A significantly higher proportion of Manufacturing, Construction and Transport PCBUs have a dedicated WHS role, whereas almost half of the Agriculture PCBUs do not have any WHS position.
The proportion of NSW PCBUs with a WHS role
All NSW PCBUs (n=372)
MSD Strategy Target Industries
%
%
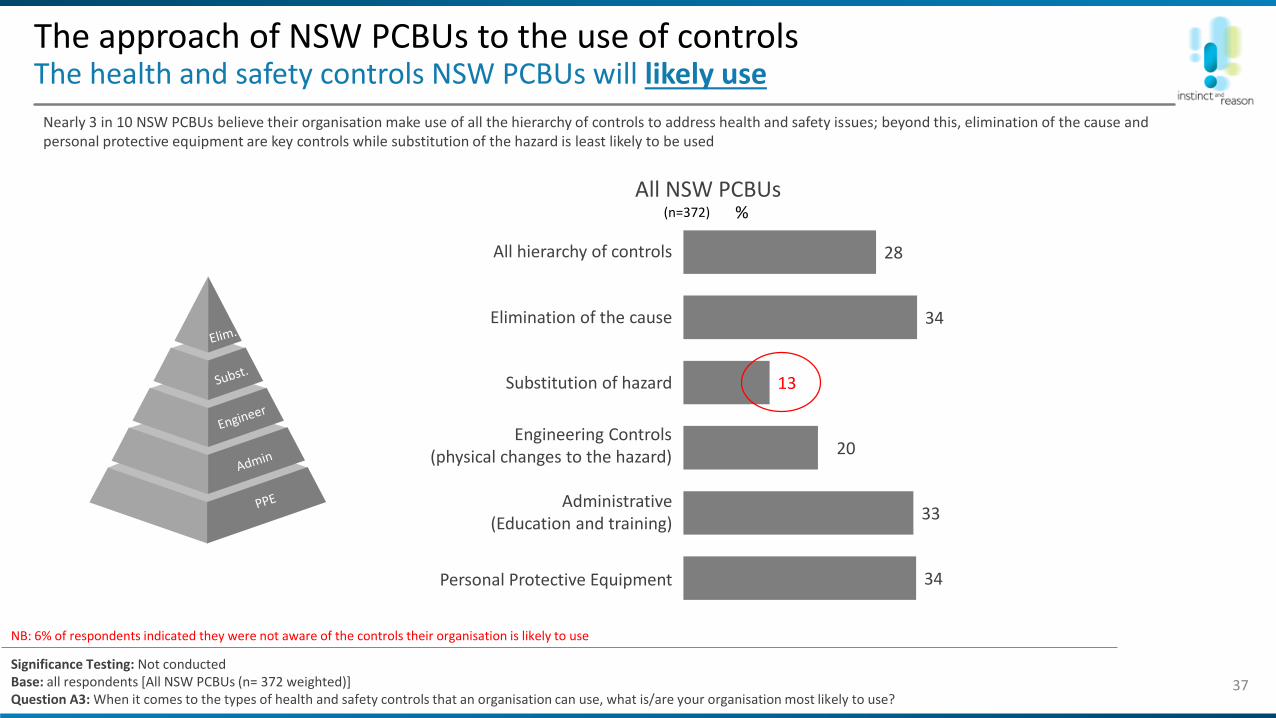
The approach of NSW PCBUs to the use of controlsThe health and safety controls NSW PCBUs will likely use
37
Personal Protective Equipment
Administrative(Education and training)
Engineering Controls(physical changes to the hazard)
Substitution of hazard
Elimination of the cause
Significance Testing: Not conductedBase: all respondents [All NSW PCBUs (n= 372 weighted)]Question A3: When it comes to the types of health and safety controls that an organisation can use, what is/are your organisation most likely to use?
34
33
20
13
34
28All hierarchy of controls
%All NSW PCBUs
Nearly 3 in 10 NSW PCBUs believe their organisation make use of all the hierarchy of controls to address health and safety issues; beyond this, elimination of the cause and personal protective equipment are key controls while substitution of the hazard is least likely to be used
NB: 6% of respondents indicated they were not aware of the controls their organisation is likely to use
(n=372)
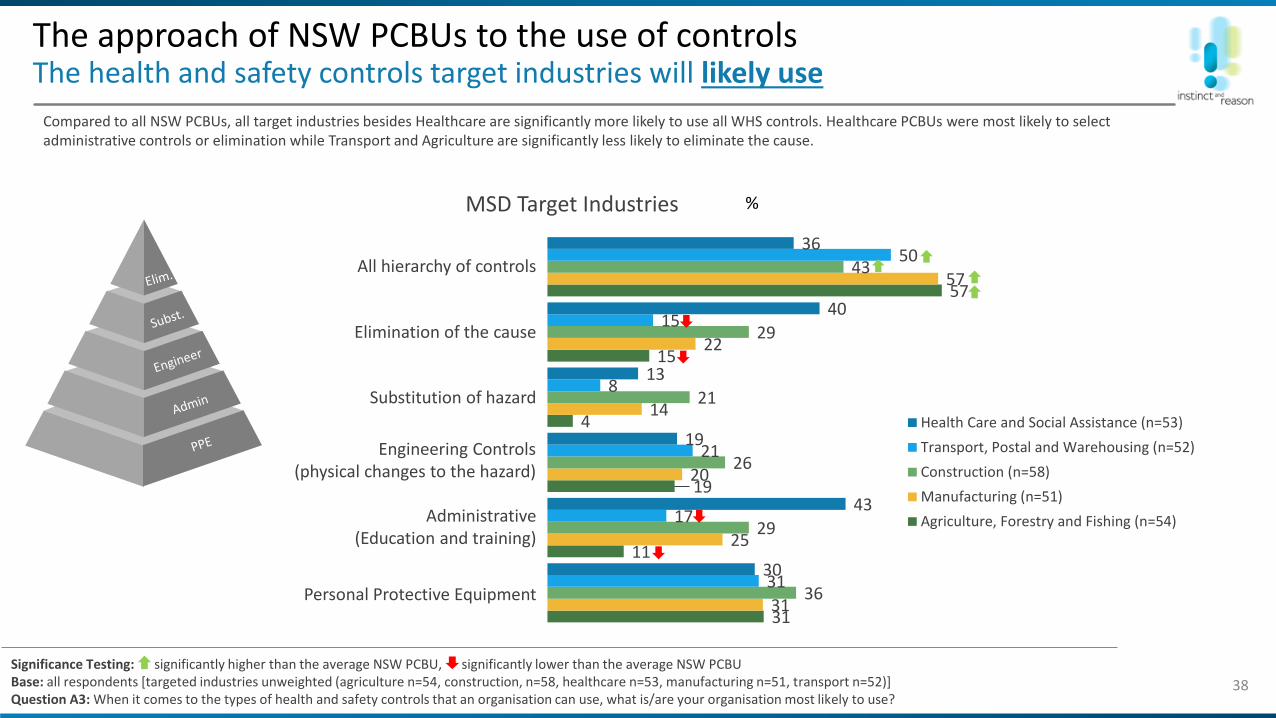
The approach of NSW PCBUs to the use of controlsThe health and safety controls target industries will likely use
38
Personal Protective Equipment
Administrative(Education and training)
Engineering Controls(physical changes to the hazard)
Substitution of hazard
Elimination of the cause
Significance Testing: significantly higher than the average NSW PCBU, significantly lower than the average NSW PCBUBase: all respondents [targeted industries unweighted (agriculture n=54, construction, n=58, healthcare n=53, manufacturing n=51, transport n=52)]Question A3: When it comes to the types of health and safety controls that an organisation can use, what is/are your organisation most likely to use?
31
11
19
4
15
57
31
25
20
14
22
57
36
29
26
21
29
43
31
17
21
8
15
50
30
43
19
13
40
36
Health Care and Social Assistance (n=53)
Transport, Postal and Warehousing (n=52)
Construction (n=58)
Manufacturing (n=51)
Agriculture, Forestry and Fishing (n=54)
All hierarchy of controls
%MSD Target Industries
Compared to all NSW PCBUs, all target industries besides Healthcare are significantly more likely to use all WHS controls. Healthcare PCBUs were most likely to select administrative controls or elimination while Transport and Agriculture are significantly less likely to eliminate the cause.

www.instinctandreason.com
3c
PCBU knowledge and awareness of MSDs
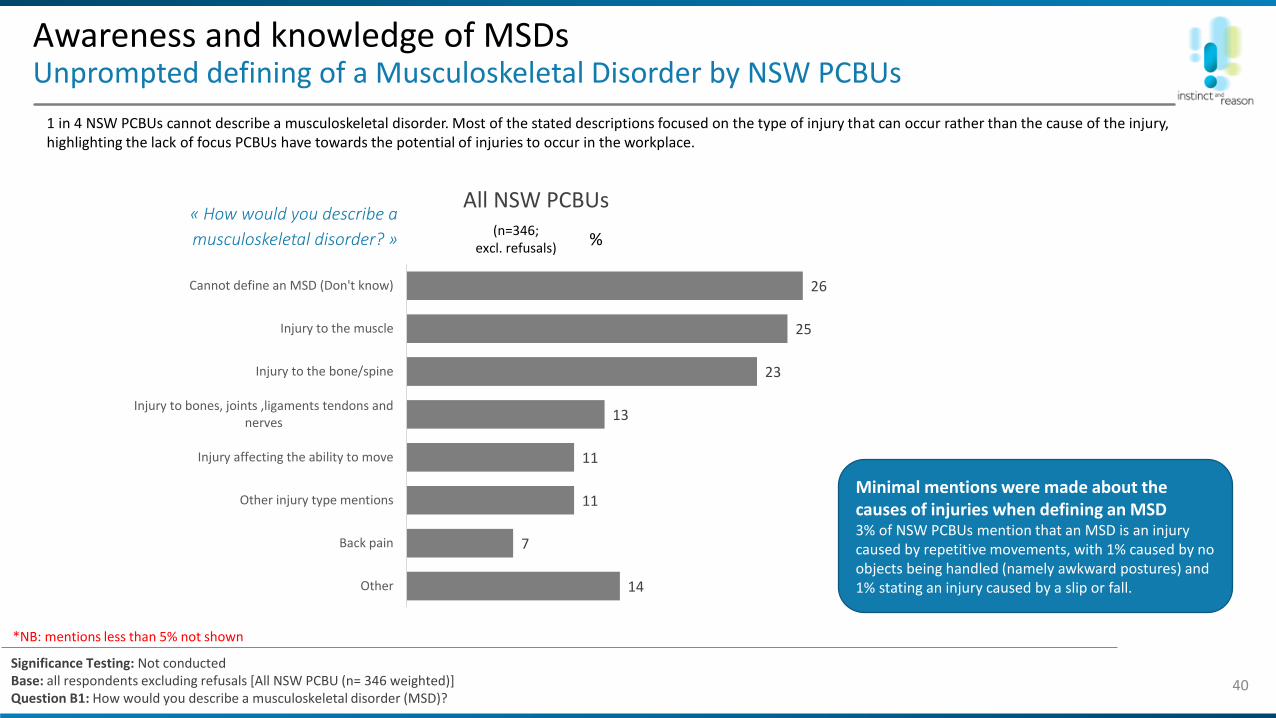
Awareness and knowledge of MSDsUnprompted defining of a Musculoskeletal Disorder by NSW PCBUs
40
1 in 4 NSW PCBUs cannot describe a musculoskeletal disorder. Most of the stated descriptions focused on the type of injury that can occur rather than the cause of the injury, highlighting the lack of focus PCBUs have towards the potential of injuries to occur in the workplace.
26
25
23
13
11
11
7
14
Cannot define an MSD (Don't know)
Injury to the muscle
Injury to the bone/spine
Injury to bones, joints ,ligaments tendons andnerves
Injury affecting the ability to move
Other injury type mentions
Back pain
Other
Significance Testing: Not conductedBase: all respondents excluding refusals [All NSW PCBU (n= 346 weighted)]Question B1: How would you describe a musculoskeletal disorder (MSD)?
All NSW PCBUs« How would you describe a
musculoskeletal disorder? »
Minimal mentions were made about the causes of injuries when defining an MSD3% of NSW PCBUs mention that an MSD is an injury caused by repetitive movements, with 1% caused by no objects being handled (namely awkward postures) and 1% stating an injury caused by a slip or fall.
%
*NB: mentions less than 5% not shown
(n=346; excl. refusals)

Awareness and knowledge of MSDsUnprompted defining of a Musculoskeletal Disorder by target industry
41
Awareness of MSDs looks highest among Healthcare and Manufacturing PCBUs, where only a small proportion cannot describe an MSD and a high proportion defined injury types. Transport, Agriculture and Construction PCBUs have the highest proportion of target industries who cannot describe an MSD.
28
15
15
13
11
7
7
7
6
Cannot define an MSD (Don't know)
Injury to the muscle
Other
Other injury type mentions
Injury to the bone/spine
Injury to joints, ligaments tendons and…
Injury affecting mobility
Injury caused by repetitive movement
Back pain
Significance Testing: Not conductedBase: all respondents excluding refusals [targeted industries unweighted (agriculture n=49, construction, n=47, healthcare n=49, manufacturing n=44, transport n=44)] excluding refusals]Question B1: How would you describe a musculoskeletal disorder (MSD)?
Agriculture, Forestry, Fishing
« How would you describe a
musculoskeletal disorder? »
22
20
20
12
12
12
12
8
6
Injury to joints, ligaments tendons and…
Injury to the muscle
Injury affecting mobility
Cannot define an MSD (Don't know)
Other
Other injury type mentions
Injury to the bone/spine
Back pain
Injury to the musculoskeletol system
Manufacturing
24
17
16
14
7
7
Cannot define an MSD (Don't know)
Injury to the muscle
Other
Injury to the bone/spine
Injury to joints, ligaments tendons and…
Injury affecting mobility
Construction
43
34
25
15
9
9
6
6
Injury to the muscle
Injury to the bone/spine
Injury to joints, ligaments tendons and…
Injury affecting mobility
Cannot define an MSD (Don't know)
Other
Back pain
Injury caused by repetitive movement
Healthcare, Social Assistance
33
19
17
8
8
8
8
Cannot define an MSD (Don't know)
Injury to the bone/spine
Injury to the muscle
Other
Injury to joints, ligaments tendons and…
Injury affecting mobility
Other injury type mentions
Transport, Postal, Warehousing
*NB: mentions less than 5% not shown
%(n=49; excl. refusals)
%(n=47; excl. refusals) %(n=44; excl. refusals)
%(n=44; excl. refusals) %(n=49; excl. refusals)
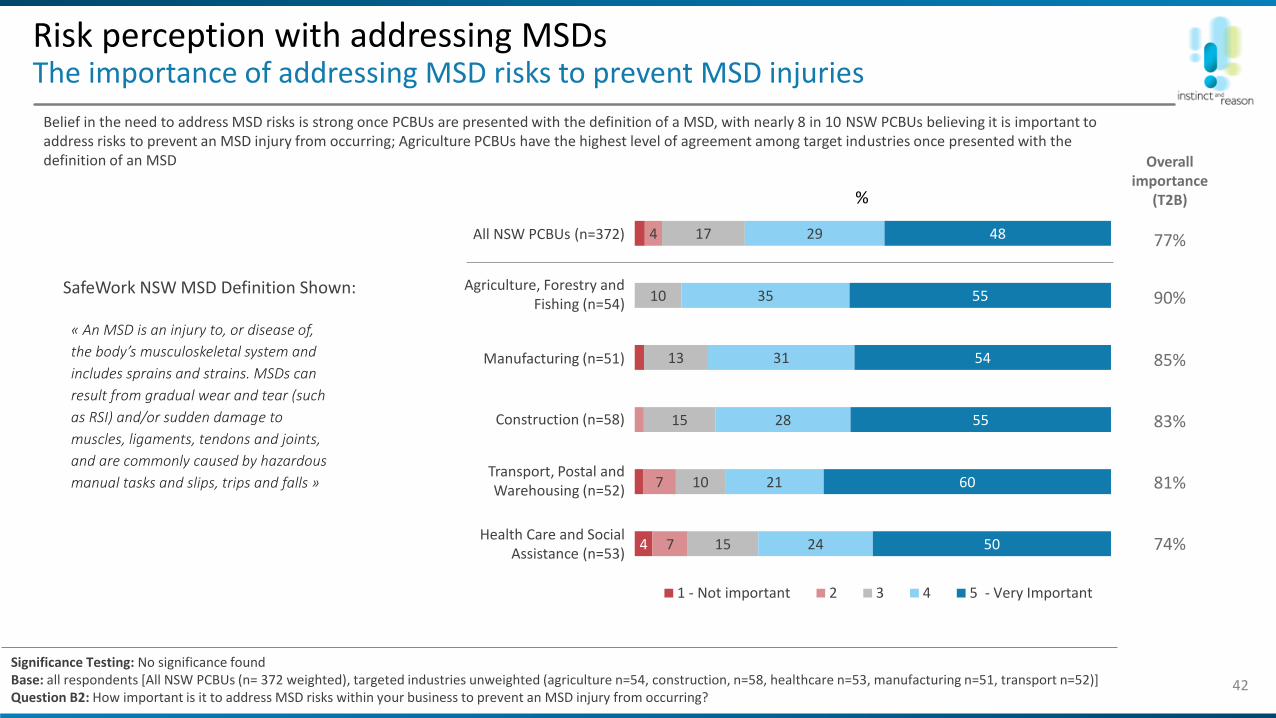
Risk perception with addressing MSDsThe importance of addressing MSD risks to prevent MSD injuries
42
Belief in the need to address MSD risks is strong once PCBUs are presented with the definition of a MSD, with nearly 8 in 10 NSW PCBUs believing it is important to address risks to prevent an MSD injury from occurring; Agriculture PCBUs have the highest level of agreement among target industries once presented with the definition of an MSD
4 7
7
4
15
10
15
13
10
17
24
21
28
31
35
29
50
60
55
54
55
48
1 - Not important 2 3 4 5 - Very Important
Significance Testing: No significance foundBase: all respondents [All NSW PCBUs (n= 372 weighted), targeted industries unweighted (agriculture n=54, construction, n=58, healthcare n=53, manufacturing n=51, transport n=52)]Question B2: How important is it to address MSD risks within your business to prevent an MSD injury from occurring?
« An MSD is an injury to, or disease of,
the body’s musculoskeletal system and
includes sprains and strains. MSDs can
result from gradual wear and tear (such
as RSI) and/or sudden damage to
muscles, ligaments, tendons and joints,
and are commonly caused by hazardous
manual tasks and slips, trips and falls »
SafeWork NSW MSD Definition Shown:
All NSW PCBUs (n=372)
Agriculture, Forestry and Fishing (n=54)
Manufacturing (n=51)
Construction (n=58)
Transport, Postal and Warehousing (n=52)
Health Care and Social Assistance (n=53)
Overall importance
(T2B)
77%
90%
85%
83%
81%
74%
%
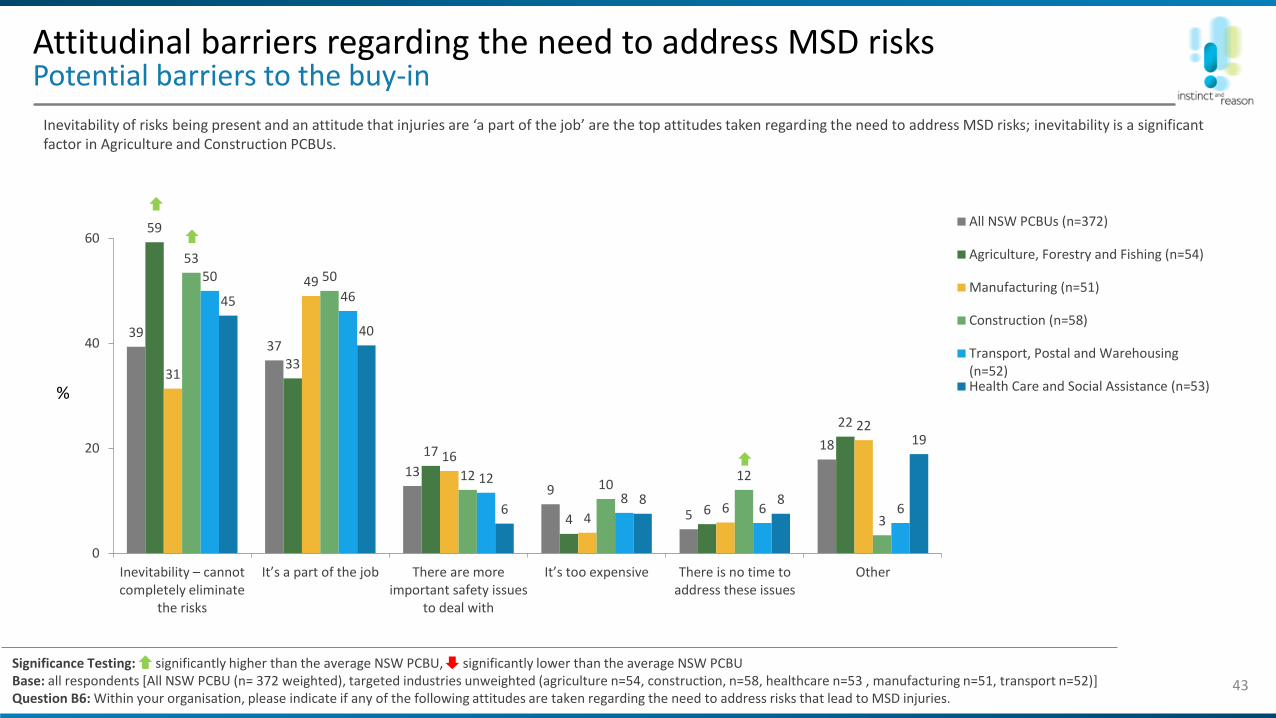
43
Inevitability of risks being present and an attitude that injuries are ‘a part of the job’ are the top attitudes taken regarding the need to address MSD risks; inevitability is a significant factor in Agriculture and Construction PCBUs.
Significance Testing: significantly higher than the average NSW PCBU, significantly lower than the average NSW PCBUBase: all respondents [All NSW PCBU (n= 372 weighted), targeted industries unweighted (agriculture n=54, construction, n=58, healthcare n=53 , manufacturing n=51, transport n=52)]Question B6: Within your organisation, please indicate if any of the following attitudes are taken regarding the need to address risks that lead to MSD injuries.
3937
139
5
18
59
33
17
46
22
31
49
16
46
22
5350
1210
12
3
50
46
12
86 6
45
40
68 8
19
0
20
40
60
Inevitability – cannot completely eliminate
the risks
It’s a part of the job There are moreimportant safety issues
to deal with
It’s too expensive There is no time toaddress these issues
Other
All NSW PCBUs (n=372)
Agriculture, Forestry and Fishing (n=54)
Manufacturing (n=51)
Construction (n=58)
Transport, Postal and Warehousing(n=52)Health Care and Social Assistance (n=53)%
Attitudinal barriers regarding the need to address MSD risksPotential barriers to the buy-in
44
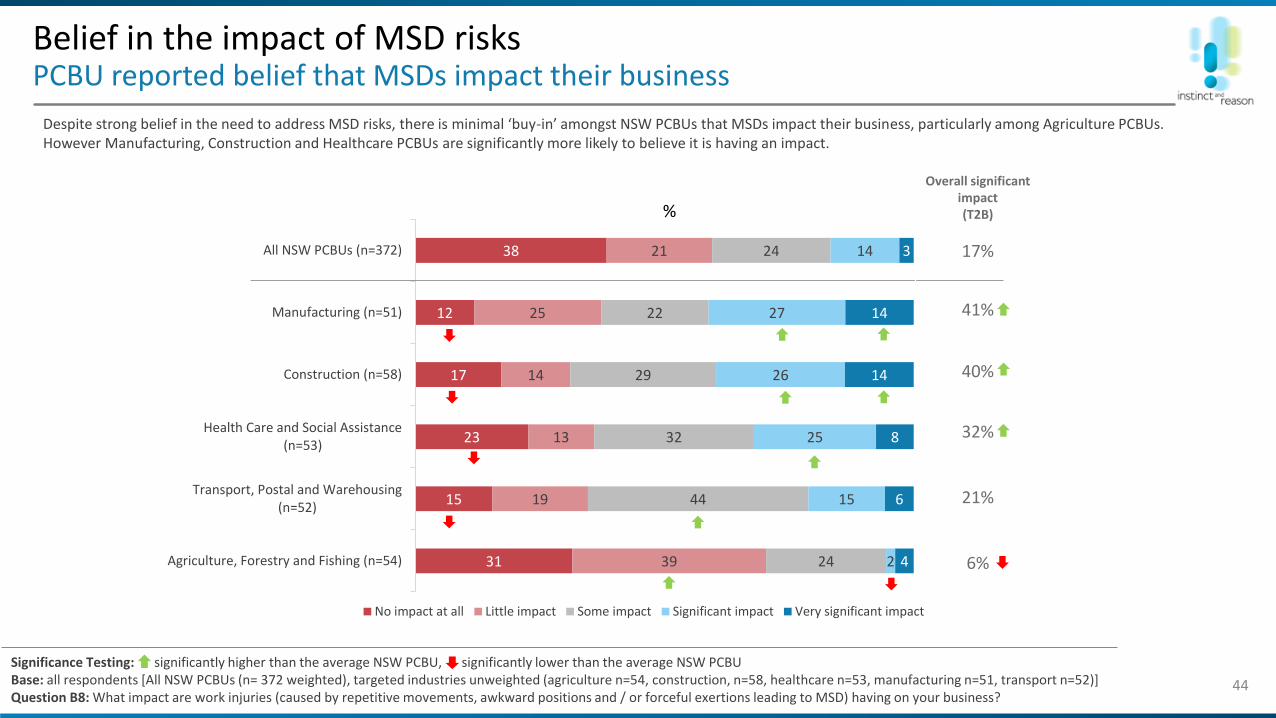
Despite strong belief in the need to address MSD risks, there is minimal ‘buy-in’ amongst NSW PCBUs that MSDs impact their business, particularly among Agriculture PCBUs. However Manufacturing, Construction and Healthcare PCBUs are significantly more likely to believe it is having an impact.
Belief in the impact of MSD risksPCBU reported belief that MSDs impact their business
31
15
23
17
12
38
39
19
13
14
25
21
24
44
32
29
22
24
2
15
25
26
27
14
4
6
8
14
14
3
Agriculture, Forestry and Fishing (n=54)
Transport, Postal and Warehousing(n=52)
Health Care and Social Assistance(n=53)
Construction (n=58)
Manufacturing (n=51)
All NSW PCBUs (n=372)
No impact at all Little impact Some impact Significant impact Very significant impact
Significance Testing: significantly higher than the average NSW PCBU, significantly lower than the average NSW PCBUBase: all respondents [All NSW PCBUs (n= 372 weighted), targeted industries unweighted (agriculture n=54, construction, n=58, healthcare n=53, manufacturing n=51, transport n=52)]Question B8: What impact are work injuries (caused by repetitive movements, awkward positions and / or forceful exertions leading to MSD) having on your business?
Overall significant impact(T2B)
17%
41%
40%
32%
21%
6%
%
www.instinctandreason.com
3d
PCBU willingness and ability to address MSD risks

46
Willingness to address MSD risks is moderate among NSW PCBUs, with 1 in 2 indicating a desire to do so. Manufacturing PCBUs have significantly higher willingness, where 3 in 4 PCBUs are willing; all other target industries remain similar to the state average.
Willingness to address MSD risksNSW PCBU reported willingness to address MSD risks
Significance Testing: significantly higher than the average NSW PCBU, significantly lower than the average NSW PCBUBase: all respondents [All NSW PCBUs (n= 372 weighted), targeted industries unweighted (agriculture n=54, construction, n=58, healthcare n=53, manufacturing n=51, transport n=52)]Question B9: How willing is your organisation to redesign work to reduce or eliminate repetitive movements, awkward positions and / or forceful exertions that lead to MSD?
6
4
7
6
7
6
11
7
8
33
26
26
32
22
30
19
20
24
25
31
23
37
39
36
36
43
32
Transport, Postal andWarehousing (n=52)
Agriculture, Forestry andFishing (n=54)
Construction (n=58)
Health Care and SocialAssistance (n=53)
Manufacturing (n=51)
All NSW PCBUs (n=372)
1 - Not willing 2 3 4 5 - Very willing
Willingness to reduce/eliminate risks that lead to MSDsVery willing
(T2B)
55%
75%
60%
60%
59%
56%
%
NSW PCBU experience with MSDs in the last 12 monthsType of injury and reported changes occurring
47
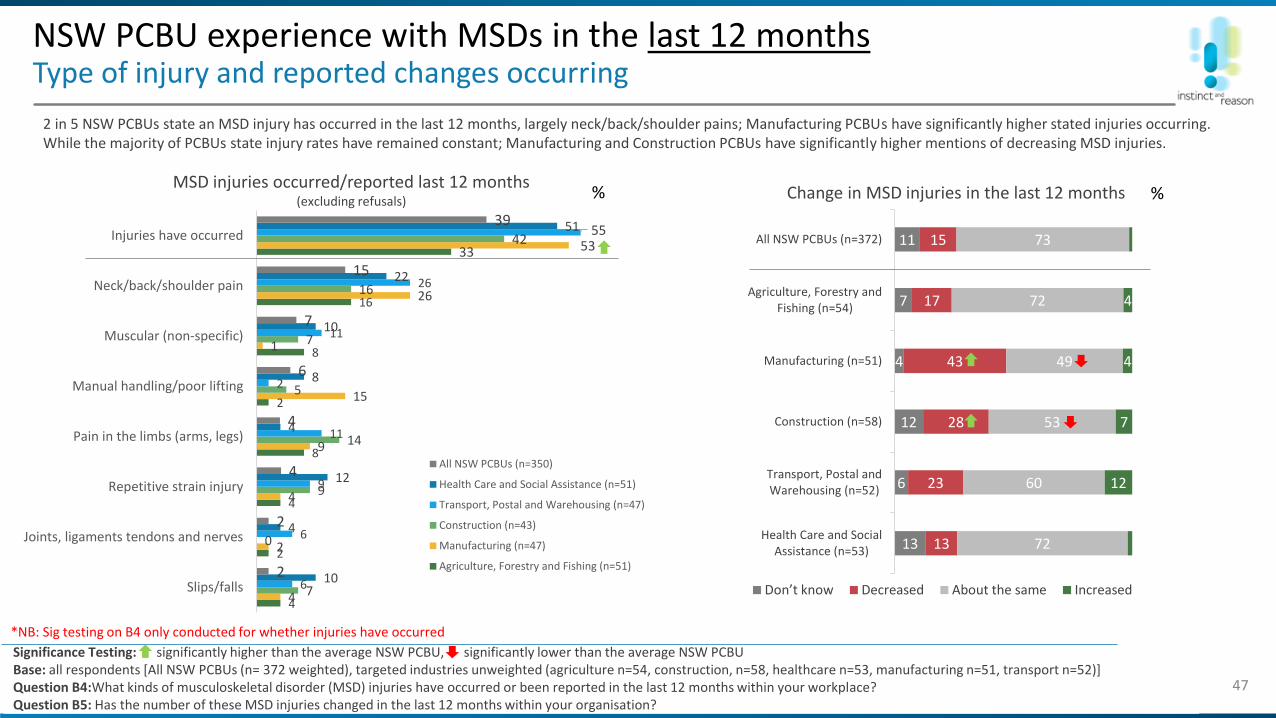
2 in 5 NSW PCBUs state an MSD injury has occurred in the last 12 months, largely neck/back/shoulder pains; Manufacturing PCBUs have significantly higher stated injuries occurring. While the majority of PCBUs state injury rates have remained constant; Manufacturing and Construction PCBUs have significantly higher mentions of decreasing MSD injuries.
13
6
12
4
7
11
13
23
28
43
17
15
72
60
53
49
72
73
12
7
4
4
Health Care and SocialAssistance (n=53)
Transport, Postal andWarehousing (n=52)
Construction (n=58)
Manufacturing (n=51)
Agriculture, Forestry andFishing (n=54)
All NSW PCBUs (n=372)
Don’t know Decreased About the same Increased
Significance Testing: significantly higher than the average NSW PCBU, significantly lower than the average NSW PCBUBase: all respondents [All NSW PCBUs (n= 372 weighted), targeted industries unweighted (agriculture n=54, construction, n=58, healthcare n=53, manufacturing n=51, transport n=52)]Question B4:What kinds of musculoskeletal disorder (MSD) injuries have occurred or been reported in the last 12 months within your workplace?Question B5: Has the number of these MSD injuries changed in the last 12 months within your organisation?
4
2
4
8
2
8
16
33
4
2
4
9
15
1
26
53
7
0
9
14
5
7
16
42
6
6
9
11
2
11
26
55
10
4
12
4
8
10
22
51
2
2
4
4
6
7
15
39
Slips/falls
Joints, ligaments tendons and nerves
Repetitive strain injury
Pain in the limbs (arms, legs)
Manual handling/poor lifting
Muscular (non-specific)
Neck/back/shoulder pain
Injuries have occurred
All NSW PCBUs (n=350)
Health Care and Social Assistance (n=51)
Transport, Postal and Warehousing (n=47)
Construction (n=43)
Manufacturing (n=47)
Agriculture, Forestry and Fishing (n=51)
%
*NB: Sig testing on B4 only conducted for whether injuries have occurred
MSD injuries occurred/reported last 12 months (excluding refusals) %Change in MSD injuries in the last 12 months
Controls NSW PCBUs have changed to address MSD risks Those changes made in the last 6 months
48
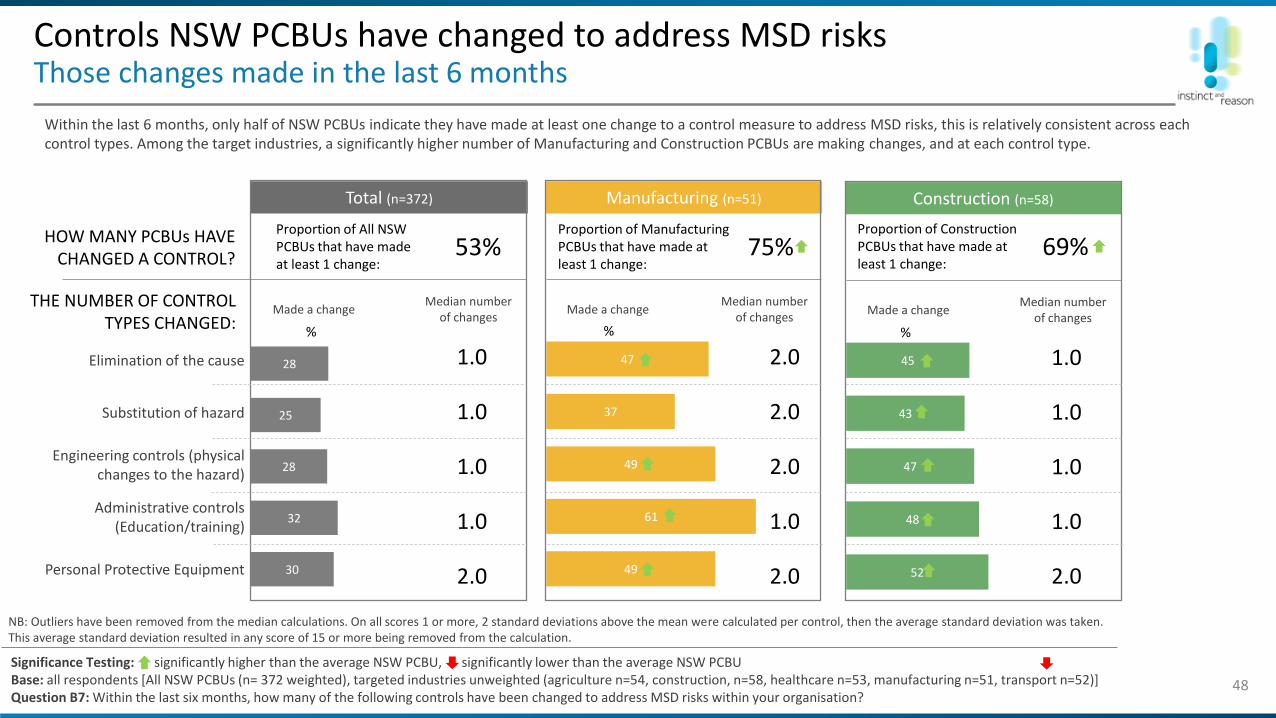
Within the last 6 months, only half of NSW PCBUs indicate they have made at least one change to a control measure to address MSD risks, this is relatively consistent across each control types. Among the target industries, a significantly higher number of Manufacturing and Construction PCBUs are making changes, and at each control type.
Significance Testing: significantly higher than the average NSW PCBU, significantly lower than the average NSW PCBUBase: all respondents [All NSW PCBUs (n= 372 weighted), targeted industries unweighted (agriculture n=54, construction, n=58, healthcare n=53, manufacturing n=51, transport n=52)]Question B7: Within the last six months, how many of the following controls have been changed to address MSD risks within your organisation?
30
32
28
25
28
49
61
49
37
47
Total (n=372) Manufacturing (n=51)
53% 75%
Median number of changes
%
Proportion of All NSW PCBUs that have made at least 1 change:
Elimination of the cause
Substitution of hazard
Engineering controls (physical changes to the hazard)
Administrative controls (Education/training)
Personal Protective Equipment
Proportion of Manufacturing PCBUs that have made at least 1 change:
HOW MANY PCBUs HAVE CHANGED A CONTROL?
THE NUMBER OF CONTROL TYPES CHANGED:
Made a changeMedian number
of changes%
Made a change
1.0
1.0
1.0
1.0
2.0
2.0
2.0
2.0
1.0
2.0
NB: Outliers have been removed from the median calculations. On all scores 1 or more, 2 standard deviations above the mean were calculated per control, then the average standard deviation was taken. This average standard deviation resulted in any score of 15 or more being removed from the calculation.
52
48
47
43
45
69%
Construction (n=58)
Proportion of Construction PCBUs that have made at least 1 change:
%
1.0
1.0
1.0
1.0
2.0
Median number of changes
Made a change
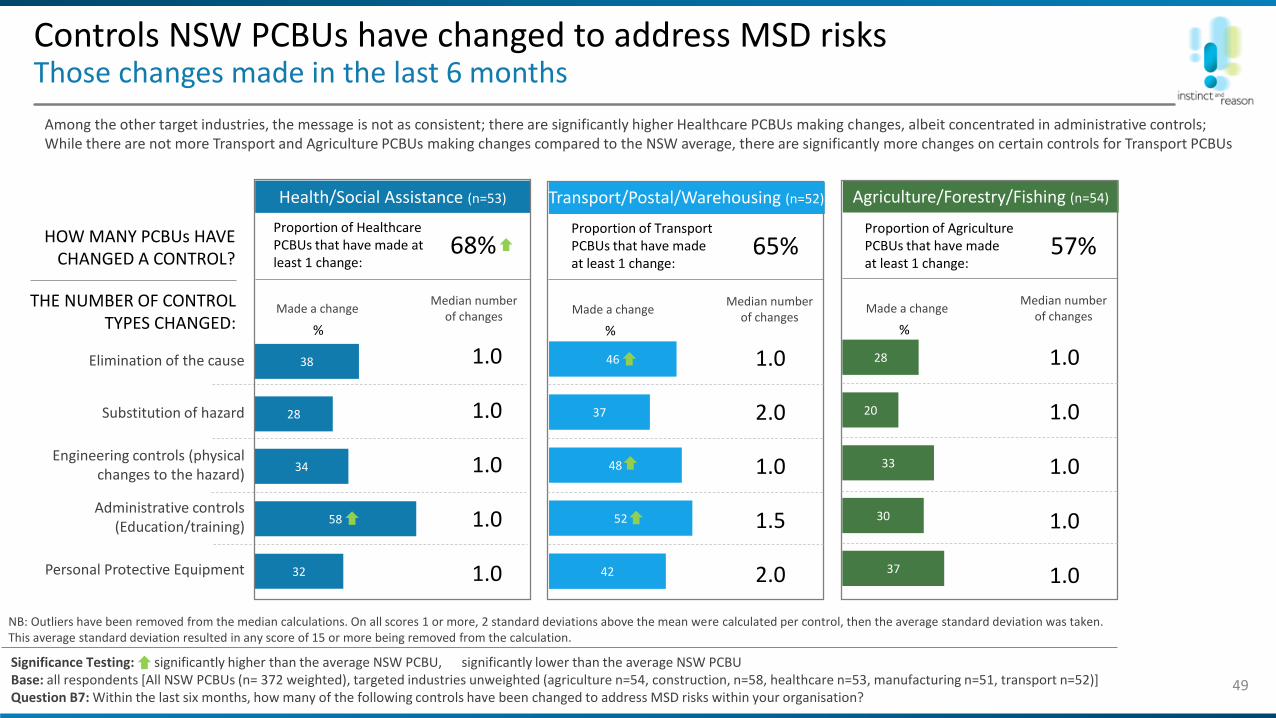
Elimination of the cause
Substitution of hazard
Engineering controls (physical changes to the hazard)
Administrative controls (Education/training)
Personal Protective Equipment
Controls NSW PCBUs have changed to address MSD risksThose changes made in the last 6 months
49
Among the other target industries, the message is not as consistent; there are significantly higher Healthcare PCBUs making changes, albeit concentrated in administrative controls; While there are not more Transport and Agriculture PCBUs making changes compared to the NSW average, there are significantly more changes on certain controls for Transport PCBUs
Significance Testing: significantly higher than the average NSW PCBU, significantly lower than the average NSW PCBUBase: all respondents [All NSW PCBUs (n= 372 weighted), targeted industries unweighted (agriculture n=54, construction, n=58, healthcare n=53, manufacturing n=51, transport n=52)]Question B7: Within the last six months, how many of the following controls have been changed to address MSD risks within your organisation?
42
52
48
37
46
65%
Transport/Postal/Warehouse 52)
Proportion of Transport PCBUs that have made at least 1 change:
Transport/Postal/Warehousing (n=52)
HOW MANY PCBUs HAVE CHANGED A CONTROL?
THE NUMBER OF CONTROL TYPES CHANGED: %
1.0
2.0
1.0
1.5
2.0
Median number of changes
Made a change
NB: Outliers have been removed from the median calculations. On all scores 1 or more, 2 standard deviations above the mean were calculated per control, then the average standard deviation was taken. This average standard deviation resulted in any score of 15 or more being removed from the calculation.
37
30
33
20
28
Agriculture/Forestry/Fishing (n=54)
57%
Median number of changes
%
Proportion of Agriculture PCBUs that have made at least 1 change:
Made a change
1.0
1.0
1.0
1.0
1.032
58
34
28
38
68%
Health/Social Assistance (n=53)
Proportion of Healthcare PCBUs that have made at least 1 change:
%
1.0
1.0
1.0
1.0
1.0
Median number of changes
Made a change
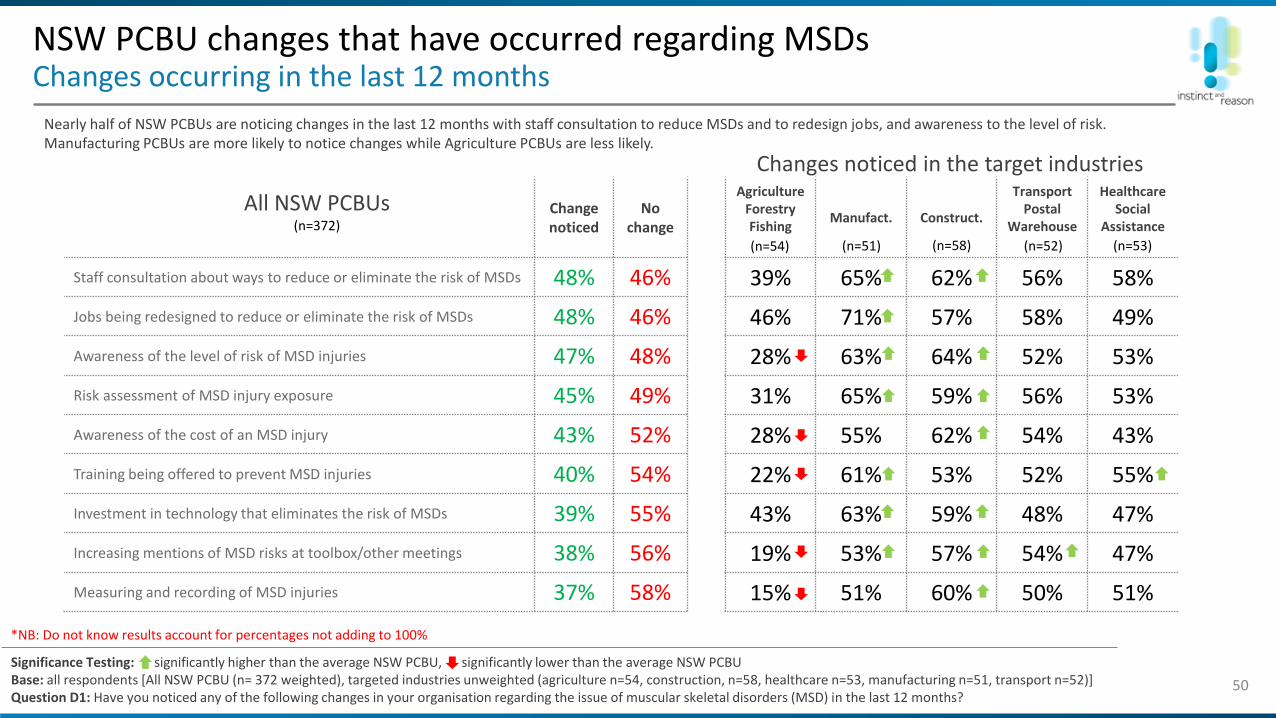
NSW PCBU changes that have occurred regarding MSDsChanges occurring in the last 12 months
50
Nearly half of NSW PCBUs are noticing changes in the last 12 months with staff consultation to reduce MSDs and to redesign jobs, and awareness to the level of risk. Manufacturing PCBUs are more likely to notice changes while Agriculture PCBUs are less likely.
Significance Testing: significantly higher than the average NSW PCBU, significantly lower than the average NSW PCBUBase: all respondents [All NSW PCBU (n= 372 weighted), targeted industries unweighted (agriculture n=54, construction, n=58, healthcare n=53, manufacturing n=51, transport n=52)]Question D1: Have you noticed any of the following changes in your organisation regarding the issue of muscular skeletal disorders (MSD) in the last 12 months?
Changes noticed in the target industries
Change noticed
No change
Agriculture Forestry Fishing
Manufact. Construct.
Transport Postal
Warehouse
HealthcareSocial
Assistance
Staff consultation about ways to reduce or eliminate the risk of MSDs 48% 46% 39% 65% 62% 56% 58%
Jobs being redesigned to reduce or eliminate the risk of MSDs 48% 46% 46% 71% 57% 58% 49%
Awareness of the level of risk of MSD injuries 47% 48% 28% 63% 64% 52% 53%
Risk assessment of MSD injury exposure 45% 49% 31% 65% 59% 56% 53%
Awareness of the cost of an MSD injury 43% 52% 28% 55% 62% 54% 43%
Training being offered to prevent MSD injuries 40% 54% 22% 61% 53% 52% 55%
Investment in technology that eliminates the risk of MSDs 39% 55% 43% 63% 59% 48% 47%
Increasing mentions of MSD risks at toolbox/other meetings 38% 56% 19% 53% 57% 54% 47%
Measuring and recording of MSD injuries 37% 58% 15% 51% 60% 50% 51%
All NSW PCBUs
*NB: Do not know results account for percentages not adding to 100%
(n=372)
(n=54) (n=51) (n=58) (n=52) (n=53)
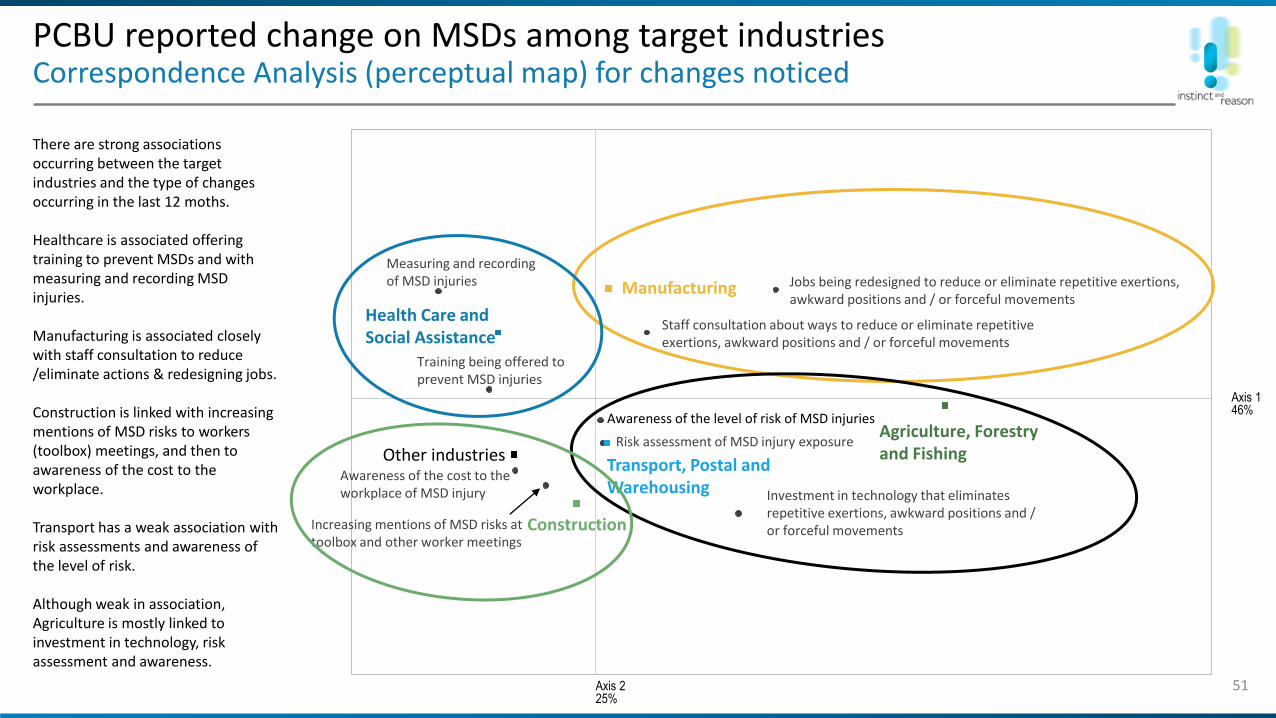
PCBU reported change on MSDs among target industriesCorrespondence Analysis (perceptual map) for changes noticed
51
There are strong associations occurring between the target industries and the type of changes occurring in the last 12 moths.
Healthcare is associated offering training to prevent MSDs and with measuring and recording MSD injuries.
Manufacturing is associated closely with staff consultation to reduce /eliminate actions & redesigning jobs.
Construction is linked with increasing mentions of MSD risks to workers (toolbox) meetings, and then to awareness of the cost to the workplace.
Transport has a weak association with risk assessments and awareness of the level of risk.
Although weak in association, Agriculture is mostly linked to investment in technology, risk assessment and awareness.
Awareness of the level of risk of MSD injuries
Awareness of the cost to the workplace of MSD injury
Measuring and recording of MSD injuries
Risk assessment of MSD injury exposure
Increasing mentions of MSD risks at toolbox and other worker meetings
Training being offered to prevent MSD injuries
Staff consultation about ways to reduce or eliminate repetitive exertions, awkward positions and / or forceful movements
Jobs being redesigned to reduce or eliminate repetitive exertions, awkward positions and / or forceful movements
Investment in technology that eliminates repetitive exertions, awkward positions and / or forceful movements
Agriculture, Forestry and Fishing
Manufacturing
Construction
Transport, Postal and Warehousing
Health Care and Social Assistance
Other industries
Axis 225%
Axis 146%
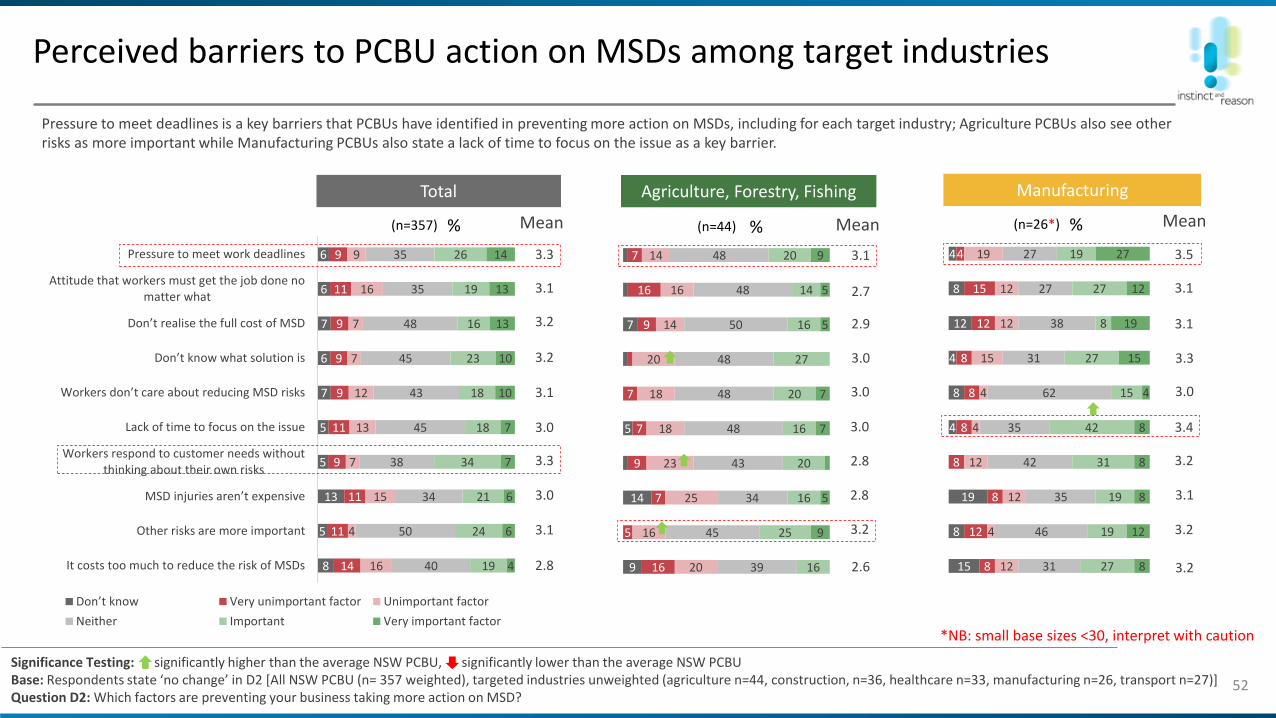
52
Pressure to meet deadlines is a key barriers that PCBUs have identified in preventing more action on MSDs, including for each target industry; Agriculture PCBUs also see other risks as more important while Manufacturing PCBUs also state a lack of time to focus on the issue as a key barrier.
Perceived barriers to PCBU action on MSDs among target industries
8
5
13
5
5
7
6
7
6
6
14
11
11
9
11
9
9
9
11
9
16
4
15
7
13
12
7
7
16
9
40
50
34
38
45
43
45
48
35
35
19
24
21
34
18
18
23
16
19
26
4
6
6
7
7
10
10
13
13
14
It costs too much to reduce the risk of MSDs
Other risks are more important
MSD injuries aren’t expensive
Workers respond to customer needs withoutthinking about their own risks
Lack of time to focus on the issue
Workers don’t care about reducing MSD risks
Don’t know what solution is
Don’t realise the full cost of MSD
Attitude that workers must get the job done nomatter what
Pressure to meet work deadlines
Don’t know Very unimportant factor Unimportant factor
Neither Important Very important factor
3.3
9
14
5
7
16
5
7
9
7
7
9
16
7
20
16
25
23
18
18
20
14
16
14
39
45
34
43
48
48
48
50
48
48
16
25
16
20
16
20
27
16
14
20
9
5
7
7
5
5
9
15
8
19
4
8
4
12
8
4
8
12
8
8
8
8
8
12
15
4
12
4
12
12
4
4
15
12
12
19
31
46
35
42
35
62
31
38
27
27
27
19
19
31
42
15
27
8
27
19
8
12
8
8
8
4
15
19
12
27
3.1
3.2
3.2
3.1
3.0
3.3
3.0
3.1
2.8
3.1
2.7
2.9
3.0
3.0
3.0
2.8
2.8
3.2
2.6
3.5
3.1
3.1
3.3
3.0
3.4
3.2
3.1
3.2
3.2
Significance Testing: significantly higher than the average NSW PCBU, significantly lower than the average NSW PCBUBase: Respondents state ‘no change’ in D2 [All NSW PCBU (n= 357 weighted), targeted industries unweighted (agriculture n=44, construction, n=36, healthcare n=33, manufacturing n=26, transport n=27)]Question D2: Which factors are preventing your business taking more action on MSD?
Total Agriculture, Forestry, Fishing Manufacturing
Mean Mean Mean%(n=357) %(n=44) %(n=26*)
*NB: small base sizes <30, interpret with caution
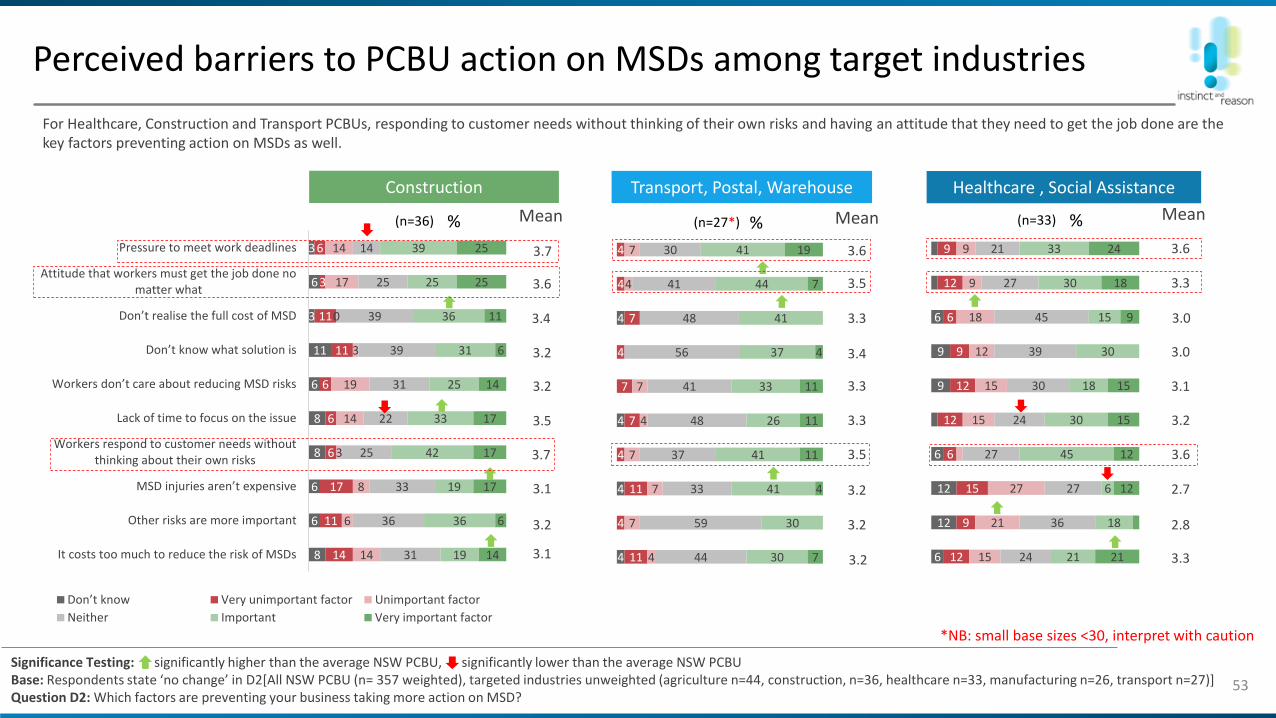
53
For Healthcare, Construction and Transport PCBUs, responding to customer needs without thinking of their own risks and having an attitude that they need to get the job done are the key factors preventing action on MSDs as well.
Perceived barriers to PCBU action on MSDs among target industries
4
4
4
4
11
4
11
4
7
7
4
7
4
4
4
7
7
7
4
7
4
7
44
59
33
37
48
41
56
48
41
30
30
30
41
41
26
33
37
41
44
41
7
4
11
11
11
4
7
19
6
12
12
6
9
9
6
12
9
15
6
12
12
9
6
12
9
15
21
27
15
15
12
18
9
9
24
36
27
27
24
30
39
45
27
21
21
18
6
45
30
18
30
15
30
33
21
12
12
15
15
9
18
243.7
3.6
3.4
3.2
3.2
3.5
3.7
3.1
3.2
3.1
3.6
3.5
3.3
3.4
3.3
3.3
3.5
3.2
3.2
3.2
3.6
3.3
3.0
3.0
3.1
3.2
3.6
2.7
2.8
3.3
Significance Testing: significantly higher than the average NSW PCBU, significantly lower than the average NSW PCBUBase: Respondents state ‘no change’ in D2[All NSW PCBU (n= 357 weighted), targeted industries unweighted (agriculture n=44, construction, n=36, healthcare n=33, manufacturing n=26, transport n=27)]Question D2: Which factors are preventing your business taking more action on MSD?
8
6
6
8
8
6
11
3
6
3
14
11
17
6
6
6
11
11
3
6
14
6
8
3
14
19
3
0
17
14
31
36
33
25
22
31
39
39
25
14
19
36
19
42
33
25
31
36
25
39
14
6
17
17
17
14
6
11
25
25
It costs too much to reduce the risk of MSDs
Other risks are more important
MSD injuries aren’t expensive
Workers respond to customer needs withoutthinking about their own risks
Lack of time to focus on the issue
Workers don’t care about reducing MSD risks
Don’t know what solution is
Don’t realise the full cost of MSD
Attitude that workers must get the job done nomatter what
Pressure to meet work deadlines
Don’t know Very unimportant factor Unimportant factor
Neither Important Very important factor
Construction Transport, Postal, Warehouse Healthcare , Social Assistance
Mean Mean Mean%(n=36) %(n=27*) %(n=33)
*NB: small base sizes <30, interpret with caution
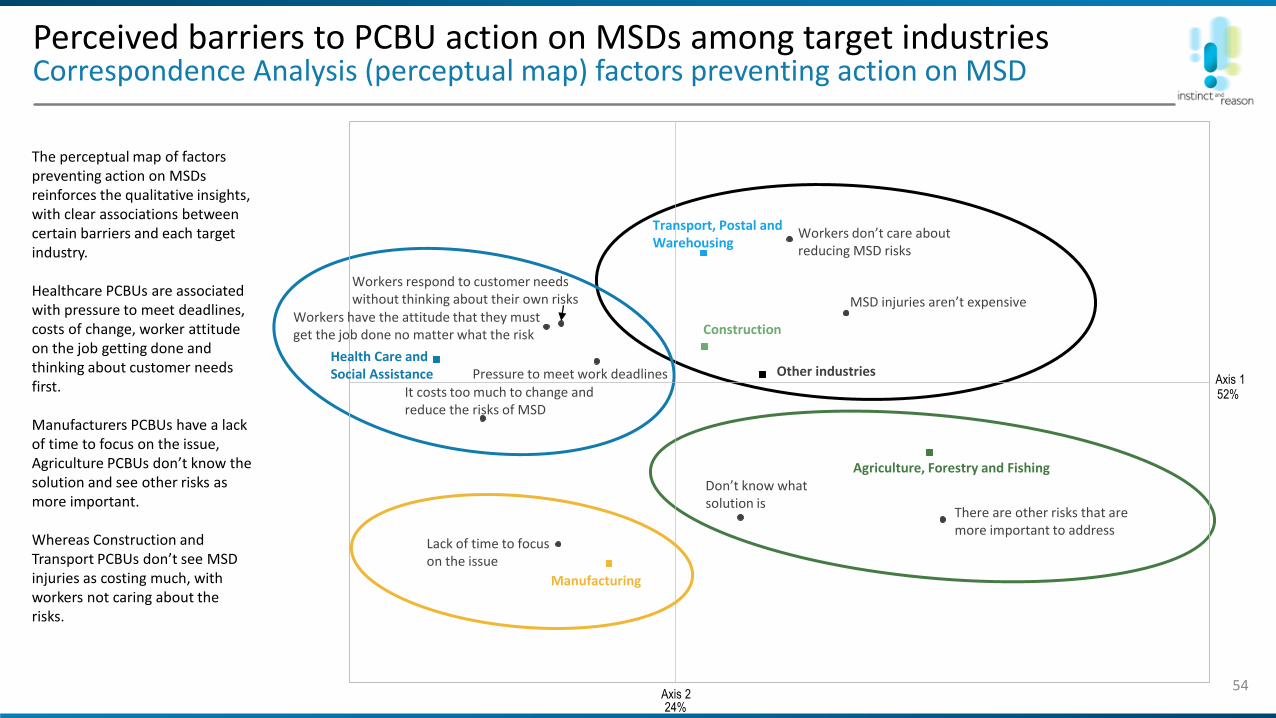
54
Workers don’t care about reducing MSD risks
It costs too much to change and reduce the risks of MSD
There are other risks that are more important to address
Workers respond to customer needs without thinking about their own risks
Workers have the attitude that they must get the job done no matter what the risk
Pressure to meet work deadlines
Don’t know what solution is
MSD injuries aren’t expensive
Lack of time to focus on the issue
Agriculture, Forestry and Fishing
Manufacturing
Construction
Health Care and Social Assistance Other industries
Axis 224%
Axis 152%
Transport, Postal and Warehousing
Perceived barriers to PCBU action on MSDs among target industriesCorrespondence Analysis (perceptual map) factors preventing action on MSD
The perceptual map of factors preventing action on MSDs reinforces the qualitative insights, with clear associations between certain barriers and each target industry.
Healthcare PCBUs are associated with pressure to meet deadlines, costs of change, worker attitude on the job getting done and thinking about customer needs first.
Manufacturers PCBUs have a lack of time to focus on the issue, Agriculture PCBUs don’t know the solution and see other risks as more important.
Whereas Construction and Transport PCBUs don’t see MSD injuries as costing much, with workers not caring about the risks.

PBCU MSD SegmentationSheth-Frazier analysis of actual behaviour changes and a willingness to address
55
Savvy
- negative+ positive
Willing and are: 15%Highly willing to address MSD risks and have noticed substantial changes in the last 12 months across MSD knowledge and behaviour improvements.
Unwilling and are: 8%Unwilling to address MSD risks but have noticed substantial changes in the last 12 months across MSD knowledge and behaviour improvements.
Unwilling and are not: 36%Unwilling to address MSD risks, but minimal/no changes have been noticed in the last 12 months across MSD knowledge and behaviour improvements.
Willing and are not: 40%Highly willing to address MSD risks, but minimal/no changes have been noticed in the last 12 months across MSD knowledge and behaviour improvements.
Behaviourchanges [Substantial
organisation changes noticed regarding
MSDs in the last 12 months (D1)]
Willingness to address MSD risks (B9)
How to address: Reinforce and maintain their capability How to address: Educate/encourage attitude change
How to address: Facilitate behaviour change How to address: Confront (Shock, comply, fine)
+ po
sitive-
negative
Question B9: How willing is your organisation to redesign work to reduce or eliminate repetitive movements, awkward positions and / or forceful exertions that lead to MSD?Question D1: Have you noticed any of the following changes in your organisation regarding the issue of muscular skeletal disorders (MSD) in the last 12 months?
[NB: Each D1 response was allocated either 0 points for
no change, 1 point for partial change and 2 points for
substantial change. To be classified as positive
behaviour, responses need to sum to 9 or more points
across all D1 metrics]
[NB: B9 responses were split into a rank of 4 or 5 (very important) for positive willingness and rank 1 -3 for negative willingness]
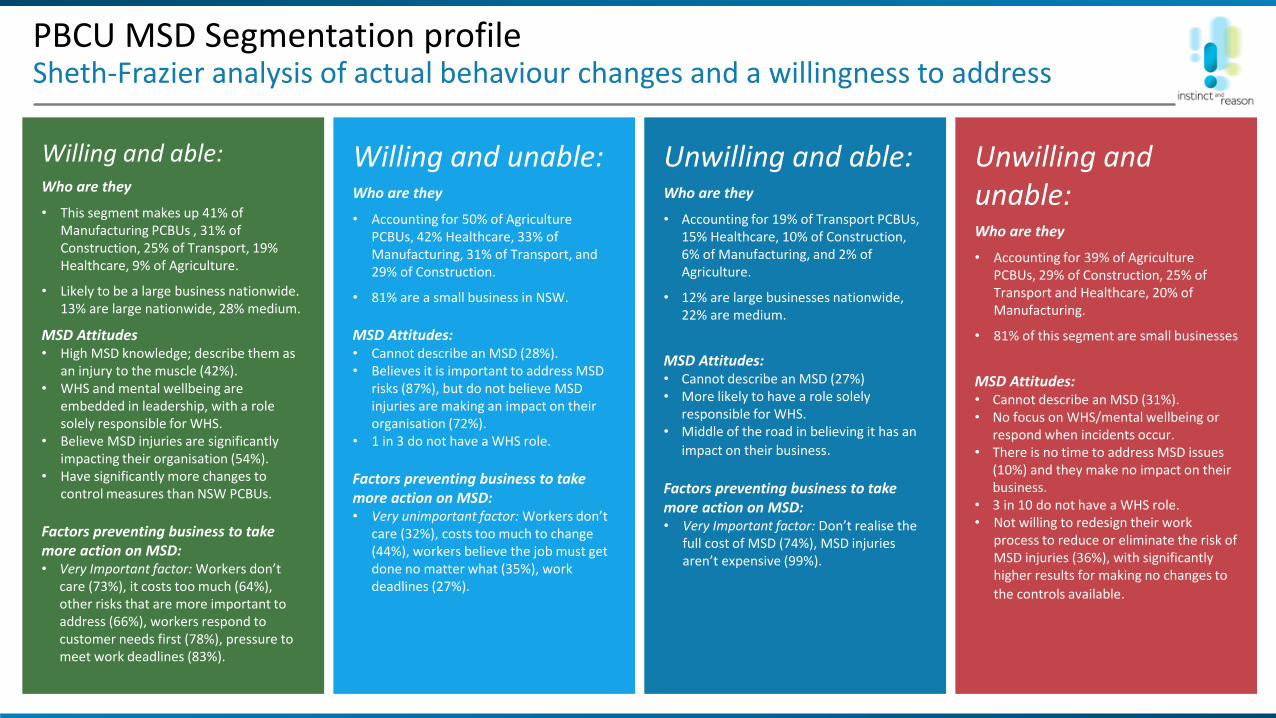
PBCU MSD Segmentation profileSheth-Frazier analysis of actual behaviour changes and a willingness to address
56
Willing and able:Who are they
• This segment makes up 41% of Manufacturing PCBUs , 31% of Construction, 25% of Transport, 19% Healthcare, 9% of Agriculture.
• Likely to be a large business nationwide. 13% are large nationwide, 28% medium.
MSD Attitudes• High MSD knowledge; describe them as
an injury to the muscle (42%).• WHS and mental wellbeing are
embedded in leadership, with a role solely responsible for WHS.
• Believe MSD injuries are significantly impacting their organisation (54%).
• Have significantly more changes to control measures than NSW PCBUs.
Factors preventing business to take more action on MSD: • Very Important factor: Workers don’t
care (73%), it costs too much (64%), other risks that are more important to address (66%), workers respond to customer needs first (78%), pressure to meet work deadlines (83%).
Unwilling and able:Who are they
• Accounting for 19% of Transport PCBUs, 15% Healthcare, 10% of Construction, 6% of Manufacturing, and 2% of Agriculture.
• 12% are large businesses nationwide, 22% are medium.
MSD Attitudes: • Cannot describe an MSD (27%)• More likely to have a role solely
responsible for WHS.• Middle of the road in believing it has an
impact on their business.
Factors preventing business to take more action on MSD: • Very Important factor: Don’t realise the
full cost of MSD (74%), MSD injuries aren’t expensive (99%).
Willing and unable:Who are they
• Accounting for 50% of Agriculture PCBUs, 42% Healthcare, 33% of Manufacturing, 31% of Transport, and 29% of Construction.
• 81% are a small business in NSW.
MSD Attitudes: • Cannot describe an MSD (28%).• Believes it is important to address MSD
risks (87%), but do not believe MSD injuries are making an impact on their organisation (72%).
• 1 in 3 do not have a WHS role.
Factors preventing business to take more action on MSD: • Very unimportant factor: Workers don’t
care (32%), costs too much to change (44%), workers believe the job must get done no matter what (35%), work deadlines (27%).
Unwilling and unable:Who are they
• Accounting for 39% of Agriculture PCBUs, 29% of Construction, 25% of Transport and Healthcare, 20% of Manufacturing.
• 81% of this segment are small businesses
MSD Attitudes: • Cannot describe an MSD (31%).• No focus on WHS/mental wellbeing or
respond when incidents occur.• There is no time to address MSD issues
(10%) and they make no impact on their business.
• 3 in 10 do not have a WHS role.• Not willing to redesign their work
process to reduce or eliminate the risk of MSD injuries (36%), with significantly higher results for making no changes to
the controls available.
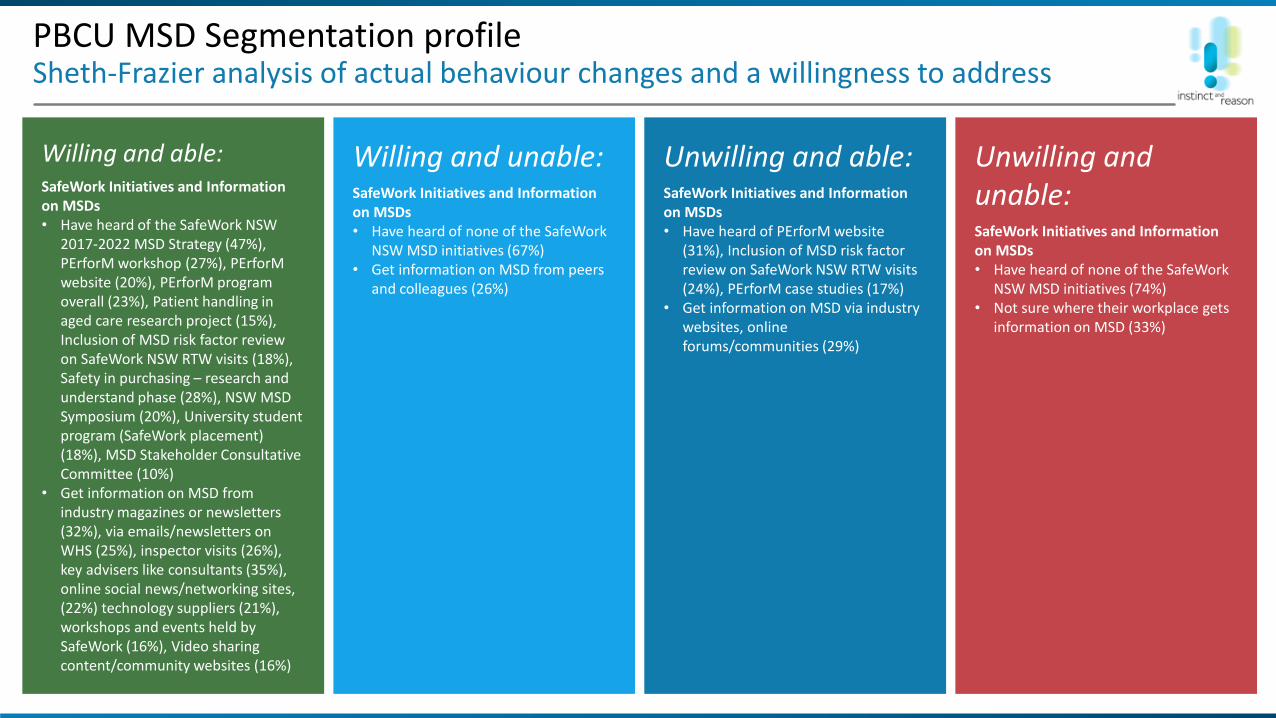
PBCU MSD Segmentation profileSheth-Frazier analysis of actual behaviour changes and a willingness to address
57
Willing and able:SafeWork Initiatives and Information on MSDs• Have heard of the SafeWork NSW
2017-2022 MSD Strategy (47%), PErforM workshop (27%), PErforM website (20%), PErforM program overall (23%), Patient handling in aged care research project (15%), Inclusion of MSD risk factor review on SafeWork NSW RTW visits (18%), Safety in purchasing – research and understand phase (28%), NSW MSD Symposium (20%), University student program (SafeWork placement) (18%), MSD Stakeholder Consultative Committee (10%)
• Get information on MSD from industry magazines or newsletters (32%), via emails/newsletters on WHS (25%), inspector visits (26%), key advisers like consultants (35%), online social news/networking sites, (22%) technology suppliers (21%), workshops and events held by SafeWork (16%), Video sharing content/community websites (16%)
Unwilling and able:SafeWork Initiatives and Information on MSDs• Have heard of PErforM website
(31%), Inclusion of MSD risk factor review on SafeWork NSW RTW visits (24%), PErforM case studies (17%)
• Get information on MSD via industry websites, online forums/communities (29%)
Willing and unable:SafeWork Initiatives and Information on MSDs• Have heard of none of the SafeWork
NSW MSD initiatives (67%)• Get information on MSD from peers
and colleagues (26%)
Unwilling and unable:SafeWork Initiatives and Information on MSDs• Have heard of none of the SafeWork
NSW MSD initiatives (74%)• Not sure where their workplace gets
information on MSD (33%)
www.instinctandreason.com
3e
PCBU awareness and access to SafeWork NSW’s
2018/19 MSD initiatives
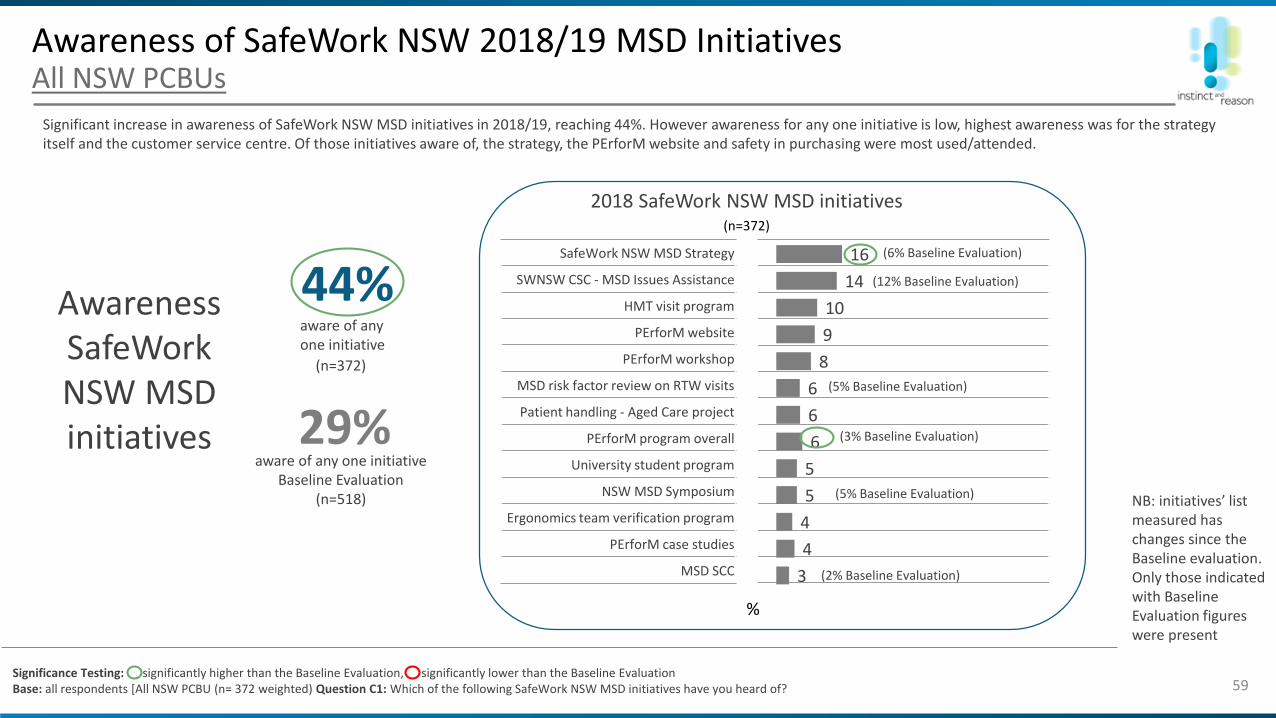
SafeWork NSW MSD Strategy
SWNSW CSC - MSD Issues Assistance
HMT visit program
PErforM website
PErforM workshop
MSD risk factor review on RTW visits
Patient handling - Aged Care project
PErforM program overall
University student program
NSW MSD Symposium
Ergonomics team verification program
PErforM case studies
MSD SCC 3
4
4
5
5
6
6
6
8
9
10
14
16
Awareness of SafeWork NSW 2018/19 MSD InitiativesAll NSW PCBUs
59
Significant increase in awareness of SafeWork NSW MSD initiatives in 2018/19, reaching 44%. However awareness for any one initiative is low, highest awareness was for the strategy itself and the customer service centre. Of those initiatives aware of, the strategy, the PErforM website and safety in purchasing were most used/attended.
Significance Testing: significantly higher than the Baseline Evaluation, significantly lower than the Baseline EvaluationBase: all respondents [All NSW PCBU (n= 372 weighted) Question C1: Which of the following SafeWork NSW MSD initiatives have you heard of?
44%
%
(n=372)
aware of any one initiative
2018 SafeWork NSW MSD initiatives
Awareness SafeWork NSW MSD initiatives
(n=372)
29%aware of any one initiative
Baseline Evaluation(n=518) NB: initiatives’ list
measured has changes since the Baseline evaluation. Only those indicated with Baseline Evaluation figures were present
(6% Baseline Evaluation)
(5% Baseline Evaluation)
(2% Baseline Evaluation)
(3% Baseline Evaluation)
(5% Baseline Evaluation)
(12% Baseline Evaluation)

Awareness of SafeWork NSW 2018 MSD InitiativesTarget industries
60
But awareness across the target industries is generally higher. Over 1 in 2 Healthcare PCBUs are aware of an initiative, mainly the customer service centre, the strategy and the patient handling project; 3 in 5 Manufacturing PCBUs are aware of at least one initiative, mainly the customer service centre and the strategy.
6
8
8
8
9
11
11
11
15
17
21
21
25
PErforM website
MSD SCC
Ergonomics team verification program
PErforM workshop
MSD risk factor review on RTW visits
PErforM case studies
NSW MSD Symposium
University student program
HMT visit program
PErforM program overall
Patient handling - Aged Care project
SafeWork NSW MSD Strategy
SWNSW CSC - MSD Issues Assistance
%
Significance Testing: significantly higher than the average NSW PCBU, significantly lower than the average NSW PCBUBase: all respondents [targeted industries unweighted (healthcare n=53, manufacturing n=51]Question C1: Which of the following SafeWork NSW MSD initiatives have you heard of?
12
12
14
16
18
20
20
20
22
24
25
29
39
Patient handling - Aged Care project
Ergonomics team verification program
MSD SCC
NSW MSD Symposium
University student program
PErforM workshop
PErforM website
PErforM case studies
PErforM program overall
MSD risk factor review on RTW visits
HMT visit program
SWNSW CSC - MSD Issues Assistance
SafeWork NSW MSD Strategy
%
Awareness of each initiative
(n=53)Healthcare
Awareness of each initiative
(n=51)Manufacturing
55% 34% Of those aware, have used / attended at least 1 initiative
aware of any one initiative 61% 32% Of those aware, have used /
attended at least 1 initiativeaware of any one initiative
(n=29*) (n=31)
*NB: small base sizes <30, interpret with caution
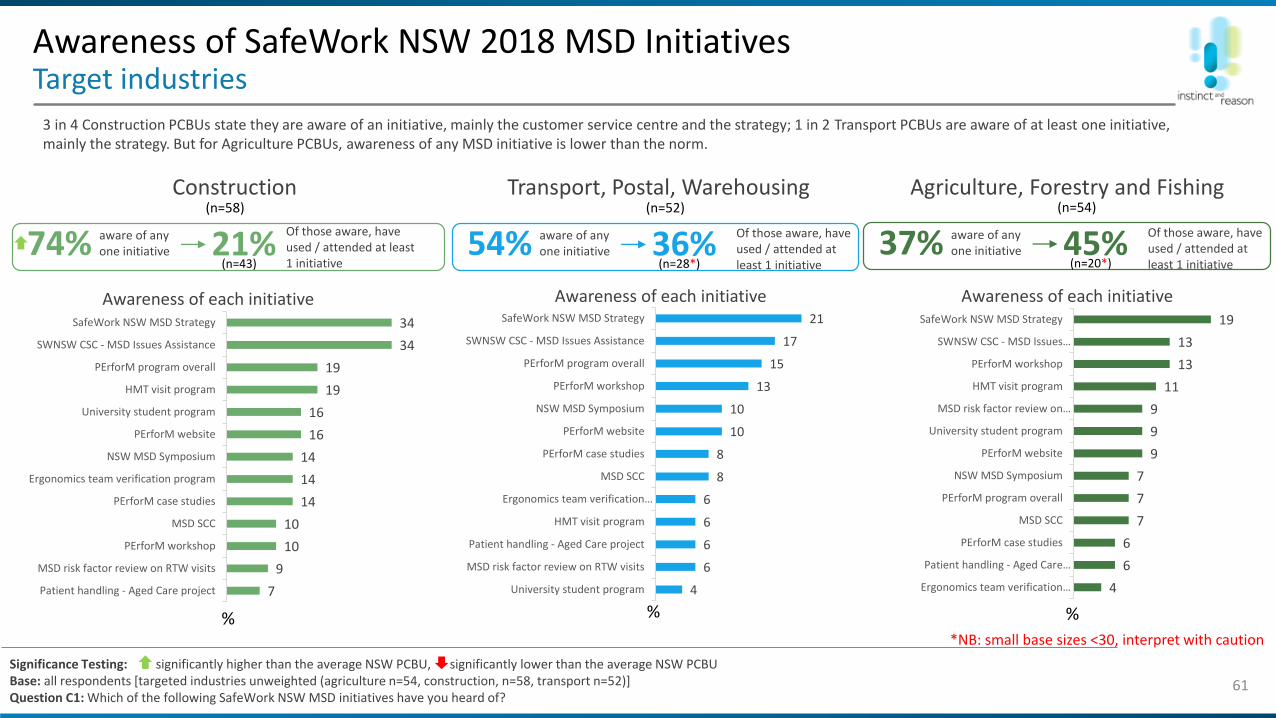
Awareness of SafeWork NSW 2018 MSD InitiativesTarget industries
61
%
Significance Testing: significantly higher than the average NSW PCBU, significantly lower than the average NSW PCBUBase: all respondents [targeted industries unweighted (agriculture n=54, construction, n=58, transport n=52)]Question C1: Which of the following SafeWork NSW MSD initiatives have you heard of?
%7
9
10
10
14
14
14
16
16
19
19
34
34
Patient handling - Aged Care project
MSD risk factor review on RTW visits
PErforM workshop
MSD SCC
PErforM case studies
Ergonomics team verification program
NSW MSD Symposium
PErforM website
University student program
HMT visit program
PErforM program overall
SWNSW CSC - MSD Issues Assistance
SafeWork NSW MSD Strategy
4
6
6
6
6
8
8
10
10
13
15
17
21
University student program
MSD risk factor review on RTW visits
Patient handling - Aged Care project
HMT visit program
Ergonomics team verification…
MSD SCC
PErforM case studies
PErforM website
NSW MSD Symposium
PErforM workshop
PErforM program overall
SWNSW CSC - MSD Issues Assistance
SafeWork NSW MSD Strategy
%
4
6
6
7
7
7
9
9
9
11
13
13
19
Ergonomics team verification…
Patient handling - Aged Care…
PErforM case studies
MSD SCC
PErforM program overall
NSW MSD Symposium
PErforM website
University student program
MSD risk factor review on…
HMT visit program
PErforM workshop
SWNSW CSC - MSD Issues…
SafeWork NSW MSD Strategy
3 in 4 Construction PCBUs state they are aware of an initiative, mainly the customer service centre and the strategy; 1 in 2 Transport PCBUs are aware of at least one initiative, mainly the strategy. But for Agriculture PCBUs, awareness of any MSD initiative is lower than the norm.
Awareness of each initiative
(n=58)Construction
74% 21%Of those aware, have used / attended at least 1 initiative
aware of any one initiative
(n=43)
(n=52)Transport, Postal, Warehousing
54% 36%aware of any one initiative
(n=28*)
Of those aware, have used / attended at least 1 initiative
(n=54)Agriculture, Forestry and Fishing
37% 45%aware of any one initiative
(n=20*)
Of those aware, have used / attended at least 1 initiative
Awareness of each initiative Awareness of each initiative
*NB: small base sizes <30, interpret with caution
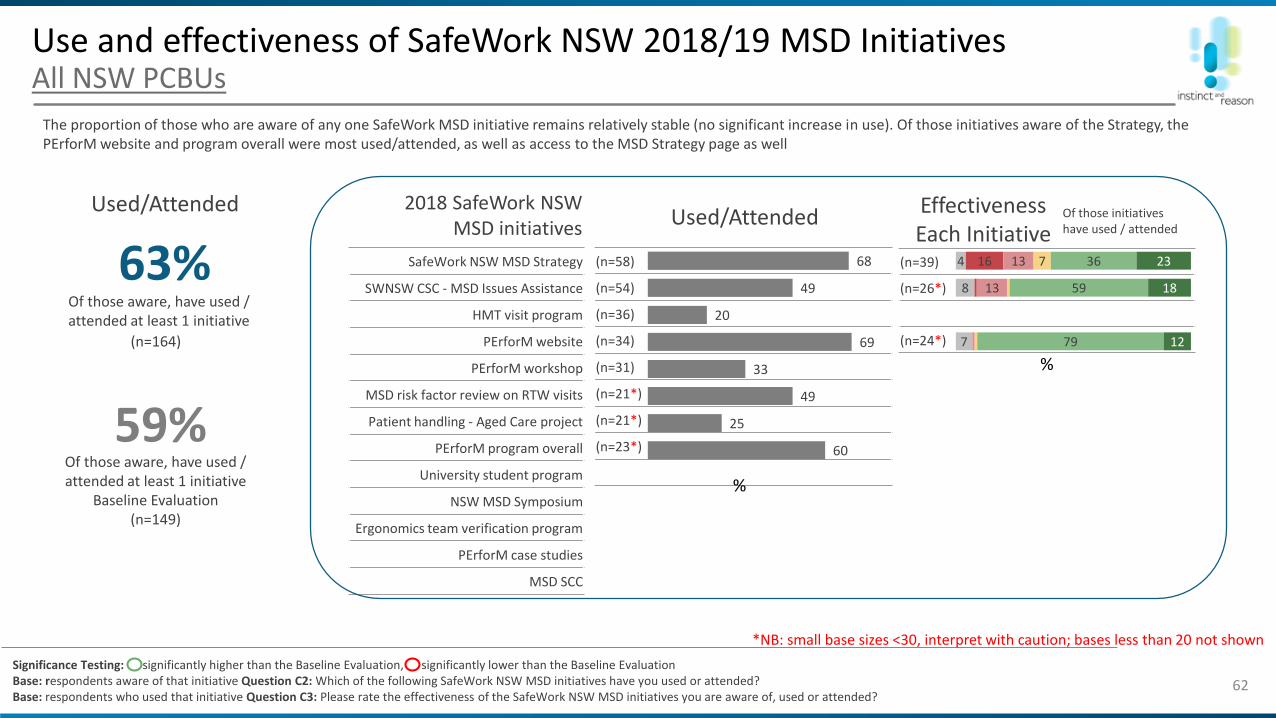
7
8
4 16
13
13 7
79
59
36
12
18
23(n=39)
(n=26*)
(n=24*)
60
25
49
33
69
20
49
68(n=58)
(n=54)
(n=36)
(n=34)
(n=31)
(n=21*)
(n=21*)
(n=23*)
SafeWork NSW MSD Strategy
SWNSW CSC - MSD Issues Assistance
HMT visit program
PErforM website
PErforM workshop
MSD risk factor review on RTW visits
Patient handling - Aged Care project
PErforM program overall
University student program
NSW MSD Symposium
Ergonomics team verification program
PErforM case studies
MSD SCC
Use and effectiveness of SafeWork NSW 2018/19 MSD InitiativesAll NSW PCBUs
62
The proportion of those who are aware of any one SafeWork MSD initiative remains relatively stable (no significant increase in use). Of those initiatives aware of the Strategy, the PErforM website and program overall were most used/attended, as well as access to the MSD Strategy page as well
Significance Testing: significantly higher than the Baseline Evaluation, significantly lower than the Baseline EvaluationBase: respondents aware of that initiative Question C2: Which of the following SafeWork NSW MSD initiatives have you used or attended?Base: respondents who used that initiative Question C3: Please rate the effectiveness of the SafeWork NSW MSD initiatives you are aware of, used or attended?
%
*NB: small base sizes <30, interpret with caution; bases less than 20 not shown
Used/Attended
%
Effectiveness Each Initiative
Of those initiatives have used / attended
2018 SafeWork NSW MSD initiatives
63%Of those aware, have used / attended at least 1 initiative
(n=164)
59%Of those aware, have used / attended at least 1 initiative
Baseline Evaluation(n=149)
Used/Attended
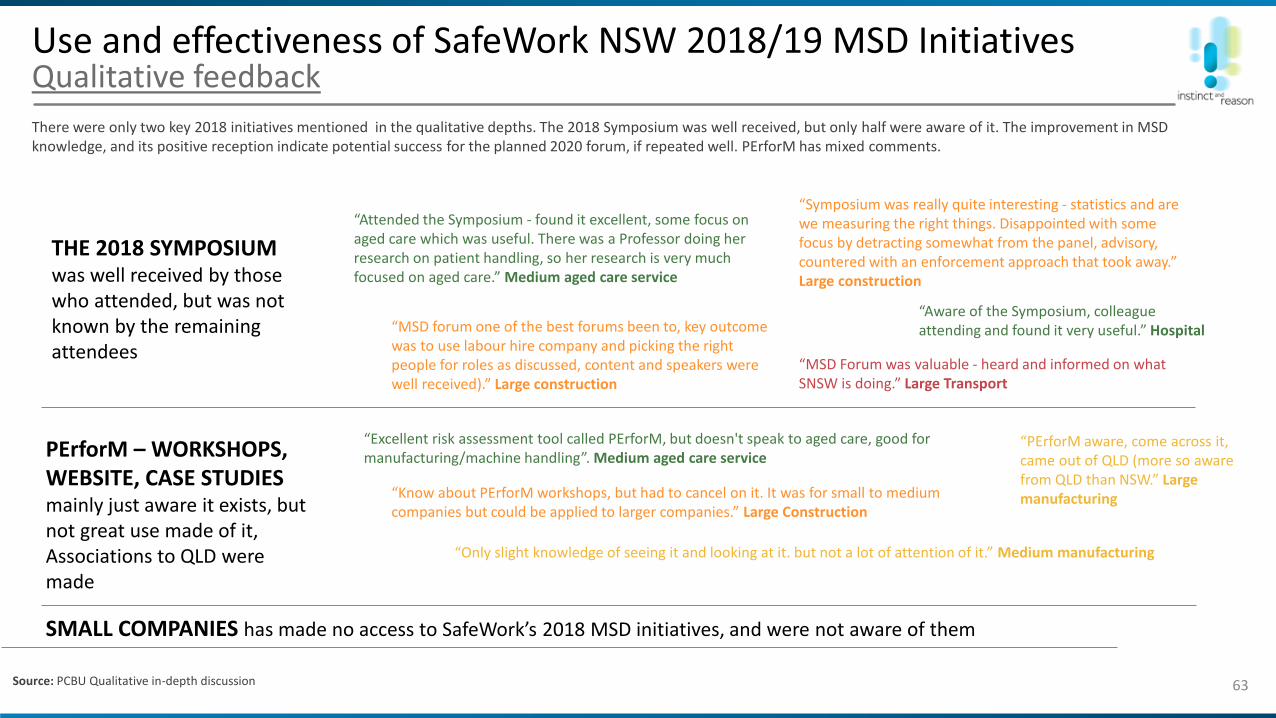
63
THE 2018 SYMPOSIUM was well received by those who attended, but was not known by the remaining attendees
“Aware of the Symposium, colleague attending and found it very useful.” Hospital
PErforM – WORKSHOPS, WEBSITE, CASE STUDIESmainly just aware it exists, but not great use made of it, Associations to QLD were made
“MSD Forum was valuable - heard and informed on what SNSW is doing.” Large Transport
“Attended the Symposium - found it excellent, some focus on aged care which was useful. There was a Professor doing her research on patient handling, so her research is very much focused on aged care.” Medium aged care service
“Symposium was really quite interesting - statistics and are we measuring the right things. Disappointed with some focus by detracting somewhat from the panel, advisory, countered with an enforcement approach that took away.” Large construction
“MSD forum one of the best forums been to, key outcome was to use labour hire company and picking the right people for roles as discussed, content and speakers were well received).” Large construction
“Excellent risk assessment tool called PErforM, but doesn't speak to aged care, good for manufacturing/machine handling”. Medium aged care service
“Only slight knowledge of seeing it and looking at it. but not a lot of attention of it.” Medium manufacturing
“PErforM aware, come across it, came out of QLD (more so aware from QLD than NSW.” Large manufacturing“Know about PErforM workshops, but had to cancel on it. It was for small to medium
companies but could be applied to larger companies.” Large Construction
SMALL COMPANIES has made no access to SafeWork’s 2018 MSD initiatives, and were not aware of them
There were only two key 2018 initiatives mentioned in the qualitative depths. The 2018 Symposium was well received, but only half were aware of it. The improvement in MSD knowledge, and its positive reception indicate potential success for the planned 2020 forum, if repeated well. PErforM has mixed comments.
Use and effectiveness of SafeWork NSW 2018/19 MSD InitiativesQualitative feedback
Source: PCBU Qualitative in-depth discussion
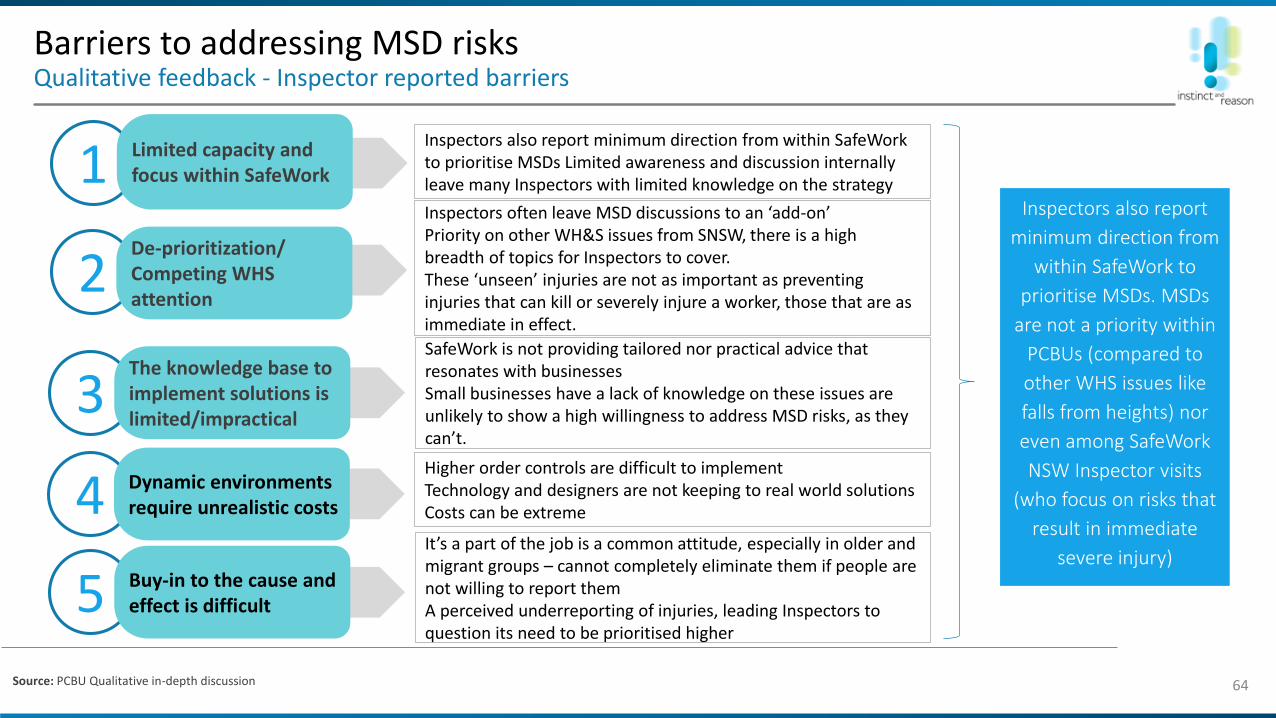
Barriers to addressing MSD risksQualitative feedback - Inspector reported barriers
64
Inspectors also report minimum direction from within SafeWork to prioritise MSDs Limited awareness and discussion internally leave many Inspectors with limited knowledge on the strategy1 Limited capacity and
focus within SafeWork
Inspectors often leave MSD discussions to an ‘add-on’ Priority on other WH&S issues from SNSW, there is a high breadth of topics for Inspectors to cover.These ‘unseen’ injuries are not as important as preventing injuries that can kill or severely injure a worker, those that are as immediate in effect.
2De-prioritization/ Competing WHS attention
SafeWork is not providing tailored nor practical advice that resonates with businessesSmall businesses have a lack of knowledge on these issues are unlikely to show a high willingness to address MSD risks, as they can’t.
3The knowledge base to implement solutions is limited/impractical
Higher order controls are difficult to implementTechnology and designers are not keeping to real world solutions Costs can be extreme4 Dynamic environments
require unrealistic costs
Inspectors also report
minimum direction from
within SafeWork to
prioritise MSDs. MSDs
are not a priority within
PCBUs (compared to
other WHS issues like
falls from heights) nor
even among SafeWork
NSW Inspector visits
(who focus on risks that
result in immediate
severe injury)It’s a part of the job is a common attitude, especially in older and migrant groups – cannot completely eliminate them if people are not willing to report themA perceived underreporting of injuries, leading Inspectors to question its need to be prioritised higher
5 Buy-in to the cause and effect is difficult
Source: PCBU Qualitative in-depth discussion
www.instinctandreason.com
3f
PCBU access to SafeWork NSW’s digital dataAn analysis of SafeWork NSW’s digital access data

66
11133556
1857
Guidance to help transport operators improve workplace safety
Nurses Manual Handling Guide & Manual Handling Competencies
Installation and use of safety line systems
NSW requirements for use of portable ladders in a workplace
Manual tasks traininf for workers
PErforM
WHS informationavailable about traffic management in…
NSW requirements for use of ladders in a workplace
Weight limits for manual handling
SafeWork NSW SME & Team Manager List
Safework NSW Customer service data1 Jan. 2018 – 30 April 2019
%
Close to one in five enquiries to SafeWork NSW’s helpline relate the weight limits for manual handling, with 5% of enquiries about PErforM. According to the Baseline Evaluation, weight limits were also one of the top three enquiries over twelve months ago.
Source: SafeWork NSW Customer Service Data – MSDs January 2018 to 30 April 2019
PCBU’s accessing SafeWork customer support for MSD enquiriesWhat are the customer queries related to SafeWork NSW Initiatives?
A key focus for SafeWork NSW is to understand what MSD issues PCBUs are facing.
Information relating to PCBU-reported MSD issues was identified through analysis of SafeWork NSW’s customer service data, data highlighting the phone service that PCBUs can contact for general work health and safety advice and support (i.e. it is not an MSD specific helpline). But the data is filtered to MSDs
The time period over which the calls were received is identified as Jan 1, 2018 to April 30, 2019.
1430 469MSD-related calls made: 2017/2018 MSD-related calls made:
*NB: there is a time period cross over to the 2017/18 results
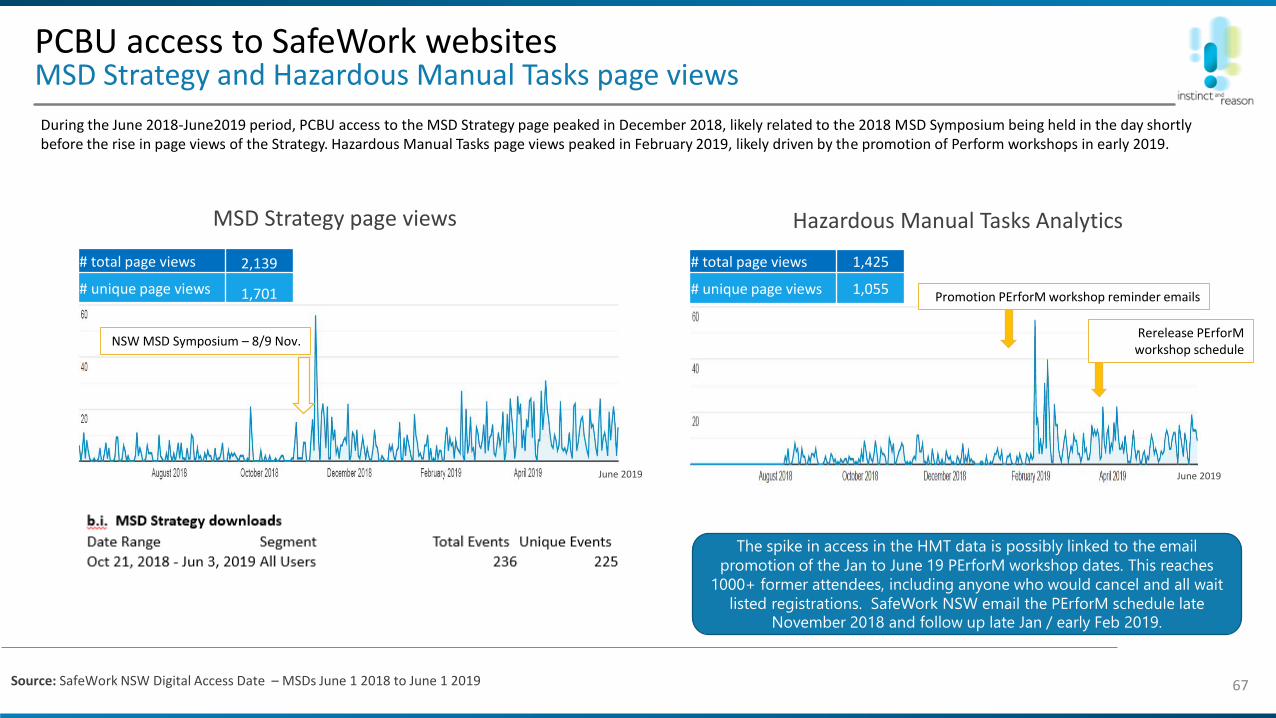
67
During the June 2018-June2019 period, PCBU access to the MSD Strategy page peaked in December 2018, likely related to the 2018 MSD Symposium being held in the day shortly before the rise in page views of the Strategy. Hazardous Manual Tasks page views peaked in February 2019, likely driven by the promotion of Perform workshops in early 2019.
Hazardous Manual Tasks Analytics
Source: SafeWork NSW Digital Access Date – MSDs June 1 2018 to June 1 2019
MSD Strategy page views
June 2019
# total page views 2,139
# unique page views 1,701
NSW MSD Symposium – 8/9 Nov.
June 2019
# total page views 1,425
# unique page views 1,055
PCBU access to SafeWork websitesMSD Strategy and Hazardous Manual Tasks page views
Promotion PErforM workshop reminder emails
The spike in access in the HMT data is possibly linked to the email
promotion of the Jan to June 19 PErforM workshop dates. This reaches
1000+ former attendees, including anyone who would cancel and all wait
listed registrations. SafeWork NSW email the PErforM schedule late November 2018 and follow up late Jan / early Feb 2019.
Rerelease PErforM workshop schedule

68
Interest in accessing SafeWork NSW MSD websites is highest over the 18/19 financial year for PErforM page views. During this period, page views peaked in Oct. – Dec. 2018, seemingly related to a high number of workshops being undertaken as PErforM workshops were running throughout this period in regional and metro centres.
Sydney w/shop 28 Oct.
Wollongong & Parramatta w/shops 3 & 26 July
Orange w/shop 12 Sep.
Forster workshop 19 Oct.
Singleton w/shop 31 Oct.
Dubbo w/shop 7 Nov.
Albury w/shop 6 Dec.
Sydney & Parramatta w/shop 6 & 12 Feb.
Baulkham Hills & Gosford w/shop 4 & 10 April
Sydney w/shop 5 May
Parramatta w/shop12 June
PErforM eDM deployment
# total page views 8,562
# unique page views 5,810
June 2019
Source: SafeWork NSW Digital Access Date – MSDs June 1 2018 to June 1 2019
PCBU access to SafeWork websitesPErforM page views
www.instinctandreason.com
3g
Impact of SafeWork initiativesProfiling of the awareness of SafeWork’s 2018/18 initiative
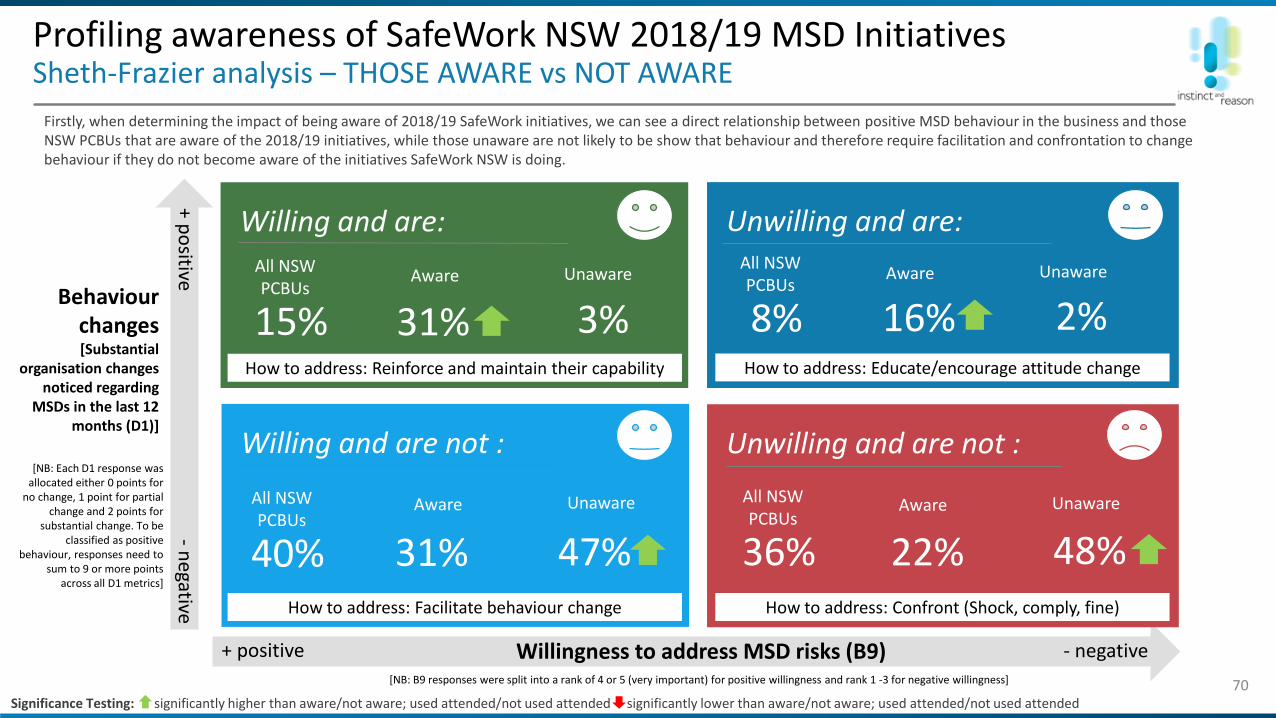
Profiling awareness of SafeWork NSW 2018/19 MSD InitiativesSheth-Frazier analysis – THOSE AWARE vs NOT AWARE
70
Savvy
- negative+ positive
Willing and are: Unwilling and are:
Unwilling and are not :Willing and are not :
Behaviourchanges [Substantial
organisation changes noticed regarding
MSDs in the last 12 months (D1)]
Willingness to address MSD risks (B9)
How to address: Reinforce and maintain their capability How to address: Educate/encourage attitude change
How to address: Facilitate behaviour change How to address: Confront (Shock, comply, fine)
+ po
sitive-
negative
[NB: Each D1 response was allocated either 0 points for
no change, 1 point for partial change and 2 points for
substantial change. To be classified as positive
behaviour, responses need to sum to 9 or more points
across all D1 metrics]
[NB: B9 responses were split into a rank of 4 or 5 (very important) for positive willingness and rank 1 -3 for negative willingness]
31%
Aware Unaware
3% 16% 2%
31% 47% 22% 48%
Firstly, when determining the impact of being aware of 2018/19 SafeWork initiatives, we can see a direct relationship between positive MSD behaviour in the business and those NSW PCBUs that are aware of the 2018/19 initiatives, while those unaware are not likely to be show that behaviour and therefore require facilitation and confrontation to change behaviour if they do not become aware of the initiatives SafeWork NSW is doing.
Significance Testing: significantly higher than aware/not aware; used attended/not used attended significantly lower than aware/not aware; used attended/not used attended
All NSW PCBUs
15%
All NSW PCBUs
8%
All NSW PCBUs
36%
All NSW PCBUs
40%
Aware Unaware Aware Unaware
Aware Unaware
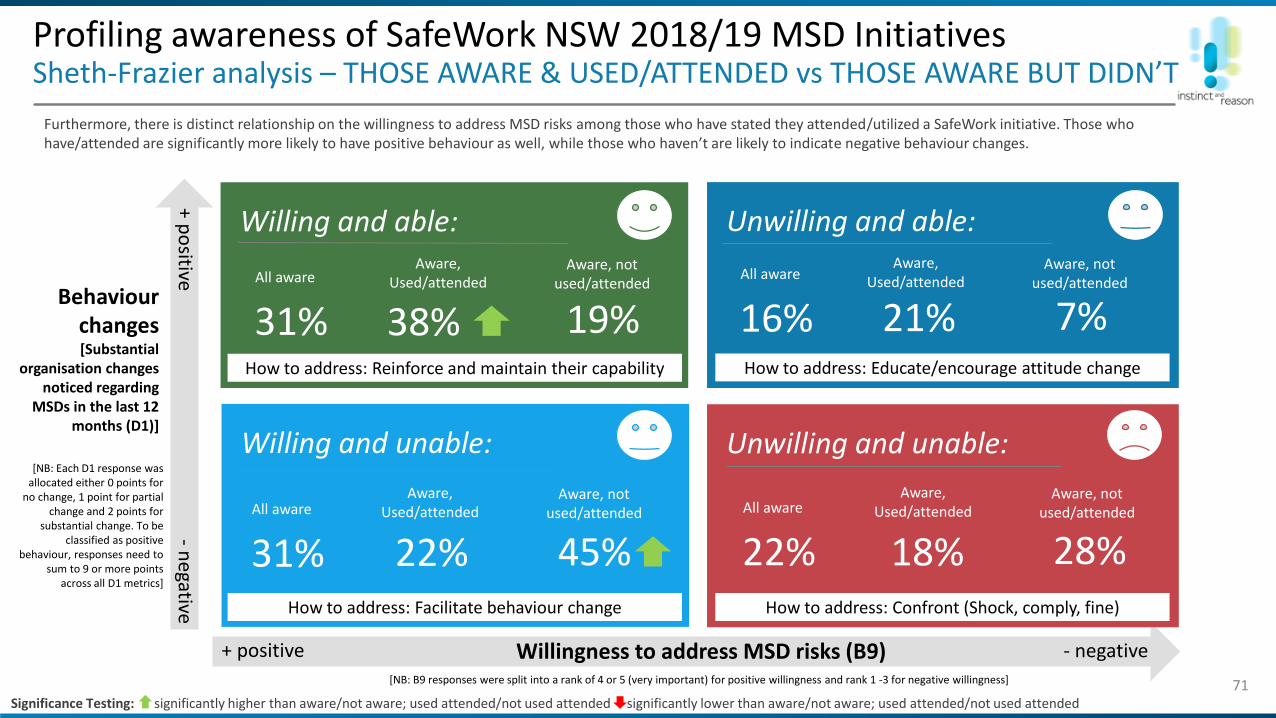
Profiling awareness of SafeWork NSW 2018/19 MSD InitiativesSheth-Frazier analysis – THOSE AWARE & USED/ATTENDED vs THOSE AWARE BUT DIDN’T
71
Savvy
- negative+ positive
Willing and able: Unwilling and able:
Unwilling and unable:Willing and unable:
Behaviourchanges [Substantial
organisation changes noticed regarding
MSDs in the last 12 months (D1)]
Willingness to address MSD risks (B9)
How to address: Reinforce and maintain their capability How to address: Educate/encourage attitude change
How to address: Facilitate behaviour change How to address: Confront (Shock, comply, fine)
+ po
sitive-
negative
[NB: Each D1 response was allocated either 0 points for
no change, 1 point for partial change and 2 points for
substantial change. To be classified as positive
behaviour, responses need to sum to 9 or more points
across all D1 metrics]
[NB: B9 responses were split into a rank of 4 or 5 (very important) for positive willingness and rank 1 -3 for negative willingness]
38%
Aware, Used/attended
19% 21% 7%
22% 45% 18% 28%
Furthermore, there is distinct relationship on the willingness to address MSD risks among those who have stated they attended/utilized a SafeWork initiative. Those who have/attended are significantly more likely to have positive behaviour as well, while those who haven’t are likely to indicate negative behaviour changes.
Significance Testing: significantly higher than aware/not aware; used attended/not used attended significantly lower than aware/not aware; used attended/not used attended
All aware
31%
All aware
16%
All aware
22%All aware
31%
Aware, not used/attended
Aware, Used/attended
Aware, not used/attended
Aware, Used/attended
Aware, not used/attended
Aware, Used/attended
Aware, not used/attended
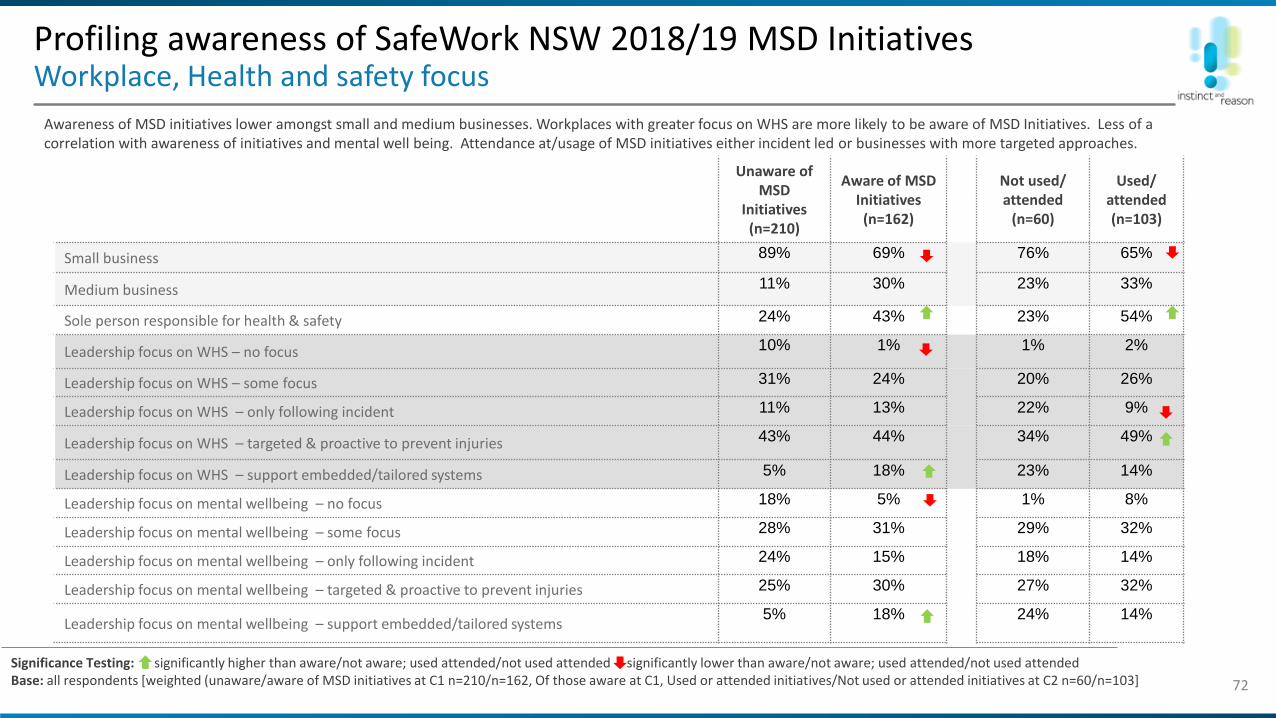
Profiling awareness of SafeWork NSW 2018/19 MSD InitiativesWorkplace, Health and safety focus
72
Awareness of MSD initiatives lower amongst small and medium businesses. Workplaces with greater focus on WHS are more likely to be aware of MSD Initiatives. Less of a correlation with awareness of initiatives and mental well being. Attendance at/usage of MSD initiatives either incident led or businesses with more targeted approaches.
Significance Testing: significantly higher than aware/not aware; used attended/not used attended significantly lower than aware/not aware; used attended/not used attended Base: all respondents [weighted (unaware/aware of MSD initiatives at C1 n=210/n=162, Of those aware at C1, Used or attended initiatives/Not used or attended initiatives at C2 n=60/n=103]
Unaware of MSD
Initiatives(n=210)
Aware of MSD Initiatives(n=162)
Not used/ attended
(n=60)
Used/ attended (n=103)
Small business 89% 69% 76% 65%
Medium business 11% 30% 23% 33%
Sole person responsible for health & safety 24% 43% 23% 54%
Leadership focus on WHS – no focus 10% 1% 1% 2%
Leadership focus on WHS – some focus 31% 24% 20% 26%
Leadership focus on WHS – only following incident 11% 13% 22% 9%
Leadership focus on WHS – targeted & proactive to prevent injuries 43% 44% 34% 49%
Leadership focus on WHS – support embedded/tailored systems 5% 18% 23% 14%
Leadership focus on mental wellbeing – no focus 18% 5% 1% 8%
Leadership focus on mental wellbeing – some focus 28% 31% 29% 32%
Leadership focus on mental wellbeing – only following incident 24% 15% 18% 14%
Leadership focus on mental wellbeing – targeted & proactive to prevent injuries 25% 30% 27% 32%
Leadership focus on mental wellbeing – support embedded/tailored systems5% 18% 24% 14%
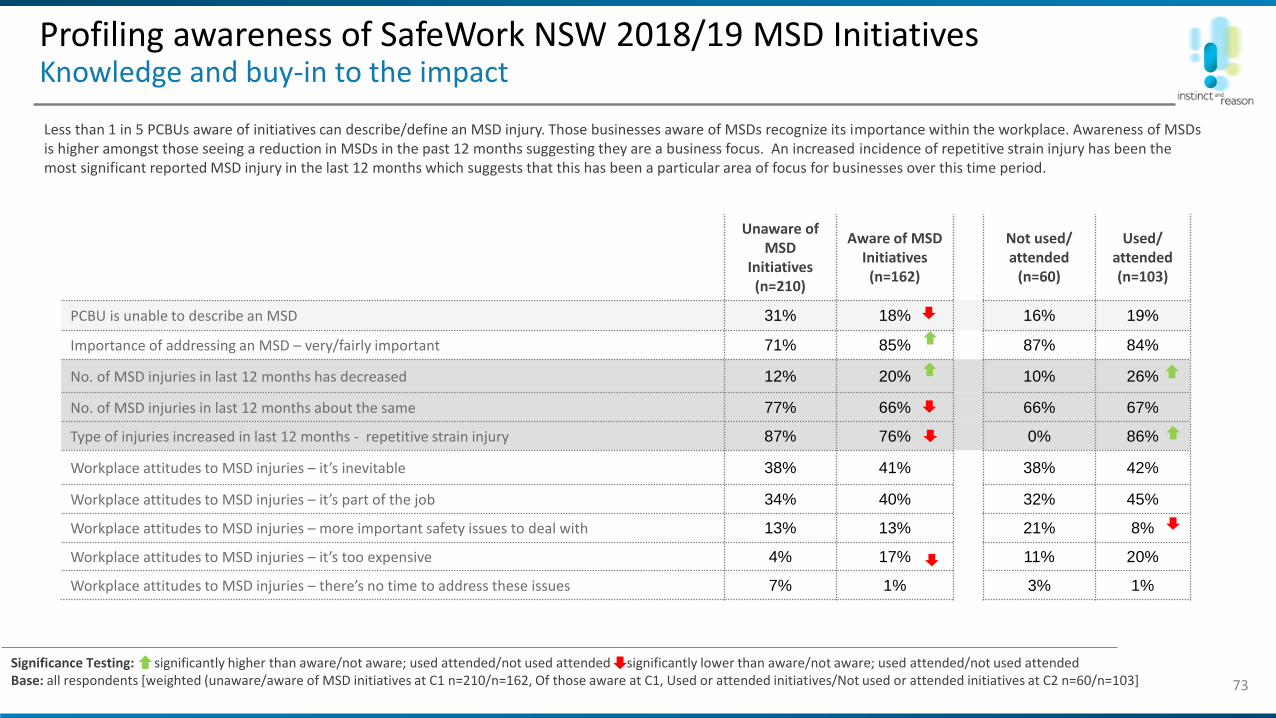
Profiling awareness of SafeWork NSW 2018/19 MSD InitiativesKnowledge and buy-in to the impact
73
Less than 1 in 5 PCBUs aware of initiatives can describe/define an MSD injury. Those businesses aware of MSDs recognize its importance within the workplace. Awareness of MSDs is higher amongst those seeing a reduction in MSDs in the past 12 months suggesting they are a business focus. An increased incidence of repetitive strain injury has been the most significant reported MSD injury in the last 12 months which suggests that this has been a particular area of focus for businesses over this time period.
Significance Testing: significantly higher than aware/not aware; used attended/not used attended significantly lower than aware/not aware; used attended/not used attended Base: all respondents [weighted (unaware/aware of MSD initiatives at C1 n=210/n=162, Of those aware at C1, Used or attended initiatives/Not used or attended initiatives at C2 n=60/n=103]
Unaware of MSD
Initiatives(n=210)
Aware of MSD Initiatives(n=162)
Not used/ attended
(n=60)
Used/ attended (n=103)
PCBU is unable to describe an MSD 31% 18% 16% 19%
Importance of addressing an MSD – very/fairly important 71% 85% 87% 84%
No. of MSD injuries in last 12 months has decreased 12% 20% 10% 26%
No. of MSD injuries in last 12 months about the same 77% 66% 66% 67%
Type of injuries increased in last 12 months - repetitive strain injury 87% 76% 0% 86%
Workplace attitudes to MSD injuries – it’s inevitable 38% 41% 38% 42%
Workplace attitudes to MSD injuries – it’s part of the job 34% 40% 32% 45%
Workplace attitudes to MSD injuries – more important safety issues to deal with 13% 13% 21% 8%
Workplace attitudes to MSD injuries – it’s too expensive 4% 17% 11% 20%
Workplace attitudes to MSD injuries – there’s no time to address these issues 7% 1% 3% 1%
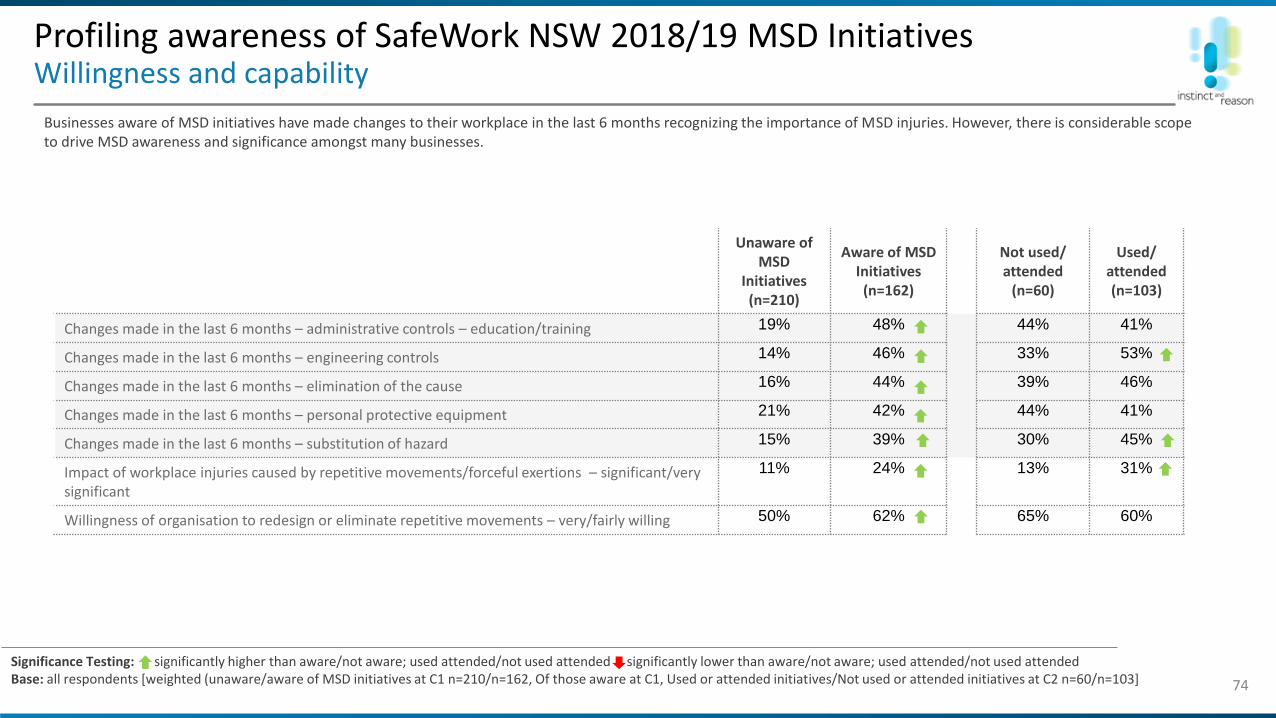
Profiling awareness of SafeWork NSW 2018/19 MSD InitiativesWillingness and capability
74
Businesses aware of MSD initiatives have made changes to their workplace in the last 6 months recognizing the importance of MSD injuries. However, there is considerable scope to drive MSD awareness and significance amongst many businesses.
Significance Testing: significantly higher than aware/not aware; used attended/not used attended significantly lower than aware/not aware; used attended/not used attended Base: all respondents [weighted (unaware/aware of MSD initiatives at C1 n=210/n=162, Of those aware at C1, Used or attended initiatives/Not used or attended initiatives at C2 n=60/n=103]
Unaware of MSD
Initiatives(n=210)
Aware of MSD Initiatives(n=162)
Not used/ attended
(n=60)
Used/ attended (n=103)
Changes made in the last 6 months – administrative controls – education/training 19% 48% 44% 41%
Changes made in the last 6 months – engineering controls 14% 46% 33% 53%
Changes made in the last 6 months – elimination of the cause 16% 44% 39% 46%
Changes made in the last 6 months – personal protective equipment 21% 42% 44% 41%
Changes made in the last 6 months – substitution of hazard 15% 39% 30% 45%
Impact of workplace injuries caused by repetitive movements/forceful exertions – significant/very significant
11% 24% 13% 31%
Willingness of organisation to redesign or eliminate repetitive movements – very/fairly willing 50% 62% 65% 60%

Profiling awareness of SafeWork NSW 2018/19 MSD Initiatives Substantial/partial change noticed in last 12 months
75
Awareness is driving workplace MSD initiatives and SafeWork NSW MSD initiatives appear to be impacting changing attitudes to MSDs in the last 12 months but there is still some way to go in terms of driving changes in technology or redesigning the workplace.
Significance Testing: significantly higher than aware/not aware; used attended/not used attended significantly lower than aware/not aware; used attended/not used attended Base: all respondents [weighted (unaware/aware of MSD initiatives at C1 n=210/n=162, Of those aware at C1, Used or attended initiatives/Not used or attended initiatives at C2 n=60/n=103]
Unaware of MSD
Initiatives(n=210)
Aware of MSD Initiatives(n=162)
Not used/ attended
(n=60)
Used/ attended (n=103)
Awareness of the level of risk of MSD injuries 22% 78% 66% 85%
Awareness of the cost to the workplace of MSD injury 22% 70% 51% 80%
Measuring and recording of MSD injuries 11% 71% 53% 82%
Risk assessment of MSD injury exposure 23% 73% 59% 81%
Increasing mentions of MSD risks at toolbox and other worker meetings 16% 66% 46% 77%
Training being offered to prevent MSD injuries 16% 72% 57% 80%
Staff consultation about ways to reduce or eliminate repetitive exertions/forceful movements etc 22% 81% 74% 85%
Jobs being redesigned to reduce or eliminate repetitive exertions/forceful movements etc 24% 78% 74% 81%
Investment in technology that eliminates repetitive exertions/forceful movements etc 15% 70% 68% 71%
46% 77%
46% 77%
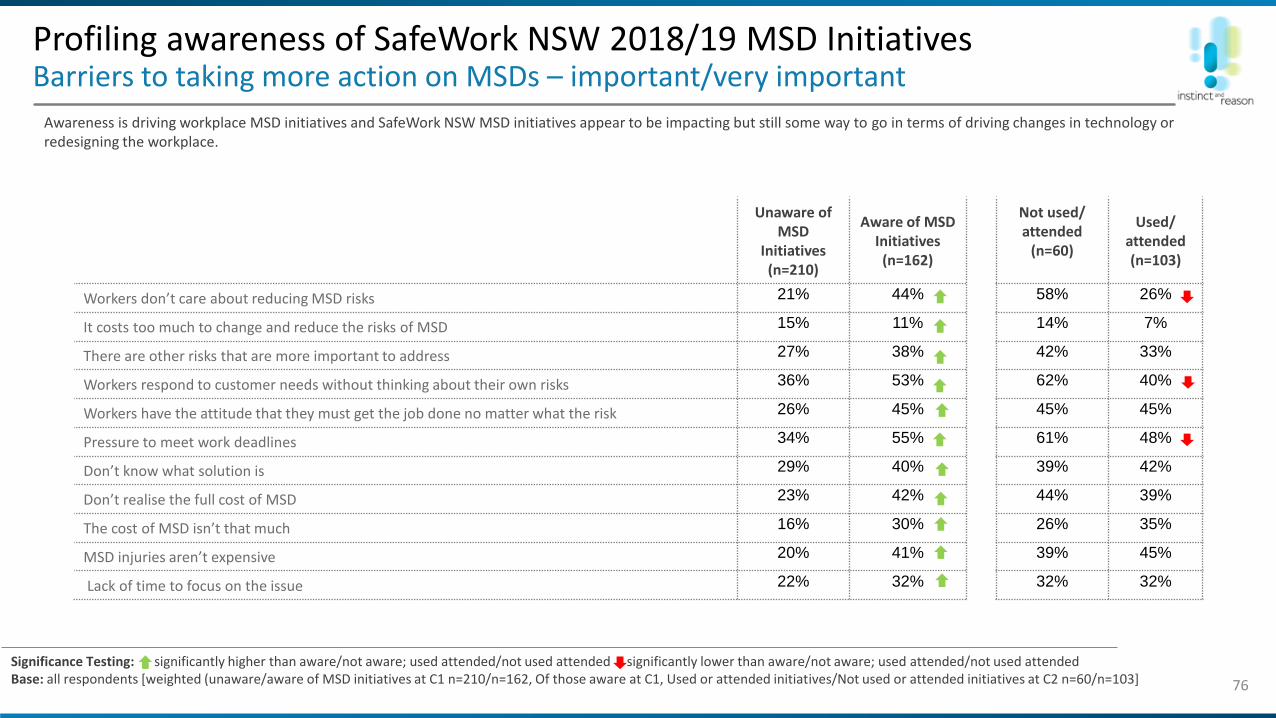
Profiling awareness of SafeWork NSW 2018/19 MSD Initiatives Barriers to taking more action on MSDs – important/very important
76
Awareness is driving workplace MSD initiatives and SafeWork NSW MSD initiatives appear to be impacting but still some way to go in terms of driving changes in technology or redesigning the workplace.
Significance Testing: significantly higher than aware/not aware; used attended/not used attended significantly lower than aware/not aware; used attended/not used attended Base: all respondents [weighted (unaware/aware of MSD initiatives at C1 n=210/n=162, Of those aware at C1, Used or attended initiatives/Not used or attended initiatives at C2 n=60/n=103]
Unaware of MSD
Initiatives(n=210)
Aware of MSD Initiatives(n=162)
Not used/ attended
(n=60)
Used/ attended (n=103)
Workers don’t care about reducing MSD risks 21% 44% 58% 26%
It costs too much to change and reduce the risks of MSD 15% 11% 14% 7%
There are other risks that are more important to address 27% 38% 42% 33%
Workers respond to customer needs without thinking about their own risks 36% 53% 62% 40%
Workers have the attitude that they must get the job done no matter what the risk 26% 45% 45% 45%
Pressure to meet work deadlines 34% 55% 61% 48%
Don’t know what solution is 29% 40% 39% 42%
Don’t realise the full cost of MSD 23% 42% 44% 39%
The cost of MSD isn’t that much 16% 30% 26% 35%
MSD injuries aren’t expensive 20% 41% 39% 45%
Lack of time to focus on the issue 22% 32% 32% 32%
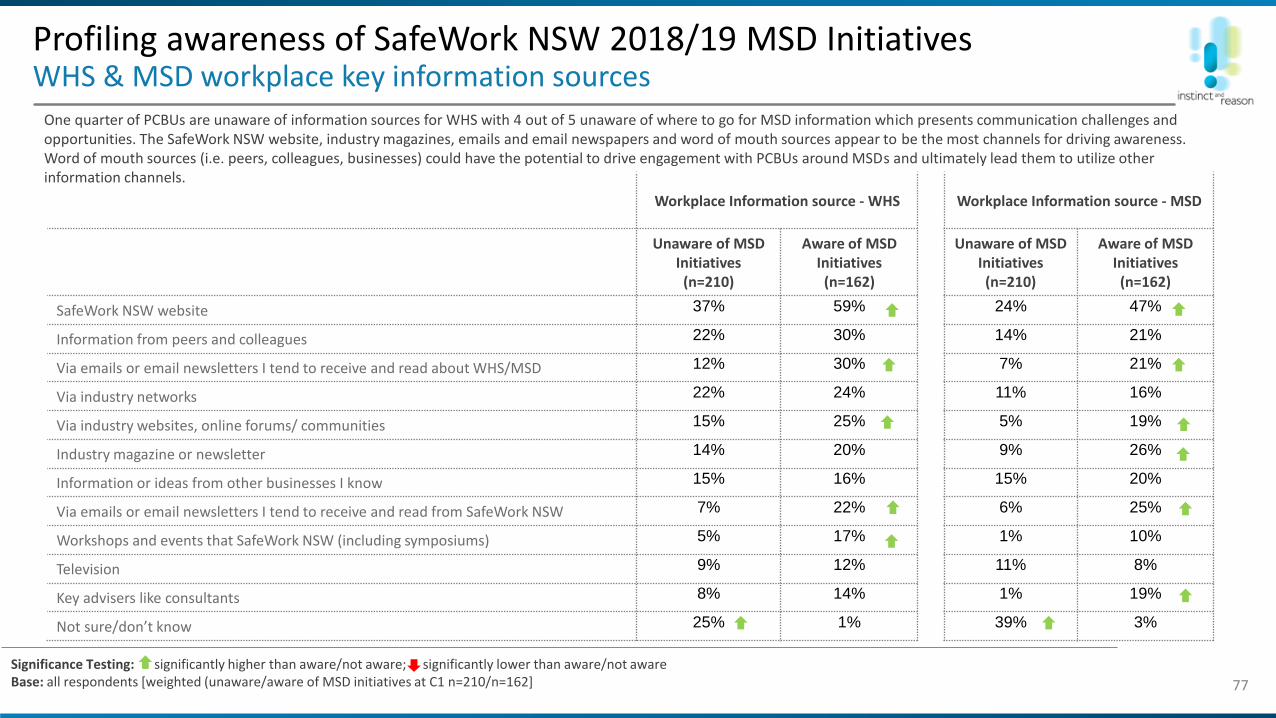
Profiling awareness of SafeWork NSW 2018/19 MSD InitiativesWHS & MSD workplace key information sources
77
Significance Testing: significantly higher than aware/not aware; significantly lower than aware/not awareBase: all respondents [weighted (unaware/aware of MSD initiatives at C1 n=210/n=162]
Workplace Information source - WHS Workplace Information source - MSD
Unaware of MSD Initiatives
(n=210)
Aware of MSD Initiatives
(n=162)
Unaware of MSD Initiatives(n=210)
Aware of MSD Initiatives(n=162)
SafeWork NSW website 37% 59% 24% 47%
Information from peers and colleagues 22% 30% 14% 21%
Via emails or email newsletters I tend to receive and read about WHS/MSD 12% 30% 7% 21%
Via industry networks 22% 24% 11% 16%
Via industry websites, online forums/ communities 15% 25% 5% 19%
Industry magazine or newsletter 14% 20% 9% 26%
Information or ideas from other businesses I know 15% 16% 15% 20%
Via emails or email newsletters I tend to receive and read from SafeWork NSW 7% 22% 6% 25%
Workshops and events that SafeWork NSW (including symposiums) 5% 17% 1% 10%
Television 9% 12% 11% 8%
Key advisers like consultants 8% 14% 1% 19%
Not sure/don’t know 25% 1% 39% 3%
One quarter of PCBUs are unaware of information sources for WHS with 4 out of 5 unaware of where to go for MSD information which presents communication challenges and opportunities. The SafeWork NSW website, industry magazines, emails and email newspapers and word of mouth sources appear to be the most channels for driving awareness. Word of mouth sources (i.e. peers, colleagues, businesses) could have the potential to drive engagement with PCBUs around MSDs and ultimately lead them to utilize other information channels.

www.instinctandreason.com
3h
PCBU channels of engagement
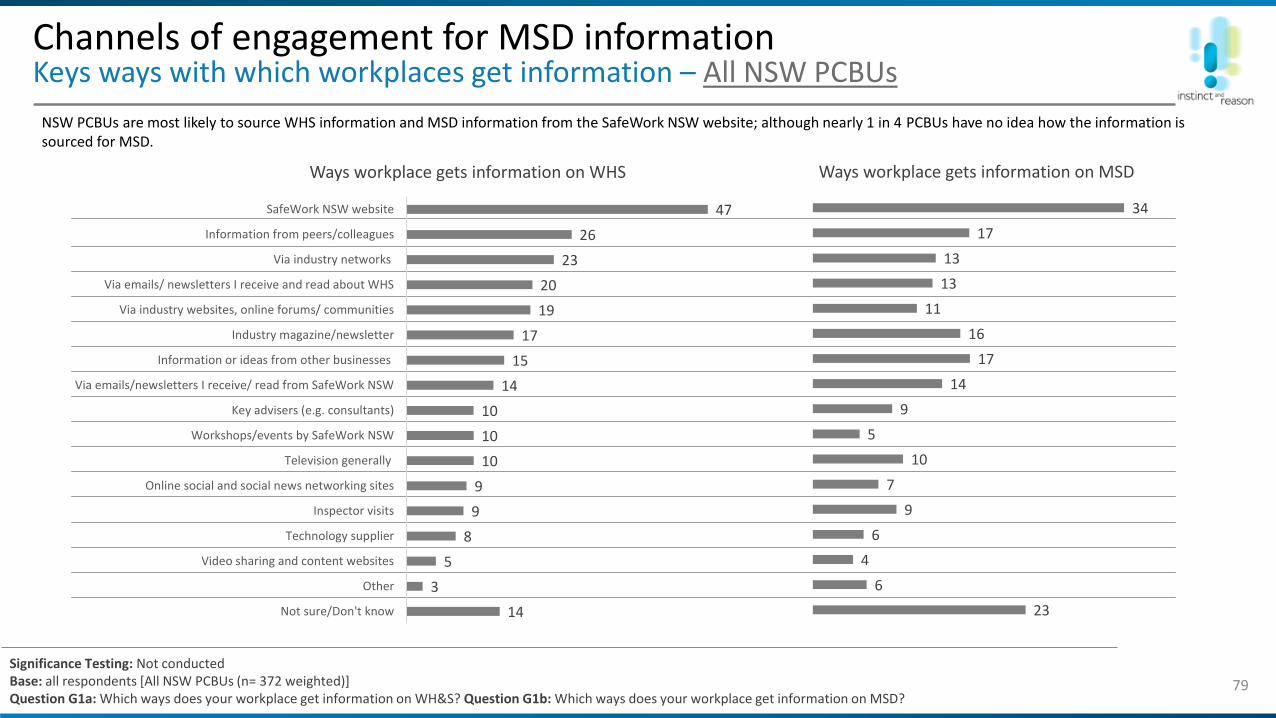
23
6
4
6
9
7
10
5
9
14
17
16
11
13
13
17
34
79
Channels of engagement for MSD informationKeys ways with which workplaces get information – All NSW PCBUs
Significance Testing: Not conductedBase: all respondents [All NSW PCBUs (n= 372 weighted)]Question G1a: Which ways does your workplace get information on WH&S? Question G1b: Which ways does your workplace get information on MSD?
Ways workplace gets information on WHS Ways workplace gets information on MSD
14
3
5
8
9
9
10
10
10
14
15
17
19
20
23
26
47
Not sure/Don't know
Other
Video sharing and content websites
Technology supplier
Inspector visits
Online social and social news networking sites
Television generally
Workshops/events by SafeWork NSW
Key advisers (e.g. consultants)
Via emails/newsletters I receive/ read from SafeWork NSW
Information or ideas from other businesses
Industry magazine/newsletter
Via industry websites, online forums/ communities
Via emails/ newsletters I receive and read about WHS
Via industry networks
Information from peers/colleagues
SafeWork NSW website
NSW PCBUs are most likely to source WHS information and MSD information from the SafeWork NSW website; although nearly 1 in 4 PCBUs have no idea how the information is sourced for MSD.
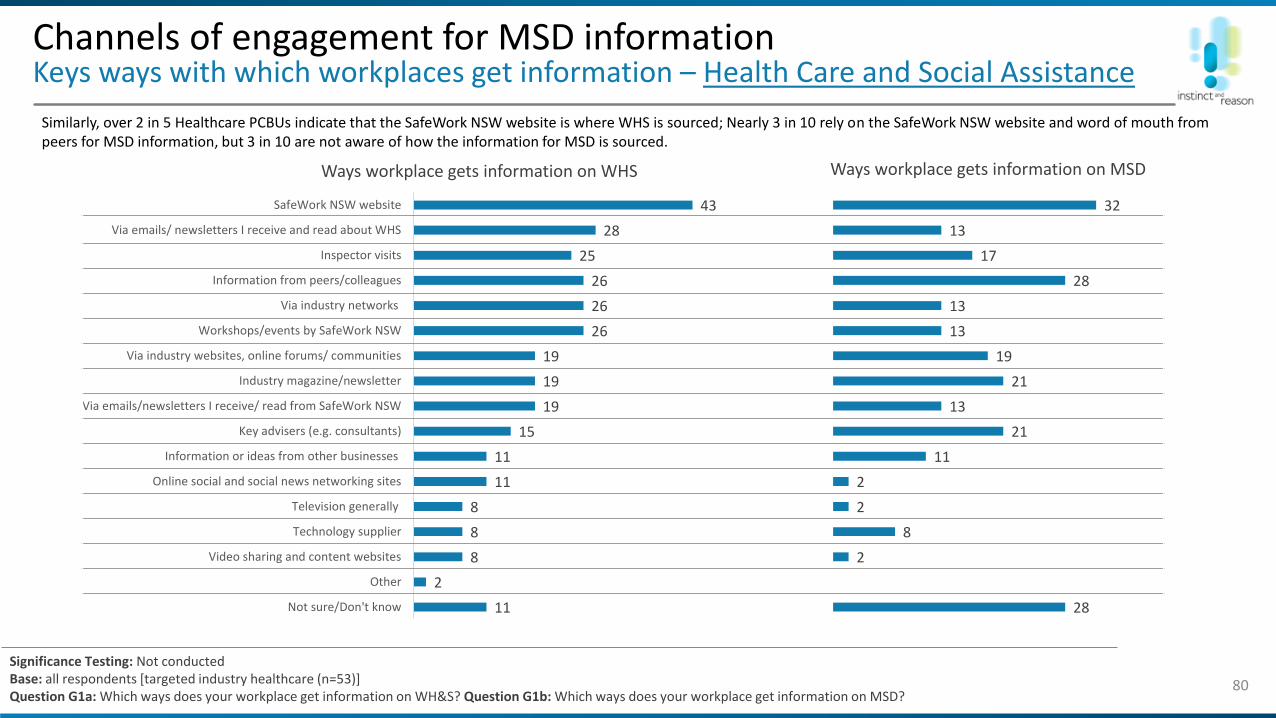
11
2
8
8
8
11
11
15
19
19
19
26
26
26
25
28
43
Not sure/Don't know
Other
Video sharing and content websites
Technology supplier
Television generally
Online social and social news networking sites
Information or ideas from other businesses
Key advisers (e.g. consultants)
Via emails/newsletters I receive/ read from SafeWork NSW
Industry magazine/newsletter
Via industry websites, online forums/ communities
Workshops/events by SafeWork NSW
Via industry networks
Information from peers/colleagues
Inspector visits
Via emails/ newsletters I receive and read about WHS
SafeWork NSW website
80
Similarly, over 2 in 5 Healthcare PCBUs indicate that the SafeWork NSW website is where WHS is sourced; Nearly 3 in 10 rely on the SafeWork NSW website and word of mouth from peers for MSD information, but 3 in 10 are not aware of how the information for MSD is sourced.
Channels of engagement for MSD informationKeys ways with which workplaces get information – Health Care and Social Assistance
Significance Testing: Not conductedBase: all respondents [targeted industry healthcare (n=53)]Question G1a: Which ways does your workplace get information on WH&S? Question G1b: Which ways does your workplace get information on MSD?
Ways workplace gets information on WHS Ways workplace gets information on MSD
28
2
8
2
2
11
21
13
21
19
13
13
28
17
13
32

81
Channels of engagement for MSD informationKeys ways with which workplaces get information – Manufacturing
Significance Testing: Not conductedBase: all respondents [targeted industry manufacturing (n=51)]Question G1a: Which ways does your workplace get information on WH&S? Question G1b: Which ways does your workplace get information on MSD?
Ways workplace gets information on WHS Ways workplace gets information on MSD
6
10
14
16
22
25
29
31
33
33
35
35
39
39
45
69
Not sure/Don't know
Other
Television generally
Video sharing and content websites
Technology supplier
Online social and social news networking sites
Key advisers (e.g. consultants)
Via emails/newsletters I receive/ read from SafeWork NSW
Information or ideas from other businesses
Via industry networks
Information from peers and colleagues
Inspector visits
Workshops/events by SafeWork NSW
Industry magazine or newsletter
Via emails/ newsletters I receive and read about WHS
Via industry websites, online forums/ communities
SafeWork NSW website
8
2
16
12
14
16
29
22
25
27
22
24
39
25
31
33
49
Manufacturing PCBUs indicate the highest use of the SafeWork NSW website for WHS information (7 in 10) and MSD information (1 in 2); Manufacturers are also likely to rely on SafeWork NSW workshops and events for MSD information.
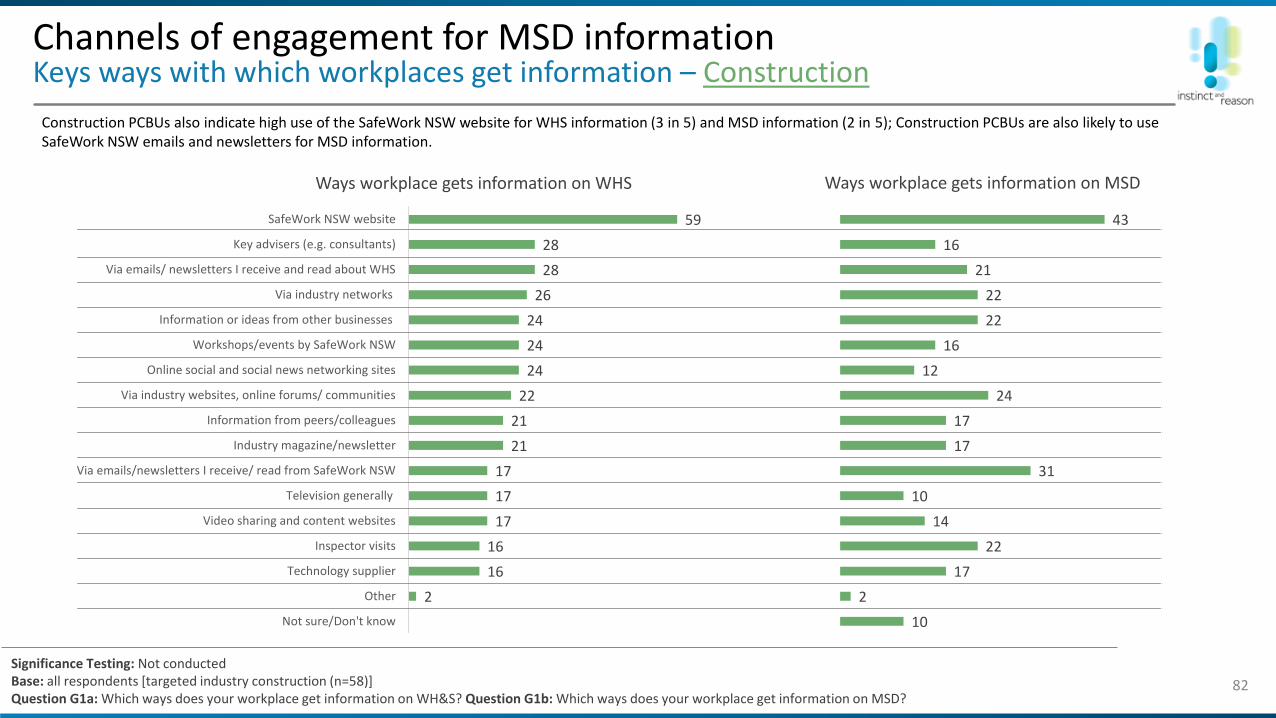
2
16
16
17
17
17
21
21
22
24
24
24
26
28
28
59
Not sure/Don't know
Other
Technology supplier
Inspector visits
Video sharing and content websites
Television generally
Via emails/newsletters I receive/ read from SafeWork NSW
Industry magazine/newsletter
Information from peers/colleagues
Via industry websites, online forums/ communities
Online social and social news networking sites
Workshops/events by SafeWork NSW
Information or ideas from other businesses
Via industry networks
Via emails/ newsletters I receive and read about WHS
Key advisers (e.g. consultants)
SafeWork NSW website
82
Channels of engagement for MSD informationKeys ways with which workplaces get information – Construction
Significance Testing: Not conductedBase: all respondents [targeted industry construction (n=58)]Question G1a: Which ways does your workplace get information on WH&S? Question G1b: Which ways does your workplace get information on MSD?
Ways workplace gets information on WHS Ways workplace gets information on MSD
10
2
17
22
14
10
31
17
17
24
12
16
22
22
21
16
43
Construction PCBUs also indicate high use of the SafeWork NSW website for WHS information (3 in 5) and MSD information (2 in 5); Construction PCBUs are also likely to use SafeWork NSW emails and newsletters for MSD information.
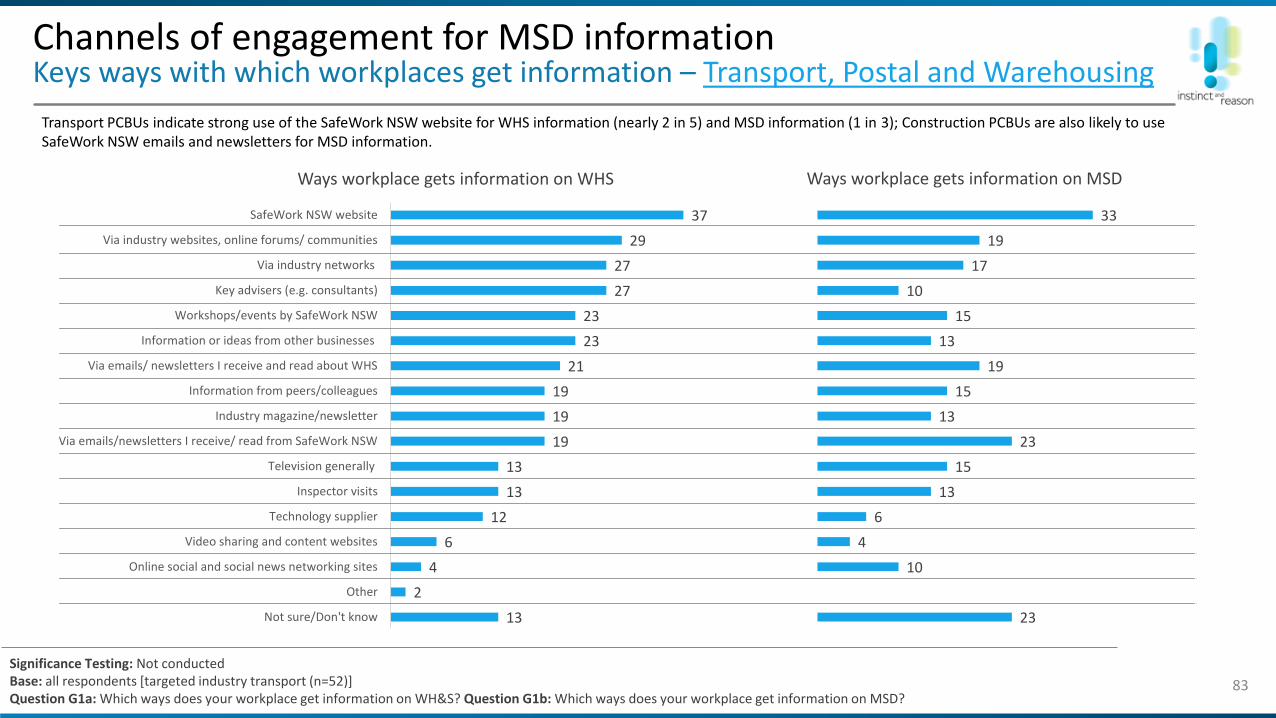
83
Channels of engagement for MSD informationKeys ways with which workplaces get information – Transport, Postal and Warehousing
Significance Testing: Not conductedBase: all respondents [targeted industry transport (n=52)]Question G1a: Which ways does your workplace get information on WH&S? Question G1b: Which ways does your workplace get information on MSD?
Ways workplace gets information on WHS Ways workplace gets information on MSD
13
2
4
6
12
13
13
19
19
19
21
23
23
27
27
29
37
Not sure/Don't know
Other
Online social and social news networking sites
Video sharing and content websites
Technology supplier
Inspector visits
Television generally
Via emails/newsletters I receive/ read from SafeWork NSW
Industry magazine/newsletter
Information from peers/colleagues
Via emails/ newsletters I receive and read about WHS
Information or ideas from other businesses
Workshops/events by SafeWork NSW
Key advisers (e.g. consultants)
Via industry networks
Via industry websites, online forums/ communities
SafeWork NSW website
23
10
4
6
13
15
23
13
15
19
13
15
10
17
19
33
Transport PCBUs indicate strong use of the SafeWork NSW website for WHS information (nearly 2 in 5) and MSD information (1 in 3); Construction PCBUs are also likely to use SafeWork NSW emails and newsletters for MSD information.

84
Channels of engagement for MSD informationKeys ways with which workplaces get information – Agriculture, Forestry and Fishing
Significance Testing: Not conductedBase: all respondents [targeted industry agriculture (n=54)]Question G1a: Which ways does your workplace get information on WH&S? Question G1b: Which ways does your workplace get information on MSD?
Ways workplace gets information on WHS Ways workplace gets information on MSD
30
9
7
9
11
19
9
11
19
19
9
19
22
20
22
22
24
19
4
7
11
13
15
15
19
19
20
24
24
24
26
30
31
39
Not sure/Don't know
Other
Video sharing and content websites
Inspector visits
Key advisers (e.g. consultants)
Technology supplier
Online social and social news networking sites
Workshops/events by SafeWork NSW
Via emails/ newsletters I receive and read about WHS
Via emails/newsletters I receive/ read from SafeWork NSW
Via industry networks
Television generally
Information or ideas from other businesses
Via industry websites, online forums/ communities
Information from peers/colleagues
SafeWork NSW website
Industry magazine/newsletter
Agriculture PCBUs have the highest level of uncertainty on how WHS and MSD information is found, and when they do, indicate a broader number of channels through which they may engage; Industry sources and peers feature highly as sources of information.
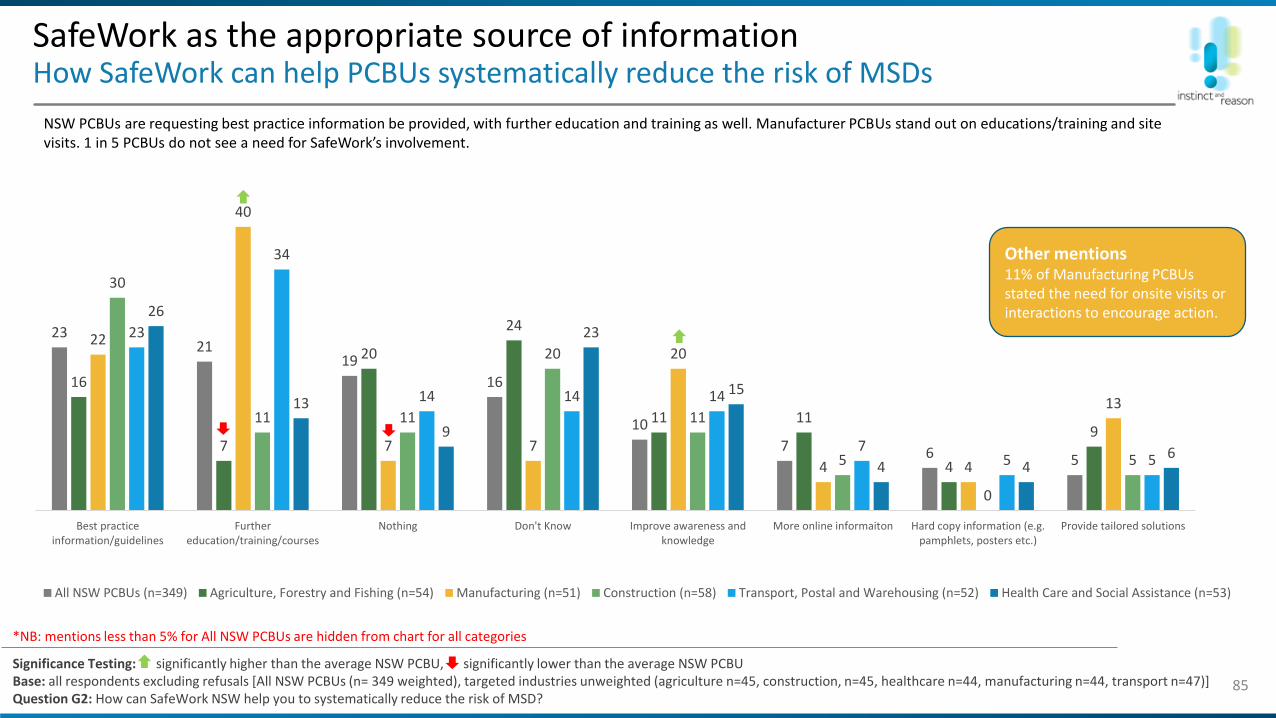
SafeWork as the appropriate source of informationHow SafeWork can help PCBUs systematically reduce the risk of MSDs
85
NSW PCBUs are requesting best practice information be provided, with further education and training as well. Manufacturer PCBUs stand out on educations/training and site visits. 1 in 5 PCBUs do not see a need for SafeWork’s involvement.
2321
19
16
10
7 6 5
16
7
20
24
11 11
4
9
22
40
7 7
20
4 4
13
30
11 11
20
11
5
0
5
23
34
14 14 14
75 5
26
13
9
23
15
4 46
Best practiceinformation/guidelines
Furthereducation/training/courses
Nothing Don't Know Improve awareness andknowledge
More online informaiton Hard copy information (e.g.pamphlets, posters etc.)
Provide tailored solutions
All NSW PCBUs (n=349) Agriculture, Forestry and Fishing (n=54) Manufacturing (n=51) Construction (n=58) Transport, Postal and Warehousing (n=52) Health Care and Social Assistance (n=53)
Significance Testing: significantly higher than the average NSW PCBU, significantly lower than the average NSW PCBUBase: all respondents excluding refusals [All NSW PCBUs (n= 349 weighted), targeted industries unweighted (agriculture n=45, construction, n=45, healthcare n=44, manufacturing n=44, transport n=47)]Question G2: How can SafeWork NSW help you to systematically reduce the risk of MSD?
*NB: mentions less than 5% for All NSW PCBUs are hidden from chart for all categories
Other mentions11% of Manufacturing PCBUs stated the need for onsite visits or interactions to encourage action.

www.instinctandreason.com
4
Sample and data notes

87
Short-term EvaluationConsiderations for the next evaluation
The short-term evaluation revealed several areas that will be important to consider in future evaluations.
Claims data
• Progress towards achieving a 50% reduction in the incidence of major MSD claims could not be calculated at the time of this report’s production. At the time
of data compilation, static claims data and denominator data (number of employees) for the 2017/18 year were not available. If denominator data for
2017/18 is not yet available from Safe Work Australia, it has been suggested by SIRA to use 2016/17 as indication, but this has not yet occurred. It will be
important to assess the change in claims data once this is known to determine if the target remains on track, particularly as this the 2017/18data period
provides the first opportunity to assess claims data during the implementation period of the strategy.
• Claims data as at March 2018 (as previously reported) is not comparable with data measured 14 months later as at June 2019. There will be differences in
claims number and classification of claims as they develop, and the severity of claims emerged.
• The segmentation revealed the prevalence of small businesses in weaker attitudinal and behavioural metrics for addressing MSD risks. It will be important to
assess their influence on major MSD claims to determine where the strategy’s priorities should be focused as varying strategies can be applied as determined
in the segmentation analysis.
The data analysis
• Many open responses were found to have been googled (e.g. such as in the definition of an MSD). While these obvious responses were removed from the
analysis, the next evaluation will need to adjust and monitor for such events for quality assurance.
• In question B2, modify definition so not to influence B3 results. The inclusion of ‘slips, trips and falls’ and ‘(such as RSI)’ is likely to have influenced results in B3
and so should be remove the entire second statement that discusses how MSDs can occur.
• Continue to monitor the public data set for any information that might assist in the evaluation of the strategy.
• Continue to build a representative sample to be able to match progress on key initiatives from the short-term evaluation onwards. The baseline evaluation
was not considered representative.
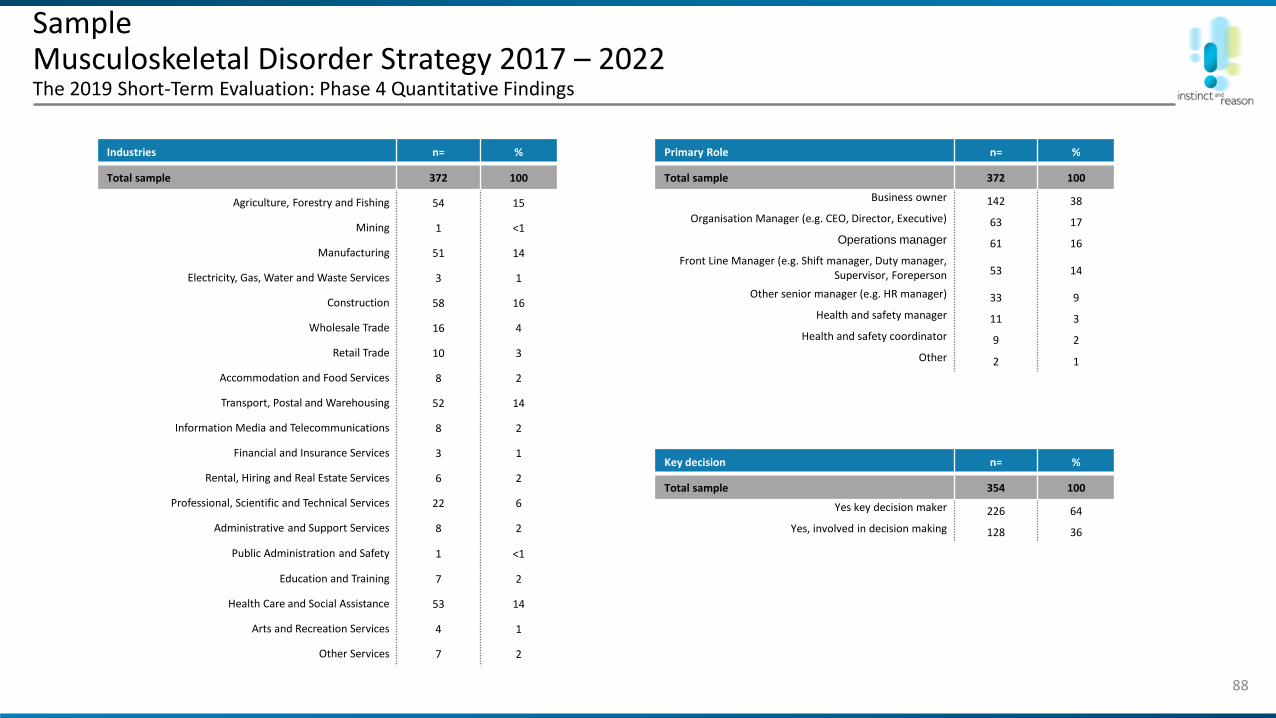
SampleMusculoskeletal Disorder Strategy 2017 – 2022The 2019 Short-Term Evaluation: Phase 4 Quantitative Findings
88
Industries n= %
Total sample 372 100
Agriculture, Forestry and Fishing 54 15
Mining 1 <1
Manufacturing 51 14
Electricity, Gas, Water and Waste Services 3 1
Construction 58 16
Wholesale Trade 16 4
Retail Trade 10 3
Accommodation and Food Services 8 2
Transport, Postal and Warehousing 52 14
Information Media and Telecommunications 8 2
Financial and Insurance Services 3 1
Rental, Hiring and Real Estate Services 6 2
Professional, Scientific and Technical Services 22 6
Administrative and Support Services 8 2
Public Administration and Safety 1 <1
Education and Training 7 2
Health Care and Social Assistance 53 14
Arts and Recreation Services 4 1
Other Services 7 2
Primary Role n= %
Total sample 372 100
Business owner 142 38
Organisation Manager (e.g. CEO, Director, Executive) 63 17
Operations manager 61 16
Front Line Manager (e.g. Shift manager, Duty manager, Supervisor, Foreperson 53 14
Other senior manager (e.g. HR manager) 33 9
Health and safety manager 11 3
Health and safety coordinator 9 2
Other 2 1
Key decision n= %
Total sample 354 100
Yes key decision maker 226 64
Yes, involved in decision making 128 36
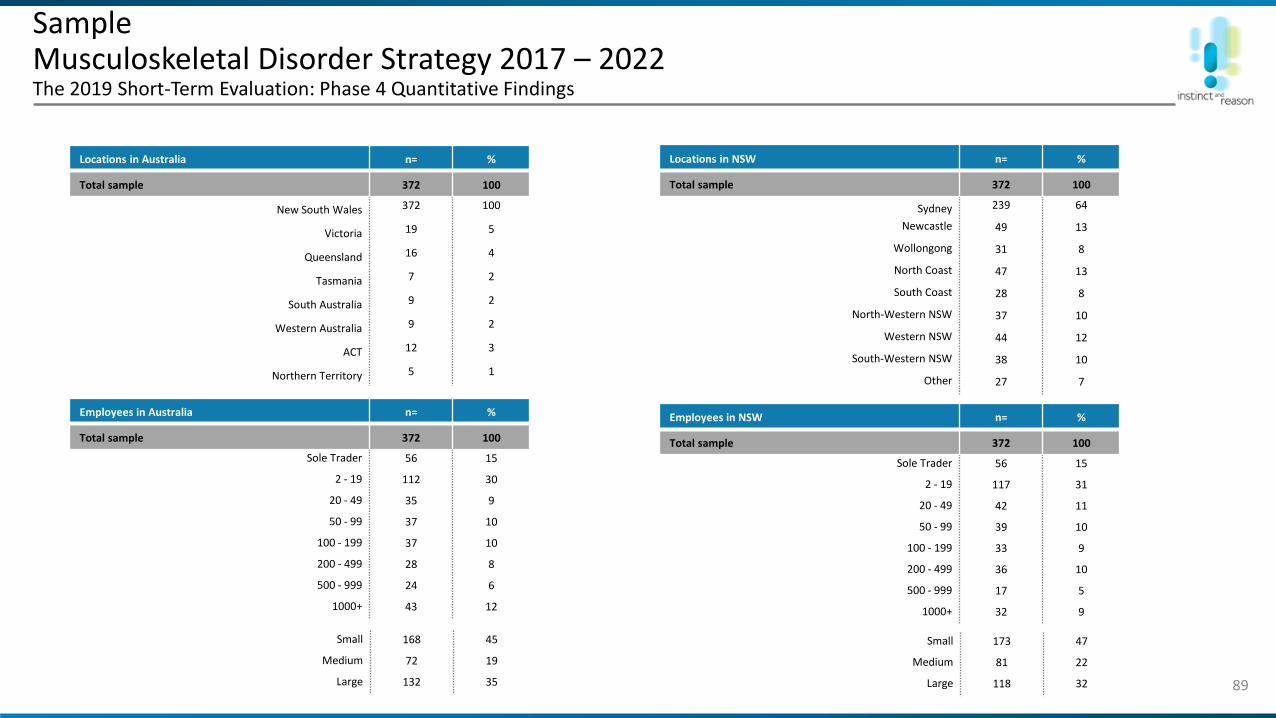
SampleMusculoskeletal Disorder Strategy 2017 – 2022The 2019 Short-Term Evaluation: Phase 4 Quantitative Findings
89
Locations in Australia n= %
Total sample 372 100
New South Wales 372 100
Victoria 19 5
Queensland 16 4
Tasmania 7 2
South Australia 9 2
Western Australia 9 2
ACT 12 3
Northern Territory 5 1
Locations in NSW n= %
Total sample 372 100
Sydney 239 64
Newcastle 49 13
Wollongong 31 8
North Coast 47 13
South Coast 28 8
North-Western NSW 37 10
Western NSW 44 12
South-Western NSW 38 10
Other 27 7
Small 168 45
Medium 72 19
Large 132 35
Employees in Australia n= %
Total sample 372 100
Sole Trader 56 15
2 - 19 112 30
20 - 49 35 9
50 - 99 37 10
100 - 199 37 10
200 - 499 28 8
500 - 999 24 6
1000+ 43 12
Small 173 47
Medium 81 22
Large 118 32
Employees in NSW n= %
Total sample 372 100
Sole Trader 56 15
2 - 19 117 31
20 - 49 42 11
50 - 99 39 10
100 - 199 33 9
200 - 499 36 10
500 - 999 17 5
1000+ 32 9
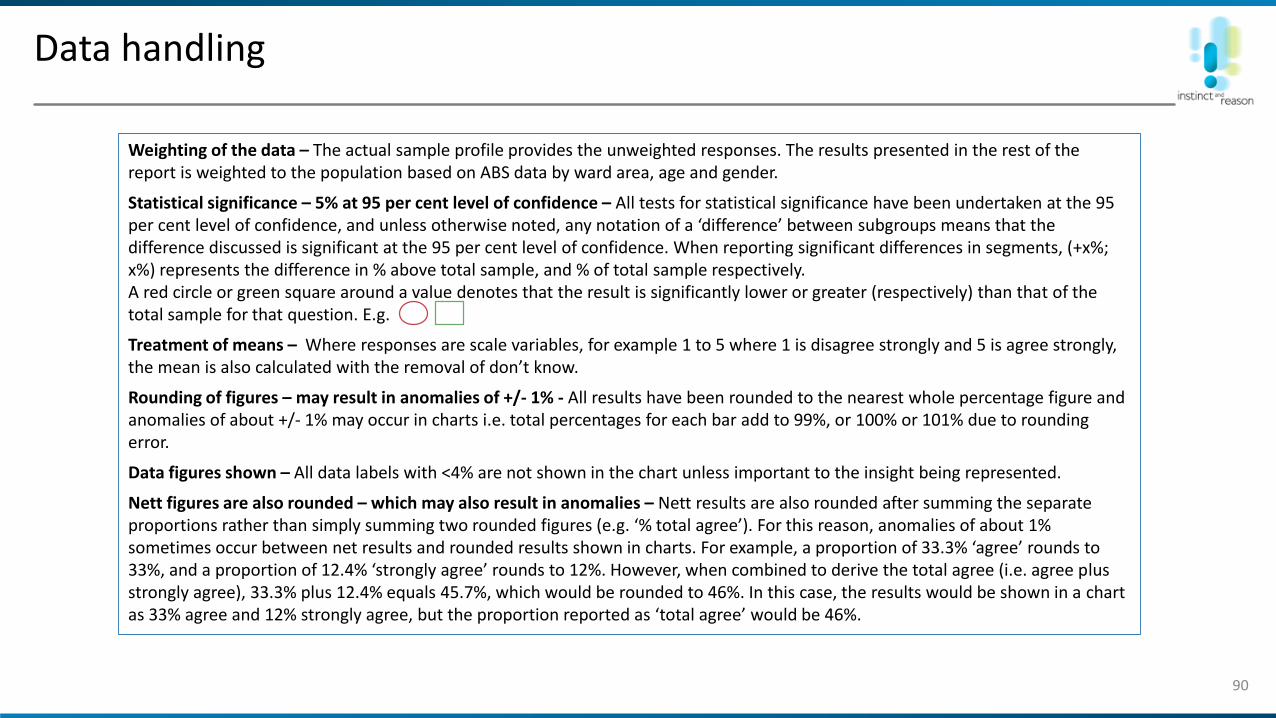
Data handling
90
Weighting of the data – The actual sample profile provides the unweighted responses. The results presented in the rest of the report is weighted to the population based on ABS data by ward area, age and gender.
Statistical significance – 5% at 95 per cent level of confidence – All tests for statistical significance have been undertaken at the 95 per cent level of confidence, and unless otherwise noted, any notation of a ‘difference’ between subgroups means that the difference discussed is significant at the 95 per cent level of confidence. When reporting significant differences in segments, (+x%; x%) represents the difference in % above total sample, and % of total sample respectively.A red circle or green square around a value denotes that the result is significantly lower or greater (respectively) than that of the total sample for that question. E.g.
Treatment of means – Where responses are scale variables, for example 1 to 5 where 1 is disagree strongly and 5 is agree strongly, the mean is also calculated with the removal of don’t know.
Rounding of figures – may result in anomalies of +/- 1% - All results have been rounded to the nearest whole percentage figure and anomalies of about +/- 1% may occur in charts i.e. total percentages for each bar add to 99%, or 100% or 101% due to rounding error.
Data figures shown – All data labels with <4% are not shown in the chart unless important to the insight being represented.
Nett figures are also rounded – which may also result in anomalies – Nett results are also rounded after summing the separate proportions rather than simply summing two rounded figures (e.g. ‘% total agree’). For this reason, anomalies of about 1% sometimes occur between net results and rounded results shown in charts. For example, a proportion of 33.3% ‘agree’ rounds to33%, and a proportion of 12.4% ‘strongly agree’ rounds to 12%. However, when combined to derive the total agree (i.e. agree plusstrongly agree), 33.3% plus 12.4% equals 45.7%, which would be rounded to 46%. In this case, the results would be shown in a chart as 33% agree and 12% strongly agree, but the proportion reported as ‘total agree’ would be 46%.

Correspondence AnalysisHow to understand Correspondence Analysis (perceptual maps)
91
Perceptual or positioning maps help develop an industry/market strategy by showing where the existing industries are positioned in terms of market defining factors. It assists in identifying where work should be done to position an industry relative for change.
Correspondence analysis is a statistical technique of graphical representation highlighting the relative strength of an industry compared to other industries, as determined by how close together things are on the map. At a nuanced level, we look at the distance between the row and column categories from the centre of the map. The further they are from the centre of the map, the stronger the relationship. The actual correct interpretation is even more complex than this yet.
How to Read:
• Greater distance from origin indicates a greater degree of differentiation from the other levels in the traffic scale. Applies to both attributes and to scale points.
− in this example, Point 1 is more differentiated than Point 2
• Smaller distance from matched indicator indicates greater strength of description. Applies to attributes only
− in this example, attribute A is a better descriptor than attribute B for Point 1
− of the 4 attributes shown, attribute C has the best fit with its matched scale point as it has the smallest distance from the Point 2 plot

Sydney, Australia420 Elizabeth StreetSurry Hills NSW 2010e: [email protected]: +61 (0)2 9283 2233
Canberra, Australia103/11 Trevillian QuayKingston ACT 2604e: [email protected]: +61 (0)2 6231 0350
Darwin, AustraliaLevel 16, Charles Darwin Centre19 Smith Street Mall Darwin NT 0800e: [email protected]: +61 (0)8 8963 5633
London, UKNo. 7 Ridgmount Street, suite 1, London, WC1 E7AE, United Kingdome: [email protected]: +44 (0)2 03 355 4454
August, 2019
For further information please contact our Sydney office
Questions?