Embed Size (px)
Citation preview
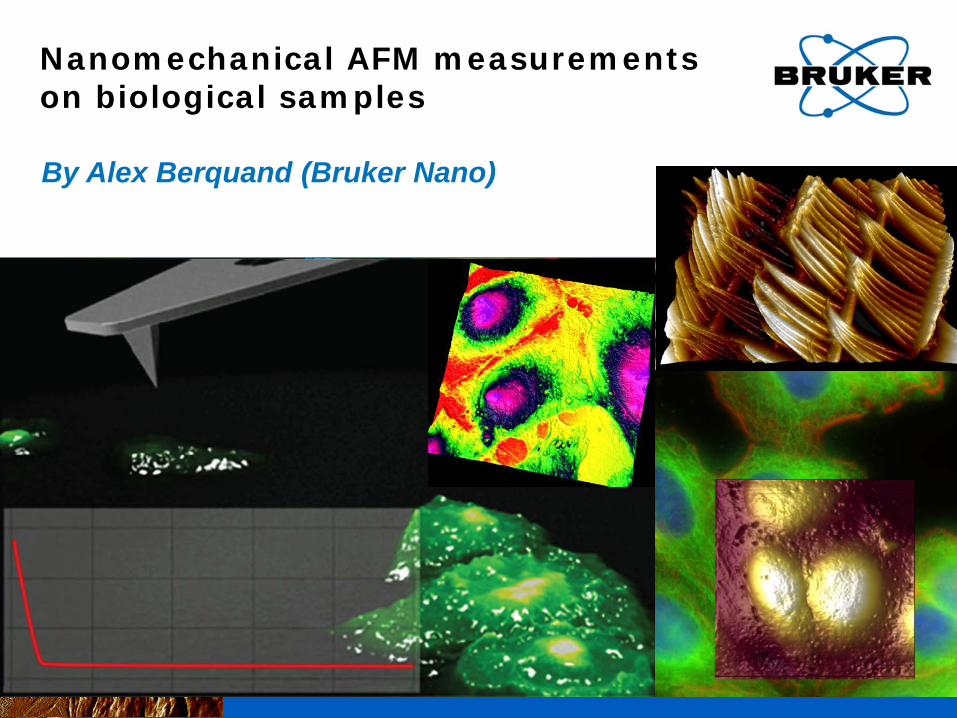
Nanomechanical AFM measurements on biological samples
By Alex Berquand (Bruker Nano)

What’s behind “cell mechanics” and why is it so important in biology? Complexity of signal transduction in cells
1/22/2013 2 BRUKER CONFIDENTIAL
A B
C
• A, B and C have different stiffness and contain various molecules.
• Those molecules are associated to the inner components of the cell.
• They can regulate normal functions or lead to imbalance/disease.
• Identifying A, B and C and their components is of great importance.
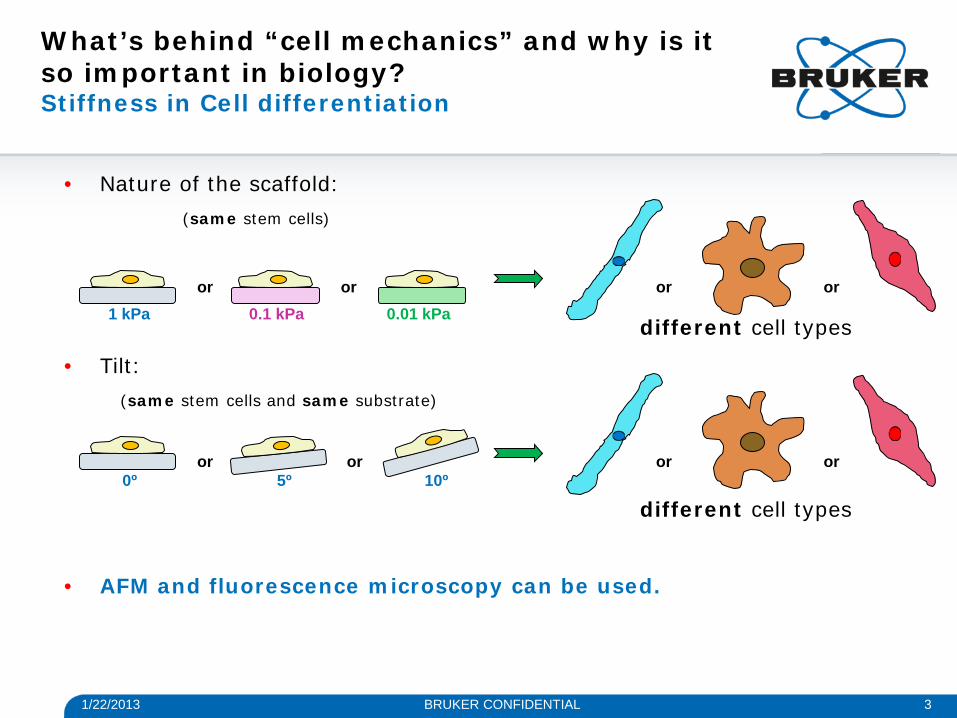
• Nature of the scaffold: (same stem cells)
different cell types
• Tilt: (same stem cells and same substrate)
different cell types
• AFM and fluorescence microscopy can be used.
1/22/2013 3 BRUKER CONFIDENTIAL
What’s behind “cell mechanics” and why is it so important in biology? Stiffness in Cell differentiation
or or 1 kPa 0.1 kPa 0.01 kPa
or or
0º 5º 10º or or or or

1/22/2013 4 BRUKER CONFIDENTIAL
Concrete example Cancer: why is sensing differences in elasticity important?
• Cancer cells are usually softer than their counterparts, especially in the case of bladder (Lekka et al. 1999), prostate (Faria et al. 2008), breast (Cross et al. 2007), cartilage (Darling et al. 2007), blood (Rosenbluth et al. 2006) and ovarian (Sharma et al. 2011) tissues.
• Some organs are not permeable to antibiotics.
• Cancer surgery is often highly risky.
• Identifying differences in elasticity at an early stage is required. Possible by AFM on the corresponding cells lines.
- Lekka M. and Laidler P., Nat. Nanotechnol. 72 (2009) 72-73. - Faria E. C. et al., Analyst 133 (2008) 1498-500. - Cross S.E. et al. Nat. Nanotechnol. 2 (2007) 780-783. - Rosenbluth M.J. et al., Biophys. J. 90 (2006) 2994-3003. - Sharma S. et al., Nanomed. Nanotechnol. Biol. Med. (2011) under press.
1/22/2013 5 BRUKER CONFIDENTIAL
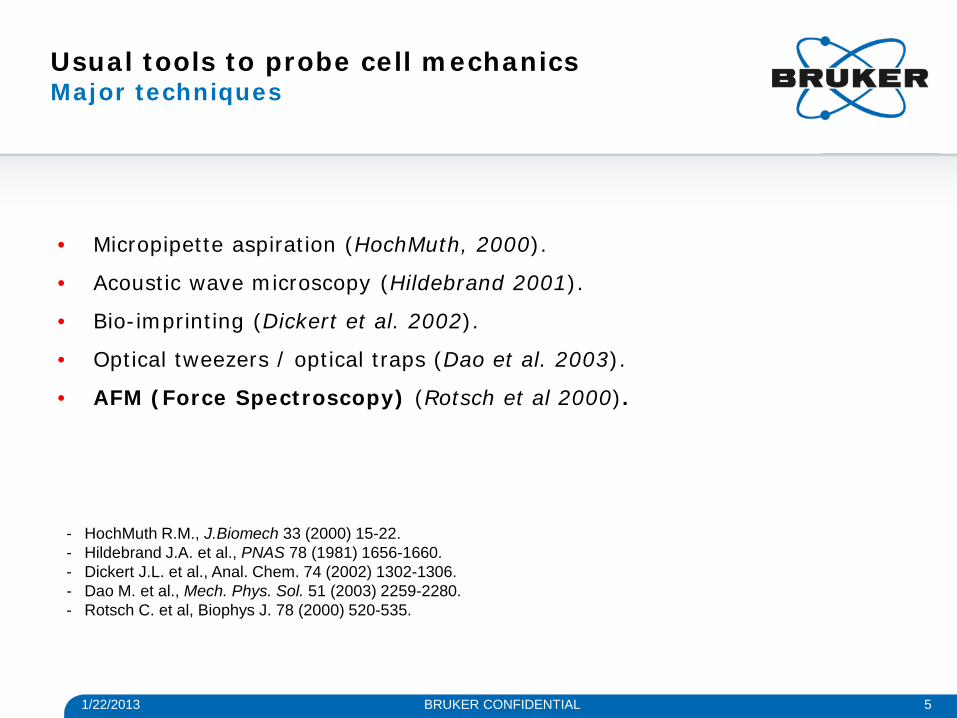
Usual tools to probe cell mechanics Major techniques
• Micropipette aspiration (HochMuth, 2000).
• Acoustic wave microscopy (Hildebrand 2001).
• Bio-imprinting (Dickert et al. 2002).
• Optical tweezers / optical traps (Dao et al. 2003).
• AFM (Force Spectroscopy) (Rotsch et al 2000).
- HochMuth R.M., J.Biomech 33 (2000) 15-22. - Hildebrand J.A. et al., PNAS 78 (1981) 1656-1660. - Dickert J.L. et al., Anal. Chem. 74 (2002) 1302-1306. - Dao M. et al., Mech. Phys. Sol. 51 (2003) 2259-2280. - Rotsch C. et al, Biophys J. 78 (2000) 520-535.

Principle of AFM Optical detection system
1/22/2013 6 BRUKER CONFIDENTIAL
Different feedbacks for different AFM modes

atoms
molecules bacterioΦ chloroplasts bacteria cells
0.1nm 1nm 10nm 100nm 1µm 10µm 100µm
AFM
light microscopy
EM
AFM Resolution Compared to other microscopy techniques

1/22/2013 BRUKER CONFIDENTIAL
Combining AFM to Fluorescence 2 techniques in 1 tool
AFM Optics

1/22/2013 9 BRUKER CONFIDENTIAL
AFM + …
Sample courtesy Zeiss
Sample courtesy NIH
Sample courtesy SWMC Stanford
Sample courtesy INRA Nantes
Sample courtesy Nat. Univ. Singapore
Sample courtesy Univ. of New South Wales
Combining AFM to IOM Compatibility with various optical techniques

1/22/2013 10 BRUKER CONFIDENTIAL
3) Overlay optical and AFM images
1) Import optical image into Nanoscope
2) Target a location for the AFM scan
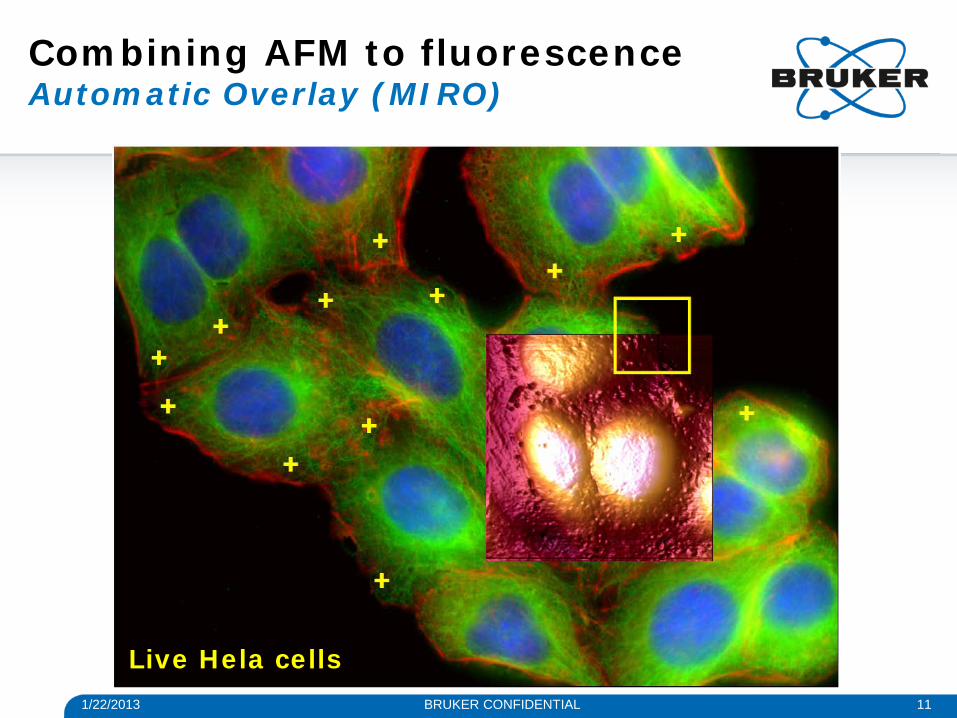
Combining AFM to fluorescence Automatic Overlay (MIRO)
1) Capture 3 sample images at 3 different locations.
2) Capture 1 tip image.
3) Capture a background image and overlay it with an AFM image.
1/22/2013 11 BRUKER CONFIDENTIAL
Combining AFM to fluorescence Automatic Overlay (MIRO)
Live Hela cells
1/22/2013 12 BRUKER CONFIDENTIAL
distance (nm)
forc
e (n
N)
0
1
2
-1 500 0
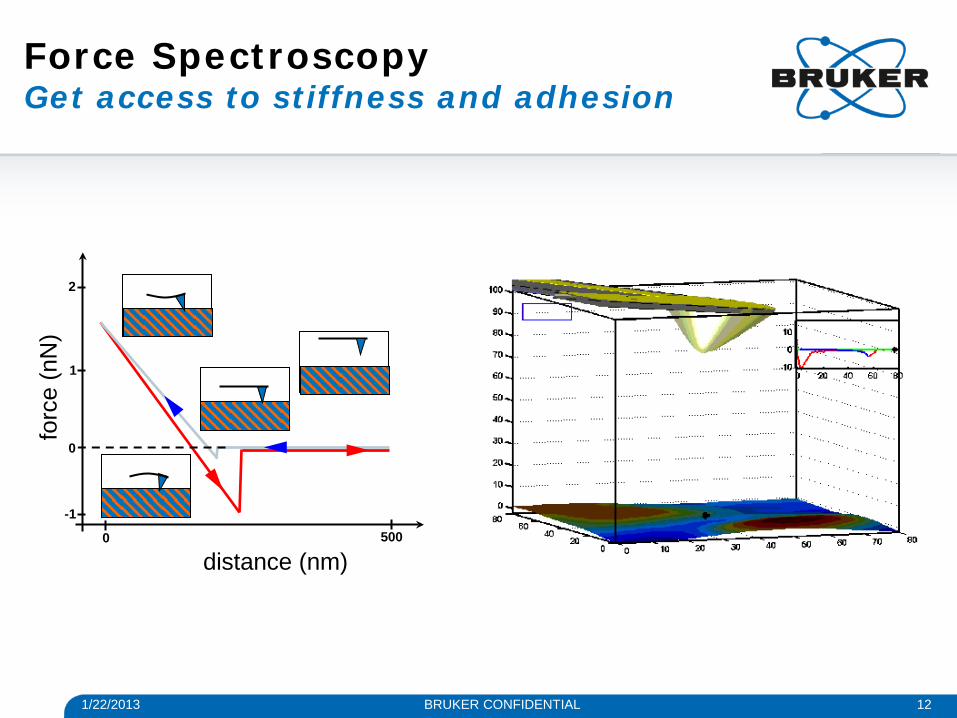
Force Spectroscopy Get access to stiffness and adhesion

Hertz DMT JKR
MD
Sneddon
(Most adapted for biological samples)
Standard for Peak Force QNM
Contact theories in AFM Different models / samples
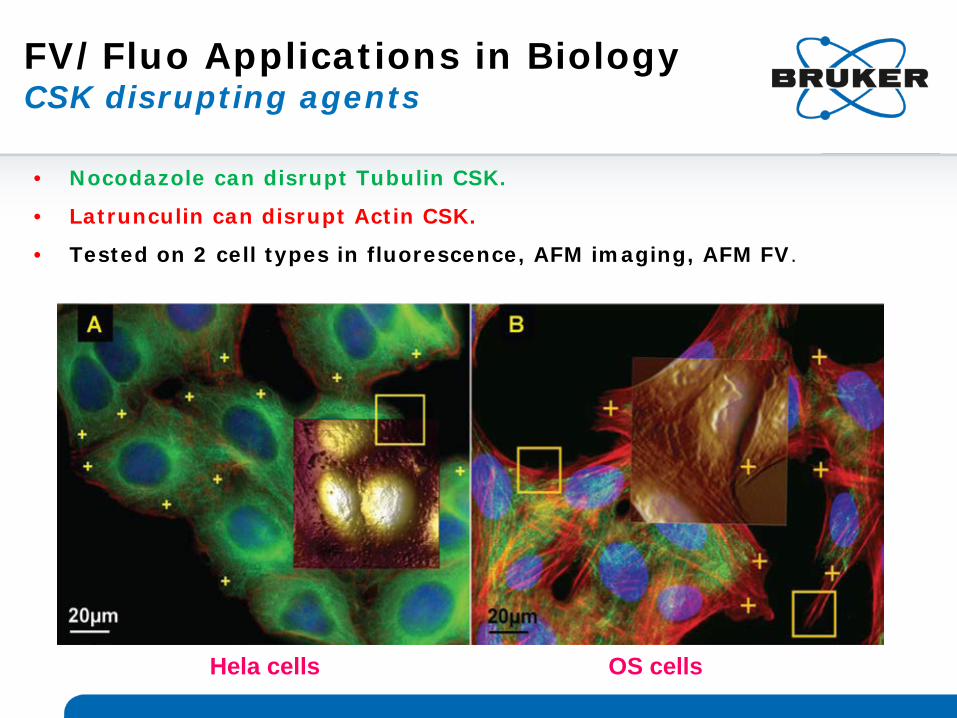
Hela cells OS cells
FV/Fluo Applications in Biology CSK disrupting agents
• Nocodazole can disrupt Tubulin CSK.
• Latrunculin can disrupt Actin CSK.
• Tested on 2 cell types in fluorescence, AFM imaging, AFM FV.
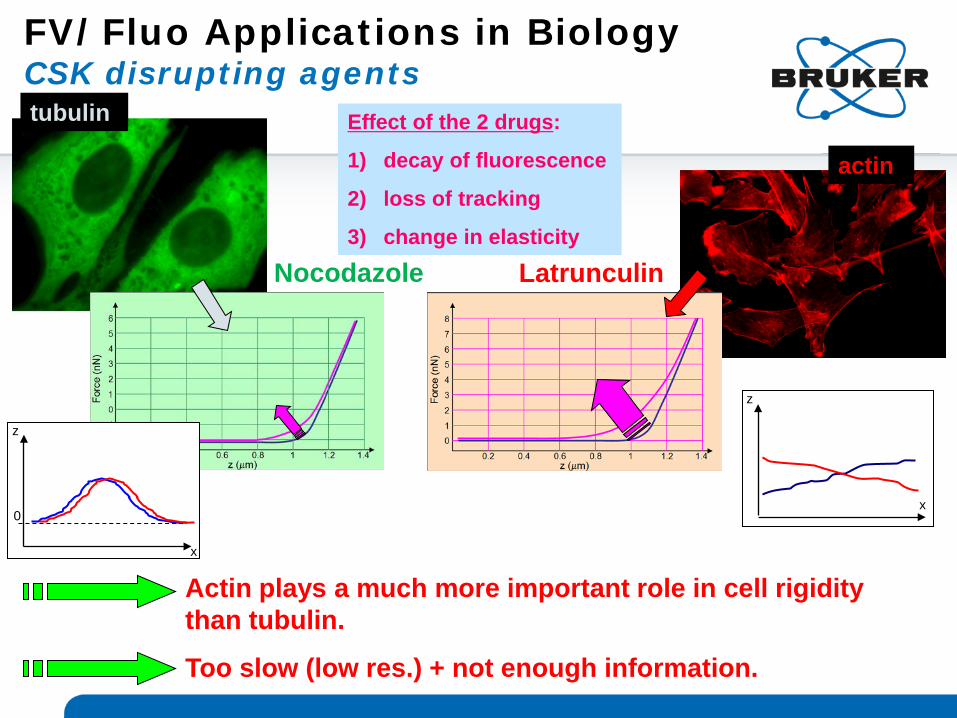
Effect of the 2 drugs:
1) decay of fluorescence
2) loss of tracking
3) change in elasticity
Actin plays a much more important role in cell rigidity than tubulin.
Too slow (low res.) + not enough information.
tubulin
actin
Nocodazole Latrunculin
0
z
x
z
x
FV/Fluo Applications in Biology CSK disrupting agents
1/22/2013 16 BRUKER CONFIDENTIAL
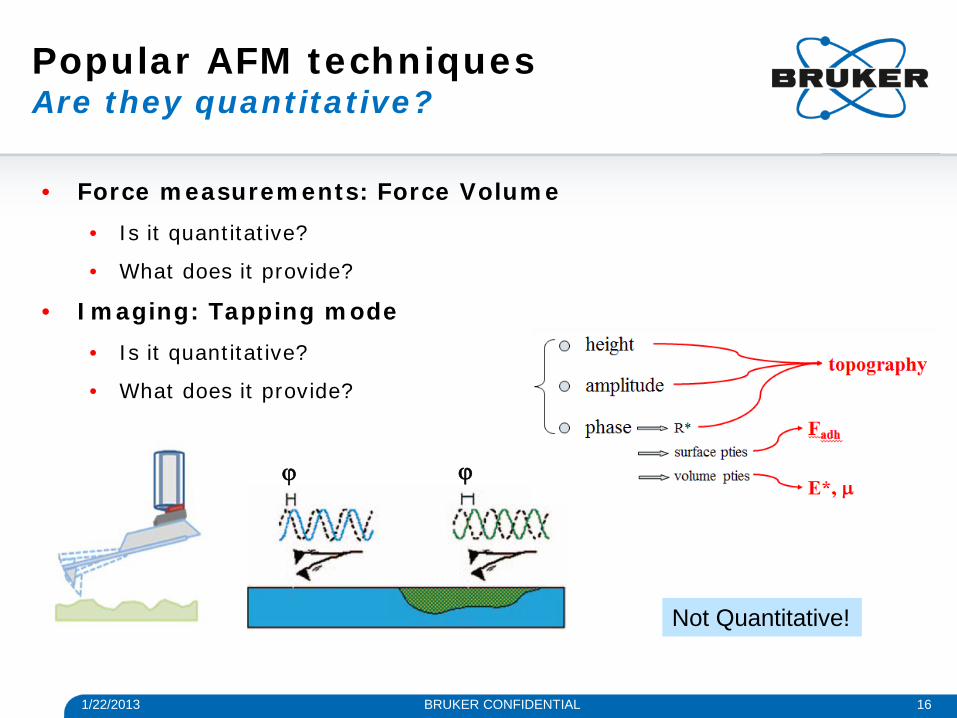
Popular AFM techniques Are they quantitative?
• Force measurements: Force Volume • Is it quantitative?
• What does it provide?
• Imaging: Tapping mode • Is it quantitative?
• What does it provide?
ϕ ϕ
Not Quantitative!
1/22/2013 17 BRUKER CONFIDENTIAL
FV to slow to probe biological processes? True for most of them
• Examples:
• Diffusion of proteins: 10-5-10-9 cm2.s-1.
• Polymerization of microtubules: sec-min.
• Protein translocation to nucleus (can be probed by fluorescence): 30 min to 1 h.
• Cell migration: µm/sec-µm/h.
• Cell division: 20 min to 3 days.
• Ideally: less than 10 min per AFM image. Impossible with FV or loss of resolution.
• Need for acceptable resolution to compare AFM and Fluorescence data (for instance: increasing number of STED publications).
1/22/2013 18 BRUKER CONFIDENTIAL
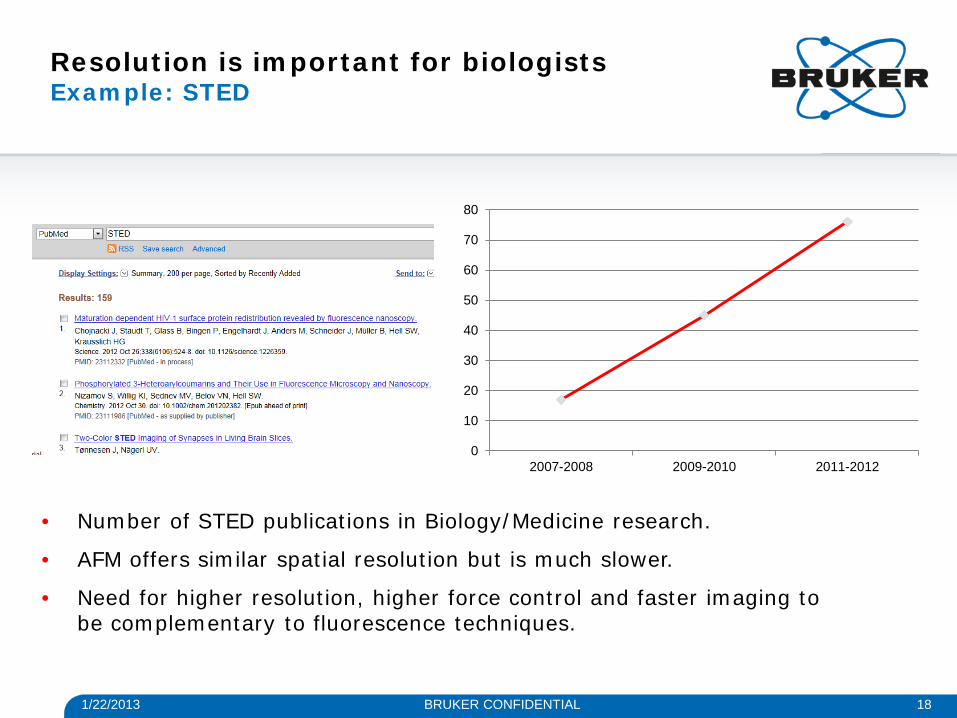
Resolution is important for biologists Example: STED
0
10
20
30
40
50
60
70
80
2007-2008 2009-2010 2011-2012
• Number of STED publications in Biology/Medicine research.
• AFM offers similar spatial resolution but is much slower.
• Need for higher resolution, higher force control and faster imaging to be complementary to fluorescence techniques.
Need for a new characterization technique Peak Force Tapping and Peak Force QNM
1/22/2013 19 BRUKER CONFIDENTIAL
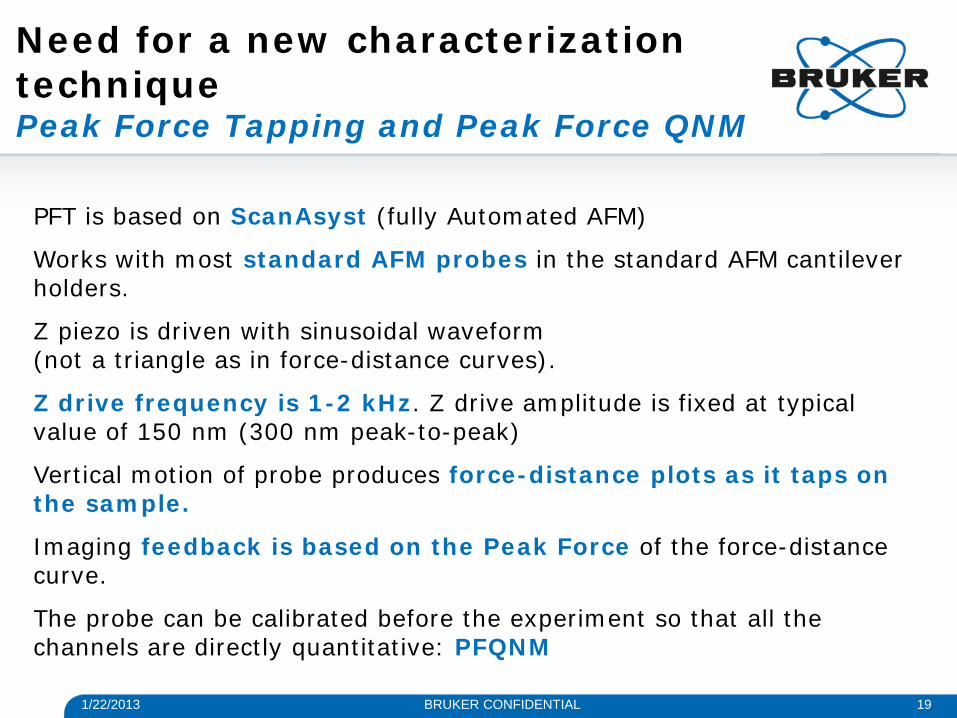
PFT is based on ScanAsyst (fully Automated AFM)
Works with most standard AFM probes in the standard AFM cantilever holders.
Z piezo is driven with sinusoidal waveform (not a triangle as in force-distance curves).
Z drive frequency is 1-2 kHz. Z drive amplitude is fixed at typical value of 150 nm (300 nm peak-to-peak)
Vertical motion of probe produces force-distance plots as it taps on the sample.
Imaging feedback is based on the Peak Force of the force-distance curve.
The probe can be calibrated before the experiment so that all the channels are directly quantitative: PFQNM

1/22/2013 20 BRUKER CONFIDENTIAL
Needed range of Young’s moduli Example: Human Body
Overview: PeakForce QNM Basic Principle
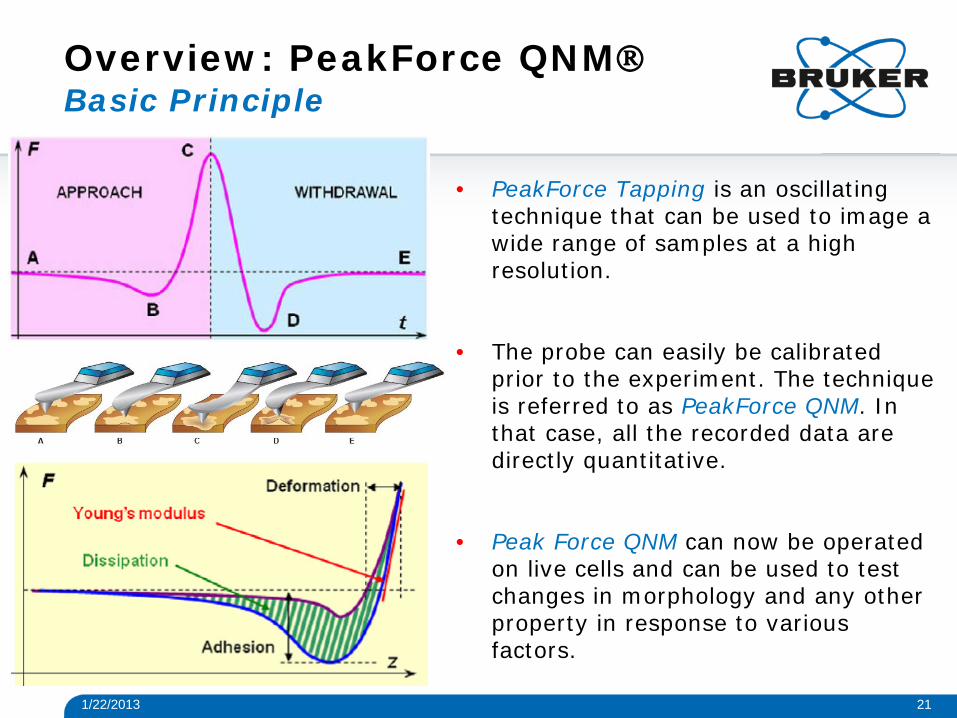
• PeakForce Tapping is an oscillating technique that can be used to image a wide range of samples at a high resolution.
• The probe can easily be calibrated prior to the experiment. The technique is referred to as PeakForce QNM. In that case, all the recorded data are directly quantitative.
• Peak Force QNM can now be operated on live cells and can be used to test changes in morphology and any other property in response to various factors.
21
5nm
1/22/2013
1/22/2013 22
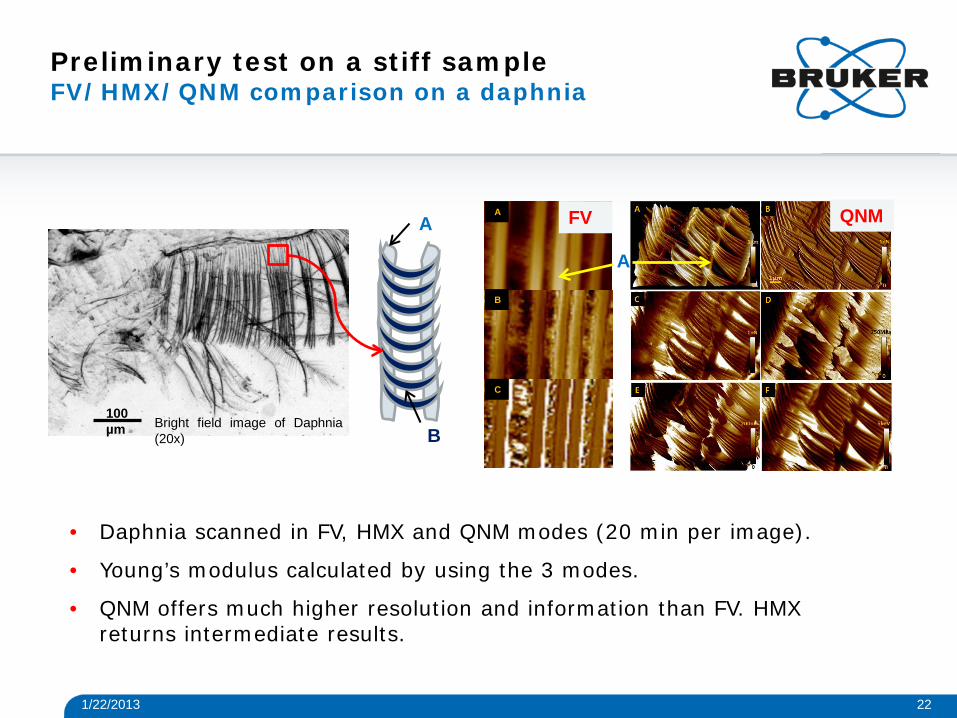
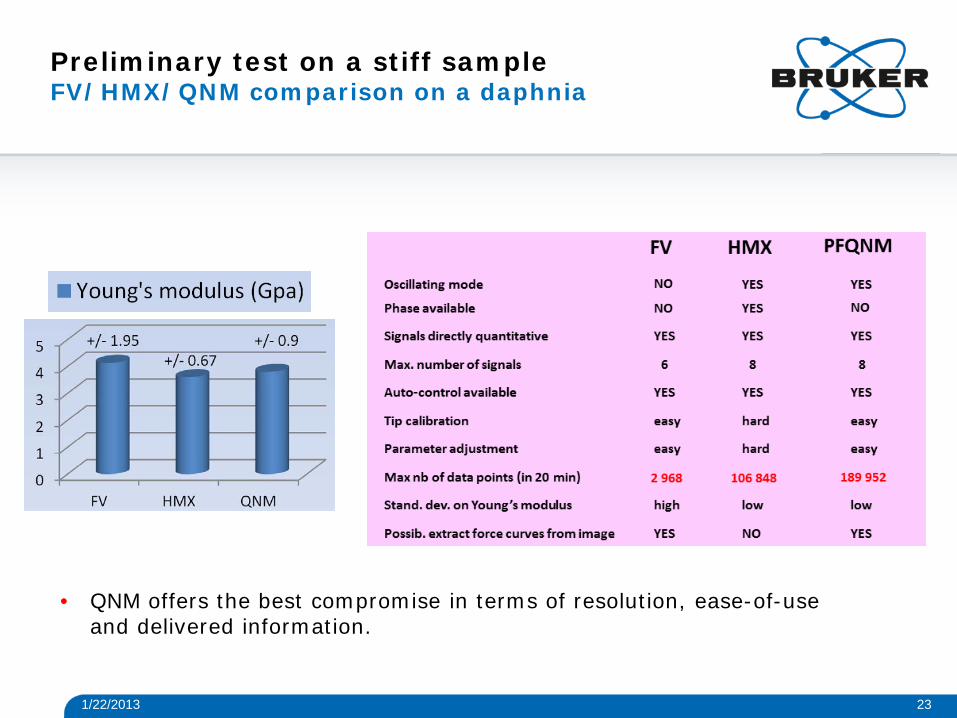
Preliminary test on a stiff sample FV/HMX/QNM comparison on a daphnia
100 µm Bright field image of Daphnia
(20x)
A
B
FV QNM A
B
C
A
• Daphnia scanned in FV, HMX and QNM modes (20 min per image).
• Young’s modulus calculated by using the 3 modes.
• QNM offers much higher resolution and information than FV. HMX returns intermediate results.
1/22/2013 23
Preliminary test on a stiff sample FV/HMX/QNM comparison on a daphnia
• QNM offers the best compromise in terms of resolution, ease-of-use and delivered information.

1/22/2013 24
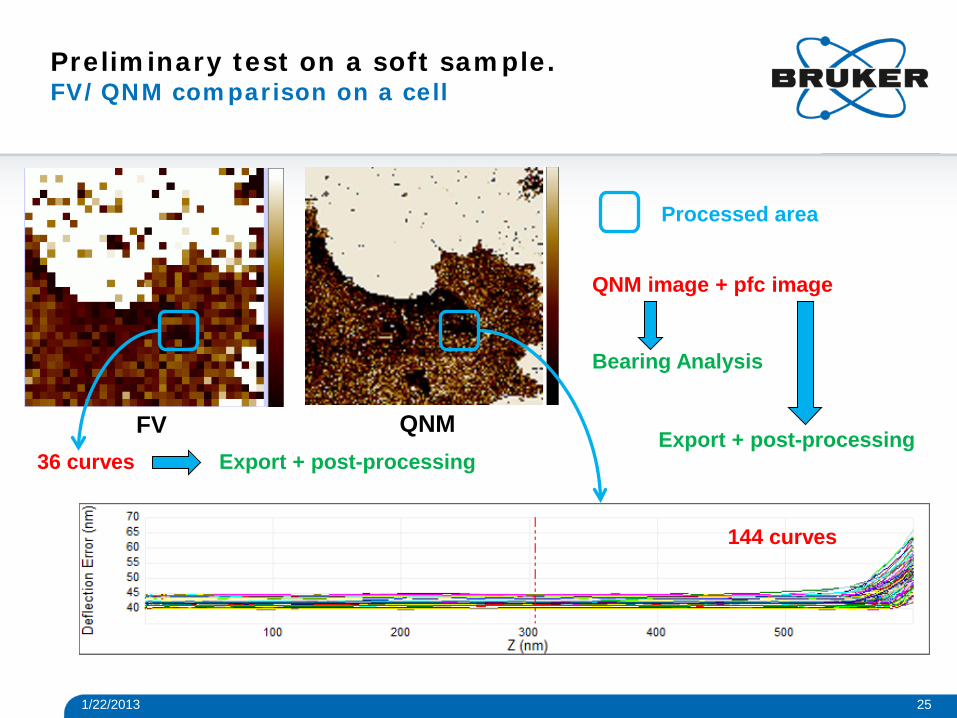
Preliminary test on a soft sample. FV/QNM comparison on a cell
• 90x90 µm
• 5 min / image
FV (32x32) QNM (128x128)
1/22/2013 25
Preliminary test on a soft sample. FV/QNM comparison on a cell
FV QNM
144 curves
36 curves Export + post-processing
QNM image + pfc image
Processed area
Export + post-processing
Bearing Analysis
1/22/2013 26
Preliminary test on a soft sample. FV/QNM comparison on a cell
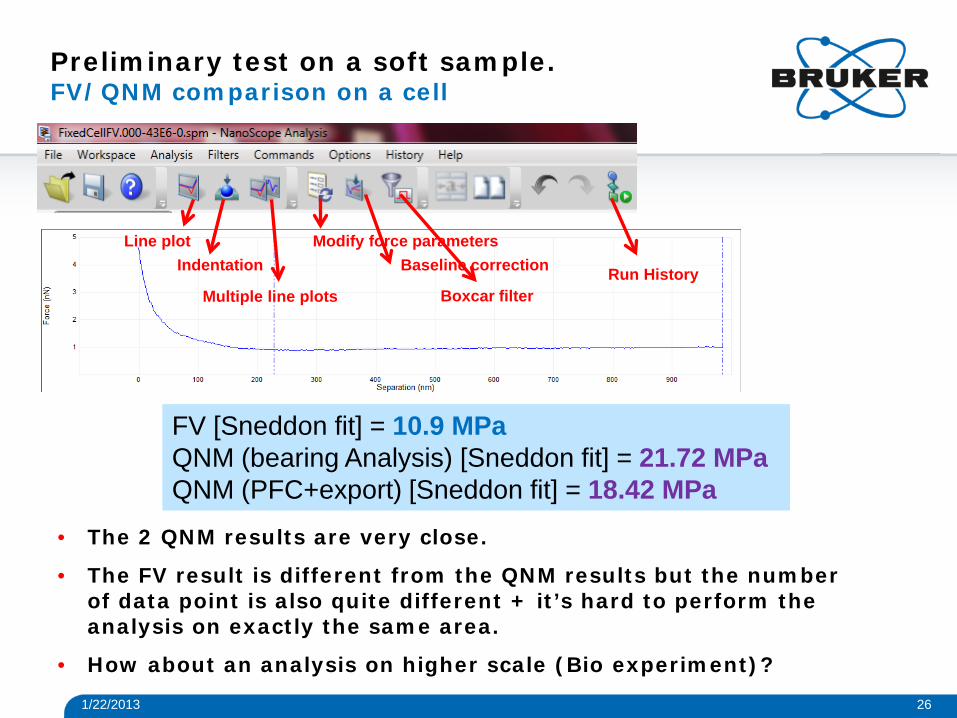
FV [Sneddon fit] = 10.9 MPa QNM (bearing Analysis) [Sneddon fit] = 21.72 MPa QNM (PFC+export) [Sneddon fit] = 18.42 MPa
• The 2 QNM results are very close.
• The FV result is different from the QNM results but the number of data point is also quite different + it’s hard to perform the analysis on exactly the same area.
• How about an analysis on higher scale (Bio experiment)?
Line plot Indentation
Multiple line plots
Modify force parameters Baseline correction
Boxcar filter Run History
1/22/2013 27 BRUKER CONFIDENTIAL
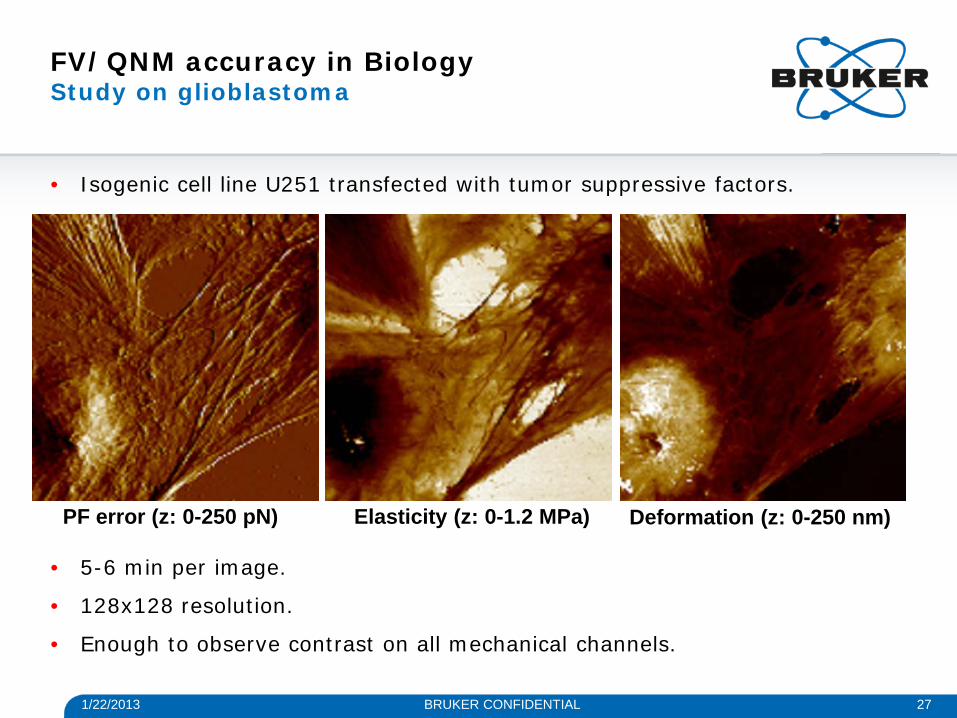
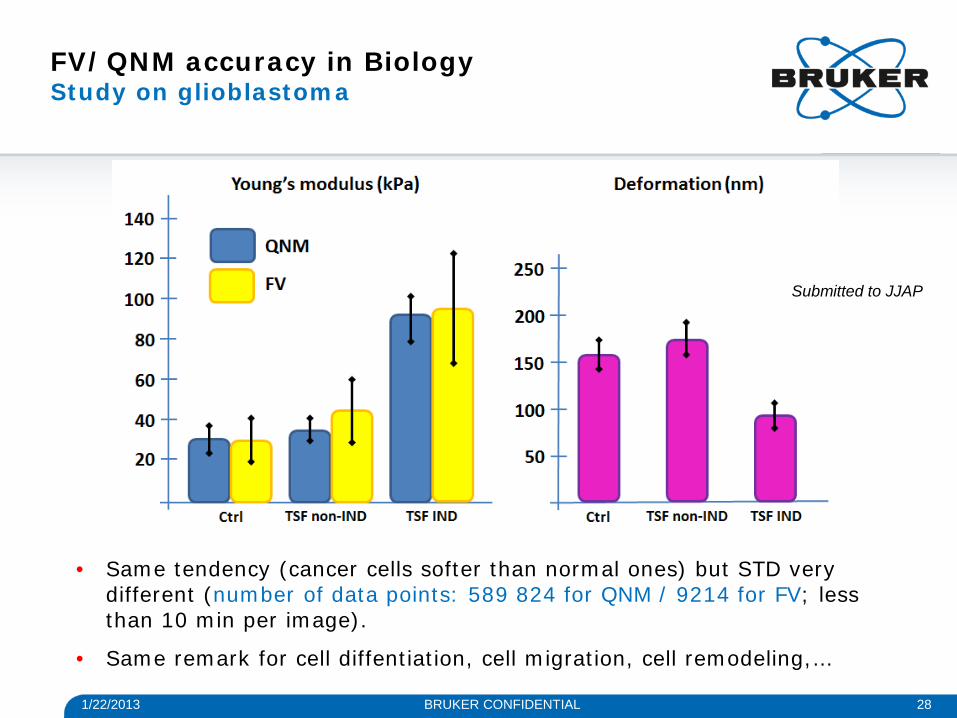
FV/QNM accuracy in Biology Study on glioblastoma
• Isogenic cell line U251 transfected with tumor suppressive factors.
• 5-6 min per image.
• 128x128 resolution.
• Enough to observe contrast on all mechanical channels.
PF error (z: 0-250 pN) Elasticity (z: 0-1.2 MPa) Deformation (z: 0-250 nm)
1/22/2013 28 BRUKER CONFIDENTIAL
FV/QNM accuracy in Biology Study on glioblastoma
• Same tendency (cancer cells softer than normal ones) but STD very different (number of data points: 589 824 for QNM / 9214 for FV; less than 10 min per image).
• Same remark for cell diffentiation, cell migration, cell remodeling,…
Submitted to JJAP

QNM study on live Hacats Effect of Glyphosate on Human Skin
• The Human skin is the first physiological barrier against physical and chemical aggressions.
• Glyphosate (N-(phosphonomethyl)Glycine) is a broad spectrum systemic herbicide used to kill weeds. It’s been extensively used in the late 2000’s.
• Its toxicity on lab animals has been clearly demonstrated but its effects on humans remain unclear.
29 1/22/2013

• Glyphosate-treated samples show a higher number of necrotic and apoptotic cells, and a higher [H2O2] than controls.
• Keratinocytes and HaCat cells are difficult to image by classical AFM modes. A more reliable technique is required.
• Need for a faster way to probe the oxidative stress. Changes in morphology and mechanical properties might be detectable by using PeakForce QNM.
Background: Glyphosate Existing Data in Cytology and Main Challenges
1/22/2013
[H2O2] marker
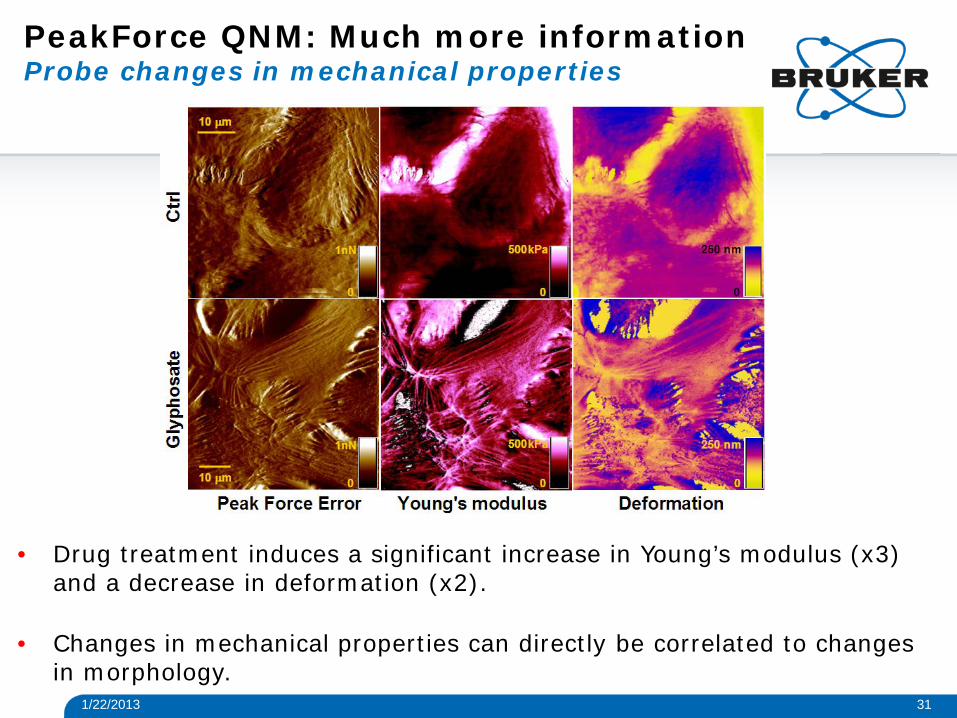
• Drug treatment induces a significant increase in Young’s modulus (x3) and a decrease in deformation (x2).
• Changes in mechanical properties can directly be correlated to changes in morphology.
PeakForce QNM: Much more information Probe changes in mechanical properties
31 1/22/2013
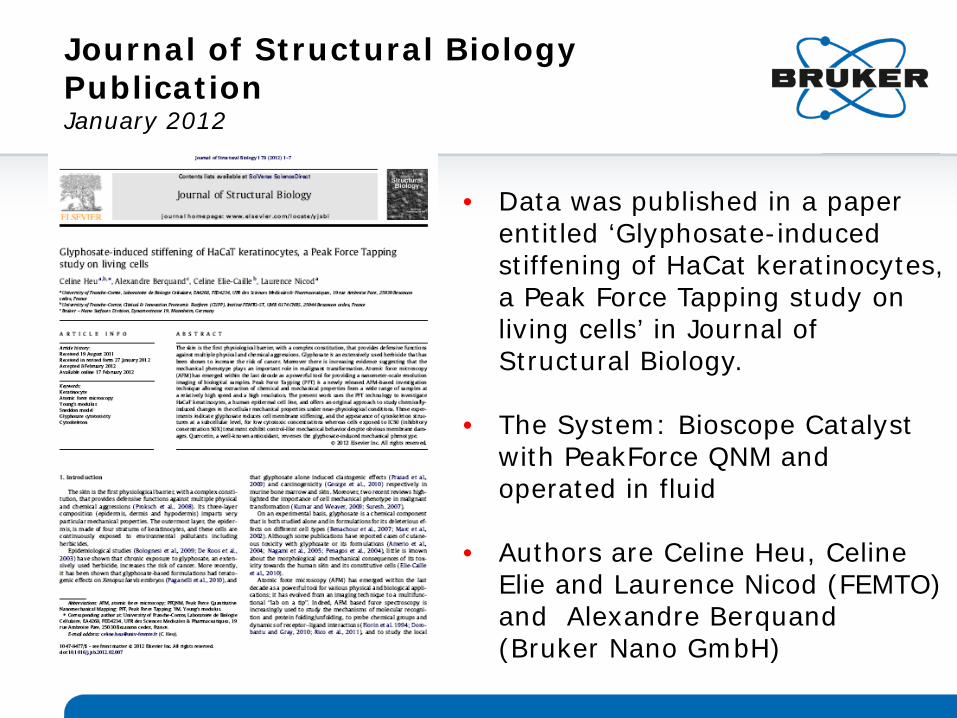
Journal of Structural Biology Publication January 2012
• Data was published in a paper entitled ‘Glyphosate-induced stiffening of HaCat keratinocytes, a Peak Force Tapping study on living cells’ in Journal of Structural Biology.
• The System: Bioscope Catalyst with PeakForce QNM and operated in fluid
• Authors are Celine Heu, Celine Elie and Laurence Nicod (FEMTO) and Alexandre Berquand (Bruker Nano GmbH)
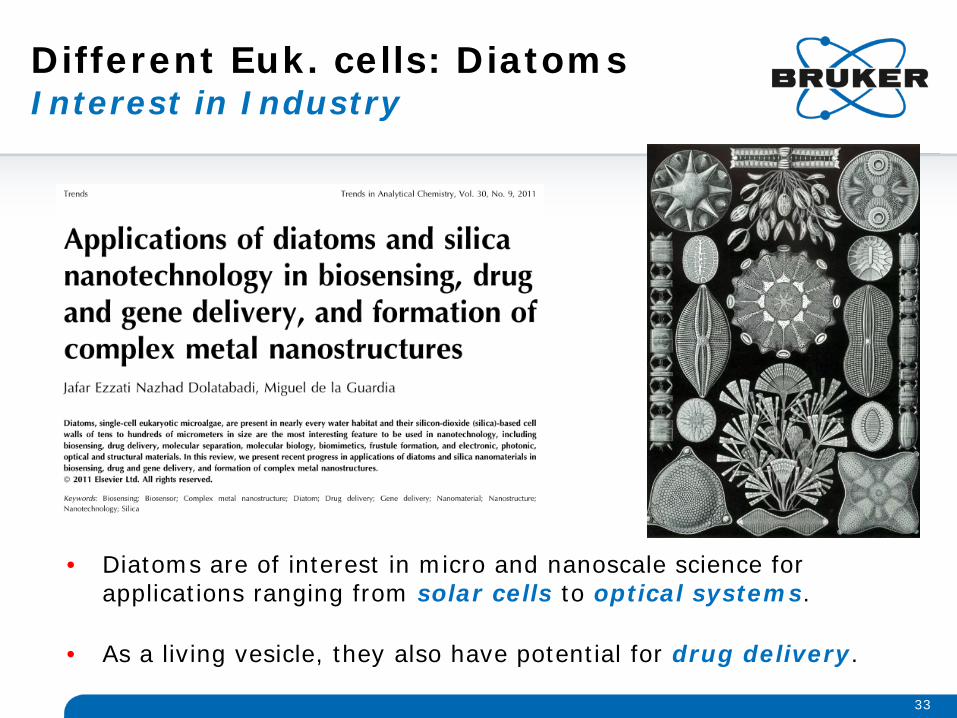
Different Euk. cells: Diatoms Interest in Industry
• Diatoms are of interest in micro and nanoscale science for applications ranging from solar cells to optical systems.
• As a living vesicle, they also have potential for drug delivery.
33
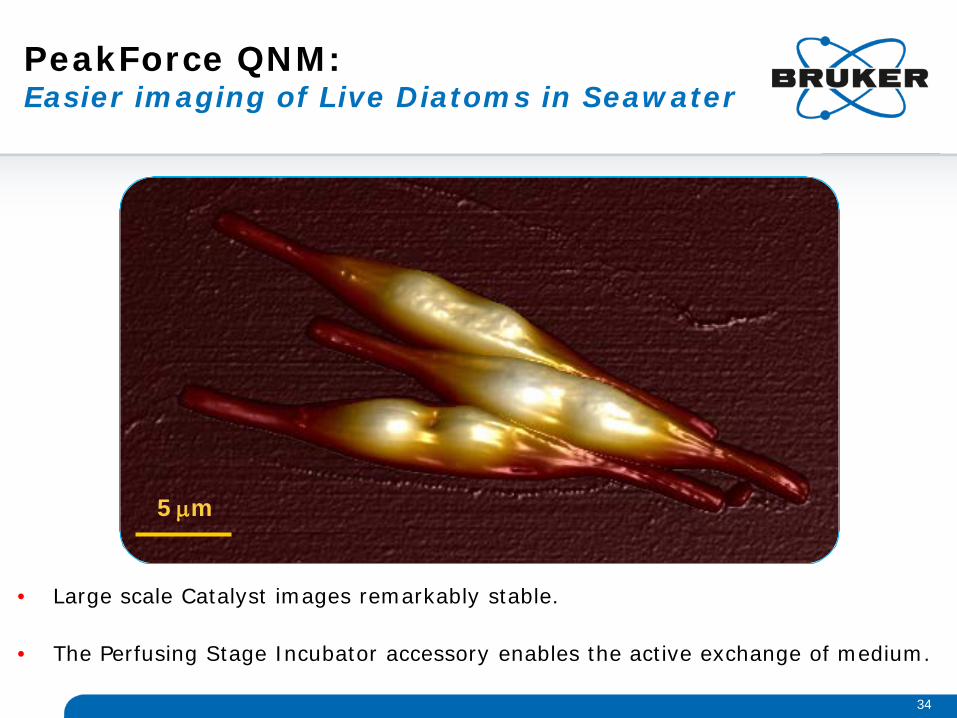
• Large scale Catalyst images remarkably stable.
• The Perfusing Stage Incubator accessory enables the active exchange of medium.
PeakForce QNM: Easier imaging of Live Diatoms in Seawater
34
5 µm
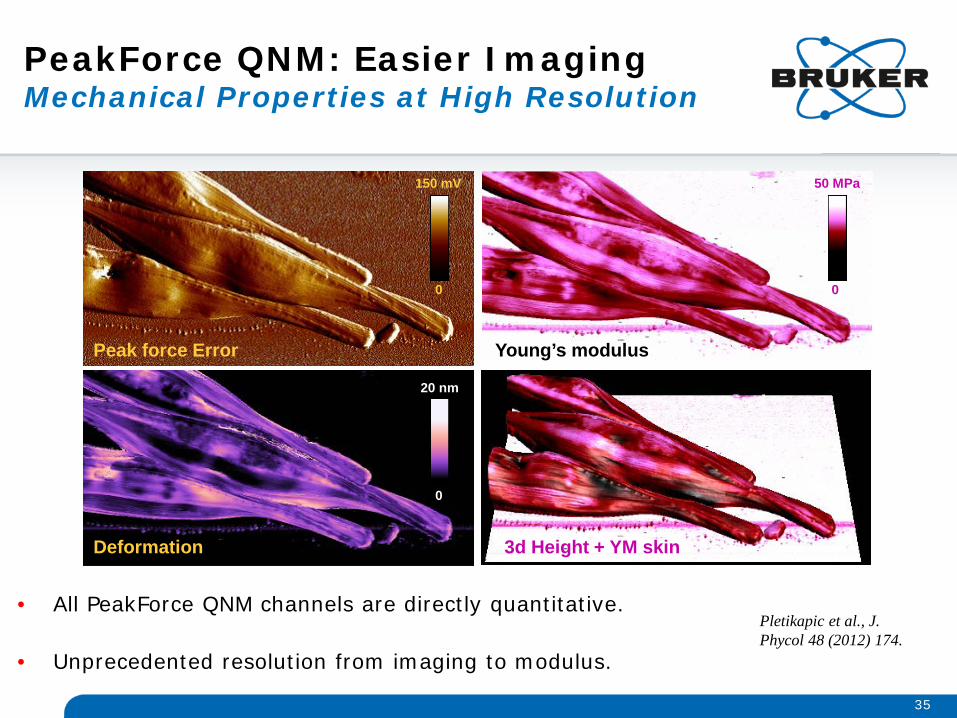
150 mV
0 0
50 MPa
0
20 nm
Peak force Error Young’s modulus
Deformation 3d Height + YM skin
PeakForce QNM: Easier Imaging Mechanical Properties at High Resolution
• All PeakForce QNM channels are directly quantitative.
• Unprecedented resolution from imaging to modulus.
35
Pletikapic et al., J. Phycol 48 (2012) 174.

• The frustule is a filtration wall allowing communication between the sea water and the inner part of the diatom.
• These are the first images of the frustle by AFM.
• Additionally, QNM channels provide quantitative mechanical properties, and show nice contrast between the pores, the rings & the rest of the frustule.
PeakForce QNM: Easier Imaging First AFM Investigation of the Frustule
36
1/22/2013 37
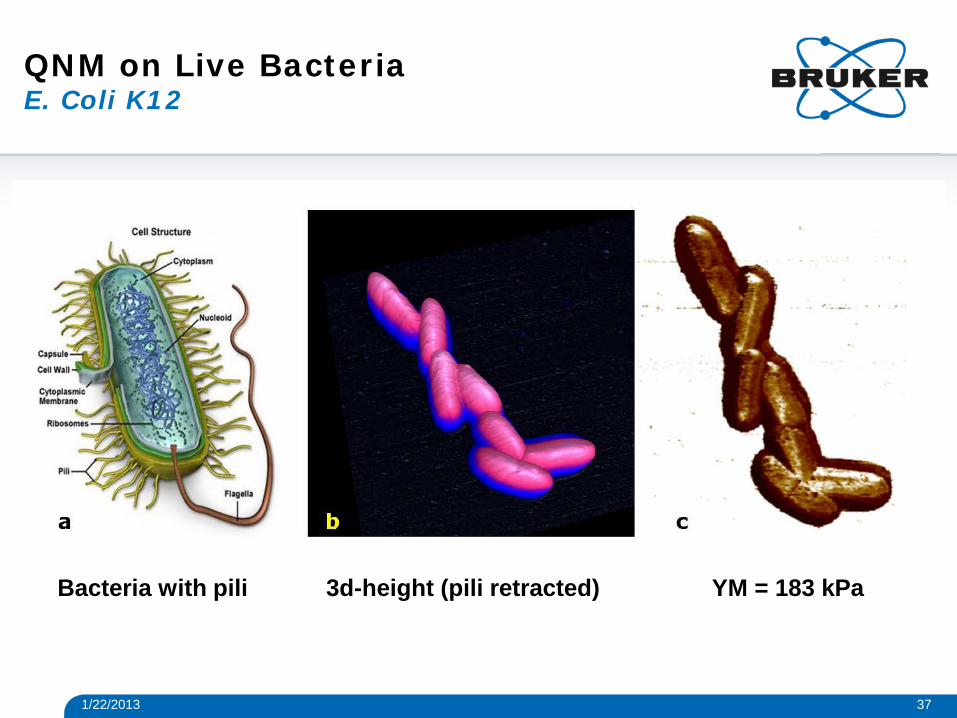
Bacteria with pili 3d-height (pili retracted) YM = 183 kPa
QNM on Live Bacteria E. Coli K12

1/22/2013 38 BRUKER CONFIDENTIAL
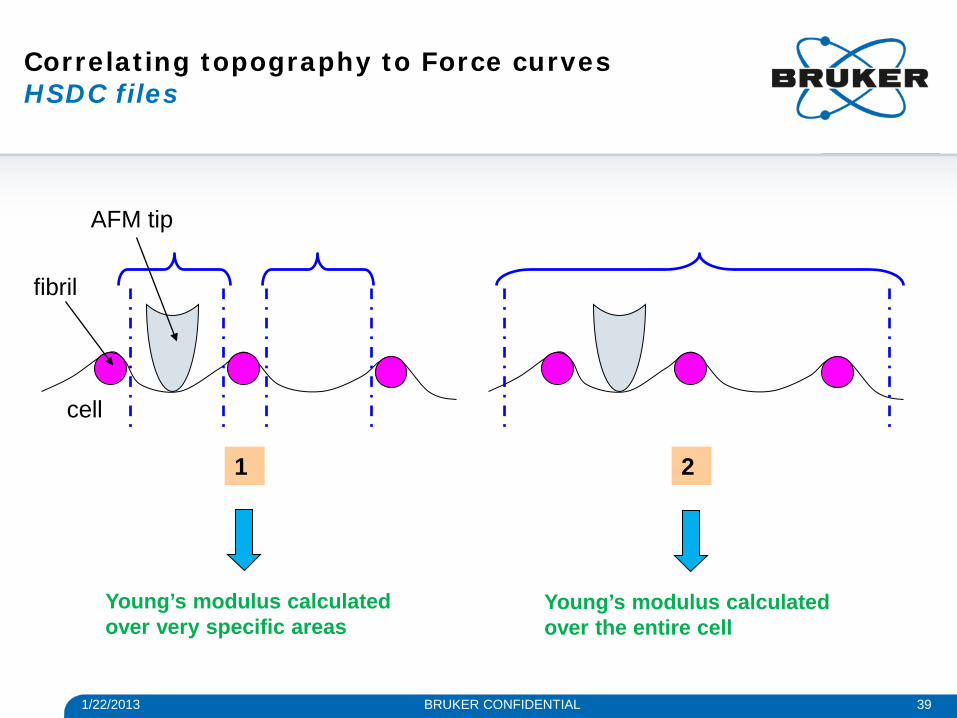
Correlating topography to Force curves HSDC files
Export + post-processing
1/22/2013 39 BRUKER CONFIDENTIAL
1 2
fibril
cell
AFM tip
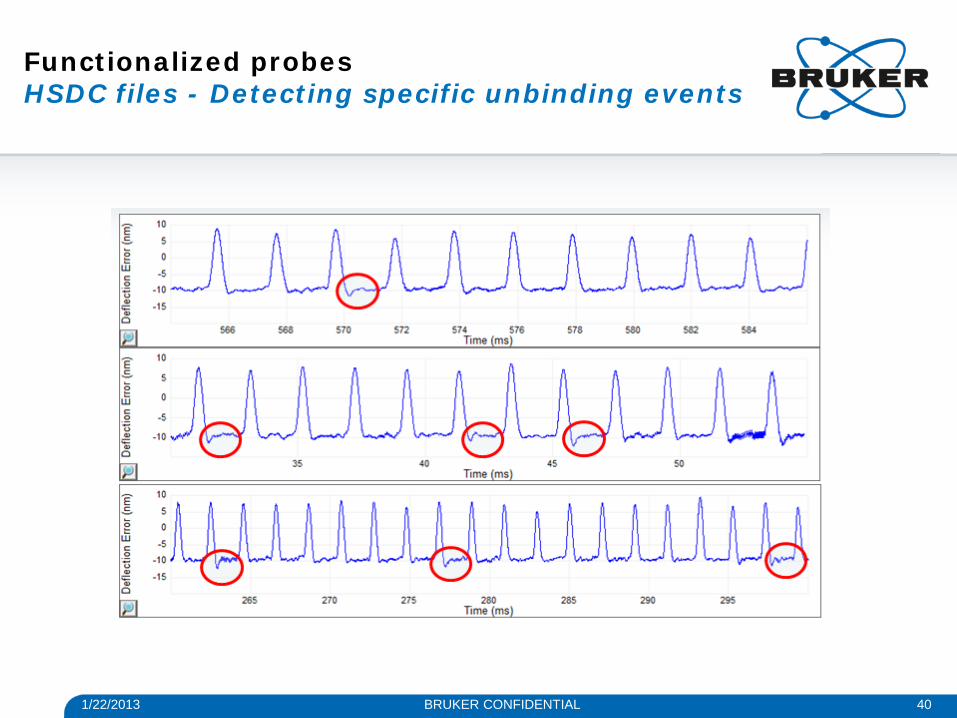
Correlating topography to Force curves HSDC files
Young’s modulus calculated over very specific areas
Young’s modulus calculated over the entire cell
1/22/2013 40 BRUKER CONFIDENTIAL
Functionalized probes HSDC files - Detecting specific unbinding events
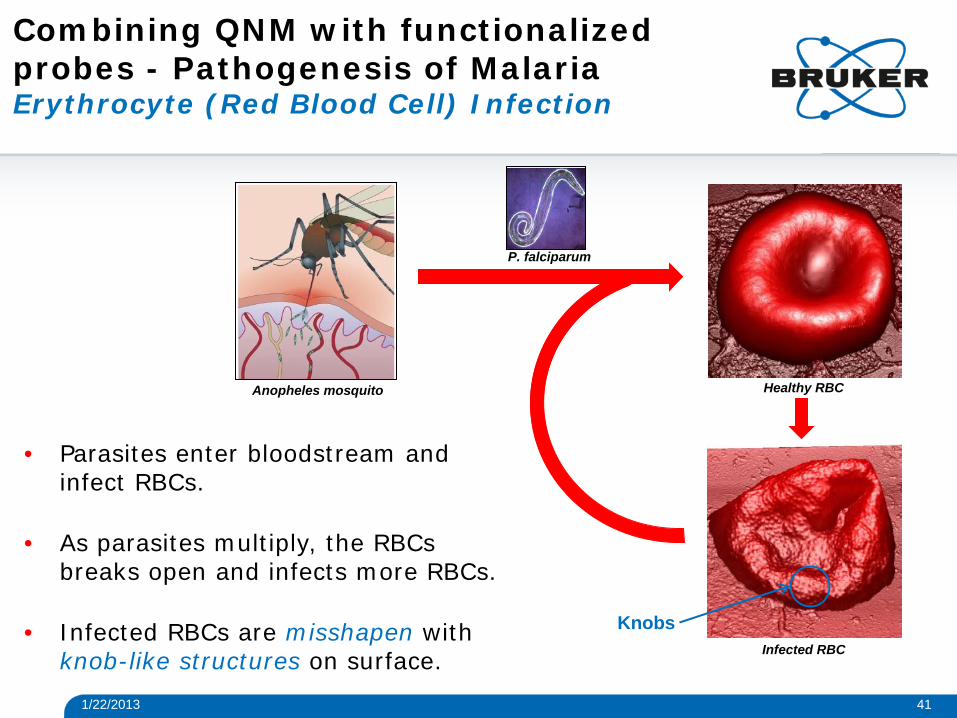
• Parasites enter bloodstream and infect RBCs.
• As parasites multiply, the RBCs breaks open and infects more RBCs.
• Infected RBCs are misshapen with knob-like structures on surface.
Combining QNM with functionalized probes - Pathogenesis of Malaria Erythrocyte (Red Blood Cell) Infection
P. falciparum
Anopheles mosquito Healthy RBC
Infected RBC
41 1/22/2013
Knobs
42 1/22/2013
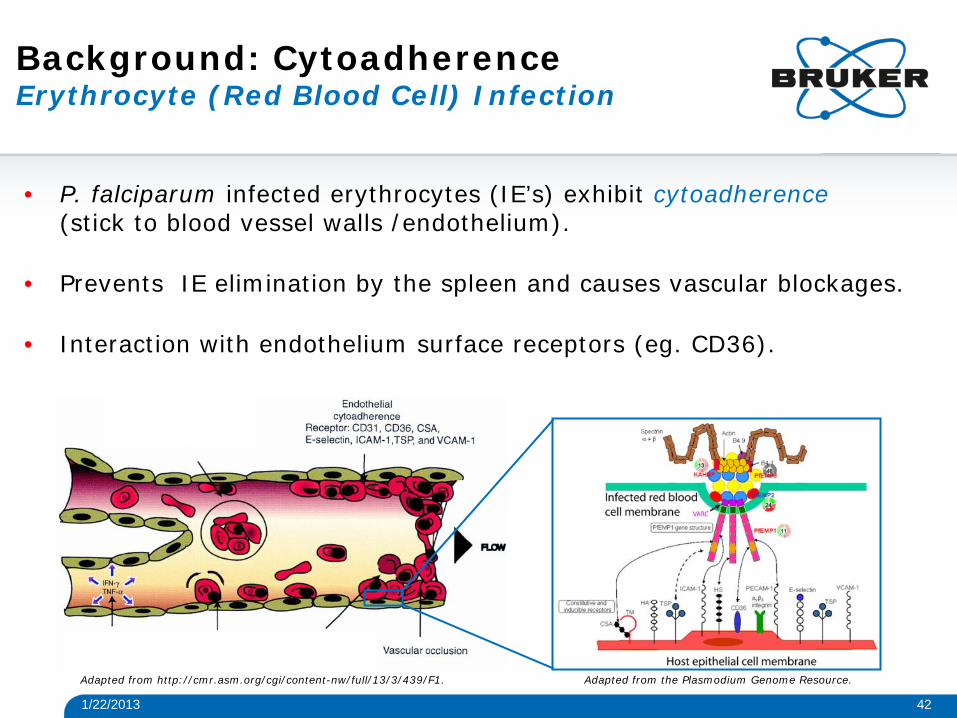
Background: Cytoadherence Erythrocyte (Red Blood Cell) Infection
• P. falciparum infected erythrocytes (IE’s) exhibit cytoadherence (stick to blood vessel walls /endothelium).
• Prevents IE elimination by the spleen and causes vascular blockages.
• Interaction with endothelium surface receptors (eg. CD36).
Adapted from the Plasmodium Genome Resource. Adapted from http://cmr.asm.org/cgi/content-nw/full/13/3/439/F1.
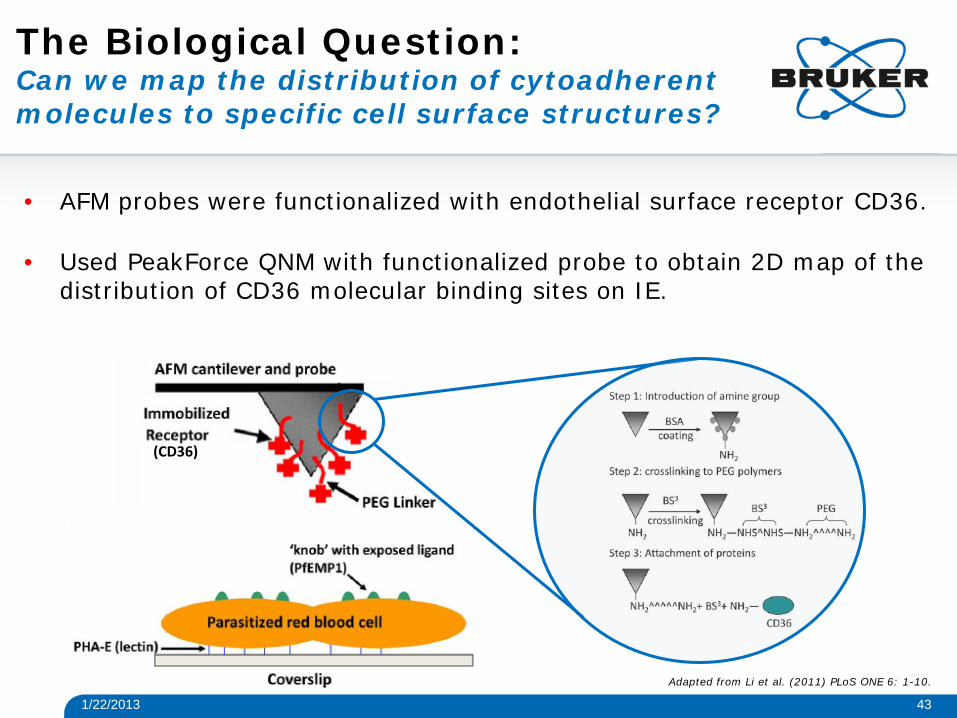
• AFM probes were functionalized with endothelial surface receptor CD36.
• Used PeakForce QNM with functionalized probe to obtain 2D map of the distribution of CD36 molecular binding sites on IE.
The Biological Question: Can we map the distribution of cytoadherent molecules to specific cell surface structures?
(CD36)
Adapted from Li et al. (2011) PLoS ONE 6: 1-10.
43 1/22/2013

• CD36 binding sites (high adhesion) correlate to knob structures (circles).
• Adhesion is a result of specific interactions between CD36 and knobs and not due to crosstalk between data channels (arrow).
Molecular Recognition Imaging of IEs Colocalization of CD36 binding sites with knobs
44 1/22/2013
Topography Adhesion Overlay
1/22/2013 45 BRUKER CONFIDENTIAL
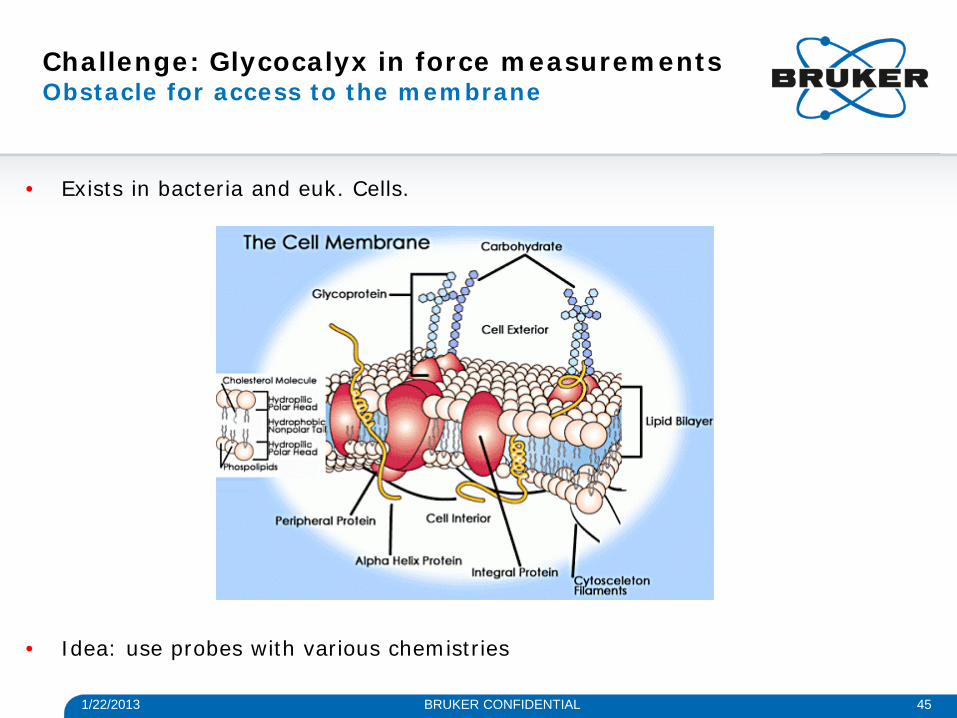
Challenge: Glycocalyx in force measurements Obstacle for access to the membrane
• Exists in bacteria and euk. Cells.
• Idea: use probes with various chemistries
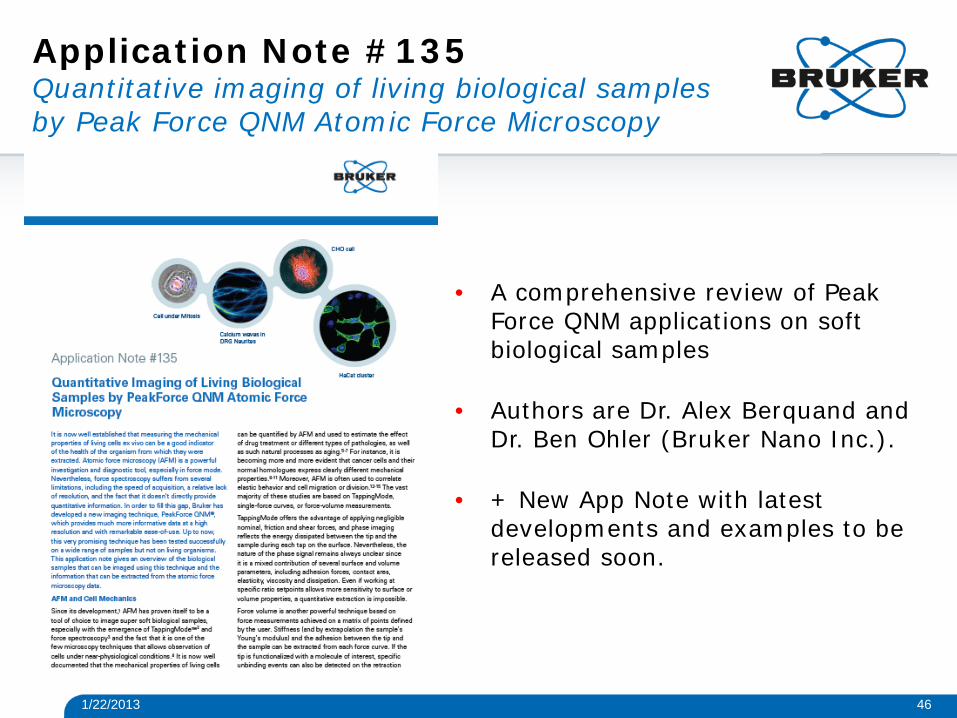
Application Note #135 Quantitative imaging of living biological samples by Peak Force QNM Atomic Force Microscopy
• A comprehensive review of Peak Force QNM applications on soft biological samples
• Authors are Dr. Alex Berquand and Dr. Ben Ohler (Bruker Nano Inc.).
• + New App Note with latest developments and examples to be released soon.
46 1/22/2013

1/22/2013 47 BRUKER CONFIDENTIAL
Contact information
Alexandre Berquand Life Science Applications Scientist [email protected] Tel: +49 174 333 94 62
www.bruker.com/en/products/surface-analysis/atomic-force-microscopy.html www.brukerafmprobes.com/ http://nanoscaleworld.bruker-axs.com/