Embed Size (px)
Citation preview

June 30, 2015
Brian Beattie, EVP and Chief Administrative Officer
Trac Pham, Chief Financial Officer
NASDAQ 32nd Investor Program

© 2015 Synopsys, Inc. 2
Forward-Looking Statements
This presentation contains forward-looking statements under the safe harbor
provisions of Section 21E of the Securities Exchange Act of 1934, including
statements regarding projected financial results and long-term growth rates. For a
discussion of important factors that could cause actual results to differ materially
from those in such statements, see the section entitled “Risk Factors” in Synopsys’
most recent Quarterly Report on Form 10-Q and Annual Report on Form 10-K.
Regulation G
In addition to financial results prepared in accordance with Generally Accepted
Accounting Principles, or GAAP, this presentation will also contain certain non-
GAAP financial measures. Except for certain forward-looking non-GAAP financial
measures for which a reconciliation is not possible without unreasonable efforts,
reconciliations of the non-GAAP financial measures contained in this presentation
or given orally to their most comparable GAAP measures are included in the
second quarter fiscal 2015 earnings release and financial supplement, dated
May 20, 2015, and available on Synopsys' website at
www.synopsys.com/Company/InvestorRelations/Pages/FinancialNews.aspx.

© 2015 Synopsys, Inc. 3
Synopsys: The Market & Technology Leader
FY14 FY15 (Target*)
Revenue: $2.057B $2.210 – $2.235B (7-9%)
NG EPS: $2.53 $2.76 – $2.81 (9-11%)
Business Model: ~90% time-based
Revenue Sources: ~½ International
Employees: ~9,450
Market Cap: ~$7.8B
Founded: 1986
Patents Granted: 2,404
* These targets were provided by Synopsys as of May 20, 2015, and are not being updated at this time

© 2015 Synopsys, Inc. 4
Synopsys: The Market & Technology Leader Uniquely Positioned for Stability and Growth
• Dynamic markets
• Clear technology leadership
• Financial strength and growth

© 2015 Synopsys, Inc. 5
Synopsys: The Market & Technology Leader Uniquely Positioned for Stability and Growth
• Dynamic markets
• Clear technology leadership
• Financial strength and growth

© 2015 Synopsys, Inc. 6
Helping Design the Chips Inside Impacting Everyone, Everything, Everywhere, Every Day
Industrial
Military / Aerospace
Cloud Infrastructure
Medical
Computing & Peripherals
Digital Home
Automotive
Mobile
Internet of Things
Data Center & Networking

© 2015 Synopsys, Inc. 7
• An advanced design today will take 18-24
months to complete, and can cost up to
$200M
• Complexity of designs has increased
exponentially, requiring more, and more
advanced, EDA tools
• As IC design complexity grows, there is the
need to embed an increasing amount of IP
• The adoption of FinFET technologies
drives further design challenges
• Increasing software content presents more
challenges
Semiconductor Design Complexity

© 2015 Synopsys, Inc. 8
Synopsys: The Market & Technology Leader Uniquely Positioned for Stability and Growth
• Dynamic markets
• Clear technology leadership
• Financial strength and growth

© 2015 Synopsys, Inc. 9
Source: Synopsys Global Technical Service
Active designs Taped-out designs
FinFET
10 16 22 14
0
50
100
150
200
250
Q2
'09
Q3
'09
Q4'0
9
Q1
'10
Q2
'10
Q3
'10
Q4
'10
Q1
'11
Q2
'11
Q3
'11
Q4
'11
Q1
'12
Q2
'12
Q3'1
2
Q4
'12
Q1
'13
Q2
'13
Q3
'13
Q4
'13
Q1
'14
Q2
'14
Q3
'14
Q4
'14
Q1
'15
Q2
'15
Leading the Way in FinFET
Tracking nearly
220 FinFET
designs and tape-
outs worldwide
Synopsys is
integral to >95% of
them

© 2015 Synopsys, Inc. 10
Broadest Portfolio of Best-in-Class Technology Multi-Year Upgrade Cycle

© 2015 Synopsys, Inc. 11
IC Compiler II Game-Changer in Place & Route
Enabling 10X Throughput
Rebuild
New
Infrastructure
Multi
Hier
Multi
Mode
Multi
Voltage Multi
Thread
Multi
View
Rethink
Timer Floor Plan
Clock
Tree
Opt.
New Engines
Reuse
Best of IC
Compiler I
Linear Placer
Zroute
Data Model
• Tremendous
demand and
excellent business
momentum.
• Fastest-ever
ramp-up in orders
for a new product.
• Currently serving
33 customers; >70
in-progress design
efforts, up 40%
from last quarter.
• Used on
numerous process
nodes, not only for
FinFET: 40/28 to
16/14 and 10nm.

© 2015 Synopsys, Inc. 12
VIP, Models & Databases
Virtual Prototype
Emulation FPGA
Prototype Simulation
Static & Formal
Debug
Planning & Coverage
Industry’s Fastest
Industry’s #1
#1 #1 #1
#1
Verification
Continuum
• Game-changing
new platform
launched in 2014
• Seamless
integration
• Built around best-
in-class engines;
adding unified
debug, compile
• Goal: speed
software bring-up
by ~6 mos
• First deliverable:
Verification
Compiler 2014
• Additional
integration in 2015

© 2015 Synopsys, Inc. 13
#2 IP Vendor Leader in Interface, Analog & Memory IP
Rank Company 2013
2013
Share
1 Synopsys 193.3 43.5%
2 Silicon Image 49.1 11.0%
3 Cadence 44.8 10.1%
4 Rambus 34.3 7.7%
5 ARM Holdings 20.2 4.5%
6 L&T Infotech 11.9 2.7%
7 Arasan Chip Systems 9.7 2.2%
8 Faraday 8.3 1.9%
9 PLDA 7.9 1.8%
10 Mobiveil 5.5 1.2%
Others 59.7 13.4%
Total 444.6 100.0%
Design IP Revenue, Wired Interface
Rank Company 2013
2013
Share
1 Synopsys 76.8 31.5%
2 ARM Holdings 66.3 27.2%
3 eMemory Technology 27.4 11.2%
4 Kilopass Technology 22.0 9.0%
5 Mentor Graphics 9.7 4.0%
6 Sidense 9.2 3.8%
7 NSCore 6.8 2.8%
8 eSilicon 5.9 2.4%
9 Dolphin Technology 4.6 1.9%
10 MoSys 4.4 1.8%
Others 11.0 4.5%
Total 244.0 100.0%
Rank Company 2013
2013
Share
1 Synopsys 12.0 17.7%
2 Cadence 6.8 10.0%
3 QualCore Logic 5.5 8.1%
4 Faraday 5.4 8.0%
5 True Circuits 4.5 6.6%
6 Analog Bits 3.2 4.7%
7 Kaben Wireless Silicon 3.0 4.4%
8 RFEL 2.9 4.3%
9 Dolphin Technology 2.7 4.0%
10 Silicon Creations 2.1 3.1%
Others 19.7 29.1%
Total 67.8 100.0%
Design IP Revenue, Worldwide (in Millions)*
* Gartner, April 2014
Leadership Enables Investment in Quality, Support, Features and Processes
Design IP Revenue, Wired Interface
Rank Company 2014
2014
Share
1 Synopsys 217.8 45.7%
2 Silicon Image 59.9 12.6%
3 Cadence Design Systems 45.6 9.6%
4 Rambus 35.7 7.5%
5 ARM 24.2 5.1%
6 Arasan Chip Systems 9.2 1.9%
7 Faraday Technology 8.4 1.8%
8 PLDA 5.9 1.2%
9 IPGoal Microelectronics 5.2 1.1%
10 Mobiveil 5.1 1.1%
Others 60.0 12.6%
Total 476.8 100.0%
Design IP Revenue, Memory Cells/Blocks
Rank Company 2014
2014
Share
1 Synopsys 76.1 30.3%
2 ARM 73.8 29.4%
3 eMemory Technology 33.5 13.3%
4 Kilopass Technology 24.7 9.8%
5 Sidense 9.3 3.7%
6 Mentor Graphics 8.4 3.3%
7 Dolphin Technology 5.5 2.2%
8 eSilicon 5.5 2.2%
9 MoSys 3.4 1.4%
10 Flasys 2.1 0.8%
Others 8.9 3.5%
Total 251.2 100.0%
Design IP Revenue, General Purpose Analog & Mixed Signal
Rank Company 2014
2014
Share
1 Synopsys 11.8 18.2%
2 Cadence Design Systems 6.5 10.1%
3 Faraday Technology 5.4 8.4%
4 Qualcore Logic 4.7 7.3%
5 True Circuits 4.7 7.2%
6 Analog Bits 3.3 5.1%
7 RF Engines 3.1 4.8%
8 Kaben Wireless Silicon 2.7 4.1%
9 Dolphin Technology 2.7 4.1%
10 S3 Group 2.2 3.4%
Others 17.7 27.4%
Total 64.7 100.0%

© 2015 Synopsys, Inc. 14
Third-Party IP – Synopsys Differentiator
15+ years of
investment and
execution
Established Provider
~2,600 IP Engineers
Worldwide
Resource
Commitment
Broad portfolio of
high-quality,
production-proven IP
Trusted IP Supplier
Application
CPU
Application
CPU
Graphic
Core(s)
On-Chip Bus
ROM
Analog
Audio
/ Video
I/F Data
Converters
RAM RAM
RAM RAM RAM RAM
RAM
RAM RAM
DDR
Interface
Flash
Interface
Sp
ecia
lty I/O
Bas
ic
Pe
rip
he
rals
(UA
RT
s/T
ime
rs)
RAM
Headset Jack
Microphone
Video Codecs
Audio Codecs
Flash Storage
DDR memory
LVDS, Etc
Interface
USB PCIe SATA HDMI MIPI
* Small boxes are standard cell library elements

© 2015 Synopsys, Inc. 15
Synopsys Expands TAM w/ Coverity
• Acquired Coverity for $375M
($334M net of cash acquired)
• Leading provider of Software
Quality, Testing and Security
Tools; averaging ~20% revenue
growth
• ~$500M market, expected to
grow to ~$1B by 2017
• Natural adjacency and
expansion of our TAM; LT
growth opportunity beyond our
existing customer base, in a
fast-growing, new market
Synopsys Enters Software Quality and Security
Market with Coverity Acquisition Coverity Improves Code Quality and Security, Resulting in Better
Software, Faster
MOUNTAIN VIEW, Calif. and SAN FRANCISCO, Feb. 19, 2014
/PRNewswire/ --Synopsys, Inc. (Nasdaq:SNPS), a global leader providing
software, IP and services used to accelerate innovation in chips and
electronic systems, and Coverity, the leading provider of software quality,
testing, and security tools, today signed a definitive agreement for Synopsys
to acquire Coverity. Coverity products reduce the risk of quality and security
defects, which can lead to the catastrophic failures that plague many of
today's large software systems.
Under the terms of the definitive agreement, Synopsys will pay
approximately $375 million, or $350 million net of cash acquired. In addition,
Synopsys will assume certain unvested stock options of Coverity employees.
The transaction will be funded by Synopsys with a combination of U.S. cash
and debt, and is subject to Hart Scott Rodino regulatory review and other
customary closing conditions. The acquisition is expected to close in
Synopsys' fiscal Q2.
“Working together, Synopsys and Coverity
intend to bring the software development
process to the level of 'first-time-right'
functionality that software design teams are
striving for. For Synopsys this is a natural
technology adjacency and the opening of a
significant new, growing market space.”
Aart de Geus
Chairman and co-CEO, Synopsys

© 2015 Synopsys, Inc. 16
Current Synopsys Customers
Plus Brand New Customer Base
Naturally adjacent
Core competencies:
• Algorithm-based technology
• Some overlapping customers
• Shared high-tech
• Customer-obsessed DNA
New industries Synopsys
didn’t previously touch
Different Users, Different Budgets
Current Semis/Systems Customers New Verticals, Customers
Banking, Financial Services, Energy,
Aerospace/Defense, Software, Internet,
Industrial, etc.

© 2015 Synopsys, Inc. 17
Acquisitions to Expand Security Offering
• Announced intent to acquire
Codenomicon (April 20)
• Independent discoverer of
Heartbleed bug; security testing
for embedded SW
• Announced intent to acquire
assets of Quotium (May 28)
• Interactive application security
testing (IAST), a well-known
method of testing applications
during the software
development lifecycle
Synopsys Enters Software Quality and Security
Market with Coverity Acquisition Coverity Improves Code Quality and Security, Resulting in Better
Software, Faster
MOUNTAIN VIEW, Calif. and SAN FRANCISCO, Feb. 19, 2014
/PRNewswire/ --Synopsys, Inc. (Nasdaq:SNPS), a global leader providing
software, IP and services used to accelerate innovation in chips and
electronic systems, and Coverity, the leading provider of software quality,
testing, and security tools, today signed a definitive agreement for Synopsys
to acquire Coverity. Coverity products reduce the risk of quality and security
defects, which can lead to the catastrophic failures that plague many of
today's large software systems.
Under the terms of the definitive agreement, Synopsys will pay
approximately $375 million, or $350 million net of cash acquired. In addition,
Synopsys will assume certain unvested stock options of Coverity employees.
The transaction will be funded by Synopsys with a combination of U.S. cash
and debt, and is subject to Hart Scott Rodino regulatory review and other
customary closing conditions. The acquisition is expected to close in
Synopsys' fiscal Q2.

© 2015 Synopsys, Inc. 18
Synopsys: The Market & Technology Leader Uniquely Positioned for Stability and Growth
• Dynamic markets
• Clear technology leadership
• Financial strength and growth

© 2015 Synopsys, Inc. 19
Long-term Operating Model*
• Organically grow traditional EDA revenue generally in
the low-to-mid single digit range
• Organically grow IP/Systems/SW Integrity revenue
generally in the low double-digits
• Actively explore TAM-expanding R&D and M&A
opportunities
• Focus on global operational efficiency to deliver solid
non-GAAP operating margin in the mid-20s range
• Optimize the use of our strong cash flow, through a
balance of M&A, debt reduction and stock buybacks
Note: While the combination of elements may vary, based on business cycles and in-
period priorities, our long-term driving principles remain consistent.
Primary long-term objective is to drive high-single-
digit EPS growth through a mix of the following
elements:
* This multi-year objective is provided as of May 20, 2015 and is not being updated at this time

© 2015 Synopsys, Inc. 20
• Predictable, time-based
revenue model
• Entered FY15 with ~80% of
revenue in hand; enter each
quarter with ~90% in hand
• Non-cancellable backlog:
$3.5B 3-yr backlog end of FY14
• 12% non-GAAP EPS 5-year
CAGR
• FY14 NG EPS includes slight
dilution from SW Integrity
Group
NG EPS
$1.80 $2.10
$2.44 2.53 $2.79
$0.00
$0.50
$1.00
$1.50
$2.00
$2.50
$3.00
FY11 FY12 FY13 FY14 FY15Guide-Mid *
$1,536 $1,756
$1,962 $2,057 $2,223
$0
$500
$1,000
$1,500
$2,000
$2,500
FY11 FY12 FY13 FY14 FY15Guide-Mid*
Revenue ($M)
Growth and Predictability
* These targets were provided by Synopsys as of May 20, 2015, and are not being updated at this time
12% 5-yr CAGR

© 2015 Synopsys, Inc. 21
Strong Operating Cash Flow
• Roughly tracks EBITDA less
cash taxes over time
• OCF is lumpy ‒ Difficult to forecast period
to period
‒ Timing of large contracts
‒ Disbursements (affected by M&A)
• Goal is to optimize the use of
our strong cash flow, through
a balance of M&A, debt
reduction and stock buybacks
Annual Operating Cash Flow
$486 $497
$551
$450
$0
$100
$200
$300
$400
$500
$600
FY12 FY13 FY14 FY15Guidance*
$ M
illio
ns
* These targets were provided by Synopsys as of May 20, 2015, and are not being updated at this time
© 2015 Synopsys, Inc. 22
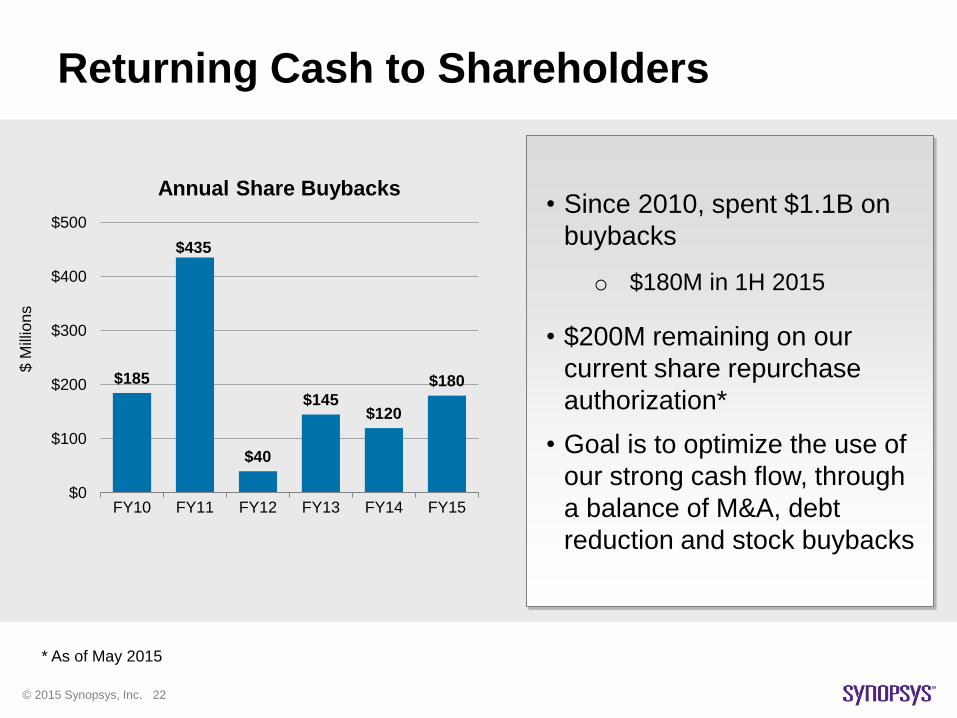
Returning Cash to Shareholders
• Since 2010, spent $1.1B on
buybacks
o $180M in 1H 2015
• $200M remaining on our
current share repurchase
authorization*
• Goal is to optimize the use of
our strong cash flow, through
a balance of M&A, debt
reduction and stock buybacks
Annual Share Buybacks
$185
$435
$40
$145 $120
$180
$0
$100
$200
$300
$400
$500
FY10 FY11 FY12 FY13 FY14 FY15
$ M
illio
ns
* As of May 2015

© 2015 Synopsys, Inc. 23
Summary
• Dynamic markets
– World’s leading EDA supplier
and #2 IP vendor
• Clear technology leadership
– Broadest portfolio of
best-in-class technology with
multi-year upgrade cycle
• Financial strength and growth
– Excellent financial position
and execution

Thank You