Embed Size (px)
Citation preview
Statistics Section, Department of Education and Skills 1
National Briefing Note on
Education at a Glance 2020 OECD Indicators A Country Profile for Ireland
September 2020
Statistics Section, Department of Education and Skills 2
Introduction
The 2020 edition of Education at a Glance (EAG) was published by the OECD on Tuesday
September 8th, 2020. EAG has been published by the OECD on a yearly basis since 1992.
The reference year for data in this publication is the school year 2017/2018 for enrolments,
the financial year 2017 for spending data, the calendar year 2018 for earnings and
educational attainment (CSO) and the calendar year 2019 for labour market status (CSO).
EAG is organised into four chapters:
A. The Output of Educational Institutions and the Impact of Learning
B. Access to Education, Participation and Progression
C. Financial and Human Resources Invested in Education
D. Teachers, the Learning Environment and Organisation of Schools
This summary document aims to highlight some key indicators with a main focus on how
Ireland compares with the OECD or EU23 averages. Levels of education are classified by a
system referred to as ISCED-2011. For more details on OECD/EU23 average and
classification of levels of education see Technical Notes 9 and 13.
The data presented in EAG is largely based on information provided through the annual
UOE (UNESCO, OECD and Eurostat) data collection by the Department of Education and
Skills. See Technical Note 1. Other sources such as Labour Force Survey (CSO), the EU
Survey on Income and Living Conditions (CSO), the OECD-INES Network for the Collection
and Adjudication of System-level Descriptive Information on Educational Structures, Policies
and Practices (NESLI) and the OECD-INES Network on Labour Market, Economic and
Social Outcomes of Learning (LSO) are also used.
Chapter C covers financial and human resources and includes estimates of education
expenditure. The methodology used when compiling expenditure on education is laid out in a
detailed manual on concepts, definitions and classifications published by the OECD.
Expenditure covers not just government expenditure but also expenditure by households, by
other private sources and international expenditure
A review of data sources and methods undertaken in 2019 and early 2020 has resulted in a
number of significant changes to the estimates provided to the OECD. In particular:
Retirement expenditure no longer includes pensions paid to former employees
resulting in a fall in public expenditure in the primary and post-primary sectors in
particular.
Revisions to the treatment of expenditure by the National Training Fund.
The inclusion of additional components of educational expenditure by the
Department of Social Protection such as supports for clothes, books and transport.
Improved estimates of household expenditure resulting in increases in private
expenditure across all sectors.
Statistics Section, Department of Education and Skills 3
Revised estimates of expenditure on research and development to bring it into line
with the UOE manual.
As a result of these revisions the overall figure for education expenditure has been revised
upwards while the split between public and private expenditure has shifted and is now more
in line with the OECD average. The OECD average is 83% public and 17% private while the
revised split for Ireland is 82.5% public and 17.5% private; previously this had been 91% public
and 9% private.
It is important to note that due to these extensive revisions the 2017 expenditure data is not
comparable with the 2016 data published in September 2019. In particular comparisons
between the expenditure per head at primary and secondary levels with 2016 are not valid.
The entire pdf copy of Education at a Glance Indicators 2020 and the detailed Excel data tables can be downloaded here: https://www.oecd-ilibrary.org/education/education-at-a-glance-2020_69096873-en
If you wish to consult or download data from last year’s publication EAG2019 go to: https://www.oecd-ilibrary.org/education/education-at-a-glance-2019_f8d7880d-en
Statistics Section, Department of Education and Skills 4
A. The Output of Educational Institutions and the Impact of Learning
Educational attainment in the adult population (A1)
Upper-secondary educational attainment
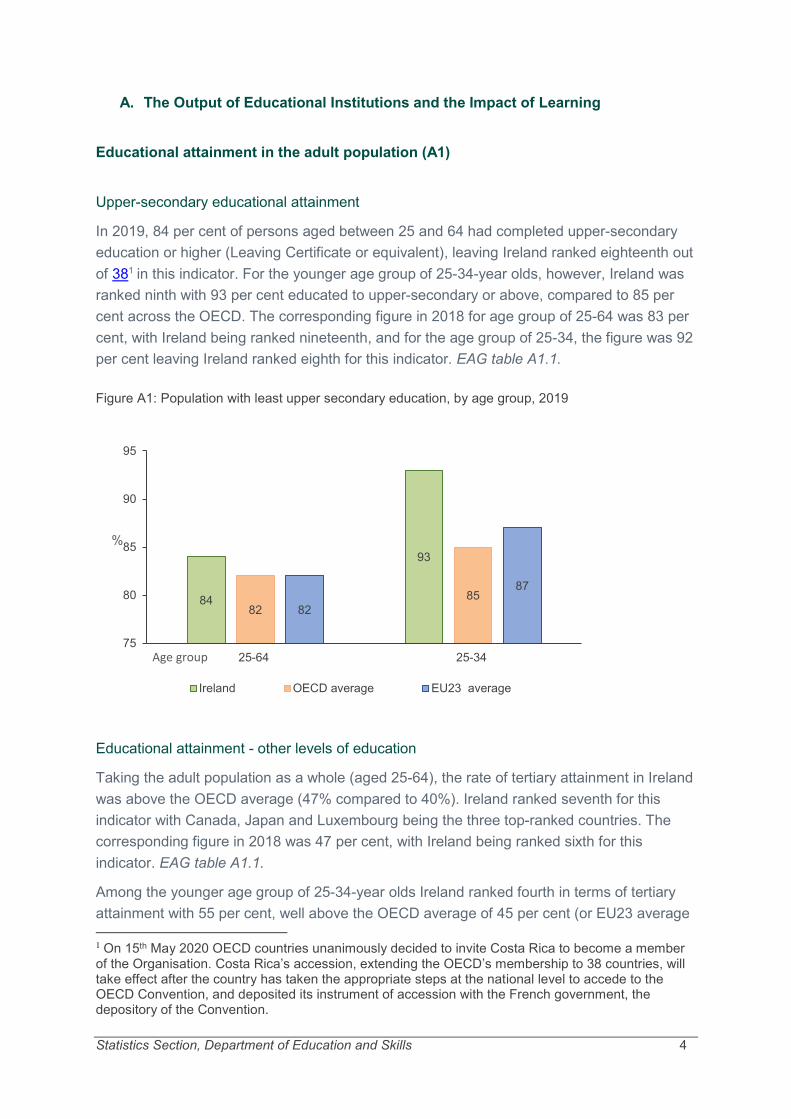
In 2019, 84 per cent of persons aged between 25 and 64 had completed upper-secondary
education or higher (Leaving Certificate or equivalent), leaving Ireland ranked eighteenth out
of 381 in this indicator. For the younger age group of 25-34-year olds, however, Ireland was
ranked ninth with 93 per cent educated to upper-secondary or above, compared to 85 per
cent across the OECD. The corresponding figure in 2018 for age group of 25-64 was 83 per
cent, with Ireland being ranked nineteenth, and for the age group of 25-34, the figure was 92
per cent leaving Ireland ranked eighth for this indicator. EAG table A1.1.
Figure A1: Population with least upper secondary education, by age group, 2019
Educational attainment - other levels of education
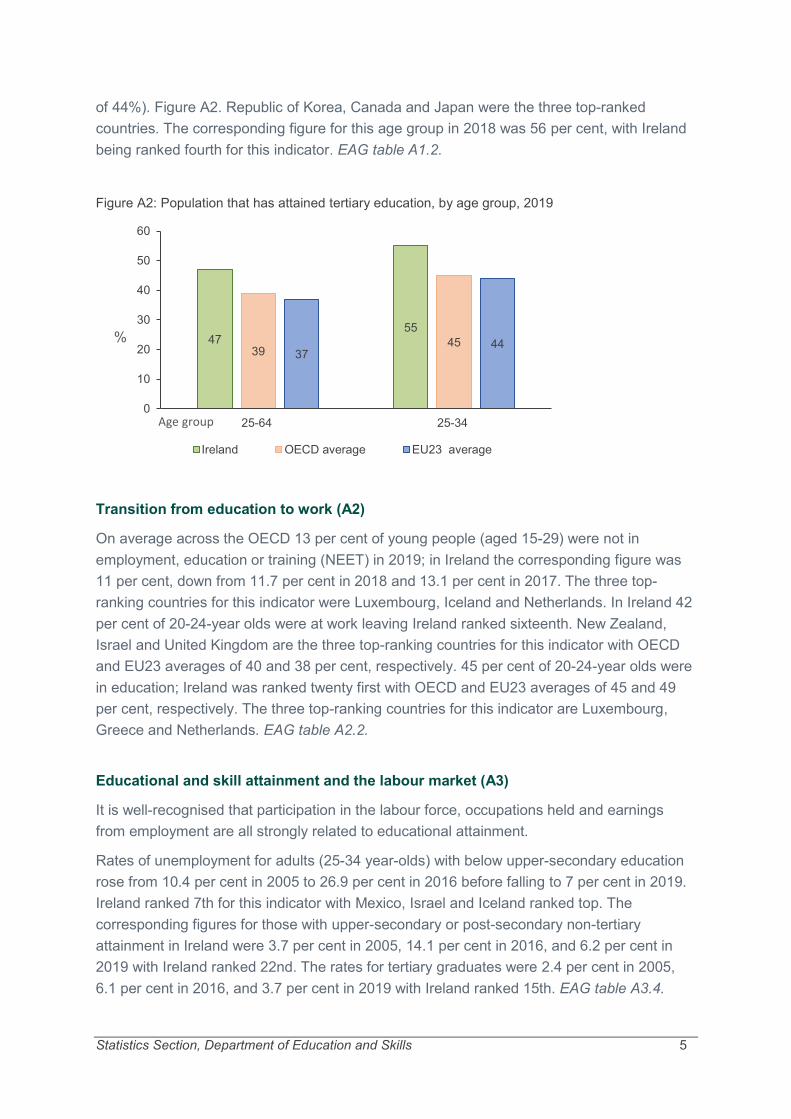
Taking the adult population as a whole (aged 25-64), the rate of tertiary attainment in Ireland
was above the OECD average (47% compared to 40%). Ireland ranked seventh for this
indicator with Canada, Japan and Luxembourg being the three top-ranked countries. The
corresponding figure in 2018 was 47 per cent, with Ireland being ranked sixth for this
indicator. EAG table A1.1.
Among the younger age group of 25-34-year olds Ireland ranked fourth in terms of tertiary
attainment with 55 per cent, well above the OECD average of 45 per cent (or EU23 average
1 On 15th May 2020 OECD countries unanimously decided to invite Costa Rica to become a member of the Organisation. Costa Rica’s accession, extending the OECD’s membership to 38 countries, will take effect after the country has taken the appropriate steps at the national level to accede to the OECD Convention, and deposited its instrument of accession with the French government, the depository of the Convention.
84
93
82
85
82
87
75
80
85
90
95
25-64 25-34
%
Age group
Ireland OECD average EU23 average
Statistics Section, Department of Education and Skills 5
of 44%). Figure A2. Republic of Korea, Canada and Japan were the three top-ranked
countries. The corresponding figure for this age group in 2018 was 56 per cent, with Ireland
being ranked fourth for this indicator. EAG table A1.2.
Figure A2: Population that has attained tertiary education, by age group, 2019
Transition from education to work (A2)
On average across the OECD 13 per cent of young people (aged 15-29) were not in
employment, education or training (NEET) in 2019; in Ireland the corresponding figure was
11 per cent, down from 11.7 per cent in 2018 and 13.1 per cent in 2017. The three top-
ranking countries for this indicator were Luxembourg, Iceland and Netherlands. In Ireland 42
per cent of 20-24-year olds were at work leaving Ireland ranked sixteenth. New Zealand,
Israel and United Kingdom are the three top-ranking countries for this indicator with OECD
and EU23 averages of 40 and 38 per cent, respectively. 45 per cent of 20-24-year olds were
in education; Ireland was ranked twenty first with OECD and EU23 averages of 45 and 49
per cent, respectively. The three top-ranking countries for this indicator are Luxembourg,
Greece and Netherlands. EAG table A2.2.
Educational and skill attainment and the labour market (A3)
It is well-recognised that participation in the labour force, occupations held and earnings
from employment are all strongly related to educational attainment.
Rates of unemployment for adults (25-34 year-olds) with below upper-secondary education
rose from 10.4 per cent in 2005 to 26.9 per cent in 2016 before falling to 7 per cent in 2019.
Ireland ranked 7th for this indicator with Mexico, Israel and Iceland ranked top. The
corresponding figures for those with upper-secondary or post-secondary non-tertiary
attainment in Ireland were 3.7 per cent in 2005, 14.1 per cent in 2016, and 6.2 per cent in
2019 with Ireland ranked 22nd. The rates for tertiary graduates were 2.4 per cent in 2005,
6.1 per cent in 2016, and 3.7 per cent in 2019 with Ireland ranked 15th. EAG table A3.4.
4755
3945
3744
0
10
20
30
40
50
60
25-64 25-34
%
Age group
Ireland OECD average EU23 average
Statistics Section, Department of Education and Skills 6
Individual labour market returns to education (A4, A5)
In all OECD countries, adults with tertiary education earn more than adults with upper-
secondary education who, in turn, earn more than adults with below upper-secondary
education. In this way education may be viewed as an investment in future earnings with a
‘premium’ income arising from higher education and the associated skills and productivity of
the person.
Using upper-secondary as a benchmark in 2018 adults aged 25-64 with short-cycle tertiary
qualifications earned 32 per cent more; those with a Bachelor’s degree earned 57 per cent
more; and those with a Master’s or Doctoral degree earned 81 per cent more on average.
The corresponding OECD averages were 19, 43 and 89 per cent, respectively. EAG table
A4.1.
EAG 2020 shows that government financial returns on investment in education are closely
related to individual returns. Countries where individuals benefit the most from pursuing
tertiary education are also those where governments gain the largest returns with
Luxembourg, United States and Ireland being notable for very large net private and public
financial returns. The opposite is observed in Latvia, Estonia and Sweden, where net
financial private and public returns are the lowest. EAG tables A5.5, A5.6, A5.7 and A5.8.
Across the OECD the average gross private benefit of a tertiary-education was $343,400
(PPP adjusted) for a man and $263,000 for a woman in 2017, while in Ireland the equivalent
figures were $532,500 for a man and $423,600 for woman. Ireland ranked 3rd for this
indicator, behind Luxembourg and United States. EAG tables A5.5 and A5.6.
In indicators A4 and A5, no account is taken of the various social, cultural and non-market
benefits of education to the individual as well as the wider community. However, other
indicators (EAG A6) are provided to illustrate likely societal benefits from additional
education.
B. Access to Education, Participation and Progression
Participation outside of compulsory education (B1, B2, B3, B4)
Early childhood education: EAG table B2.2 shows the enrolment rates of children aged 3 to
6 in pre-primary and primary education. For the 2018 academic year 98 per cent of 3 year
olds were enrolled in pre-primary education in Ireland. Ireland was ranked 6th among OECD
countries, with France, Israel and United Kingdom ranked top at 100%. The corresponding
figure in 2017 was 92 per cent, with Ireland being ranked fourteenth for this indicator.
79 per cent of 4-year olds were in pre-primary, with the remainder enrolled in primary, giving
a combined enrolment rate for 4 year olds of 100 per cent and ahead of the OECD average
of 88 per cent.
The highest primary enrolment rates for 5-year olds were in Ireland (100%), the United
Kingdom (97%) and New Zealand (94%) compared with 83 per cent across the OECD,
Statistics Section, Department of Education and Skills 7
whereas 5-year olds in France, the Netherlands and Denmark tend to be still enrolled in pre-
primary.
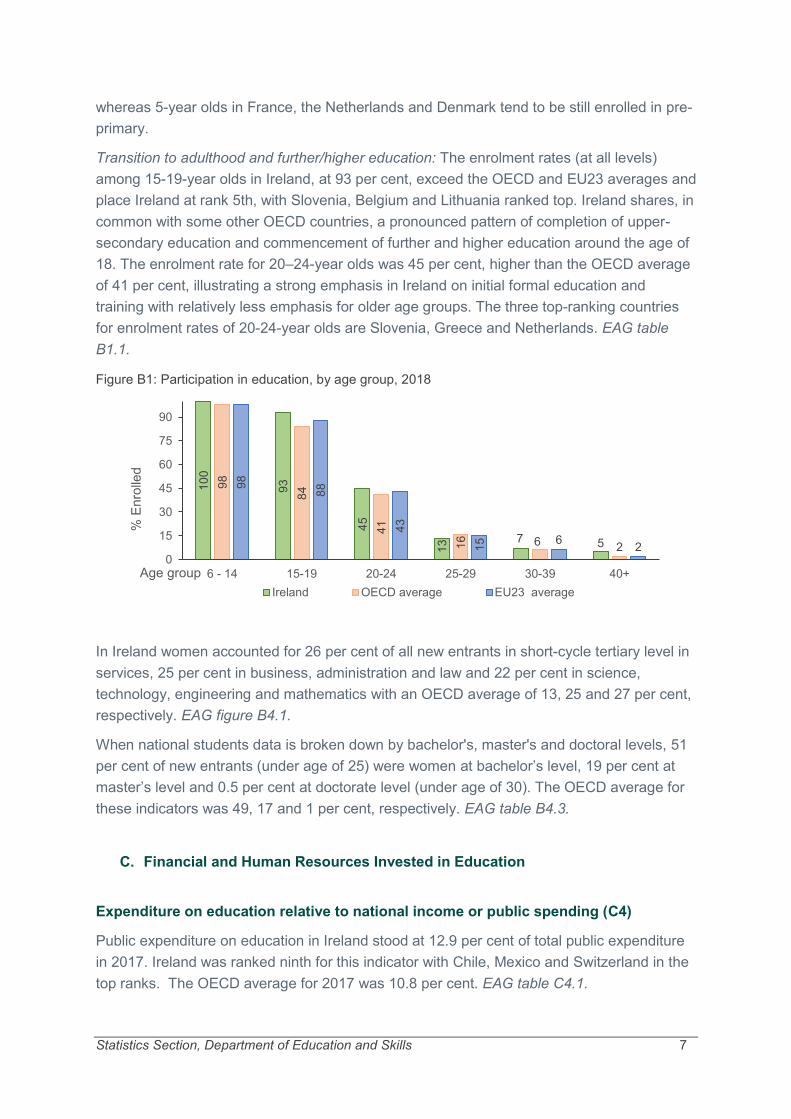
Transition to adulthood and further/higher education: The enrolment rates (at all levels)
among 15-19-year olds in Ireland, at 93 per cent, exceed the OECD and EU23 averages and
place Ireland at rank 5th, with Slovenia, Belgium and Lithuania ranked top. Ireland shares, in
common with some other OECD countries, a pronounced pattern of completion of upper-
secondary education and commencement of further and higher education around the age of
18. The enrolment rate for 20–24-year olds was 45 per cent, higher than the OECD average
of 41 per cent, illustrating a strong emphasis in Ireland on initial formal education and
training with relatively less emphasis for older age groups. The three top-ranking countries
for enrolment rates of 20-24-year olds are Slovenia, Greece and Netherlands. EAG table
B1.1.
Figure B1: Participation in education, by age group, 2018
In Ireland women accounted for 26 per cent of all new entrants in short-cycle tertiary level in
services, 25 per cent in business, administration and law and 22 per cent in science,
technology, engineering and mathematics with an OECD average of 13, 25 and 27 per cent,
respectively. EAG figure B4.1.
When national students data is broken down by bachelor's, master's and doctoral levels, 51
per cent of new entrants (under age of 25) were women at bachelor’s level, 19 per cent at
master’s level and 0.5 per cent at doctorate level (under age of 30). The OECD average for
these indicators was 49, 17 and 1 per cent, respectively. EAG table B4.3.
C. Financial and Human Resources Invested in Education
Expenditure on education relative to national income or public spending (C4)
Public expenditure on education in Ireland stood at 12.9 per cent of total public expenditure
in 2017. Ireland was ranked ninth for this indicator with Chile, Mexico and Switzerland in the
top ranks. The OECD average for 2017 was 10.8 per cent. EAG table C4.1.
10
0
93
45
13 7 5
98
84
41
16 6 2
98
88
43
15 6
20
15
30
45
60
75
90
6 - 14 15-19 20-24 25-29 30-39 40+
% E
nro
lled
Age group
Ireland OECD average EU23 average
Statistics Section, Department of Education and Skills 8
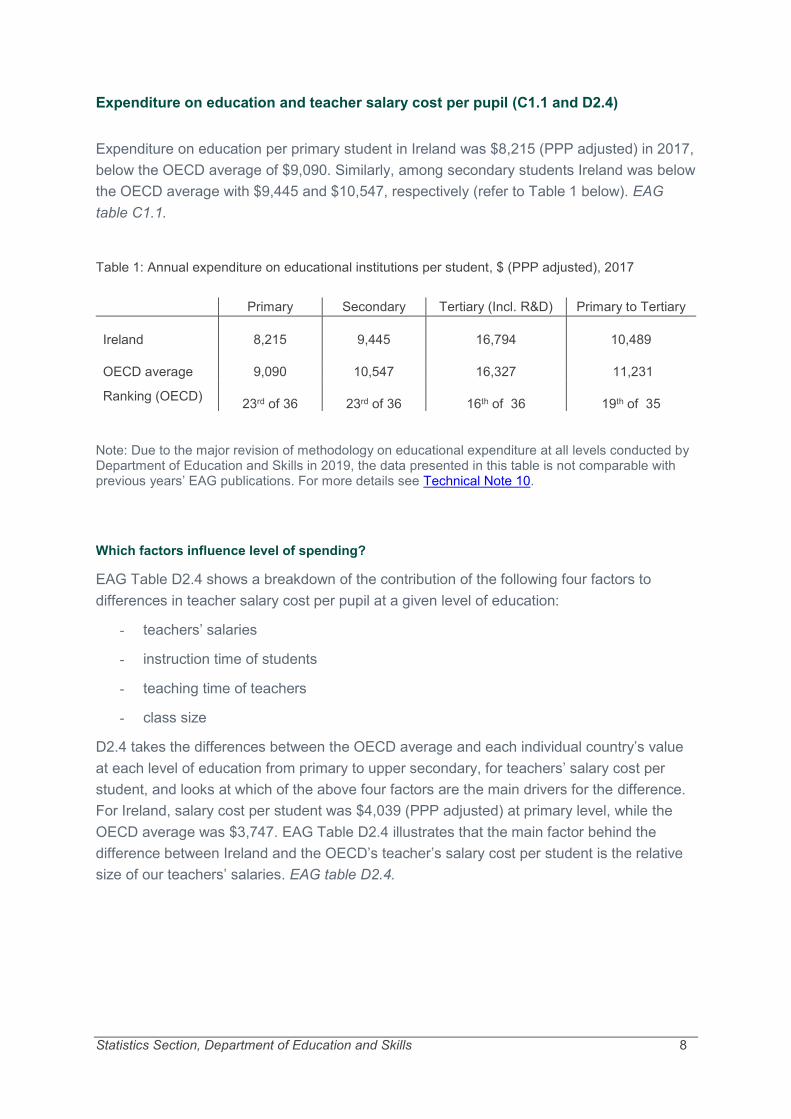
Expenditure on education and teacher salary cost per pupil (C1.1 and D2.4)
Expenditure on education per primary student in Ireland was $8,215 (PPP adjusted) in 2017,
below the OECD average of $9,090. Similarly, among secondary students Ireland was below
the OECD average with $9,445 and $10,547, respectively (refer to Table 1 below). EAG
table C1.1.
Table 1: Annual expenditure on educational institutions per student, $ (PPP adjusted), 2017
Note: Due to the major revision of methodology on educational expenditure at all levels conducted by Department of Education and Skills in 2019, the data presented in this table is not comparable with previous years’ EAG publications. For more details see Technical Note 10.
Which factors influence level of spending?
EAG Table D2.4 shows a breakdown of the contribution of the following four factors to
differences in teacher salary cost per pupil at a given level of education:
- teachers’ salaries
- instruction time of students
- teaching time of teachers
- class size
D2.4 takes the differences between the OECD average and each individual country’s value
at each level of education from primary to upper secondary, for teachers’ salary cost per
student, and looks at which of the above four factors are the main drivers for the difference.
For Ireland, salary cost per student was $4,039 (PPP adjusted) at primary level, while the
OECD average was $3,747. EAG Table D2.4 illustrates that the main factor behind the
difference between Ireland and the OECD’s teacher’s salary cost per student is the relative
size of our teachers’ salaries. EAG table D2.4.
Primary Secondary Tertiary (Incl. R&D) Primary to Tertiary
Ireland 8,215
9,445
16,794
10,489
OECD average 9,090 10,547 16,327 11,231
Ranking (OECD)
23rd of 36
23rd of 36
16th of 36
19th of 35
Statistics Section, Department of Education and Skills 9
D. The Learning Environment and Organisation of Schools
Instruction time in schools (D1)
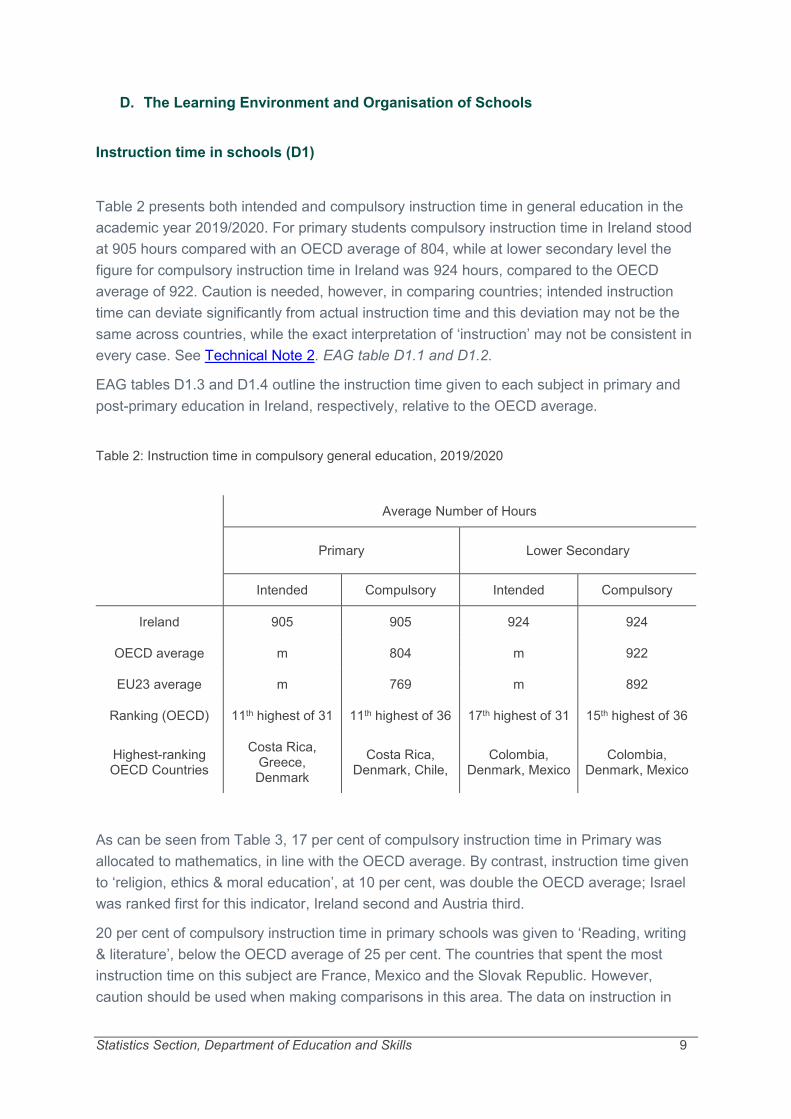
Table 2 presents both intended and compulsory instruction time in general education in the
academic year 2019/2020. For primary students compulsory instruction time in Ireland stood
at 905 hours compared with an OECD average of 804, while at lower secondary level the
figure for compulsory instruction time in Ireland was 924 hours, compared to the OECD
average of 922. Caution is needed, however, in comparing countries; intended instruction
time can deviate significantly from actual instruction time and this deviation may not be the
same across countries, while the exact interpretation of ‘instruction’ may not be consistent in
every case. See Technical Note 2. EAG table D1.1 and D1.2.
EAG tables D1.3 and D1.4 outline the instruction time given to each subject in primary and
post-primary education in Ireland, respectively, relative to the OECD average.
Table 2: Instruction time in compulsory general education, 2019/2020
Average Number of Hours
Primary Lower Secondary
Intended Compulsory Intended Compulsory
Ireland 905 905 924 924
OECD average m 804 m 922
EU23 average m 769 m 892
Ranking (OECD) 11th highest of 31 11th highest of 36 17th highest of 31 15th highest of 36
Highest-ranking OECD Countries
Costa Rica, Greece, Denmark
Costa Rica, Denmark, Chile,
Colombia, Denmark, Mexico
Colombia, Denmark, Mexico
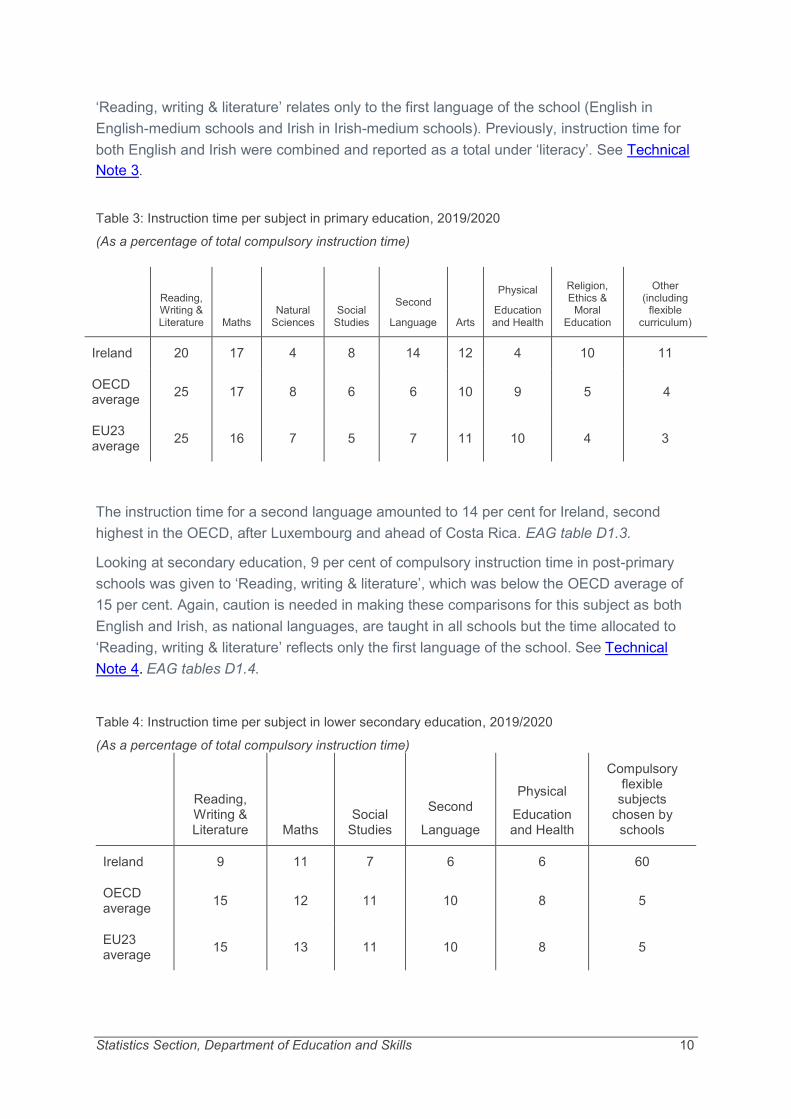
As can be seen from Table 3, 17 per cent of compulsory instruction time in Primary was
allocated to mathematics, in line with the OECD average. By contrast, instruction time given
to ‘religion, ethics & moral education’, at 10 per cent, was double the OECD average; Israel
was ranked first for this indicator, Ireland second and Austria third.
20 per cent of compulsory instruction time in primary schools was given to ‘Reading, writing
& literature’, below the OECD average of 25 per cent. The countries that spent the most
instruction time on this subject are France, Mexico and the Slovak Republic. However,
caution should be used when making comparisons in this area. The data on instruction in
Statistics Section, Department of Education and Skills 10
‘Reading, writing & literature’ relates only to the first language of the school (English in
English-medium schools and Irish in Irish-medium schools). Previously, instruction time for
both English and Irish were combined and reported as a total under ‘literacy’. See Technical
Note 3.
Table 3: Instruction time per subject in primary education, 2019/2020
(As a percentage of total compulsory instruction time)
Reading, Writing & Literature Maths
Natural Sciences
Social Studies
Second
Language Arts
Physical
Education and Health
Religion, Ethics &
Moral Education
Other (including
flexible curriculum)
Ireland 20 17 4 8 14 12 4 10 11
OECD average
25 17 8 6 6 10 9 5 4
EU23 average
25 16 7 5 7 11 10 4 3
The instruction time for a second language amounted to 14 per cent for Ireland, second
highest in the OECD, after Luxembourg and ahead of Costa Rica. EAG table D1.3.
Looking at secondary education, 9 per cent of compulsory instruction time in post-primary
schools was given to ‘Reading, writing & literature’, which was below the OECD average of
15 per cent. Again, caution is needed in making these comparisons for this subject as both
English and Irish, as national languages, are taught in all schools but the time allocated to
‘Reading, writing & literature’ reflects only the first language of the school. See Technical
Note 4. EAG tables D1.4.
Table 4: Instruction time per subject in lower secondary education, 2019/2020
(As a percentage of total compulsory instruction time)
Reading, Writing & Literature Maths
Social Studies
Second
Language
Physical
Education and Health
Compulsory flexible
subjects chosen by
schools
Ireland 9 11 7 6 6 60
OECD average
15 12 11 10 8 5
EU23 average
15 13 11 10 8 5
Statistics Section, Department of Education and Skills 11
In the case of mathematics, 11 per cent of compulsory instruction time was allocated to this
subject, below the OECD average. Italy, Chile and Latvia allocate the most instruction time
to mathematics. 7 per cent of compulsory instruction time in post-primary schools was given
to ‘social studies’, which was below the OECD average of 11 per cent. In this indicator
Ireland ranked 30th with Israel, Republic of Korea and Slovenia being top three countries.
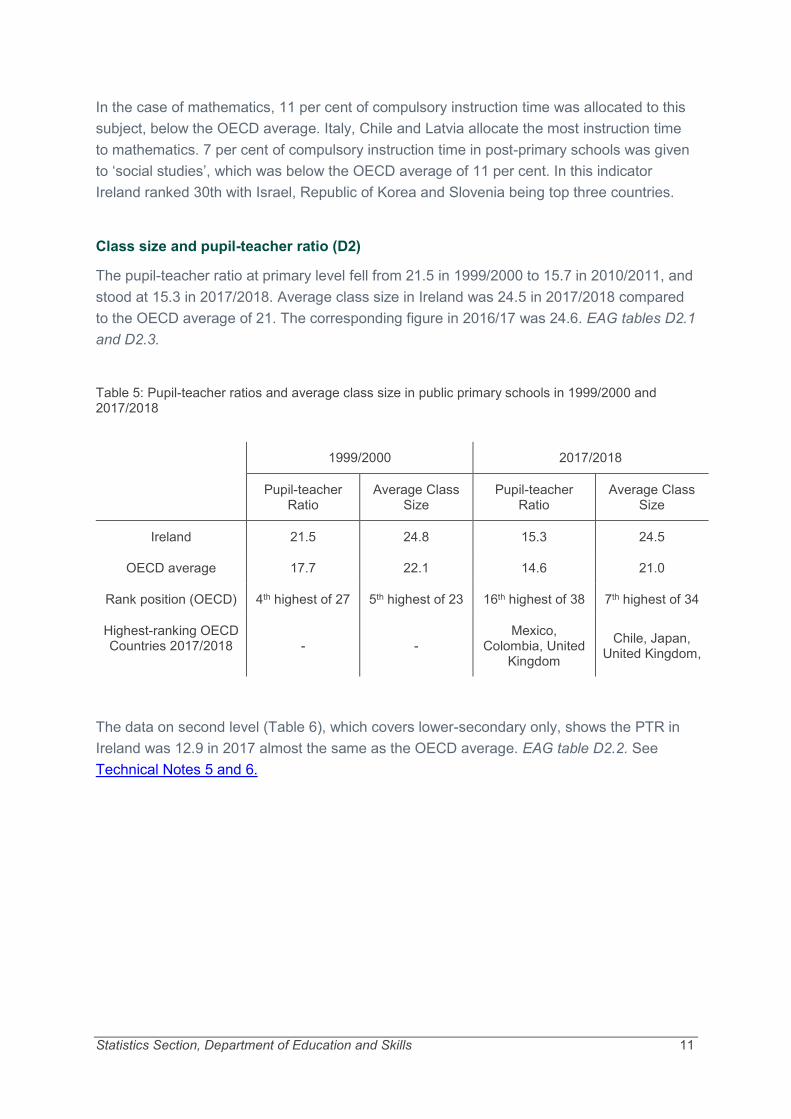
Class size and pupil-teacher ratio (D2)
The pupil-teacher ratio at primary level fell from 21.5 in 1999/2000 to 15.7 in 2010/2011, and
stood at 15.3 in 2017/2018. Average class size in Ireland was 24.5 in 2017/2018 compared
to the OECD average of 21. The corresponding figure in 2016/17 was 24.6. EAG tables D2.1
and D2.3.
Table 5: Pupil-teacher ratios and average class size in public primary schools in 1999/2000 and 2017/2018
1999/2000 2017/2018
Pupil-teacher Ratio
Average Class Size
Pupil-teacher Ratio
Average Class Size
Ireland 21.5 24.8 15.3 24.5
OECD average 17.7 22.1 14.6 21.0
Rank position (OECD) 4th highest of 27 5th highest of 23 16th highest of 38 7th highest of 34
Highest-ranking OECD Countries 2017/2018 - -
Mexico, Colombia, United
Kingdom
Chile, Japan, United Kingdom,
The data on second level (Table 6), which covers lower-secondary only, shows the PTR in
Ireland was 12.9 in 2017 almost the same as the OECD average. EAG table D2.2. See
Technical Notes 5 and 6.
Statistics Section, Department of Education and Skills 12
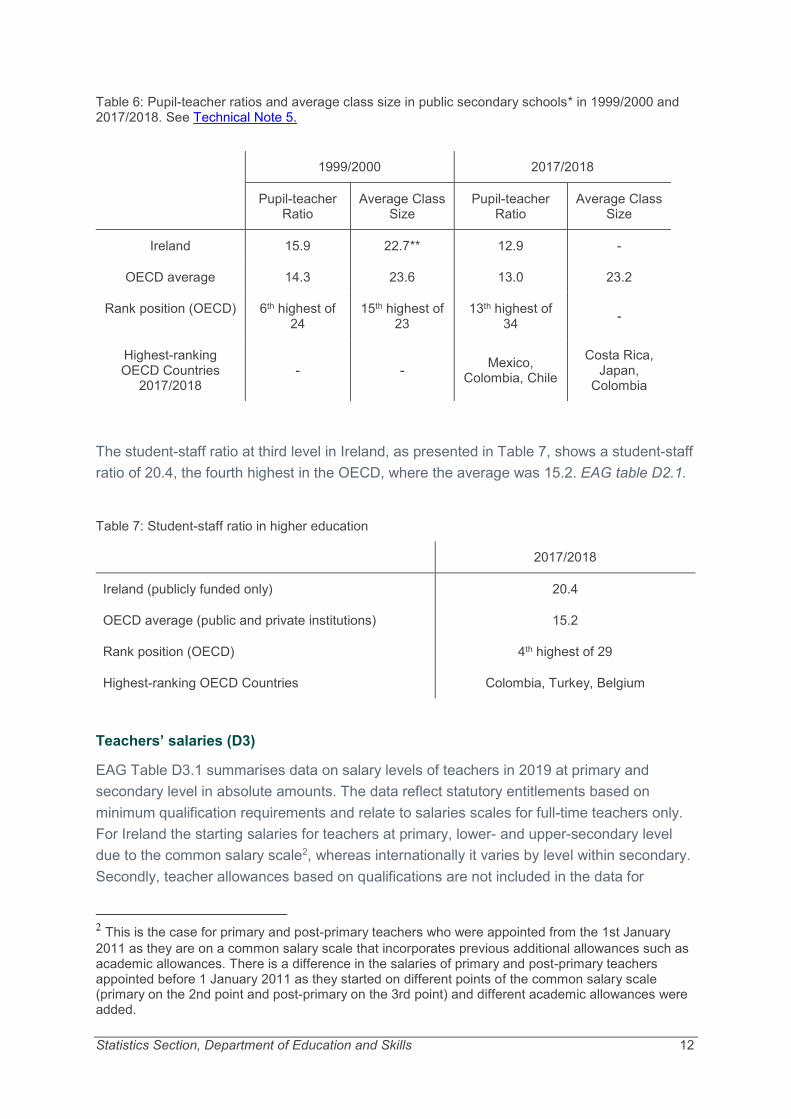
Table 6: Pupil-teacher ratios and average class size in public secondary schools* in 1999/2000 and 2017/2018. See Technical Note 5.
1999/2000 2017/2018
Pupil-teacher Ratio
Average Class Size
Pupil-teacher Ratio
Average Class Size
Ireland 15.9 22.7** 12.9 -
OECD average 14.3 23.6 13.0 23.2
Rank position (OECD) 6th highest of 24
15th highest of 23
13th highest of 34
-
Highest-ranking OECD Countries
2017/2018 - -
Mexico, Colombia, Chile
Costa Rica, Japan,
Colombia
The student-staff ratio at third level in Ireland, as presented in Table 7, shows a student-staff
ratio of 20.4, the fourth highest in the OECD, where the average was 15.2. EAG table D2.1.
Table 7: Student-staff ratio in higher education
2017/2018
Ireland (publicly funded only) 20.4
OECD average (public and private institutions) 15.2
Rank position (OECD) 4th highest of 29
Highest-ranking OECD Countries Colombia, Turkey, Belgium
Teachers’ salaries (D3)
EAG Table D3.1 summarises data on salary levels of teachers in 2019 at primary and
secondary level in absolute amounts. The data reflect statutory entitlements based on
minimum qualification requirements and relate to salaries scales for full-time teachers only.
For Ireland the starting salaries for teachers at primary, lower- and upper-secondary level
due to the common salary scale2, whereas internationally it varies by level within secondary.
Secondly, teacher allowances based on qualifications are not included in the data for
2 This is the case for primary and post-primary teachers who were appointed from the 1st January
2011 as they are on a common salary scale that incorporates previous additional allowances such as academic allowances. There is a difference in the salaries of primary and post-primary teachers appointed before 1 January 2011 as they started on different points of the common salary scale (primary on the 2nd point and post-primary on the 3rd point) and different academic allowances were added.
Statistics Section, Department of Education and Skills 13
Ireland. Note: statutory salaries reported in this indicator are not the same as actual
expenditures on salaries. Differences in taxation, pension provision and various non-salary
benefits are not factored into these comparisons. Salary data is reported in US dollars
adjusted for purchasing power parity. Refer to Technical Note 7 for further details.
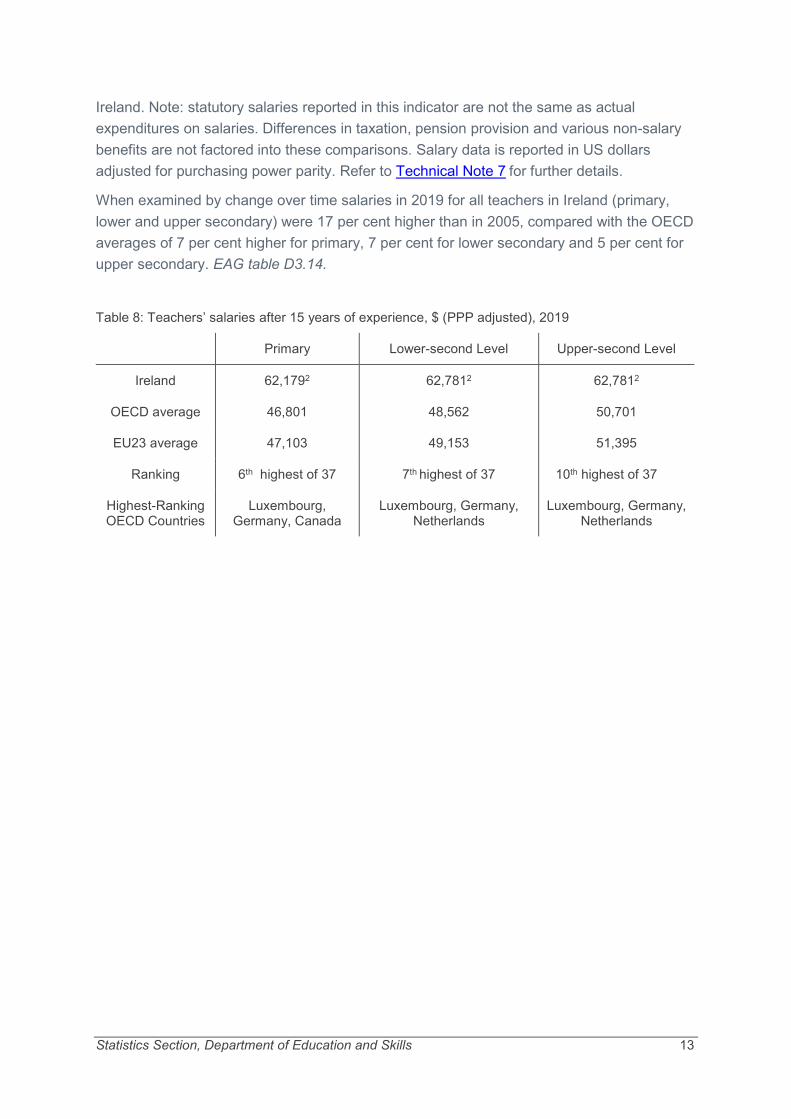
When examined by change over time salaries in 2019 for all teachers in Ireland (primary,
lower and upper secondary) were 17 per cent higher than in 2005, compared with the OECD
averages of 7 per cent higher for primary, 7 per cent for lower secondary and 5 per cent for
upper secondary. EAG table D3.14.
Table 8: Teachers’ salaries after 15 years of experience, $ (PPP adjusted), 2019
Primary Lower-second Level Upper-second Level
Ireland 62,1792 62,7812 62,7812
OECD average 46,801 48,562 50,701
EU23 average 47,103 49,153 51,395
Ranking 6th highest of 37 7th highest of 37 10th highest of 37
Highest-Ranking OECD Countries
Luxembourg, Germany, Canada
Luxembourg, Germany, Netherlands
Luxembourg, Germany, Netherlands
Statistics Section, Department of Education and Skills 14
Technical Notes
1. Data source: The data drawn from the Labour Force Survey or the European Survey
on Income and Living Conditions, together with data on GDP and population, have
been drawn directly from Eurostat or the Central Statistics Office. Data on enrolment,
graduates, entrants, expenditure and numbers of teachers have been supplied by the
Statistics Section of the Department of Education and Skills, while data on statutory
teacher salaries, working hours and surveys of school accountability have been
provided by the Inspectorate following consultation with relevant sections of the
Department. Data from the Programme of International Student Assessment were
gathered by the Educational Research Centre in Ireland but sourced directly from the
OECD.
2. Teaching time is defined as the number of hours per year that a full-time teacher
teaches a group or class of students according to policy. It is normally calculated as
the number of teaching days per annum multiplied by the number of hours a teacher
teaches per day (excluding periods of time formally allowed for breaks between
lessons or groups of lessons). Number of teaching weeks refers to the number of
weeks of instruction excluding holiday weeks. The number of teaching days is the
number of teaching weeks multiplied by the number of days a teacher teaches per
week, less the number of days that the school is closed for national holidays. Some
countries, however, provide estimates of teaching time based on survey data. At the
primary level, short breaks between lessons are included if the classroom teacher is
responsible for the class during these breaks.
3. Instruction times for ’reading, writing and literature’ and mathematics includes the
additional time allocated to literacy (i.e., one hour per week) and to numeracy (i.e., 70
minutes per week) provided for under the implementation of the National Literacy and
Numeracy Strategy.
4. Instruction time in Indicator D1 refers to intended (or separately compulsory)
instruction time based on policy documents (e.g. curricula) in countries where a
formal policy exists. In countries where such formal policies do not exist, the number
of hours was estimated from survey data. Data are based on countries’ responses to
questionnaire CURR 1 of the system-level annual data collection of INES NESLI
network’s Survey of Teachers and the Curriculum. Data were collected on classroom
sessions per year in public institutions, by subject in the modal grades of students
Note: for Ireland the changes from 2014 to 2015 are largely driven by the substantial increase in
GDP in 2015. For more information on this increase see http://www.cso.ie/en/media/csoie/newsevents/documents/pr_GDPexplanatorynote.pdf.
In 2016 Ireland produced a modified GNI (GNI*) that was recommended by the Economic
Statistics Review Group and is designed to exclude globalisation effects that are
disproportionately impacting the measurement size of the Irish Economy.
Statistics Section, Department of Education and Skills 15
age 7 to 15 for the referenced school year 2014/2015. Hours lost when schools were
closed for festivities and celebrations (such as national holidays) were excluded.
Intended instruction time does not include non-compulsory time outside the school
day, homework, individual tutoring or private study done before or after school.
Curriculum: Note in Annex III for Ireland (EAG2016): The curriculum for primary
schools is an integrated curriculum and envisages an integrated learning experience
for children which should facilitate cross-curricular activity. To assist schools in
planning the implementation of curriculum, a time framework is suggested that
allocates a minimum time to each of the curriculum areas. Four hours each day must
be set aside for secular instruction. A period of two hours a week of discretionary
time is allowed to accommodate different school needs and circumstances and to
provide for the differing aptitudes and abilities of the pupils.
Time allocation is based on the following weekly framework for a 36.6-week school
year in primary education: English (5 hours); Irish (3.5 hours); Mathematics (4.17
hours); Social, Environment and Scientific Education (3 hours, divided between
Science and Social Sciences); Social, Personal and Health Education (0.5 hours,
included in ’other’); Physical Education (1 hour); Arts Education (3 hours); Religious
Education (2.5 hours); assembly/roll call (2.33 hours, included in ’other’) total 25
hours. Whilst the curriculum also makes provision for discretionary curriculum time (2
hours), for the purposes of these tables, the additional time allocated to Literacy (1
hour) and Numeracy (70 minutes) has been deducted from the discretionary time.
Note however that Circular 0056/2011 allows schools to make provision for the
increased time through a combination of approaches such as:
integrating literacy and numeracy skills with other curriculum areas
using some or all of discretionary curriculum time for literacy and numeracy
activities
re-allocating time spent on the other subjects in the curriculum to the
development of literacy and numeracy
prioritising the curriculum objectives which are considered most valuable in
supporting children’s learning and delaying the introduction of elements of
some subjects (for example, by delaying the introduction of strands and
strand units from the history and geography curriculum for the infant classes
and first and second classes to later in the primary cycle).
5. Average class size at junior cycle was previously estimated from data provided by
the Post- Primary Timetables Database. During one reference week in September,
all schools were asked to provide class-size information for all periods of instruction
(classes). The total number of pupils in attendance in all periods of instruction is
divided by the total number of periods of instruction during the reference week. This
data source is no longer available. Table 6 : *Public secondary schools in Ireland
include all voluntary secondary schools (both fee-paying and non-fee-paying) along
Statistics Section, Department of Education and Skills 16
with community, comprehensive and VEC schools. **Lower secondary only (based
on DES Teacher Timetable Database).
6. PTR for second level in EAG differs from the figure shown in the DES Statistical
Report (13.1) for the same year (2017/2018), due to the inclusion of pupils and
teachers in other settings such as STTC, Youthreach and SOLAS.
7. Teachers’ Salaries: Data on statutory teacher salaries are based on the salary scales
and are derived from the 2016 NESLI Survey on Teachers and the Curriculum Data.
Data presented in EAG 2020 for starting salary (or salary with minimum qualification)
refers to the first point on the scale on revised salary scale for new entrants to
teaching at primary and post-primary level in accordance with Circular 0032/2013
and Circular 0005/2014. Unlike teachers appointed prior to 1 January 2011, the
reported data do not include any additional allowances including qualification
allowances. These were cut from the salaries of all new entrants to teaching in 2012.
8. Number of days a teacher teaches per year: The minimum school year for pre-
primary and primary education is 183 days; for secondary education it is 167 days. In
actuality, minimum = maximum.
9. For most indicators, an OECD average is shown along with an OECD total measure.
The OECD average is calculated as the unweighted mean of the data values of all
OECD countries for which data are available or can be estimated. It refers to an
average of data values at the level of the national systems and can be used to
determine how an indicator value for a given country compares with the value for a
typical or average country. It does not take into account the absolute size of the
education system in each country. The OECD total measure is calculated as a
weighted mean of the data values of all OECD countries for which data are available
or can be estimated. It reflects the value for a given indicator when the OECD area is
considered as a whole.
As of 2020, the OECD comprised 37 member countries of which 23 are members of
the European Union. These are referred to as the EU23 (Austria, Belgium, the Czech
Republic, Denmark, Estonia, Finland, France, Germany, Greece, Hungary, Italy,
Ireland, Latvia, Lithuania, Luxembourg, the Netherlands, Poland, Portugal, the
Slovak Republic, the Republic of Slovenia, Spain, Sweden and the United
Kingdom3). Hence, there are five EU member states (28 minus 23) that are not
members of the OECD (and are not included in EAG) while there are 14 OECD
member countries that are not members of the European Union but are included in
EAG. Data for a number of countries that are in partnership with the OECD including
China, Russia and Brazil, are shown in some tables but these are shown separately
within the table and are not included in the calculation of the OECD averages. On 28
April 2020, Colombia had formally become an OECD Member, the 37th country to do
3 The United Kingdom left the European Union on 31 January 2020, after 47 years of EU membership. This report analyses indicators on years 2017-2019 data collection, hence, UK inclusion in EU23 average. https://ec.europa.eu/ireland/news/key-eu-policy-areas/brexit_en
Statistics Section, Department of Education and Skills 17
so in the Organisation's near 60-year history. On 15th May 2020 OECD countries
unanimously decided to invite Costa Rica to become a member of the Organisation.
1Costa Rica’s accession, extending the OECD’s membership to 38 countries, will
take effect after the country has taken the appropriate steps at the national level to
accede to the OECD Convention, and deposited its instrument of accession with the
French government, the depository of the Convention.
Comparative data on education and training may be accessed at the following
website: https://ec.europa.eu/eurostat/data/database and follow links to Database ->
Population and Social Conditions -> Education and Training.
10. The methodology used when compiling expenditure on education is laid out in a
detailed manual on concepts, definitions and classifications published by the OECD.
Expenditure covers not just government expenditure but also expenditure by
households, by other private sources and international expenditure.
A review of data sources and methods undertaken in 2019 and early 2020 has
resulted in a number of significant changes to the estimates provided to the OECD.
In particular:
Retirement expenditure no longer includes pensions paid to former
employees resulting in a fall in public expenditure in the primary and post-
primary sectors in particular.
Revisions to the treatment of expenditure by the National Training Fund.
The inclusion of additional components of educational expenditure by the
Department of Social Protection such as supports for clothes, books and
transport.
Improved estimates of household expenditure resulting in increases in private
expenditure across all sectors.
Revised estimates of expenditure on research and development to bring it
into line with the UOE manual.
As a result of these revisions the overall figure for education expenditure has been
revised upwards while the split between public and private expenditure has shifted
and is now more in line with the OECD average. The OECD average is 83% public
and 17% private while the revised split for Ireland is 82.5% public and 17.5% private;
previously this had been 91% public and 9% private.
It is important to note that due to these extensive revisions the 2017 expenditure data
is not comparable with the 2016 data published in September 2019. In particular
comparisons between the expenditure per head at primary and secondary levels with
2016 are not valid.
Statistics Section, Department of Education and Skills 18
11. Number of hours a teacher teaches per day: For primary education: (5 hours 40
minutes) - (40 minutes breaks and recreation) = 5 hours; for secondary education, 22
hours per week (maximum) are required = 4.4 teaching hours on average per day.
12. Teacher working time refers to the normal working hours of a full-time teacher.
According to formal policy in a given country, working time can variously refer only to
the time directly associated with teaching (and other curricular activities for students
such as assignments and tests, but excluding annual examinations) or the time
directly associated with teaching and hours devoted to other activities related to
teaching, such as lesson preparation, counselling students, correcting assignments
and tests, professional development, meetings with parents, staff meetings and
general school tasks. Working time does not include paid overtime.
Statistics Section, Department of Education and Skills 19
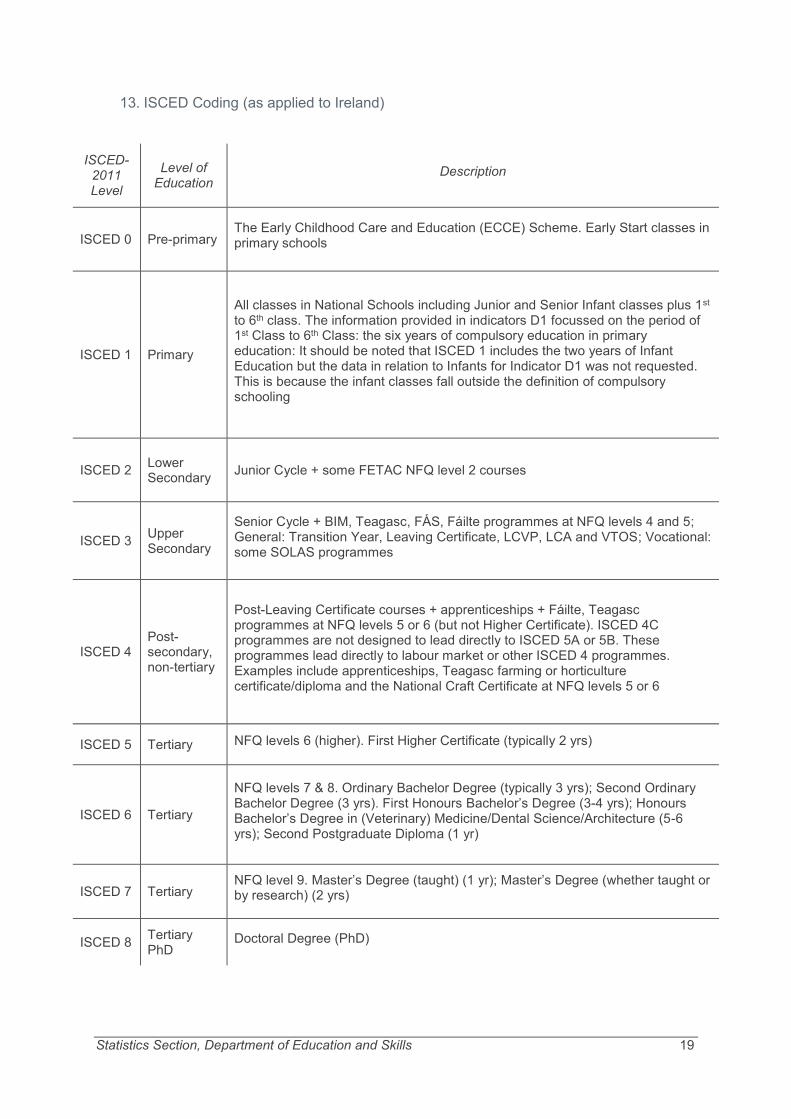
13. ISCED Coding (as applied to Ireland)
ISCED-2011 Level
Level of Education
Description
ISCED 0 Pre-primary The Early Childhood Care and Education (ECCE) Scheme. Early Start classes in primary schools
ISCED 1 Primary
All classes in National Schools including Junior and Senior Infant classes plus 1st to 6th class. The information provided in indicators D1 focussed on the period of 1st Class to 6th Class: the six years of compulsory education in primary education: It should be noted that ISCED 1 includes the two years of Infant Education but the data in relation to Infants for Indicator D1 was not requested. This is because the infant classes fall outside the definition of compulsory schooling
ISCED 2 Lower Secondary
Junior Cycle + some FETAC NFQ level 2 courses
ISCED 3 Upper Secondary
Senior Cycle + BIM, Teagasc, FÁS, Fáilte programmes at NFQ levels 4 and 5; General: Transition Year, Leaving Certificate, LCVP, LCA and VTOS; Vocational: some SOLAS programmes
ISCED 4 Post-secondary, non-tertiary
Post-Leaving Certificate courses + apprenticeships + Fáilte, Teagasc programmes at NFQ levels 5 or 6 (but not Higher Certificate). ISCED 4C programmes are not designed to lead directly to ISCED 5A or 5B. These programmes lead directly to labour market or other ISCED 4 programmes. Examples include apprenticeships, Teagasc farming or horticulture certificate/diploma and the National Craft Certificate at NFQ levels 5 or 6
ISCED 5 Tertiary NFQ levels 6 (higher). First Higher Certificate (typically 2 yrs)
ISCED 6 Tertiary
NFQ levels 7 & 8. Ordinary Bachelor Degree (typically 3 yrs); Second Ordinary Bachelor Degree (3 yrs). First Honours Bachelor’s Degree (3-4 yrs); Honours Bachelor’s Degree in (Veterinary) Medicine/Dental Science/Architecture (5-6 yrs); Second Postgraduate Diploma (1 yr)
ISCED 7 Tertiary NFQ level 9. Master’s Degree (taught) (1 yr); Master’s Degree (whether taught or by research) (2 yrs)
ISCED 8 Tertiary PhD
Doctoral Degree (PhD)