Embed Size (px)
Citation preview
United States Environmental Protection Agency Office of Water Office of Environmental Information Washington, DC EPA No. 841-R-09-004
National Coastal Condition Assessment Quality Assurance
Project Plan July 2010
Quality Assurance Project Plan for July 2010 National Coastal Condition Assessment Page ii
QUALITY ASSURANCE PROJECT PLAN
REVIEW & DISTRIBUTION ACKNOWLEDGMENT AND
COMMITMENT TO IMPLEMENT
for
National Coastal Condition Assessment We have read the QAPP and the methods manuals for the National Coastal Condition Assessment listed below. Our agency/organization agrees to abide by its requirements for work performed under the National Coastal Condition Assessment
Quality Assurance Project Plan □ Field Operations Manual □ Site Evaluation Guidelines □ Laboratory Methods Manual □
Print Name Title (Cooperator’s Principal Investigator) Organization
Signature Date
Quality Assurance Project Plan for July 2010 National Coastal Condition Assessment Page iii
NOTICES
The National Coastal Condition Assessment (NCCA) monitoring and assessment project and this Quality Assurance Project Plan (QAPP) are based on the previous Environmental Monitoring and Assessment Program’s (EMAP) National Coastal Assessment (NCA) conducted in 2001 - 2004. The QAPP has been revised to reflect updated personnel lists, several revised indicators and protocols, and the transfer of lead responsibility from the Office of Research and Development (ORD) during the research survey phase to the Office of Water (OW) in the implementation phase with technical support from ORD. Much of this document was modeled as originally written for the National Coastal Assessment Quality Assurance Project Plan 2001 – 2004 and other National Surveys (the Wadeable Streams Assessment, the National Lakes Assessment, and the National Rivers and Streams Assessment), where appropriate. The complete documentation of overall NCCA project management, design, methods, and standards is contained in four companion documents, including:
• National Coastal Condition Assessment: Quality Assurance Project Plan (EPA 841-R-09-004) • National Coastal Condition Assessment: Field Operations Manual (EPA 21010A) • National Coastal Condition Assessment: Laboratory Methods Manual (EPA, 2010B) • National Coastal Condition Assessment: Site Evaluation Guidelines (EPA, 2010C)
This document (QAPP) contains elements of the overall project management, data quality objectives, measurement and data acquisition, and information management for the NCCA. Methods described in this document are to be used specifically in work relating to the NCCA. All Project Cooperators should follow these guidelines. Mention of trade names or commercial products in this document does not constitute endorsement or recommendation for use. More details on specific methods for site evaluation, field sampling, and laboratory processing can be found in the appropriate companion document(s). The citation for this document is: U.S. EPA. 2009. National Coastal Condition Assessment Quality Assurance Project Plan 2008-2012. United States Environmental Protection Agency, Office of Water, Office of Wetlands, Oceans and Watersheds. Washington, D.C. EPA/841-R-09-004.
Quality Assurance Project Plan for July 2010 National Coastal Condition Assessment Page iv
ABSTRACT
The National Coastal Condition Assessment is one of a series of water assessments being conducted by states, tribes, the U.S. Environmental Protection Agency (EPA), and other partners. In addition to coastal waters, the water assessments will also focus on rivers and streams, lakes, and wetlands in a revolving sequence. The purpose of these assessments is to generate statistically valid reports on the condition of our Nation’s water resources and identify key stressors to these systems. A first step in the development of this type of program was the initiation of EPA’s EMAP. This program laid the groundwork for the National Coastal Assessment program, a national coastal monitoring program organized and executed at the state level. The Great Lakes have been added to this round of assessments and is included in the final NCCA report projected to be released in 2012. This document is the QAPP for the National Coastal Condition Assessment program. This QAPP was prepared and formatted in accordance with the guidelines presented in EPA Requirements for Quality Assurance Project Plans for Environmental Data Operations (EPA QA/R-5), U.S. EPA Quality Management Staff (U.S. EPA, 1993). According to the type of work to be performed and the intended use of the data, four categories have been defined that vary the level of detail and rigor prescribed for a particular QAPP. This document was prepared for a Category II Project: Complementary Support to Rulemaking, Regulation, or Policy Decisions. Such projects are of sufficient scope and robustness that their results can be combined with those from other projects of similar scope to provide the necessary information for decisions.
Quality Assurance Project Plan for July 2010 National Coastal Condition Assessment Page v
NCCA EXECUTIVE SUMMARY
Background
Several recent reports have identified the need for improved water quality monitoring and analysis at multiple scales. In response, the U.S. EPA Office of Water, in partnership with EPA’s Office of Research and Development (ORD), EPA regional offices, states and tribes and other partners, has begun a program to assess the condition of the nation’s waters via a statistically valid approach. Often referred to as probability-based surveys, these assessments, known as the National Aquatic Resource Surveys, report on core indicators of water condition using standardized field and lab methods and utilize integrated information management plans, such as described in the accompanying Quality Assurance Project Plan, to ensure confidence in the results at national and ecoregional scales.
The NCCA, which builds upon previous National Coastal Assessments and the National Coastal Condition Reports (2001, 2004, and 2008), aims to address two key questions about the quality of the Nation’s coastal waters:
- What percent of the Nation’s coastal waters are in good, fair, and poor condition for key indicators of water quality, ecological health, and recreation?
- What is the relative importance of key stressors such as nutrients and pathogens?
The surveys are also designed to help expand and enhance state monitoring programs. Through these surveys, states and tribes have the opportunity to collect data which can be used to supplement their existing monitoring programs or to begin development of new programs.
NCCA Project Organization
Overall project coordination is conducted by EPA's Office of Water (OW) in Washington, DC, with technical support from the ORD’s Western Ecology Division in Corvallis, Oregon, and Gulf Ecology Division in Gulf Breeze, Florida. Each of the coastal EPA Regional Offices has identified regional coordinators to assist in implementing the survey and coordinate with the state crews who collect the water and sediment samples following NCCA protocols. The Office of Science and Technology (OST) within OW is conducting the human health fish tissue study in the Great Lakes in partnership with the Great Lakes National Program Office.
EPA sponsored a national meeting in 2008 to begin planning the 2010 NCCA survey and, continuing this partnership, expects to report the results in 2012 in compliance with the Data Quality Act.
Quality Assurance Project Plan
The purpose of this QAPP is to document the project data quality objectives and quality assurance/quality control measures that will be implemented in order to ensure that the data collected meets those needs. The plan contains elements of the overall project management,
Quality Assurance Project Plan for July 2010 National Coastal Condition Assessment Page vi
data quality objectives, measurement and data acquisition, and information management for the NCCA.
Information Management Plan
Environmental monitoring efforts that amass large quantities of information from various sources present unique and challenging data management opportunities. To meet these challenges, the NCCA employs a variety of well-tested information management (IM) strategies to aid in the functional organization and ensured integrity of stored electronic data. IM is integral to all aspects of the NCCA from initial selection of sampling sites through the dissemination and reporting of final, validated data.
A technical workgroup convened by the EPA Project Leader is responsible for development of a data analysis plan that includes a verification and validation strategy. These processes are summarized in the indicator-specific sections of this QAPP. Validated data are transferred to the central data base managed by EMAP information management support staff located at the Western Ecology Division facilities in Corvallis. This database is known as the National Aquatic Resource Surveys Information Management System (NARSIMS). All validated measurement and indicator data from the NCCA are eventually transferred to EPA’s Water Quality Exchange (WQX) for storage in EPA’s STORET warehouse for public accessibility. NCCA IM staff provides support and guidance to all program operations in addition to maintaining NARSIMS.
Overview of NCCA Design
The NCCA is designed to be completed during the index period of June through the end of September 2010. EPA used an unequal probability design to select 682 marine sites along the coasts of the continental United States and 225 freshwater sites from the shores of the Great Lakes. Fifty sites were drawn for Hawaii. To improve our ability to assess embayments as well as shorelines in the Great Lakes, EPA added 150 randomly selected sites in bays and embayments across all five Great Lakes Additionally, related sampling will occur on reef flat (coastal areas) of American Samoa, Guam and the Northern Mariana Islands during the 2010 field season.
Overview of Field Operations
Field data acquisition activities are implemented in a consistent manner across the entire country. Each site is given a unique ID which identifies it throughout the pre-field, field, lab, analysis, and data management phases of the project. Specific procedures for evaluating each sampling location and for replacing non-sampleable sites are documented in NCCA: Site Evaluation Guidelines (EPA, 2010C).
NCCA indicators include nutrients, light attenuation, sediment chemistry, sediment toxicity, benthic communities, fish tissue, and pathogens. Field measurements and samples are collected by trained teams. The field team leaders must be trained at an EPA-sponsored training session. Field sampling audits or evaluation visits will be completed for each field team.
Quality Assurance Project Plan for July 2010 National Coastal Condition Assessment Page vii
Overview of Laboratory Operations
NCCA laboratory analyses are conducted either by state-selected labs or “National Laboratories” set up by EPA to conduct analyses for any state which so elects. The designated National Laboratories must comply with the QA/QC requirements described in this document. Any laboratory selected to conduct analyses with NCCA samples must demonstrate that they can meet the quality standards presented in this QAPP and the NCCA Laboratory Methods Manual (EPA, 2010B) and NCCA Field Operations Manual (EPA, 2010A).
Peer Review
Surveys undergo a thorough peer review process, where the scientific community and the public are given the opportunity to provide comments. Cooperators have been actively involved in the development of the overall project management, design, indicator selection and methods.
The EPA utilizes a three tiered approach for peer review of the Survey: (1) internal and external review by EPA, states, other cooperators and partners, (2) external scientific peer review, and (3) public review. Outside scientific experts from universities, research centers, and other federal agencies have been instrumental in indicator development and will continue to play an important role in data analysis.
Quality Assurance Project Plan for July 2010 National Coastal Condition Assessment Page ix
Table of Contents
NOTICES ....................................................................................................................... iii ABSTRACT ................................................................................................................... iv NCCA EXECUTIVE SUMMARY ..................................................................................... v SIGNATURE PAGE..................................................................................................... viii ACRONYMS ............................................................................................................... xvii DISTRIBUTION LIST................................................................................................... xix 1. Project Planning and Management ................................................................... 1
1.1. Introduction............................................................................................................1
1.2. National Coastal Condition Assessment Project Organization..............................2
1.3. Study Design .......................................................................................................12
1.3.1. Project Schedule.....................................................................................13
1.4. Scope of QA Project Plan....................................................................................14
1.4.1. Overview of Field Operations..................................................................14
1.4.2. Overview of Laboratory Operations ........................................................16
1.4.3. Data Analysis and Reporting ..................................................................20
1.4.4. Peer Review ...........................................................................................20
2. Data Quality Objectives ................................................................................... 21 2.1. Data Quality Objectives for the National Coastal Condition Assessment............22
2.2. Measurement Quality Objectives.........................................................................22
2.2.1. Method Detection Limits (Laboratory Reporting Level (Sensitivity)) .......22
2.2.2. Sampling Precision, Bias, and Accuracy ................................................23
2.2.3. Taxonomic Precision and Accuracy........................................................25
2.2.4. Completeness.........................................................................................26
2.2.5. Comparability ..........................................................................................26
2.2.6. Representativeness ................................................................................27
3. Site Selection Design ....................................................................................... 27 3.1. Probability Based Sampling Design and Site Selection ......................................28
3.1.1. Survey Design for the Marine Waters .....................................................28
3.1.2. Survey Design for the Great Lakes.........................................................29
3.1.3. Revisit Sites ............................................................................................29
4. Information Management................................................................................. 29 4.1. Roles and Responsibilities ..................................................................................30
Quality Assurance Project Plan for July 2010 National Coastal Condition Assessment Page x
4.1.1. State-Based Data Management..............................................................32
4.2. Overview of System Structure.............................................................................33
4.2.1. Data Flow Conceptual Model..................................................................33
4.2.2. Simplified Data Flow Description ............................................................34
4.3. Core Information Management Standards ..........................................................36
4.3.1. Data Formats ..........................................................................................36
4.3.2. Public Accessibility .................................................................................37
4.4. Data Transfer Protocols ......................................................................................38
4.5. Data Quality and Results Validation....................................................................39
4.5.1. Data Entry, Scanned, or Transferred Data .............................................39
4.5.2. Analytical Results Validation...................................................................40
4.5.3. Database Changes .................................................................................40
4.6. Metadata .............................................................................................................40
4.7. Information Management Operations..................................................................41
4.7.1. Computing Infrastructure ........................................................................41
4.7.2. Data Security and Accessibility...............................................................41
4.7.3. Life Cycle ................................................................................................41
4.7.4. Data Recovery and Emergency Backup Procedures..............................42
4.7.5. Long-Term Data Accessibility and Archive .............................................42
4.8. Records Management .........................................................................................42
5. Indicators .......................................................................................................... 42 5.1. Indicator Summary ..............................................................................................42
5.1.1. Introduction .............................................................................................42
5.1.2. Sampling Design.....................................................................................43
5.1.3. Sampling and Analytical Methods...........................................................43
5.1.4. Quality Assurance Objectives .................................................................43
5.1.5. Quality Control Procedures: Field Operations ........................................43
5.1.6. Quality Control Procedures: Laboratory Operations ...............................44
5.2. In Situ Measurements .........................................................................................45
5.2.1. Introduction .............................................................................................45
5.2.2. Sampling Design.....................................................................................46
5.2.3. Sampling and Analytical Methods...........................................................46
5.2.4. Quality Assurance Objectives .................................................................47
5.2.5. Quality Control Procedures: Field Operations ........................................48
Quality Assurance Project Plan for July 2010 National Coastal Condition Assessment Page xi
5.2.6. Quality Control Procedures: Laboratory Operations ...............................54
5.2.7. Data Reporting, Review, and Management ............................................54
5.3. Water Quality Measurements..............................................................................55
5.3.1. Introduction .............................................................................................55
5.3.2. Sampling Design.....................................................................................56
5.3.3. Sampling and Analytical Methods...........................................................56
5.3.4. Quality Assurance Objectives .................................................................57
5.3.5. Quality Control Procedures: Field Operations ........................................59
5.3.6. Quality Control Procedures: Laboratory Operations ...............................61
5.3.7. Data Reporting, Review, and Management ............................................66
5.4. Benthic Macrovinvertebrates...............................................................................68
5.4.1. Introduction .............................................................................................68
5.4.2. Sampling Design.....................................................................................68
5.4.3. Sampling and Analytical Methods...........................................................68
5.4.4. Quality Assurance Objectives .................................................................69
5.4.5. Quality Control Procedures: Field Operations ........................................70
5.4.6. Quality Control Procedures: Laboratory Operations ...............................70
5.4.7. Data Reporting, Review and Management .............................................73
5.5. Sediment and Fish Sampling and Chemistry ......................................................74
5.5.1. Introduction .............................................................................................74
5.5.2. Sampling Design.....................................................................................75
5.5.3. Sampling and Analytical Methods...........................................................80
5.5.4. Quality Assurance Objectives .................................................................83
5.5.5. Quality Control Procedures: Field Operations ........................................85
5.5.6. Quality Control Procedures: Laboratory Operations ...............................87
5.5.7. Data Reporting, Review and Management .............................................89
5.6. Sediment Grain Size and TOC............................................................................90
5.6.1. Introduction .............................................................................................90
5.6.2. Sampling Design.....................................................................................90
5.6.3. Sampling and Analytical Methods...........................................................90
5.6.4. Quality Assurance Objectives .................................................................91
5.6.5. Quality Control Procedures: Field Operations ........................................91
5.6.6. Quality Control Procedures: Laboratory Operations ...............................92
5.6.7. Data Reporting, Review and Management .............................................94
5.7. Sediment Toxicity ................................................................................................95
Quality Assurance Project Plan for July 2010 National Coastal Condition Assessment Page xii
5.7.1. Introduction .............................................................................................95
5.7.2. Sampling Design.....................................................................................95
5.7.3. Sampling and Analytical Methods...........................................................95
5.7.4. Quality Assurance Objectives .................................................................95
5.7.5. Quality Control Procedures: Field Operations ........................................96
5.7.6. Quality Control Procedures: Laboratory Operations ...............................96
5.7.7. Data Reporting, Review and Management .............................................98
5.8. Pathogen Indicator ..............................................................................................99
5.8.1. Introduction .............................................................................................99
5.8.2. Sampling Design...................................................................................100
5.8.3. Sampling and Analytical Methods.........................................................100
5.8.4. Quality Assurance Objectives ...............................................................101
5.8.5. Quality Control Procedures: Field Operations ......................................102
5.8.6. Quality Control Procedures: Laboratory Operations .............................102
5.8.7. Data Reporting, Review and Management ...........................................104
5.9. Site Characteristics ...........................................................................................104
6. Field and Biological Quality Evaluation & Assistance Visits...................... 104 6.1 Field Quality Evaluation and Assistance Visit Plan for the NCCA.....................106
6.2. Laboratory Quality Evaluation and Assistance Visit Plan for the NCCA............108
7. Data Analysis Plan ......................................................................................... 113 7.1. Data Interpretation Background ........................................................................113
7.1.1. Scale of Assessment ............................................................................113
7.1.2. Selecting Indicators ..............................................................................113
7.2. Datasets to be used for the Report....................................................................114
7.3. Indicators for the Coastal Assessment ..............................................................114
7.3.1. Water Chemistry and Chlorophyll .........................................................114
7.3.2. Benthic Macroinvertebrates ..................................................................114
7.3.3. Sediment Chemistry/Characteristics.....................................................114
7.3.4. Enterococci Data Analysis ....................................................................114
7.3.5. Fish Chemistry ......................................................................................115
7.4. NCCR Index Development Approach................................................................115
7.5. Calculation of Population Estimates..................................................................115
7.6. Relative Extent, Relative Risk and Attributable Risk Analysis...........................115
7.7. Other Change Analyses ....................................................................................115
Quality Assurance Project Plan for July 2010 National Coastal Condition Assessment Page xiii
7.8. Index Precision and Interpretation.....................................................................116
8. References ...................................................................................................... 117
Quality Assurance Project Plan for July 2010 National Coastal Condition Assessment Page xiv
LIST OF TABLES Table 1.2-1. Contact List ........................................................................................................... 7
Table 4.1 Summary of IM Responsibilities .......................................................................... 44
Table 5.2-1. NCCA In situ Indicators ....................................................................................... 46
Table 5.2-2. Measurement data quality objectives: water chemistry indicator ........................ 48
Table 5.2-3. Field quality control: CTD indicator...................................................................... 51
Table 5.2-4. Field quality control: multiparameter meter indicator........................................... 53
Table 5.2-5. Data reporting criteria: field measurements......................................................... 55
Table 5.3-1. National Coastal Condition Assessment Indicators............................................. 55
Table 5.3-2. Measurement data quality objectives: water chemistry indicator ........................ 58
Table 5.3-3. Measurement data quality objectives: phytoplankton indicator ........................... 59
Table 5.3-4. Sample processing quality control activities: water chemistry indicator .............. 60
Table 5.3-5. Sample processing quality control: chlorophyll a indicator .................................. 61
Table 5.3-6. Sample processing quality control: phytoplankton indicator................................ 61
Table 5.3-7. Sample receipt and processing quality control: water chemistry indicator .......... 62
Table 5.3-8. Laboratory quality control samples: water chemistry indicator ............................ 64
Table 5.3-9. Laboratory quality control samples: chlorophyll a indicator ................................. 65
Table 5.3-10. Laboratory quality control samples: phytoplankton indicator............................... 66
Table 5.3-11. Data validation quality control: water chemistry, chlorophyll a and
phytoplankton indicators...................................................................................... 67
Table 5.3-12. Data reporting criteria: water chemistry indicator ................................................ 67
Table 5.3-13. Data reporting criteria: chlorophyll-a indicator ..................................................... 68
Table 5.4-1. Measurement data quality objectives: benthic indicator ...................................... 69
Table 5.4-2. Sample collection and field processing quality control: benthic indicator ........... 70
Table 5.4-3. Sample receipt and processing quality control: benthic Macroinvertebrate
indicator.............................................................................................................. 71
Table 5.4-4. Laboratory Quality Control: benthic macroinvertebrate sample processing ........ 73
Table 5.4-5. Laboratory Quality Control: benthic macroinvertebrate taxonomic identification.73
Table 5.4-6. Data review, verification, and validation quality control: benthic indicator........... 74
Table 5.5-1. Recommended target species for whole body fish tissue collection by specific
biogeographical region ........................................................................................ 77
Table 5.5-2. Target Fish Species for Great Lakes HH fish tissue composites ........................ 79
Table 5.5-3. Indicator List of Metals (sediment and eco-fish tissue)........................................ 81
Table 5.5-4. Indicator List of Organchlorine Pesticides (sediment and eco-fish tussue) ......... 81
Quality Assurance Project Plan for July 2010 National Coastal Condition Assessment Page xv
Table 5.5-5. Indicator List of PCBs (sediment and eco-fish tissue) ......................................... 82
Table 5.5-6. Indicator List of PAHs (sediment only) ............................................................... 82
Table 5.5-7. Indicator List for Human Health Fish Tissue Only ............................................... 83
Table 5.5-8. Field Data Types: Sediment and Fish Tissue Indicators ..................................... 83
Table 5.5-9. Measurement quality objectives for fish tissue and sediment indicators ............. 84
Table 5.5-10. Target Method Detection Limits (MDLs) for laboratory analyses
NCCA samples.................................................................................................... 85
Table 5.5-11. Sample collection and field processing quality control: sediment
chemistry indicator .............................................................................................. 86
Table 5.5-12. Field quality control: fish tissue indicator ............................................................. 86
Table 5.5-13. Sample receipt and processing quality control: sediment and fish
tissue chemistry samples .................................................................................... 87
Table 5.5-14. Laboratory QC protocols ..................................................................................... 88
Table 5.5-15. Data validation quality control: sediment composite............................................ 89
Table 5.5-16. Data validation quality control: eco-fish tissue indicator ...................................... 89
Table 5.5-17. Data Reporting Criteria: Sediment and Eco-Fish Tissue Chemistry.................... 90
Table 5.6-1. Measurement quality objectives for TOC and grain size indicators..................... 91
Table 5.6-2. Sample collection and field processing quality control: sediment TOC
and grain size indicator ....................................................................................... 92
Table 5.6-3. Sample receipt and processing quality control: TOC and grain size indicators... 93
Table 5.6-4. Laboratory QC protocols for sediment TOC and grain size indicators ................ 94
Table 5.6-5. Data validation quality control: sediment TOC and grain size ............................. 94
Table 5.6-6. Data Reporting Criteria: Sediment Tests............................................................. 95
Table 5.7-1. Measurement quality objectives for sediment toxicity indicator........................... 96
Table 5.7-2. Sample collection and field processing quality control: sediment
toxicity indicator ................................................................................................... 96
Table 5.7-3. Sample receipt and processing quality control: sediment toxicity indicator......... 97
Table 5.7-4. Data validation quality control: sediment toxicity ................................................. 99
Table 5.7-5. Data Reporting Criteria: Sediment and Fish Tissue Chemistry ........................... 99
Table 5.8-1. Field and laboratory methods: pathogen indicator (Enterococci) ..................... 100
Table 5.8-2. Measurement data quality objectives: Pathogen-Indicator DNA Sequences .... 101
Table 5.8-3. Sample collection and field processing quality control: fecal indicator .............. 102
Table 5.8-4. Laboratory Quality Control: Pathogen-Indicator DNA Sequences..................... 103
Table 5.8-5. Data validation quality control: fecal indicator ................................................... 104
Table 7.1. Criteria for Assessing Dissolved Inorganic Nitrogen ......................................... 116
Quality Assurance Project Plan for July 2010 National Coastal Condition Assessment Page xvi
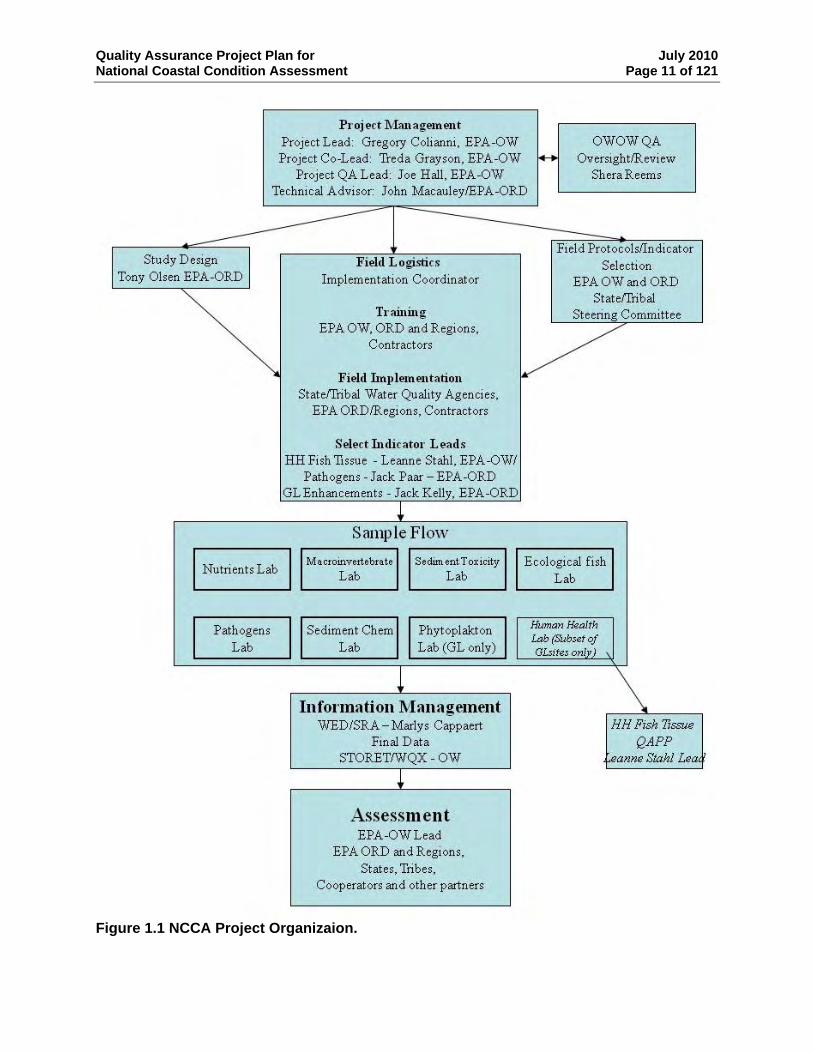
LIST OF FIGURES Figure 1.1. NCCA Project Organization................................................................................. 11
Figure 1.2. NCCA Marine Base Sites .................................................................................... 12
Figure 1.3. NCCA Great Lakes Coastal Base Sites .............................................................. 13
Figure 1.4. Site Evaluation Diagram...................................................................................... 16
Figure 4.1. Organization of the National Aquatic Resource Surveys Information
Management System (NARSIMS) for the NCCA. ............................................... 34
Figure 4.2. Conceptual model of data flow into and out of the master SQL database
for the NCCA. ...................................................................................................... 35
Figure 5.2-1. Field Chemistry Measurement Procedures ......................................................... 50
Figure 5.3-1. Laboratory Sample Processing ........................................................................... 63
Quality Assurance Project Plan for July 2010 National Coastal Condition Assessment Page xvii
ACRONYMS
APHA American Public Health Association ASCII American Standard Code for Information Interchange CAS Chemical Abstracts Service CRM Certified Reference Material CSDGM Content Standards for Digital Geospatial Metadata CV Coefficient of Variation DDT dichlorodiphenyltrichloroethane DO Dissolved Oxygen DQOs Data Quality Objectives EMAP Environmental Monitoring and Assessment Program FGDC Federal Geographic Data Committee FOIA Freedom of Information Act GC Gas Chromatograph GED Gulf Ecology Division GLEC Great Lakes Environmental Center, Inc. GPS Global Positioning System GRTS Generalized Random Tessellation Stratified ICP Inductively Coupled Plasma IDL Instrument Detection Limit IM Information Management IT IS Integrated Taxonomic Information System LDR Linear Dynamic Range LRL Laboratory Reporting Level LT-MDL Long-term Method Detection Limit MDLs Method Detection Limits MQOs Measurement Quality Objectives NARSIMS National Aquatic Resource Surveys Information Management System NARS National Aquatic Resource Surveys NCA National Coastal Assessment (past surveys) NCCA National Coastal Condition Assessment (current survey) NCCRs National Coastal Condition Reports NELAC National Environmental Laboratory Accreditation Conference NEP National Estuary Programs NERL U.S. EPA New England Regional Laboratory NHD National Hydrography Dataset NHEERL National Health and Environmental Effects Research Laboratory NIST National Institute of Standards and Technology NOAA National Oceanic and Atmospheric Administration NRCC National Research Council of Canada
Quality Assurance Project Plan for July 2010 National Coastal Condition Assessment Page xviii
NWQL National Water Quality Laboratory OARM Office of Administrative Resource Management ORD Office of Research and Development OST Office of Science and Technology OW Office of Water OWOW Office of Wetlands, Oceans and Watersheds PAHs Polycyclic Aromatic Hydrocarbons PAR Photosynthetically Active Radiation PBDE Polybrominated Diphenyl Ethers PCBs Polychlorinated biphenyl PE Performance Evaluation PFC Perfluorinated compound PPT parts per thousand PSU Practical Salinity Unit PTD Percent Taxonomic Disagreement QAPP Quality Assurance Project Plan QA/QC Quality Assurance/Quality Control qPCR quantitative Polymerase Chain Reaction R-EMAP Regional Environmental Monitoring and Assessment Program RSD Relative Standard Deviation SAS Statistical Analysis System SDTS Spatial Data Transfer Standard SQL Structure Query Language SRM Standard Reference Material STORET Storage and Retrieval Data Warehouse SWIMS Surface Water Information Management System TKN Total Kjeldahl Nitrogen TOC Total Organic Carbon TSA Technical Systems Audits US EPA United States Environmental Protection Agency USGS United Stated Geological Survey WED Western Ecology Division WQX Water Quality Exchange
Quality Assurance Project Plan for July 2010 National Coastal Condition Assessment Page xix
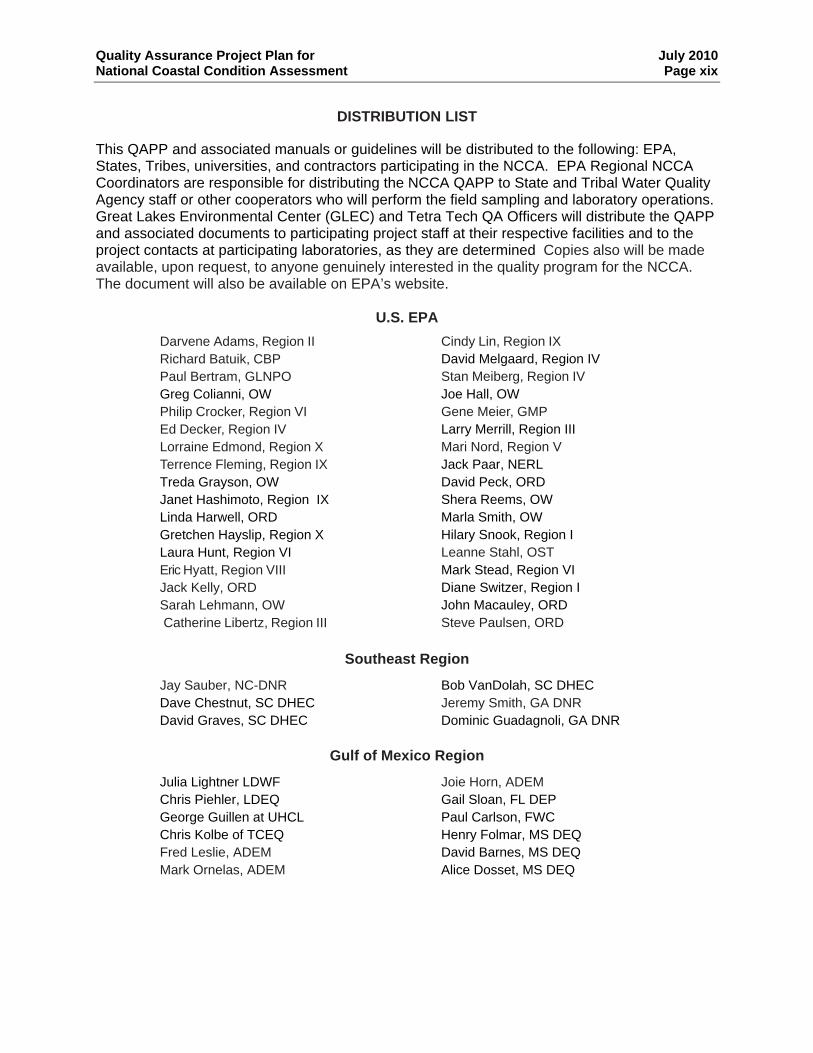
DISTRIBUTION LIST
This QAPP and associated manuals or guidelines will be distributed to the following: EPA, States, Tribes, universities, and contractors participating in the NCCA. EPA Regional NCCA Coordinators are responsible for distributing the NCCA QAPP to State and Tribal Water Quality Agency staff or other cooperators who will perform the field sampling and laboratory operations. Great Lakes Environmental Center (GLEC) and Tetra Tech QA Officers will distribute the QAPP and associated documents to participating project staff at their respective facilities and to the project contacts at participating laboratories, as they are determined Copies also will be made available, upon request, to anyone genuinely interested in the quality program for the NCCA. The document will also be available on EPA’s website.
U.S. EPA Darvene Adams, Region II Cindy Lin, Region IX Richard Batuik, CBP David Melgaard, Region IV Paul Bertram, GLNPO Stan Meiberg, Region IV Greg Colianni, OW Joe Hall, OW Philip Crocker, Region VI Gene Meier, GMP Ed Decker, Region IV Larry Merrill, Region III Lorraine Edmond, Region X Mari Nord, Region V Terrence Fleming, Region IX Jack Paar, NERL Treda Grayson, OW David Peck, ORD Janet Hashimoto, Region IX Shera Reems, OW Linda Harwell, ORD Marla Smith, OW Gretchen Hayslip, Region X Hilary Snook, Region I Laura Hunt, Region VI Leanne Stahl, OST Eric Hyatt, Region VIII Mark Stead, Region VI Jack Kelly, ORD Diane Switzer, Region I Sarah Lehmann, OW John Macauley, ORD Catherine Libertz, Region III Steve Paulsen, ORD
Southeast Region
Jay Sauber, NC-DNR Bob VanDolah, SC DHEC Dave Chestnut, SC DHEC Jeremy Smith, GA DNR David Graves, SC DHEC Dominic Guadagnoli, GA DNR
Gulf of Mexico Region
Julia Lightner LDWF Joie Horn, ADEM Chris Piehler, LDEQ Gail Sloan, FL DEP George Guillen at UHCL Paul Carlson, FWC Chris Kolbe of TCEQ Henry Folmar, MS DEQ Fred Leslie, ADEM David Barnes, MS DEQ Mark Ornelas, ADEM Alice Dosset, MS DEQ
Quality Assurance Project Plan for July 2010 National Coastal Condition Assessment Page xx
Northeast Region Christian Krahforst, MA-CZM Phil Trowbridge, NH-DES Christine Olsen, CT-DEP Charles deQuillfeldt, NYSDEC Bob Connell, NJ-DEP Ed Santoro, DRBC Bob Schuster, NJDEP Alan Everett, PA-DEP
Cathy Wazniak, MD-DNR Ben Anderson, DE-DNREC Rick Hoffman, VA-DEQ Mark Richards, VA-DEQ Don Smith, VA-DEQ Chris Deacutis, RI-DEM Dave Courtemanch, ME-DEP
West Region
Brian Anderson, UC Davis Larry Cooper, SCCWRP Rusty Fairey, MLML Cassandra Roberts, MLML Bruce Thompson, SFEI Steve Weisberg, SCCWRP Val Connor, SWRCB Karen Larsen, SWRCB Shelly Moore, SCCWRP Jay Davis, SFEI
Sarah Lowe, SFEI Greg Pettit, OR-DEQ Mark Bautista, OR-DEQ Aaron Borisenko, OR-DEQ Larry Caton, OR-DE Casey Clishe, WA-Dept. Ecol. Maggie Dutch, WA-Dept. Ecol. Ken Dzinbal, WA-Dept. Ecol. Valerie Partridge, WA-Dept. Ecol. Suzan Pool, WA-Dept. Ecol.
Great Lakes
Paul Anderson (OEPA) Brent Kuenzli (OEPA) Paul Garrison (WDNR) Joe Marencik (IEPA)
Dawn Roush (MDNRE) Bob Avery (MDNRE) Miel Barman (WDNR)
Hawaii Region
Robert Brock, Univ. HW
National Contractors
Jennifer Linder, Tetra Tech Michael T. Barbour, PhD, Tetra Tech John O’Donnell, Tetra Tech Chris Turner, GLEC Mailee Garton, GLEC Dennis J. McCauley, GLEC Phil Monaco, Dynamac Marlys Cappaert, Computer Sciences Corporation
Mike Arbaugh, Microbac Laboratories Laura Blake, The Cadmus Group Alex Long, IIRMES Rich Gossett, IIRMES Shanda McGraw, EcoAnalysts Gary Lester, EcoAnalysts Betsy Bicknell, ERG
Quality Assurance Project Plan for July 2010 National Coastal Condition Assessment Page 1 of 121
1. PROJECT PLANNING AND MANAGEMENT
1.1. Introduction
Several recent reports have identified the need for improved water quality monitoring and analysis at multiple scales. In 2000, the General Accounting Office (USGAO 2000) reported that EPA, states, and tribes collectively cannot make statistically valid inferences about water quality (via 305[b] reporting) and lack data to support key management decisions. In 2001, the National Research Council (NRC 2000) recommended EPA, states, and tribes promote a uniform, consistent approach to ambient monitoring and data collection to support core water quality programs. In 2002, the H. John Heinz III Center for Science, Economics, and the Environment (Heinz Center 2002) found there is inadequate data for national reporting on fresh water, coastal and ocean water quality indicators. The National Association of Public Administrators (NAPA 2002) stated that improved water quality monitoring is necessary to help states and tribes make more effective use of limited resources. EPA’s Report on the Environment 2003 (USEPA 2003) said that there is not sufficient information to provide a national answer, with confidence and scientific credibility, to the question, ‘What is the condition of U.S. waters and watersheds?’ In response to this need, the U.S. EPA Office of Water, in partnership with states and tribes, has begun a program to assess the condition of the nation’s waters via a statistically valid approach. The current survey, the NCCA, builds upon the previous NCA surveys including
→ National Coastal Assessment: Field Operations Manual (USEPA 2001B).
→ Coastal 2000 - Northeast Component: Field Operations Manual (Strobel 2000).
→ Environmental Monitoring and Assessment Program (http://www.epa.gov/emap/)
→ National Coastal Assessment Quality Assurance Project Plan 2001-2004 (USEPA 2001A).
→ National Coastal Condition Report III. (USEPA 2008)
→ National Coastal Condition Report II. (USEPA 2004A).
→ National Coastal Condition Report. (USEPA 2001C) 1).
The NCCA effort will provide important information to states and the public about the condition of the nation’s coastal and estuarine resource and key stressors on a national and regional scale. In 2000, the NCA initiated the first in a series of NCA Surveys. It was organized and managed by the U.S. EPA National Health and Environmental Effects Research Laboratory’s Gulf Ecology Division in Gulf Breeze, FL. Since then, the Oceans and Coastal Protection Division, Washington, D.C. has assumed the role of implementing and managing the assessment program under the NCCA, which is now part of the overall National Aquatic Resource Survey project. EPA developed this QAPP to guide the overall project and to support the states’ and tribes’ participating in the NCCA. The plan contains elements of the overall project management, data quality objectives, measurement and data acquisition, and information management for the
Quality Assurance Project Plan for July 2010 National Coastal Condition Assessment Page 2 of 121
NCCA. EPA recognizes that states and tribes may have added elements, such as supplemental indicators, that are not covered in the scope of this integrated QAPP. EPA expects that any supplemental elements are addressed by the states and tribes or their designee in a separate approved QAPP or an addendum to this QAPP. Through this survey, states and tribes have the opportunity to collect data which can be used to supplement their existing monitoring programs or to begin development of new programs. The goal of the NCCA is to address two key questions about the quality of the Nation’s coastal waters:
• What percent of the Nation’s coastal waters are in good, fair, and poor condition for key indicators of water quality, ecological health, and recreation?
• What is the relative importance of key stressors such as nutrients and pathogens? Indicators for the 2010 survey will basically remain the same as those used in the historic National Coastal Report, with a few modifications. The most prominent change in this year’s survey is the inclusion of coasts along the Great Lakes. Therefore both sample collection methods and laboratory methods will reflect freshwater and saltwater matrices. A NCCA workgroup comprised of EPA and State partners decided on a few improvements to the original indicators based on recommendations from a state workshop held in 2008. The additions are measuring enterococcus levels as a human health indicator; and requiring the measurement of photosynthetically active radiation (PAR) using instrumentation to help standardize and improve the accuracy of the water clarity indicator. Modifications include sediment toxicity testing using Eohaustorius or Leptochirus instead of Ampelisca sp. for saline sites and Hyalella for freshwater sites; and ecological fish tissue studies will be conducted using whole fish. Finally, fish community structure, Total Suspended Solids (TSS) in water column, and Polycyclic Aromatic Hydrocarbons (PAHs) in fish tissue will no longer be included. Other EPA programs are conducting special studies under the NCCA in the Great Lakes only: the Great Lakes Human Health Fish Tissue Study and the Great Lakes Embayment Enhancement Study. The Office of Science and Technology (OST) within OW is conducting the human health fish tissue study in the Great Lakes in partnership with the Great Lakes National Program Office. A brief description of the study is provided in Section 5.5.1. ORD’s National Health and Ecological Effects Research Laboratory in Duluth, MN is conducting the enhanced assessment of Great Lakes embayments. This study adds additional sites to the overall selection of sites within the Great Lakes, but is otherwise following procedures as outlined in the QAPP and other NCCA documents. See section 1.3 on study design for more information.
1.2. National Coastal Condition Assessment Project Organization
The U.S. EPA’s NCCA is managed through the EPA’s Office of Water, Office of Wetlands, Oceans and Watersheds (OWOW), and the director of Oceans and Coastal Protection Division (OCPD). Planning and implementation of the NCCA is the responsibility of the NCCA Survey Team which is made up of representatives from the Office of Water, EPA-ORD, EPA-Region Offices, and officials from state organizations.
Quality Assurance Project Plan for July 2010 National Coastal Condition Assessment Page 3 of 121
U.S. coastal resources will be organized into six geographical components for reporting purposes based on past NCA reports. These are: West Region CA, OR, and WA Northeast Region ME, NH, MA, RI, CT, NY, NJ, DE, MD, PA and VA Southeast Region NC, SC, Atlantic coast of FL and GA Gulf of Mexico Region Gulf portion of FL, AL, MS, LA, and TX Hawaii Region HI Great Lakes IL, IN, MI, MN, OH, NY, PA,WI The responsibilities and accountability of the various principals and cooperators are described here and illustrated in Figure 1-1. The overall coordination of the project will be done by EPA's Office of Water (OW) in Washington, DC, with support from the Western Ecological Division (WED) of the Office of Research and Development (ORD) in Corvallis, Oregon and the Gulf Ecology Division (GED) of ORD in Gulf Breeze, Florida. Each EPA Regional Office has identified a Regional EPA Coordinator who is part of the EPA team providing a critical link with state and tribal partners. Cooperators will work with their Regional EPA Coordinator to address any technical issues. A comprehensive quality assurance (QA) program has been established to ensure data integrity and provide support for the reliable interpretation of the findings from this project. Technical Expert Workgroups will be convened to decide on the best and most appropriate approaches for key technical issues, such as: (1) the selection and establishment of thresholds for characterizing ecological condition; (2) selection and calibration of ecological endpoints and attributes of the biota and their relationship to stressor indicators; (3) a data analysis plan for interpreting the data and (4) a framework for the reporting of the condition assessment and conveying the information on the ecological status of the Nation’s coasts. For select indicators, an indicator lead may also be appointed (e.g., fish tissue) Contractor support is provided for all aspects of this project. Contractors will provide support ranging from implementing the survey, sampling and laboratory processing, data management, data analysis, and report writing. Cooperators will interact with their Regional EPA Coordinator and the EPA Project Leads regarding contractual services. The primary responsibilities of the principals and cooperators are as follows: EPA Project Leader (Lead) - Gregory Colianni
Provides overall coordination of the project and makes decisions regarding the proper functioning of all aspects of the project; and
Makes assignments and delegates authority, as needed, to other parts of the project organization.
Alternate EPA Project Leaders- Treda Grayson, John Macauley
Assists EPA Project Leader with coordination and assumes responsibility for certain aspects of the project, as agreed upon with the EPA Project Leader;
Serves as primary point-of-contact for project coordination in the absence or unavailability of EPA Project Leader; and
Serves on the Technical Experts Workgroup and interacts with Project Leader on technical, logistical, and organizational issues on a regular basis.
Quality Assurance Project Plan for July 2010 National Coastal Condition Assessment Page 4 of 121
Regional EPA Coordinators (see list below)
Assists EPA Project Leads with regional coordination activities; Serves on the Technical Experts Workgroup and interacts with Project Leads on
technical, logistical, and organizational issues on a regular basis; and Serves as primary point-of-contact for the Cooperators.
Technical Experts Workgroup(s) - States, EPA, academics, other federal agencies
Provides expert consultation on key technical issues as identified by the EPA Coordination team and works with Project Leads to resolve approaches and strategies to enable data analysis and interpretation to be scientifically valid.
Logistical Oversight: GLEC – Dennis McCauley
Functions to support implementation of the project based on technical guidance established by the EPA Project Leads;
Primary responsibility is to ensure all aspects of the project, i.e., technical, logistical, organizational, etc., are operating as smoothly as possible; and
Serves as point-of-contact for questions from field crews and cooperators for all activities.
Cooperator(s)
Under the scope of their assistance agreements, plans and executes their individual studies as part of the cross jurisdictional NCCA, and adheres to all QA requirements and standard operating procedures (SOPs); and
Interacts with the Grant Coordinator and Project Leads regarding technical, logistical, and organizational issues.
Field Sampling Crew Leader (as established for each cooperator or contractor crew)
Functions as the senior member of each Cooperator’s field sampling crew and the point of contact for the Field Logistics Coordinator; and
Responsible for overseeing all activities of the field sampling crew and ensuring that the Project field method protocols are followed during all sampling activities.
Sample Kit Coordinator - Mailee Garton, GLEC
Functions to support field crews by providing initial base kits to each crew and sampling kits, upon request, throughout the field season.
Field Logistics Coordinators: Jennifer Pitt, Tetra Tech and Chris Turner, GLEC
Functions to support implementation of the project based on technical guidance established by the EPA Project Leads;
Serves as point-of-contact for questions from field crews and cooperators for all activities; and
Tracks progress of field sampling activities.
Quality Assurance Project Plan for July 2010 National Coastal Condition Assessment Page 5 of 121
Information Management Coordinator – Marlys Cappaert, CSC
Functions to support implementation of the project based on technical guidance established by the EPA Project Leader and Alternate EPA Project Leader;
Oversees all sample shipments and receives data forms from the Cooperators; and Oversees all aspects of data entry and data management for the project.
EPA QA Officer – Shera Reems
Functions as the primary officer overseeing all QA and quality control (QC) activities; and
Responsible for ensuring that the QA program is implemented thoroughly and adequately to document the performance of all activities.
EPA QA Project Officer(s) – Joe Hall
Oversees the transfer of samples and related records for each indicator; Ensures the validity of data for each indicator; Oversee(s) individual studies of cooperators (assistance recipients); Interacts with EPA Project Leader and Alternate EPA Project Leader on issues related to
sampling design, project plan, and schedules for conduct of activities; Collects copies of all official field forms, field evaluation checklists and reports; and Oversees and maintains records on field evaluation visits, but is not a part of any one
sampling team. QA Audit Coordinator - Marla Smith, EPA
The EPA employee who will supervise the implementation of the QA audit program; and Directs the field and laboratory audits and ensures the field and lab auditors are
adequately trained to correct errors immediately to avoid erroneous data and the eventual discarding of information from the assessment.
Human Health Fish Tissue Indicator Lead – Leanne Stahl, EPA
The EPA Employee who will coordinate implementation of the human health fish tissue effort on the Great Lakes;
Interacts with the EPA Project Leads, EPA regional coordinators, contractors and cooperators to provide information and respond to questions related to the human health fish tissue indicator; and
Responsible for lab analysis phase of the project. Great Lakes Embayment Enhancement Coordinator – Jack Kelly, EPA
The EPA Employee who will coordinate the embayment enhancement component of the Great Lakes NCCA; and
Interacts with the EPA Project Leads, EPA regional coordinators, contractors and cooperators to provide information and respond to questions related to embayment enhancement effort.
Quality Assurance Project Plan for July 2010 National Coastal Condition Assessment Page 6 of 121
Great Lakes Environmental Center QA Officer – Jennifer Hansen
The contractor QA Officer who will supervise the implementation of the QA program.
Tetra Tech QA Officer – John O’Donnell
Provides support to the GLEC QA Officer in carrying out the QC checks and documenting the quality of the activities and adherence to specified procedures.
Dynamac c/o US EPA
Oversees analysis of nutrients, grain size and total organic carbon (TOC) samples; and Ensures the validity of data for each indicator.
NERL- US EPA New England Lab
Oversees analysis of enterococcus samples. Ensures the validity of data for each indicator.
Tetra Tech Laboratory
Provides analytical support for some sediment toxicity samples; and Ensures the validity of data for each indicator.
GLEC Laboratory
Provides analytical support for some sediment toxicity samples; and Ensures the validity of data for each indicator.
Cadmus
Subcontracts analysis of benthic macroinvertebrate samples and metals and organic chemistry on both eco-fish and sediment samples; and
Ensures the validity of data for each indicator. IIRMES
Provides analytical support for sediment and fish tissue chemistry samples; and Ensures the validity of data for each indicator.
Eco Analysts
Oversees analysis of macroinvertebrates; and Ensures the validity of data for each indicator.
ERG
• Conducts field and laboratory audits as directed by EPA. Microbac Laboratories Acts as a holding facility for human health fish tissue samples.
Quality Assurance Project Plan for July 2010 National Coastal Condition Assessment Page 7 of 121
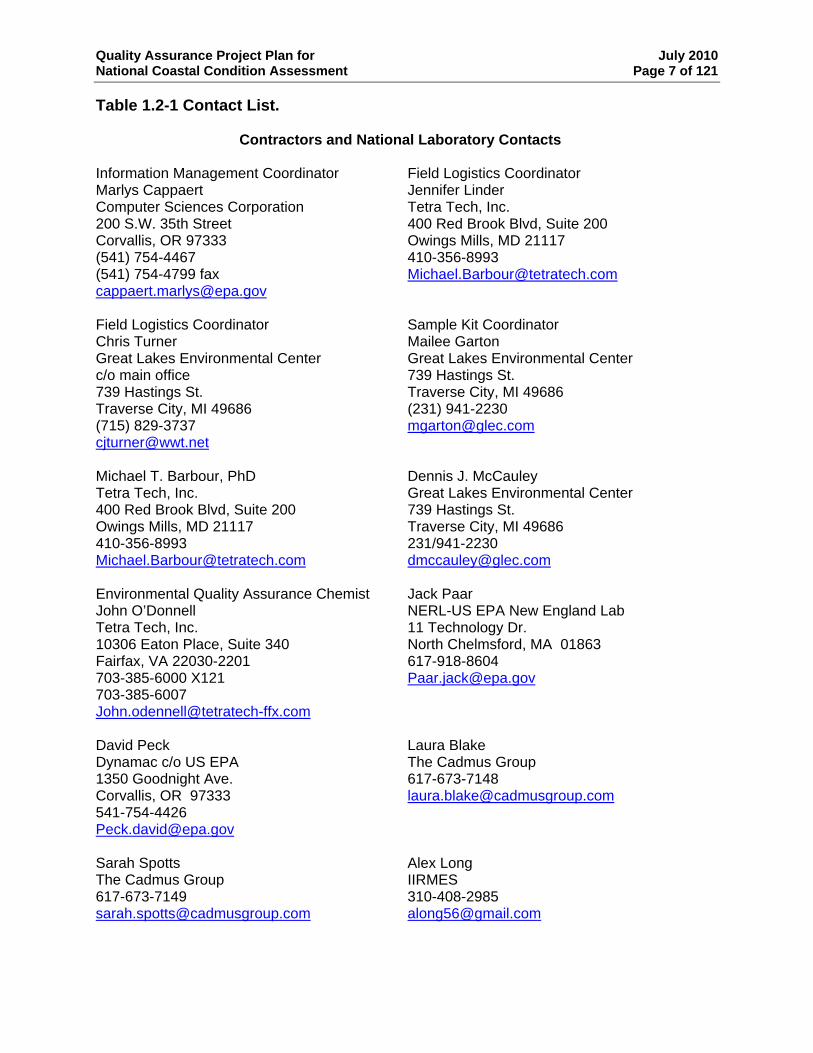
Table 1.2-1 Contact List.
Contractors and National Laboratory Contacts
Information Management Coordinator Field Logistics Coordinator Marlys Cappaert Jennifer Linder Computer Sciences Corporation Tetra Tech, Inc. 200 S.W. 35th Street 400 Red Brook Blvd, Suite 200 Corvallis, OR 97333 Owings Mills, MD 21117 (541) 754-4467 410-356-8993 (541) 754-4799 fax [email protected]
[email protected] Field Logistics Coordinator Sample Kit Coordinator Chris Turner Mailee Garton Great Lakes Environmental Center Great Lakes Environmental Center c/o main office 739 Hastings St. 739 Hastings St. Traverse City, MI 49686 Traverse City, MI 49686 (231) 941-2230 (715) 829-3737 [email protected]
[email protected] Michael T. Barbour, PhD Dennis J. McCauley Tetra Tech, Inc. Great Lakes Environmental Center 400 Red Brook Blvd, Suite 200 739 Hastings St. Owings Mills, MD 21117 Traverse City, MI 49686 410-356-8993 231/941-2230 [email protected] [email protected]
Environmental Quality Assurance Chemist Jack Paar John O’Donnell NERL-US EPA New England Lab Tetra Tech, Inc. 11 Technology Dr. 10306 Eaton Place, Suite 340 North Chelmsford, MA 01863 Fairfax, VA 22030-2201 617-918-8604 703-385-6000 X121 [email protected] 703-385-6007 [email protected] David Peck Laura Blake Dynamac c/o US EPA The Cadmus Group 1350 Goodnight Ave. 617-673-7148 Corvallis, OR 97333 [email protected] 541-754-4426 [email protected] Sarah Spotts Alex Long The Cadmus Group IIRMES 617-673-7149 310-408-2985 [email protected] [email protected]
Quality Assurance Project Plan for July 2010 National Coastal Condition Assessment Page 8 of 121
Rich Gossett Shanda McGraw IIRMES – Micro 108 EcoAnalysts CSULB Receiving Dept 1420 S. Blaine Street, Suite 14 1250 Bellflower Blvd Moscow, ID 83843 Long Beach, CA 90840 208-882-2588, ext. 30 310-420-4964 [email protected] [email protected] or [email protected] Gary Lester Mike Arbaugh EcoAnalysts Microbac Laboratories 208-882-2588, ext. 21 Gascoyne Division [email protected] 2101 Van Deman Street Baltimore, MD 21224
401-633-1800 Betsy Bicknell Eastern Research Group 703-633-1612 [email protected]
US EPA Headquarters/Office of Research and Development
Greg Colianni Treda Grayson USEPA Office of Water USEPA Office of Water Office of Wetlands, Oceans and Watersheds Office of Wetlands, Oceans and Watersheds 1200 Pennsylvania Avenue, NW (4503T) 1200 Pennsylvania Avenue, NW (4503T) Washington, D.C. 20460-0001 Washington DC 20460 (202) 566-1249 (202) 566-0916 [email protected] [email protected]
Joe Hall Linda Harwell USEPA Headquarters USEPA Office of Research & Ariel Rios Building Development/NHEERL/GED 1200 Pennsylvania Avenue, N. W. 1 Sabine Island Drive Washington, DC 20460 Gulf Breeze FL 32561 202-566-1241 850-934-2464 [email protected] [email protected] Sarah Lehmann John Maccauley, USEPA Office of Wetlands, Oceans and USEPA Office of Research & Watersheds Development/NHEERL/GED 1200 Pennsylvania Avenue, NW (4503T) 1 Sabine Island Drive Washington DC 20460 Gulf Breeze FL 32561 202-566-1379 850-934-9353 [email protected] macauley.john @epa.gov
Quality Assurance Project Plan for July 2010 National Coastal Condition Assessment Page 9 of 121
Steven G. Paulsen, Ph.D. Aquatic Monitoring and Assessment Branch Western Ecology Division, NHEERL, ORD, EPA 200 S.W. 35th St. Corvallis, OR 97330 541-754-4428 [email protected]
Shera Reems USEPA Headquarters Ariel Rios Building 1200 Pennsylvania Avenue, N. W. Washington, DC 20460 202-566-1264 [email protected]
Marla Smith USEPA Headquarters Ariel Rios Building 1200 Pennsylvania Avenue, N. W. Washington, DC 20460 202-566-1047 [email protected]
Leanne Stahl USEPA Office of Science and Technology 1200 Pennsylvania Avenue, N. W. (4305T) Washington, DC 20460 202-566-0404 [email protected]
U.S. EPA Regional Coordinators
USEPA Region 1 Tom Faber USEPA Region 1 – New England Regional Laboratory 11 Technology Drive North Chelmsford, MA 01863-2431 (617) 918-8672 [email protected]
USEPA Region 1 – New England Regional Laboratory Diane Switzer 11 Technology Drive North Chelmsford, MA 01863-2431 617-918-8377 [email protected]
USEPA Region 2 Darvene Adams USEPA Facilities Raritan Depot 2890 Woodbridge Avenue Edison, NJ 08837-3679 (732) 321-6700 [email protected]
USEPA Region 3 Larry Merrill USEPA Region 3 1650 Arch Street Philadelphia, PA 19103-2029 (215) 814-5452 [email protected]
USEPA Region 3 Jack Kelly 1650 Arch Street Philadelphia, PA 19103-2029 215-814-3112 [email protected]
USEPA Region 4 Bonita Johnson USEPA Region 4 61 Forsyth Street, S.W. Atlanta, GA 30303-8960 (404) 562-9388 [email protected]
Quality Assurance Project Plan for July 2010 National Coastal Condition Assessment Page 10 of 121
USEPA Region 4 David Melgaard 61 Forsyth Street, S.W. Atlanta, GA 30303-8960 404-562-9265 [email protected]
USEPA Region 5 Mari Nord USEPA Region 5 77 West Jackson Boulevard Chicago, IL 60604-3507 (312) 886-3017 [email protected]
USEPA Region 6 Linda Hunt USEPA Region 6 1445 Ross Avenue Suite 1200 Dallas, TX 75202-2733 (214)-665-9729 [email protected]
USEPA Region 6 Mark Stead 1445 Ross Avenue Suite 1200 Dallas, TX 75202-2733 (214) 665-2271 [email protected]
USEPA Region 9 Janet Hashimoto 75 Hawthorne Street San Francisco, CA 94105 (415) 972-3452 [email protected]
USEPA Region 10 Gretchen Hayslip 1200 Sixth Avenue Seattle, WA 98101 (206) 553-1685 [email protected]
Quality Assurance Project Plan for July 2010 National Coastal Condition Assessment Page 11 of 121
Figure 1.1 NCCA Project Organizaion.
Quality Assurance Project Plan for July 2010 National Coastal Condition Assessment Page 12 of 121
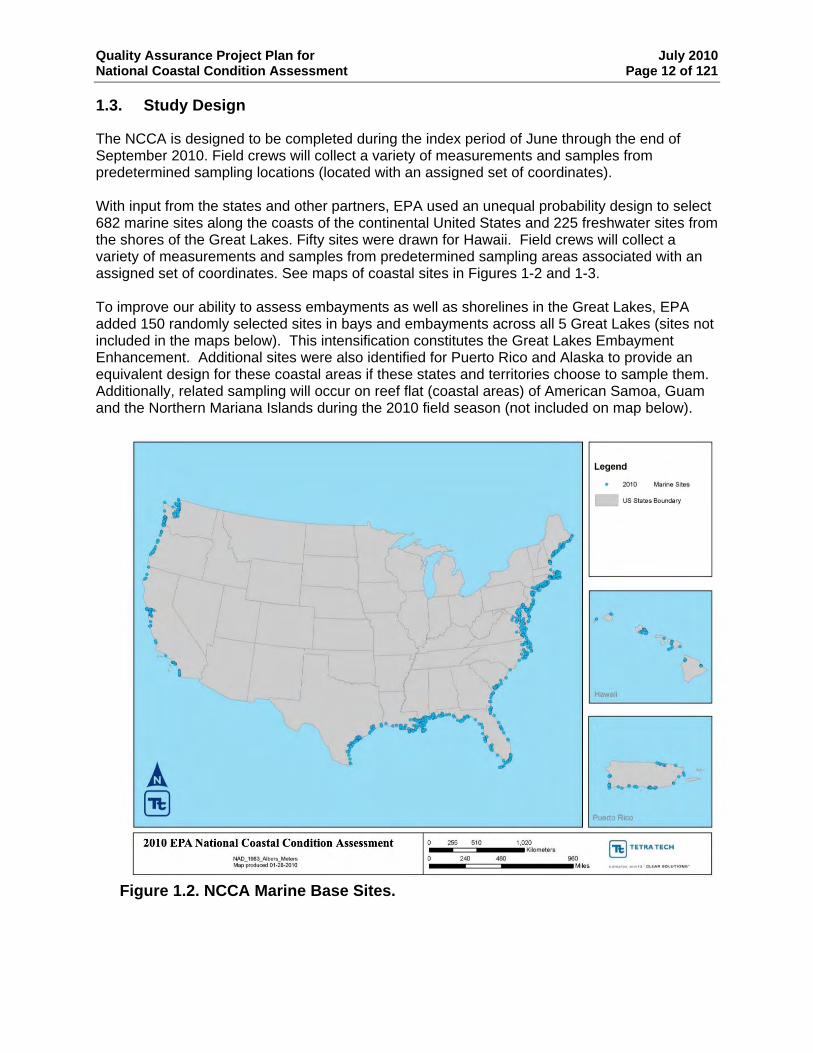
1.3. Study Design
The NCCA is designed to be completed during the index period of June through the end of September 2010. Field crews will collect a variety of measurements and samples from predetermined sampling locations (located with an assigned set of coordinates). With input from the states and other partners, EPA used an unequal probability design to select 682 marine sites along the coasts of the continental United States and 225 freshwater sites from the shores of the Great Lakes. Fifty sites were drawn for Hawaii. Field crews will collect a variety of measurements and samples from predetermined sampling areas associated with an assigned set of coordinates. See maps of coastal sites in Figures 1-2 and 1-3. To improve our ability to assess embayments as well as shorelines in the Great Lakes, EPA added 150 randomly selected sites in bays and embayments across all 5 Great Lakes (sites not included in the maps below). This intensification constitutes the Great Lakes Embayment Enhancement. Additional sites were also identified for Puerto Rico and Alaska to provide an equivalent design for these coastal areas if these states and territories choose to sample them. Additionally, related sampling will occur on reef flat (coastal areas) of American Samoa, Guam and the Northern Mariana Islands during the 2010 field season (not included on map below).
Figure 1.2. NCCA Marine Base Sites.
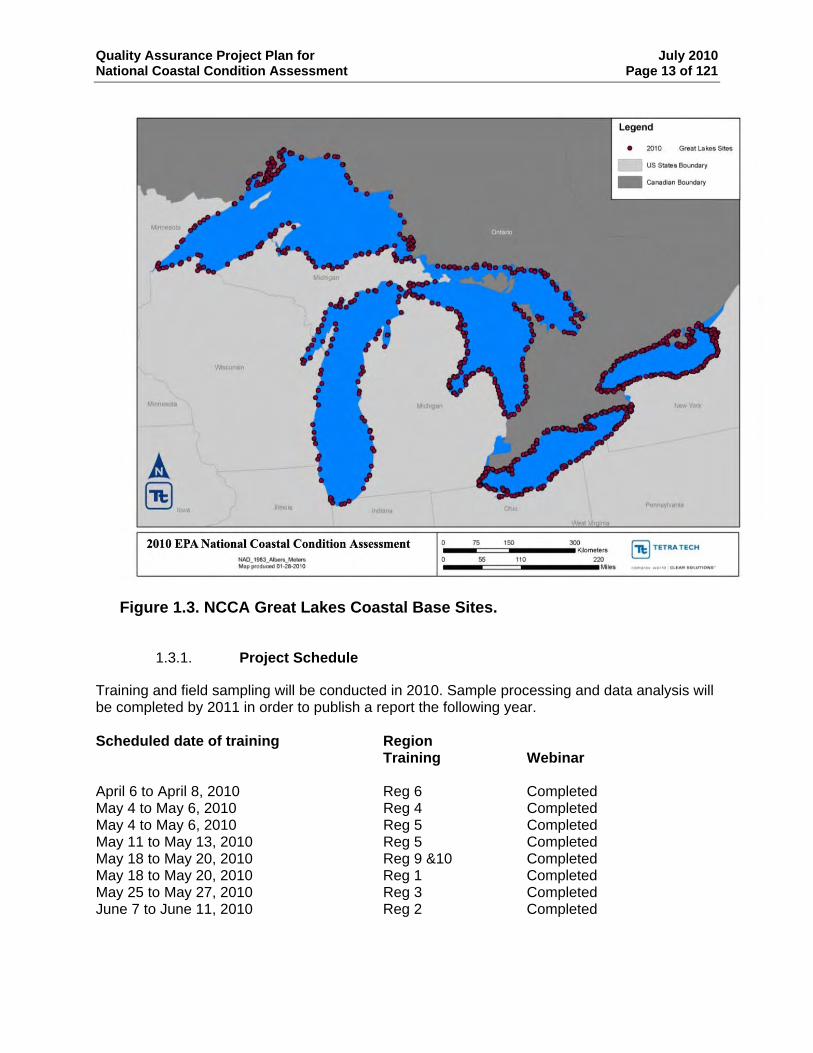
Quality Assurance Project Plan for July 2010 National Coastal Condition Assessment Page 13 of 121
Figure 1.3. NCCA Great Lakes Coastal Base Sites.
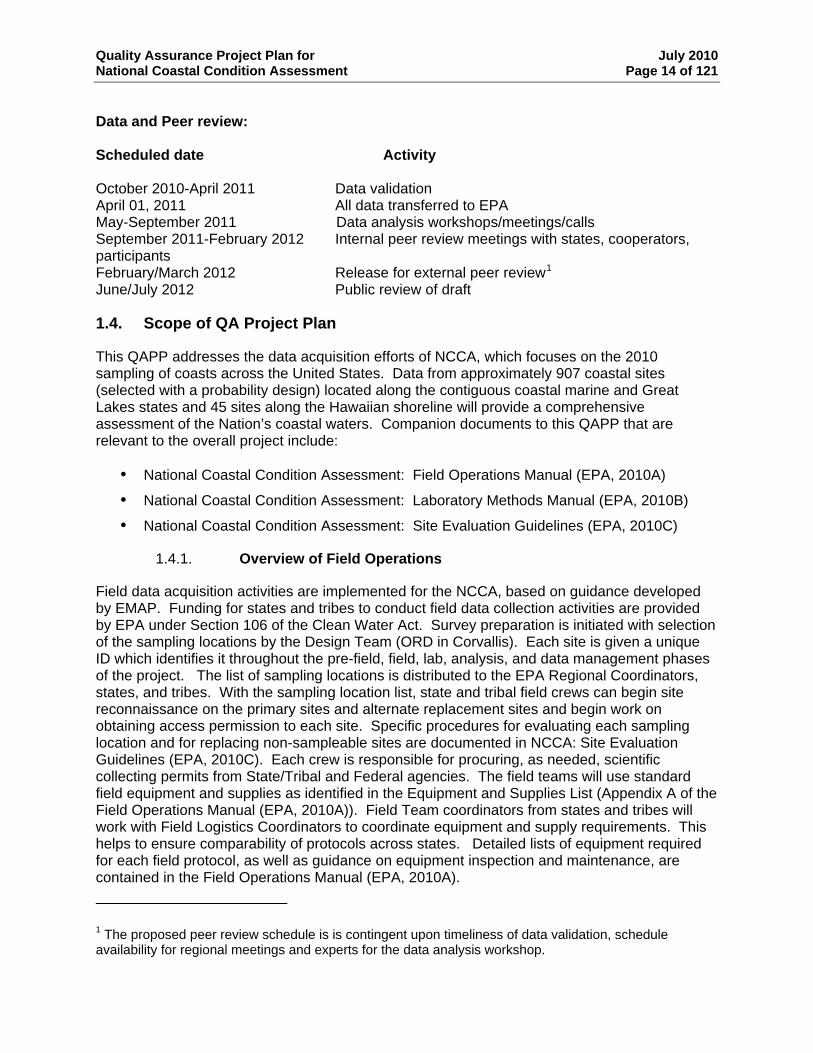
1.3.1. Project Schedule
Training and field sampling will be conducted in 2010. Sample processing and data analysis will be completed by 2011 in order to publish a report the following year.
Scheduled date of training Region Training
Webinar
April 6 to April 8, 2010 Reg 6 Completed May 4 to May 6, 2010 Reg 4 Completed May 4 to May 6, 2010 Reg 5 Completed May 11 to May 13, 2010 Reg 5 Completed May 18 to May 20, 2010 Reg 9 &10 Completed May 18 to May 20, 2010 Reg 1 Completed May 25 to May 27, 2010 Reg 3 Completed June 7 to June 11, 2010 Reg 2 Completed
Quality Assurance Project Plan for July 2010 National Coastal Condition Assessment Page 14 of 121
Data and Peer review: Scheduled date Activity October 2010-April 2011 Data validation April 01, 2011 All data transferred to EPA May-September 2011 Data analysis workshops/meetings/calls September 2011-February 2012 Internal peer review meetings with states, cooperators, participants February/March 2012 Release for external peer review1 June/July 2012 Public review of draft
1.4. Scope of QA Project Plan
This QAPP addresses the data acquisition efforts of NCCA, which focuses on the 2010 sampling of coasts across the United States. Data from approximately 907 coastal sites (selected with a probability design) located along the contiguous coastal marine and Great Lakes states and 45 sites along the Hawaiian shoreline will provide a comprehensive assessment of the Nation’s coastal waters. Companion documents to this QAPP that are relevant to the overall project include:
National Coastal Condition Assessment: Field Operations Manual (EPA, 2010A)
National Coastal Condition Assessment: Laboratory Methods Manual (EPA, 2010B)
National Coastal Condition Assessment: Site Evaluation Guidelines (EPA, 2010C)
1.4.1. Overview of Field Operations
Field data acquisition activities are implemented for the NCCA, based on guidance developed by EMAP. Funding for states and tribes to conduct field data collection activities are provided by EPA under Section 106 of the Clean Water Act. Survey preparation is initiated with selection of the sampling locations by the Design Team (ORD in Corvallis). Each site is given a unique ID which identifies it throughout the pre-field, field, lab, analysis, and data management phases of the project. The list of sampling locations is distributed to the EPA Regional Coordinators, states, and tribes. With the sampling location list, state and tribal field crews can begin site reconnaissance on the primary sites and alternate replacement sites and begin work on obtaining access permission to each site. Specific procedures for evaluating each sampling location and for replacing non-sampleable sites are documented in NCCA: Site Evaluation Guidelines (EPA, 2010C). Each crew is responsible for procuring, as needed, scientific collecting permits from State/Tribal and Federal agencies. The field teams will use standard field equipment and supplies as identified in the Equipment and Supplies List (Appendix A of the Field Operations Manual (EPA, 2010A)). Field Team coordinators from states and tribes will work with Field Logistics Coordinators to coordinate equipment and supply requirements. This helps to ensure comparability of protocols across states. Detailed lists of equipment required for each field protocol, as well as guidance on equipment inspection and maintenance, are contained in the Field Operations Manual (EPA, 2010A).
1 The proposed peer review schedule is is contingent upon timeliness of data validation, schedule availability for regional meetings and experts for the data analysis workshop.
Quality Assurance Project Plan for July 2010 National Coastal Condition Assessment Page 15 of 121
Field measurements and samples are collected by trained teams. The field team leaders must be trained at an EPA-sponsored training session. Ideally, all members of each field team should attend one EPA-sponsored training session before the field season in their state or tribal jurisdiction. Field sampling audits or evaluation visits will be completed for each field team. The training program stresses hands-on practice of methods, consistency among crews, collection of high quality data and samples, and safety. Training documentation will be maintained by the Project QA Officers. For each site, crews prepare a dossier that contains the following applicable information: road maps, copies of written access permissions to boat launches, scientific collection permits, coordinates of the coastal site, information brochures on the program for interested parties, and local area emergency numbers. Whenever possible, field team leaders attempt to contact owners of private marinas or boat launches (as appropriate) approximately two days before the planned sampling date. As the design requires repeat visits to select sampling locations, it is important for the field teams to do everything possible to maintain good relationships with launch owners. This includes prior contacts, respect of special requests, closing gates, minimal site disturbance, and removal of all materials, including trash, associated with the sampling visit. The site verification process is shown in Figure 1-4. Upon arrival at a site, the location is verified by a Global Positioning System (GPS) receiver, landmark references, and/or local residents. Samples and measurements for various parameters are collected in a specified order (See Section 2.1, Figures 2-1 through 2-3, of Field Operations Manual (EPA, 2010A)). This order has been set up to minimize the impact of sampling for one parameter upon subsequent parameters. All methods are fully documented in step-by-step procedures in the NCCA Field Operations Manual (EPA, 2010A). The manual also contains detailed instructions for completing documentation, labeling samples, any field processing requirements, and sample storage and shipping. Field communications will be through Field Logistics Coordinators (see Table 1.2.1), and may involve regularly scheduled conference calls or contacts. Standardized field data forms (see Appendix B, NCCA Field Operations Manual (EPA, 2010A)) are the primary means of data recording. On completion, the data forms are reviewed by a person other than the person who initially entered the information. Prior to departure from the field site, the field team leader reviews all forms and labels for completeness and legibility and ensures that all samples are properly labeled and packed. Upon return from field sampling to the office, completed data forms are sent to the Information Management Coordinator in Corvallis, Oregon for entry into a computerized data base. Forms are to be sent within 2 weeks of sample collection. The Information Management Coordinator will ensure that electronic data files are reviewed independently to verify that values are consistent with those recorded on the field data form or original field data file. Samples are stored or packaged for shipment in accordance with instructions contained in the Field Operations Manual (EPA, 2010A). Precautions are taken so holding times are not exceeded. Samples which must be shipped are delivered to a commercial carrier; copies of bills of lading or other documentation are maintained by the team. The Information Management Coordinator is notified to track the sample shipment; thus, tracing procedures can be initiated quickly in the event samples are not received. Chain-of-custody forms are completed for all transfers of samples, with copies maintained by the field team.
Quality Assurance Project Plan for July 2010 National Coastal Condition Assessment Page 16 of 121
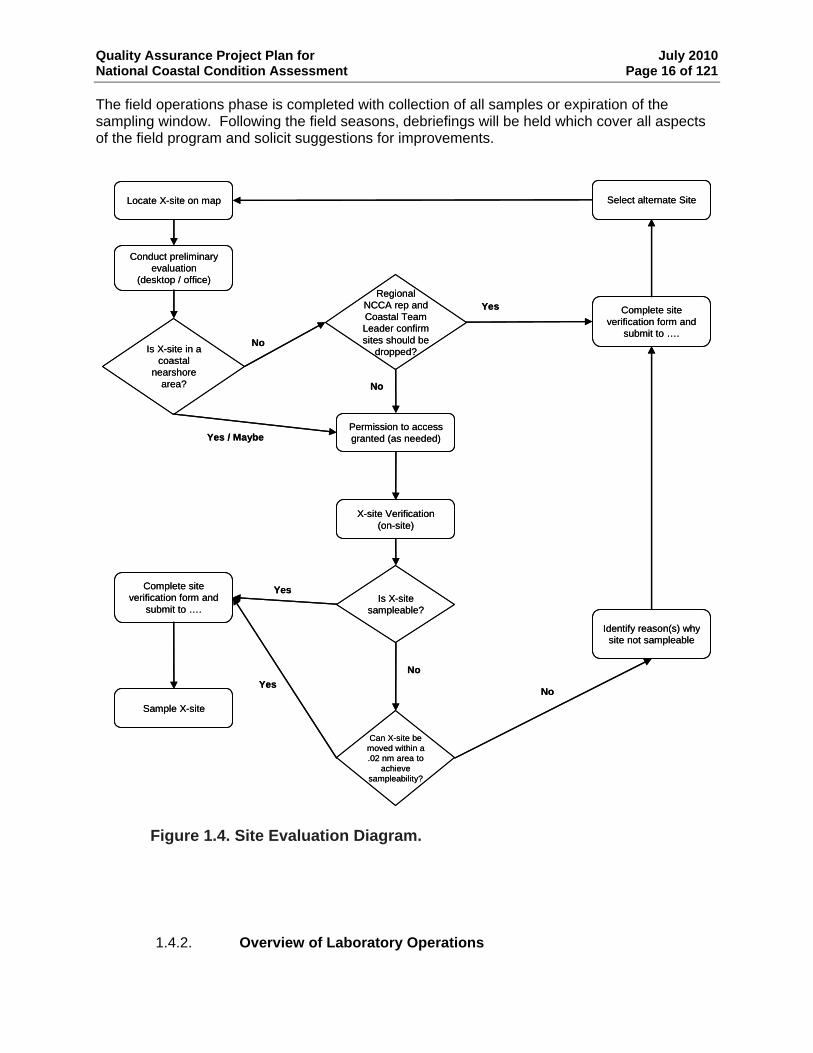
The field operations phase is completed with collection of all samples or expiration of the sampling window. Following the field seasons, debriefings will be held which cover all aspects of the field program and solicit suggestions for improvements.
Locate X-site on mapLocate X-site on map
Permission to access granted (as needed)
Sample X-site
X-site Verification(on-site)
Select alternate Site
Identify reason(s) why site not sampleable
Is X-site sampleable?
Yes
Conduct preliminary evaluation
(desktop / office)
Conduct preliminary evaluation
(desktop / office)
IsIs X X--sitesite in in a a ccoasoasttaall
nearsnearshhoorreeareaarea??
NoNo
YeYess / / MMaayybbee
No
Can X-site be moved within a .02 nm area to
achieve sampleability?
YesNo
YeYessRRegiegioonnalal
NNCCCCA rA rep ep and and CCooaassttaall Team Team LeLeaader cder confonfiirrmm ssiitteess s shouhoulld d be be
dropdroppeped?d?
No
Complete site verification form and
submit to ….
Complete site verification form and
submit to ….
Permission to access granted (as needed)
Sample X-site
X-site Verification(on-site)
Select alternate Site
Identify reason(s) why site not sampleable
Is X-site sampleable?
Yes
No
Can X-site be moved within a .02 nm area to
achieve sampleability?
YesNo
No
Complete site verification form and
submit to ….
Complete site verification form and
submit to ….
Figure 1.4. Site Evaluation Diagram.
1.4.2. Overview of Laboratory Operations
Quality Assurance Project Plan for July 2010 National Coastal Condition Assessment Page 17 of 121
National Laboratories:
Because some states may not be adequately equipped and staffed to conduct certain highly specialized analyses related to several of the core NCCA indicators, and/or the cost to contact analyses for a limited number of samples may be prohibitive, the U.S. EPA will designate several “National Laboratories” to conduct these analyses for any state which so elects, at a nominal cost per sample. This approach would also ensure data uniformity between the participating states. National Laboratories have been selected for the following core activities:
analytical chemistry (organic and metal contaminants in both sediment and fish tissue
matrices);
benthic community structure;
nutrient analyses;
sediment toxicity testing; and
pathogen indicators.
The designated National Laboratories must comply with the QA/QC requirements described in this document. In-State Laboratory Analyses: For any analyses other than those conducted through the above National Laboratories, each of the states participating in NCCA will be responsible for the arrangements to analyze the field samples that they collect. These agreements will be negotiated by the individual states, not through the EPA. Some analyses may be conducted in-house by state agency laboratories or universities, while others are contracted out to private laboratories or other states. However, any laboratory selected to conduct analyses with NCCA samples must demonstrate that they can meet the quality standards presented in this QAPP and the NCCA Laboratory Methods Manual (EPA, 2010B) and NCCA Field Operations Manual (EPA, 2010A). Later sections will address initial demonstrations of technical capability and performance evaluations. All laboratories providing analytical support to NCCA must adhere to the provisions of this integrated QAPP. Laboratories will provide information documenting their ability to conduct the analyses with the required level of data quality before analyses begin. The documentation will be sent to Joe Hall at EPA Headquarters. Such information might include results from interlaboratory comparison studies, analysis of performance evaluation samples, control charts and results of internal QC sample or internal reference sample analyses to document achieved precision, bias, accuracy, and method detection limits. Contracted laboratories will be required to provide copies of their Data Management Plan. Laboratory operations may be evaluated by technical systems audits, performance evaluation studies, and by participation in interlaboratory sample exchange. All analytical laboratories should follow best laboratory practices.
In the performance-based QA approach for analytical chemistry, no set method is required of the laboratory as long as the laboratory continues to meet the quality standards of the program. Samples should be processed and analyzed as designated batches consisting of 25 or less samples and each batch will include prescribed QC samples (e.g., reagent blanks, matrix spikes and matrix spike duplicates, and standard reference materials (SRMs)). These
Quality Assurance Project Plan for July 2010 National Coastal Condition Assessment Page 18 of 121
QC samples represent the basic elements that provide estimates of accuracy and precision for the analyses of chemical contaminants. The overall analytical process involves several additional QC- related components or checks (e.g., calibration curves, use of internal standards, and control charts). When these QC checks are embedded in each batch, the analyst should be able to quickly assess the overall data quality on a per batch basis and take corrective measures if there are deficiencies. If data for a class of compounds consistently fails any of the NCCA quality standards, the laboratory management must notify the State QA Coordinator of the problem and seek recommended corrective actions prior to submitting the final data report. As noted above, before a laboratory is authorized to analyze actual field collected samples, the lab must provide documentation to demonstrate its technical capability to perform at the level required by NCCA. Laboratories that have successfully participated in a program such as the NIST/NRCC/ NOAA/EPA Intercomparison Exercises in the last 5 years may submit their recent results to Joe Hall, the NCCA QA Project Manager, for evaluation. For labs that have not undertaken this exercise, the following steps may be required. Labs should calculate and submit method detection limits (MDLs) for each analyte of interest for the each matrix which they plan to analyze. Each laboratory is required to follow the procedure specified in 40 CFR Part 136 (Federal Register, Oct. 28, 1984) to calculate MDLs for each analytical method employed. To indicate the level of detection required, target MDLs have been established (Section 5.3, Table 5.3-2 and Section 5.5, Table 5.5-10) and the MDLs reported by candidate laboratories should be equal to or less than the target values. It is important that a laboratory establishes, up front, its capability to generally meet the MDL requirements; this is a key factor that must be established before proceeding further with the performance evaluation (PE). Once the MDL requirements are met for an analyte class and matrix type, the laboratory may be issued a PE sample to analyze. The PE sample will be provided by the NCCA team or contractors. When available, SRMs or Certified Reference Material (CRMs) should be used in these exercises. The basic quality criteria for these PE exercise are that the laboratory results generally meet accuracy goals set by NCCA. For the organic analysis, the general goal for accuracy is laboratory agreement within ± 35% of the certified or “true value” for the analytes of interest; for inorganic analysis, laboratory agreement within ± 20% of the accepted true value. These requirements apply only to those analytes with certified values ≥10 times the laboratory’s calculated MDL. The participating laboratory will submit the results of their completed PE exercises to the the NCCA QA Project Manager, Joe Hall, to be evaluated. Below is a brief summary of the NCCA laboratory indicators: laboratory must meet the minimum quality criteria set forth. See Sections 2 and 5 for a full discussion of the quality criteria that govern these analytical chemistry procedures in addition to the NCCA Lab Operations manual. Water Quality Indicators Conditions of water quality will be evaluated for each NCCA site through the analyses of indicators of anthropogenic enrichment, including nutrient levels, chlorophyll a content, phytoplankton community and pathogen indicator. Samples for these indicators will be obtained by using both filtered and unfiltered site water. Field crews will retain the material filtered out for the analyses of chlorophyll a for the lab analyses of soluble nutrients. Laboratory methods will be performance based but suggested methods can be found in theNCCA Laboratory Methods
Quality Assurance Project Plan for July 2010 National Coastal Condition Assessment Page 19 of 121
Manual (EPA, 2010B) and EPA methods can be found at http://www.epa.gov/waterscience/methods/. Preferred methods are as follows:
chlorophyll a analysis - acetone extraction, fluorometric analysis
soluble nutrients - spectrophotometry (autoanalyzer)
phytoplankton – identification and enumeration
enterococcus – Quantitative Polymerase Chain Reaction (qPCR)
Appropriate QC samples (e.g., standards, reagent blanks, duplicates, and standard reference materials) will be run with each batch of samples. If the prescribed quality criteria are not consistently met, the analyst will confer with the laboratory supervisor for corrective measures before proceeding with additional samples. Sediment Silt-Clay Content Determination Silt-clay will be determined for sediment collected from each station by the differentiation of whole sediment into two fractions: that which passes through a 63-um sieve (silt-clay), and that which is retained on the screen (sands/gravel). The results will be expressed as percent silt-clay. The procedures to be used should be based on those developed for EMAP-E and described in the NCCA Laboratory Operations Manual. TOC Analysis of sediment TOC will be conducted with sediment sampled from each NCCA Site. The sediment will be dried and acidified to remove sources of inorganic carbon (e.g. carbonates); the analysis will be conducted using a TOC analyzer to combust the sample to form CO2 which is measured by infrared detection (U.S. EPA, 1995). Macrobenthic Community Assessments Macrobenthic organisms collected and preserved at each NCCA site will be sorted and identified at the laboratory typically to the lowest practicable level. The sample will first be sorted into major taxon groups which then will be further identified to species and counted. A senior taxonomist will oversee and periodically review the work performed by technicians. Refer to the NCCA Laboratory Operations Manual for additional information on the method. Sediment Toxicity Testing At each NCCA site, surficial sediment will be collected for use in acute toxicity tests in which marine or freshwater amphipods (depending on whether the site is marine or Great Lake) will be exposed to test treatments of sediment for up to 10 days under static conditions; the tests will be aerated. The toxicity tests will be conducted in accord to the standard method described in the NCCA Laboratory Operations Manual; these protocols are based on American Society for Testing and Materials (ASTM) Standard Method E-1367-90 (ASTM, 1991). After 10 days exposure, the surviving amphipods will be counted and results expressed as test treatment survival compared to control survival. These tests and will maintain a flexible policy regarding what species to permit as test organisms. Sediment and Fish Tissue Chemical Contaminant Testing
Quality Assurance Project Plan for July 2010 National Coastal Condition Assessment Page 20 of 121
Sediment samples collected at each NCCA site will be tested for the presence of a variety of chemical contaminants. For metals, microwave digestion will be followed by inductively coupled plasma (ICP) analysis. Mercury samples will be digested and analyzed using the cold vapor technique. Polychlorinated biphenols (PCB), organochlorine pesticide and dichlorodiphenyltrichloroethane (DDT) metabolite extracts will be analyzed by gas chromatograph/electron capture detector (GC/ECD) or gas chromatograph/electrolytic conductivity detector (GC/ELCD). A gas chromatograph/mass spectrophotometer (GC/MS) will be used to analyze samples for PAHs.
1.4.3. Data Analysis and Reporting
A technical workgroup convened by the EPA Project Leader is responsible for development of a data analysis plan that includes a verification and validation strategy. These processes are summarized in the indicator-specific sections of this QAPP. Validated data are transferred to the central data base managed by EMAP information management support staff located at WED in Corvallis. Information management activities are discussed further in Section 4. Data in the WED data base are available to Cooperators for use in development of indicator metrics. All validated measurement and indicator data from the NCCA are eventually transferred to EPA’s Water Quality Exchange (WQX) for storage in EPA’s STORET warehouse for public accessibility. The Data Analysis plan is described in Section 7 of this QAPP.
1.4.4. Peer Review
The Survey will undergo a thorough peer review process, where the scientific community and the public will be given the opportunity to provide comments. Cooperators have been actively involved in the development of the overall project management, design, methods, and standards including the drafting of four key project documents:
National Coastal Condition Assessment: Quality Assurance Project Plan (EPA 841-R-
09-004)
National Coastal Condition Assessment: Field Operations Manual (EPA, 2010A)
National Coastal Condition Assessment: Laboratory Methods Manual (EPA, 2010B)
National Coastal Condition Assessment: Site Evaluation Guidelines (EPA, 2010C)
Outside scientific experts from universities, research centers, and other federal agencies have been instrumental in indicator development and will continue to play an important role in data analysis. The EPA will utilize a three tiered approach for peer review of the Survey: (1) internal and external review by EPA, states, other cooperators and partners, (2) external scientific peer review, and (3) public review. Once data analysis has been completed, cooperators will examine the results at regional meetings. Comments and feedback from the cooperators will be incorporated into the draft report. Public and scientific peer review will occur simultaneously. This public comment period is important to the process and will allow EPA to garner a broader perspective in examining
Quality Assurance Project Plan for July 2010 National Coastal Condition Assessment Page 21 of 121
the results before the final report is completed. The public peer review is consistent with the Agency and OMB’s revised requirements for peer review. Below are the proposed measures EPA will implement for engaging in the peer review process:
1. Develop and maintain a public website with links to standard operating procedures,
quality assurance documents, fact sheets, cooperator feedback, and final report;
2. Conduct technical workgroup meetings composed of scientific experts, cooperators, and EPA to evaluate and recommend data analysis options and indicators;
3. Hold national meeting where cooperators will provide input and guidance on data presentation and an approach for data analysis;
4. Complete data validation on all chemical, physical and biological data;
5. Conduct final data analysis with workgroup to generate assessment results;
6. Engage peer review contractor to identify external peer review pane;l
7. Develop draft report presenting assessment results;
8. Conduct regional meetings with cooperators to examine and comment on results;
9. Develop final draft report incorporating input from cooperators and results from data analysis group to be distributed for peer and public review;
10. Issue Federal Register (FR) Notice announcing document availability and hold scientific/peer review and public comment (30-45 days); and
11. Consider scientific and public comments and produce a final report
2. DATA QUALITY OBJECTIVES
It is a policy of the U.S. EPA that Data Quality Objectives (DQOs) be developed for all environmental data collection activities following the prescribed DQO Process. DQOs are qualitative and quantitative statements that clarify study objectives, define the appropriate types of data, and specify the tolerable levels of potential decision errors that will be used as the basis for establishing the quality and quantity of data needed to support decisions (EPA 2006B). Data quality objectives thus provide the criteria to design a sampling program within cost and resource constraints or technology limitations imposed upon a project or study. DQOs are typically expressed in terms of acceptable uncertainty (e.g., width of an uncertainty band or interval) associated with a point estimate at a desired level of statistical confidence (EPA 2006B). The DQO Process is used to establish performance or acceptance criteria, which serve as the basis for designing a plan for collecting data of sufficient quality and quantity to support the goals of a study (EPA 2006B). As a general rule, performance criteria represent the full set of specifications that are needed to design a data or information collection effort such that, when implemented, generate newly-collected data that are of sufficient quality and quantity to address the project’s goals (EPA 2006B). Acceptance criteria are specifications intended to evaluate the adequacy of one or more existing sources of information or data as being acceptable to support the project’s intended use (EPA 2006B).

Quality Assurance Project Plan for July 2010 National Coastal Condition Assessment Page 22 of 121
2.1. Data Quality Objectives for the National Coastal Condition Assessment
NCCA has established target DQOs for assessing the current status of selected indicators of condition for the conterminous U.S.coastal resources as follows:
For each indicator of condition, estimate the proportion of the nation's estuaries and combined area of the Great Lakes in degraded condition within a ± 5% margin of error and with 95% confidence.
For each indicator of condition, estimate the proportion of regional estuarine resources
(Northeast, Southeast, Gulf of Mexico, and West Coast) in degraded condition within a ± 15% margin of error and with 95% confidence.
2.2. Measurement Quality Objectives
For each parameter, performance objectives (associated primarily with measurement error) are established for several different data quality indicators (following USEPA Guidance for Quality Assurance Plans EPA240/R-02/009). Specific measurement quality objectives (MQOs) for each parameter are presented in Table 2-1. The following sections define the data quality indicators and present approaches for evaluating them against acceptance criteria established for the program.
2.2.1. Method Detection Limits (Laboratory Reporting Level (Sensitivity))
For chemical measurements, requirements for the MDL are typically established (see indicators in Section 5). The MDL is defined as the lowest level of analyte that can be distinguished from zero with 99 percent confidence based on a single measurement (Glaser et al., 1981). United State Geologic Survey (USGS) NWQL has developed a variant of the MDL called the long-term MDL (LT-MDL) to capture greater method variability (Oblinger Childress et al. 1999). Unlike MDL, it is designed to incorporate more of the measurement variability that is typical for routine analyses in a production laboratory, such as multiple instruments, operators, calibrations, and sample preparation events (Oblinger Childress et al. 1999). The LT-MDL determination ideally employs at least 24 spiked samples prepared and analyzed by multiple analysts on multiple instruments over a 6- to 12-month period at a frequency of about two samples per month (EPA 2004B). The LT-MDL uses “F-pseudosigma” (Fσ) in place of s, the sample standard deviation, used in the EPA MDL calculation. F-pseudosigma is a non-parametric measure of variability that is based on the interquartile range of the data (EPA 2004B). The LT-MDL may be calculated using either the mean or median of a set of long-term blanks, or from long-term spiked sample results (depending o the analyte and specific analytical method). The LT-MDL for an individual analyte is calculated as:
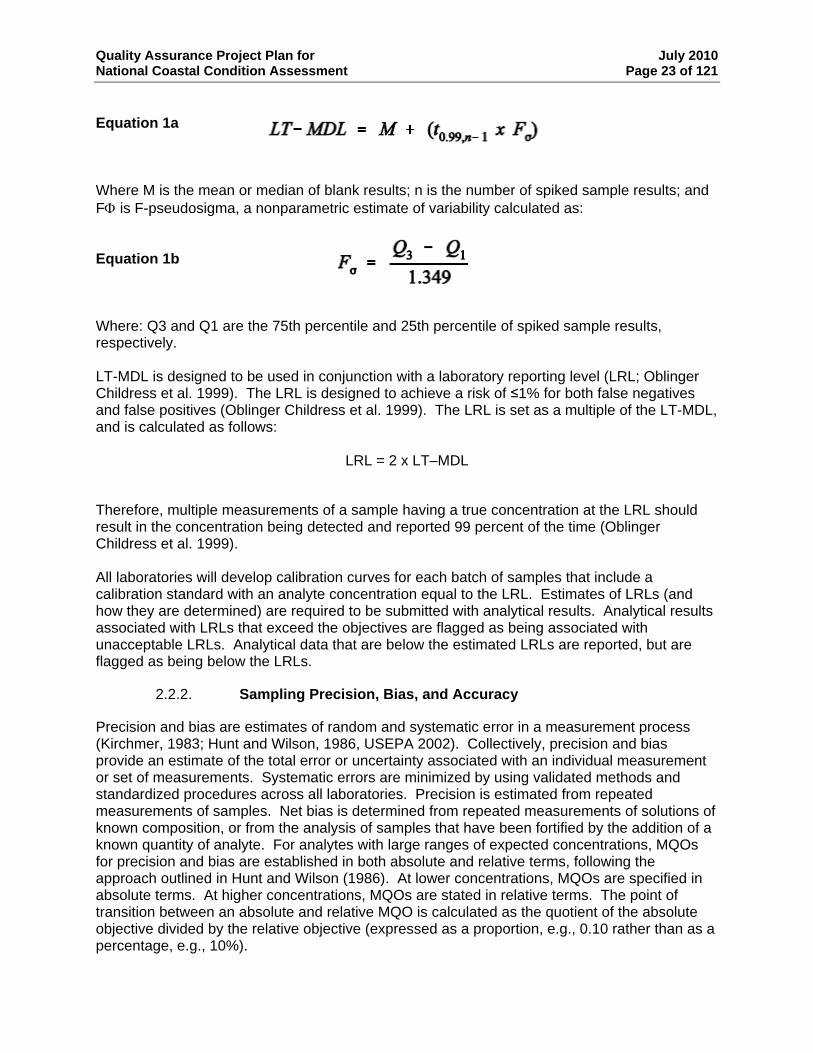
Quality Assurance Project Plan for July 2010 National Coastal Condition Assessment Page 23 of 121
Equation 1a
Where M is the mean or median of blank results; n is the number of spiked sample results; and FΦ is F-pseudosigma, a nonparametric estimate of variability calculated as: Equation 1b Where: Q3 and Q1 are the 75th percentile and 25th percentile of spiked sample results, respectively.
LT-MDL is designed to be used in conjunction with a laboratory reporting level (LRL; Oblinger Childress et al. 1999). The LRL is designed to achieve a risk of ≤1% for both false negatives and false positives (Oblinger Childress et al. 1999). The LRL is set as a multiple of the LT-MDL, and is calculated as follows:
LRL = 2 x LT–MDL
Therefore, multiple measurements of a sample having a true concentration at the LRL should result in the concentration being detected and reported 99 percent of the time (Oblinger Childress et al. 1999). All laboratories will develop calibration curves for each batch of samples that include a calibration standard with an analyte concentration equal to the LRL. Estimates of LRLs (and how they are determined) are required to be submitted with analytical results. Analytical results associated with LRLs that exceed the objectives are flagged as being associated with unacceptable LRLs. Analytical data that are below the estimated LRLs are reported, but are flagged as being below the LRLs.
2.2.2. Sampling Precision, Bias, and Accuracy
Precision and bias are estimates of random and systematic error in a measurement process (Kirchmer, 1983; Hunt and Wilson, 1986, USEPA 2002). Collectively, precision and bias provide an estimate of the total error or uncertainty associated with an individual measurement or set of measurements. Systematic errors are minimized by using validated methods and standardized procedures across all laboratories. Precision is estimated from repeated measurements of samples. Net bias is determined from repeated measurements of solutions of known composition, or from the analysis of samples that have been fortified by the addition of a known quantity of analyte. For analytes with large ranges of expected concentrations, MQOs for precision and bias are established in both absolute and relative terms, following the approach outlined in Hunt and Wilson (1986). At lower concentrations, MQOs are specified in absolute terms. At higher concentrations, MQOs are stated in relative terms. The point of transition between an absolute and relative MQO is calculated as the quotient of the absolute objective divided by the relative objective (expressed as a proportion, e.g., 0.10 rather than as a percentage, e.g., 10%).
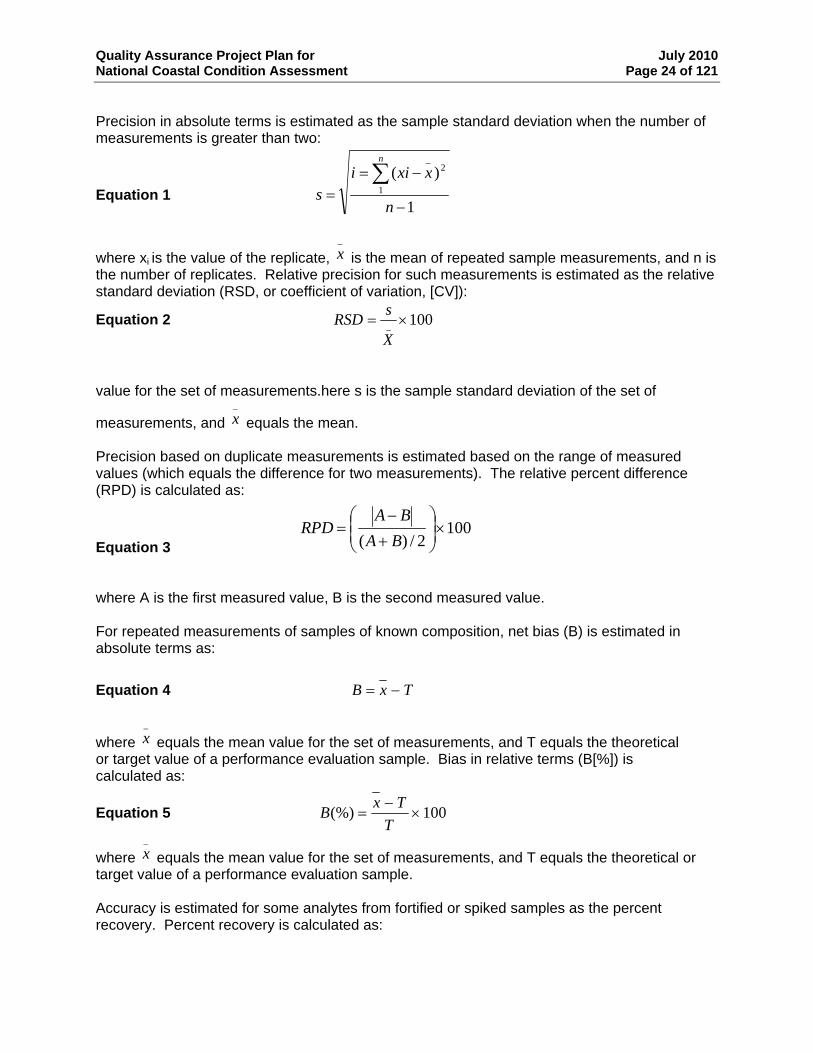
Quality Assurance Project Plan for July 2010 National Coastal Condition Assessment Page 24 of 121
Precision in absolute terms is estimated as the sample standard deviation when the number of measurements is greater than two:
n _
Equation 1 1
)(1
2
−
−==
∑n
xxiis
where xi is the value of the replicate, is the mean of repeated sample measurements, and n is the number of replicates. Relative precision for such measurements is estimated as the relative standard deviation (RSD, or coefficient of variation, [CV]):
_
x
Equation 2 100_ ×=X
sRSD
value for the set of measurements.here s is the sample standard deviation of the set of
measurements, and equals the mean. _
x Precision based on duplicate measurements is estimated based on the range of measured values (which equals the difference for two measurements). The relative percent difference (RPD) is calculated as:
Equation 3 100
2/)(×⎟⎟⎠
⎞⎜⎜⎝
⎛
+
−=
BABA
RPD
where A is the first measured value, B is the second measured value. For repeated measurements of samples of known composition, net bias (B) is estimated in absolute terms as:
Equation 4 TxB −=
where equals the mean value for the set of measurements, and T equals the theoretical or target value of a performance evaluation sample. Bias in relative terms (B[%]) is calculated as:
_x
Equation 5 100(%) ×−
=T
TxB
where equals the mean value for the set of measurements, and T equals the theoretical or target value of a performance evaluation sample.
_x
Accuracy is estimated for some analytes from fortified or spiked samples as the percent recovery. Percent recovery is calculated as:
Quality Assurance Project Plan for July 2010 National Coastal Condition Assessment Page 25 of 121
Equation 6 100cov% ×=−
cs
CCeryre iiis
where Cis is the measured concentration of the spiked sample, Cii is the concentration of the unspiked sample, and Cs is the concentration of the spike. Precision and bias within each laboratory are monitored for every sample batch by the analysis of internal QC samples. Samples associated with unacceptable QC sample results are reviewed and re-analyzed if necessary. Precision and bias across all laboratories will be evaluated after analyses are completed by using the results of performance evaluation (PE) samples sent to all laboratories (3 sets of 3 PE samples, with each set consisting of a low, moderate, and high concentration sample of all analytes).
2.2.3. Taxonomic Precision and Accuracy
For the NCCA, taxonomic precision will be quantified by comparing whole-sample identifications completed by independent taxonomists or laboratories. Accuracy of taxonomy will be qualitatively evaluated through specification of target hierarchical levels (e.g., family, genus, or species); and the specification of appropriate technical taxonomic literature or other references (e.g., identification keys, voucher specimens). To calculate taxonomic precision, 10 percent of the samples will be randomly-selected for re-identification by an independent, outside taxonomist or laboratory. Comparison of the results of whole sample re-identifications will provide a Percent Taxonomic Disagreement (PTD) calculated as: Equation 7
PTDcomp
Npos
= −⎛⎝⎜
⎞⎠⎟
⎡
⎣⎢
⎤
⎦⎥ ×1 100
where comppos is the number of agreements, and N is the total number of individuals in the larger of the two counts. The lower the PTD, the more similar are taxonomic results and the overall taxonomic precision is better. A MQO of 15% is recommended for taxonomic difference (overall mean <15% is acceptable). Individual samples exceeding 15% are examined for taxonomic areas of substantial disagreement, and the reasons for disagreement investigated. Sample enumeration is another component of taxonomic precision. Final specimen counts for samples are dependent on the taxonomist, not the rough counts obtained during the sorting activity. Comparison of counts is quantified by calculation of percent difference in enumeration (PDE), calculated as:
Equation 8
An MQO of 5% is recommended (overall mean of ≤5% is acceptable) for PDE values. Individual samples exceeding 5% are examined to determine reasons for the exceedance.
PDELab LabLab Lab
=−+
⎛⎝⎜
⎞⎠⎟×
1 21 2
100
Corrective actions for samples exceeding these MQOs can include defining the taxa for which re-identification may be necessary (potentially even by third party), for which samples (even
Quality Assurance Project Plan for July 2010 National Coastal Condition Assessment Page 26 of 121
outside of the 10% lot of QC samples) it is necessary, and where there may be issues of nomenclatural or enumeration problems. Taxonomic accuracy is evaluated by having individual specimens representative of selected taxa identified by recognized experts. Samples will be identified using the most appropriate technical literature that is accepted by the taxonomic discipline and reflects the accepted nomenclature. Where necessary, the Integrated Taxonomic Information System (ITIS, http://www.itis.usda.gov/) will be used to verify nomenclatural validity and spelling. A reference collection will be compiled as the samples are identified. Specialists in several taxonomic groups will verify selected individuals of different taxa, as determined by the NCCA workgroup.
2.2.4. Completeness
Completeness is defined as “a measure of the amount of data collected from a measurement process compared to the amount that was expected to be obtained under the conditions of measurement” (Stanley and Vener, 1985). Completeness requirements are established and evaluated from two perspectives. First, valid data for individual parameters must be acquired from a minimum number of sampling locations in order to make subpopulation estimates with a specified level of confidence or sampling precision. The objective of this study is to complete sampling at 95% or more of the 1000 initial sampling sites. Percent completeness is calculated as:
Equation 9 100% ×= TVC
where V is the number of measurements/samples judged valid, and T is the total number of planned measurements/samples. Within each indicator, completeness objectives are also established for individual samples or individual measurement variables or analytes. These objectives are estimated as the percentage of valid data obtained versus the amount of data expected based on the number of samples collected or number of measurements conducted. Where necessary, supplementary objectives for completeness are presented in the indicator-specific sections of this QAPP. The completeness objectives are established for each measurement per site type (e.g., probability sites, revisit sites, etc.). Failure to achieve the minimum requirements for a particular site type results in regional population estimates having wider confidence intervals and may impact the ability to make some subnational assessments. Failure to achieve requirements for repeat sampling (10% of samples collected) and revisit samples (10% of sites visited) reduces the precision of estimates of index period and annual variance components, and may impact the representativeness of these estimates because of possible bias in the set of measurements obtained.
2.2.5. Comparability
Comparability is defined as “the confidence with which one data set can be compared to another” (Stanley and Vener, 1985). A performance-based methods approach is being utilized for water chemistry and chlorophyll-a analyses that defines a set of laboratory method performance requirements for data quality. Following this approach, participating laboratories
Quality Assurance Project Plan for July 2010 National Coastal Condition Assessment Page 27 of 121
may choose which analytical methods they will use for each target analyte as long as they are able to achieve the performance requirements as listed in the Quality Control section of each Indicator section. For all parameters, comparability is addressed by the use of standardized sampling procedures and analytical methods by all sampling crews and laboratories. Comparability of data within and among parameters is also facilitated by the implementation of standardized quality assurance and quality control techniques and standardized performance and acceptance criteria. For all measurements, reporting units and format are specified, incorporated into standardized data recording forms, and documented in the information management system. Comparability is also addressed by providing results of QA sample data, such as estimates of precision and bias, conducting methods comparison studies when requested by the grantees and conducting interlaboratory performance evaluation studies among state, university, and NCCA contractors.
2.2.6. Representativeness
Representativeness is defined as "the degree to which the data accurately and precisely represent a characteristic of a population parameter, variation of a property, a process characteristic, or an operational condition" (USEPA 2002). At one level, representativeness is affected by problems in any or all of the other data quality indicators. At another level, representativeness is affected by the selection of the target surface water bodies, the location of sampling sites within that body, the time period when samples are collected, and the time period when samples are analyzed. The probability-based sampling design should provide estimates of condition of surface water resource populations that are representative of the region. The individual sampling programs defined for each indicator attempt to address representativeness within the constraints of the response design, (which includes when, where, and how to collect a sample at each site). Holding time requirements for analyses ensure analytical results are representative of conditions at the time of sampling. Use of duplicate (repeat) samples which are similar in composition to samples being measured provides estimates of precision and bias that are applicable to sample measurements.
3. SITE SELECTION DESIGN
The overall sampling program for the NCCA project requires a randomized, probability-based approach for selecting coastal sites where sampling activities are to be conducted. Details regarding the specific application of the probability design to surface waters resources are described in Paulsen et al. (1991) and Stevens (1994). The specific details for the collection of samples associated with different indicators are described in the indicator-specific sections of this QAPP.
Quality Assurance Project Plan for July 2010 National Coastal Condition Assessment Page 28 of 121
3.1. Probability Based Sampling Design and Site Selection
The target population for this project includes:
All coastal waters of the United States from the head-of-salt to confluence with ocean including inland waterways and major embayments such as Florida Bay and Cape Cod Bay. For the purposes of this study the head of salt is generally defined as < 0.5 psu (ppt) and represents the landward/upstream boundary. The seaward boundary extends out to where an imaginary straight-line intersecting two land features would fully enclose a body of coastal water. All waters within the enclosed area are defined as estuarine, regardless of depth or salinity.
Near shore waters of the Great Lakes of the United States and Canada. Near shore zone is defined as region from shoreline to 30m depth constrained to a maximum of 5 km from shoreline. Great Lakes include Lake Superior, Lake Michigan, Lake Huron, Lake Erie, and Lake Ontario. The NARS Great Lakes survey will be restricted to the United States portion.
3.1.1. Survey Design for the Marine Waters
The sample frame was derived from the prior National Coastal Assessment sample frame developed by ORD Gulf Breeze Ecology Division. The prior GED sample frame was enhanced as part of the National Coastal Monitoring Network design (National Water Quality Monitoring Network) by including information from NOAA’s Coastal Assessment Framework, boundaries of National Estuary Programs (NEP) and identification of major coastal systems. Information on salinity zones was obtained from NOAA for the NCCA. For Delaware Bay, Chesapeake Bay, Puget Sound and state of South Carolina, the prior NCCA sample frames were replaced by GIS layers provided by South Carolina Department of Health & Environmental Control, Washington Department of Ecology, Chesapeake Bay Program and Delaware River Basin Commission, ensuring that no prior areas in NCCA were excluded and any differences were clearly identified in the new NCCA sample frame. A Generalized Random Tessellation Stratified (GRTS) survey design for an area resource was used for the NCCA. The survey design is a stratified design with unequal probability of selection based on area within each stratum. The details are given below: Unequal probability categories were created based on area of polygons within each major estuary. The number of categories ranged from 3 to 7. The categories were used to ensure that sites were selected in the smaller polygons. The Design includes three panels: “Revisit” identifies sites that are to be visited twice, “Base” identifies remaining sites to be visited, and “Over” identifies sites available to be used as replacement sites. Over sample sites were selected independent of the other two panels. The expected sample size is 682 sites for conterminous coastal states and 45 sites each for Hawaii and Puerto Rico. The maximum number of sites for a major estuary was 46 (Chesapeake Bay). Total number of site visits is 750 allocated to 682 unique sites and 68 sites to be revisited. Additionally, over sample sites were selected to not only provide replacement sites that either are not part of the target population or could not be sampled but also to accommodate those states on National Estuary
Quality Assurance Project Plan for July 2010 National Coastal Condition Assessment Page 29 of 121
Programs who may want to increase the number of sites sampled within their state for a state-level design or NEP design.
3.1.2. Survey Design for the Great Lakes
The sample frame was obtained from Jack Kelly, US EPA ORD. A Generalized Random Tessellation Stratified (GRTS) survey design for an area resource was used. The survey design is stratified by Lake and country with unequal probability of selection based on state shoreline length within each stratum. Unequal probability categories are states or province within each Great Lake based on proportion of state shoreline length within each stratum. The design uses a single panel, “Base”, with an over sample that was selected independent of the Base panel. The expected sample size is for 45 sites in Shallow NearShore zone for each Great Lake and country combination for a total of 405 sites. Sample sizes were allocated proportional to shoreline length by state within each Great Lake. An over sample size of 405 (100%) was selected to provide replacement sites that either are not part of the target population or could not be sampled. The over sample sites were selected independently of the base design.
3.1.3. Revisit Sites
Of the sites visited in the field and found to be target sites, a total of 10% will be revisited. The primary purpose of this revisit set of sites is to allow variance estimates that would provide information on the extent to which the population estimates might vary if they were sampled at a different time.
4. INFORMATION MANAGEMENT
Environmental monitoring efforts that amass large quantities of information from various sources present unique and challenging data management opportunities. To meet these challenges, the NCCA employs a variety of well-tested information management (IM) strategies to aid in the functional organization and ensured integrity of stored electronic data. IM is integral to all aspects of the NCCA from initial selection of sampling sites through the dissemination and reporting of final, validated data. And, by extension, all participants in the NCCA have certain responsibilities and obligations which also make them a part of the IM system. This “inclusive” approach to managing information helps to:
• Strengthen relationships among NCCA participants.
• Increase the quality and relevancy of accumulated data.
• Ensure the flexibility and sustainability of the NCCA IM structure.
This IM strategy provides a congruent and scientifically meaningful approach for maintaining environmental monitoring data that will satisfy both scientific and technological requirements of the NCCA.
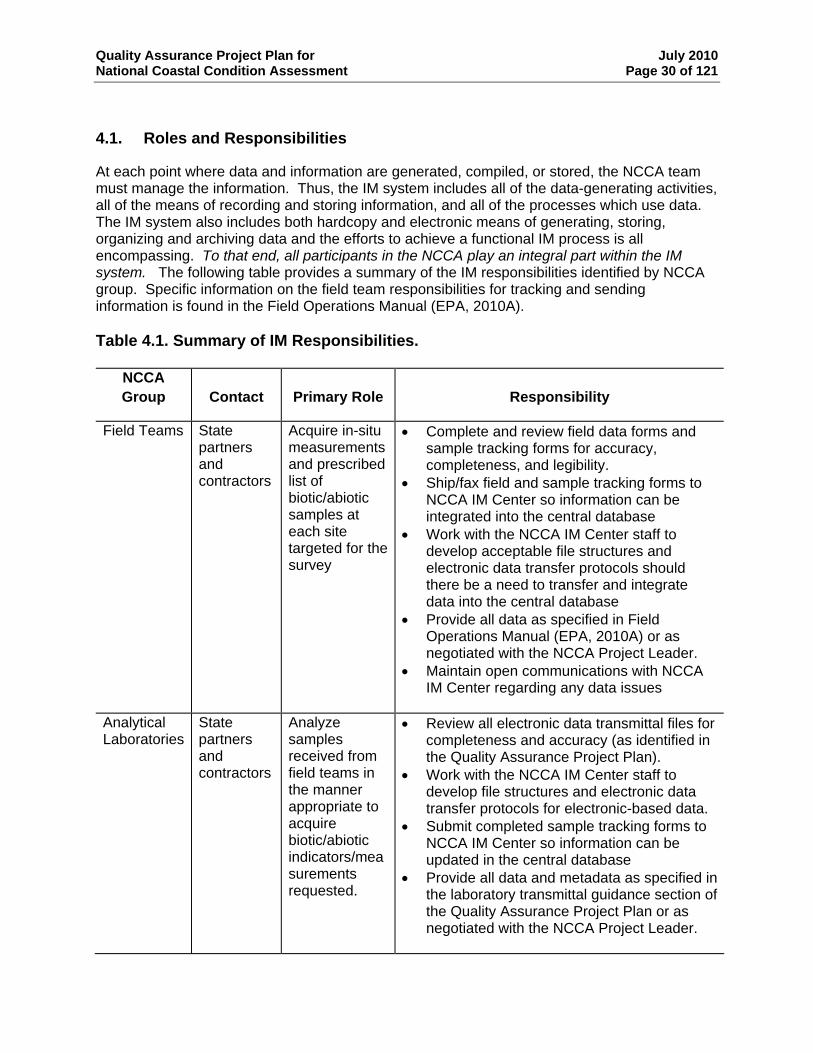
Quality Assurance Project Plan for July 2010 National Coastal Condition Assessment Page 30 of 121
4.1. Roles and Responsibilities
At each point where data and information are generated, compiled, or stored, the NCCA team must manage the information. Thus, the IM system includes all of the data-generating activities, all of the means of recording and storing information, and all of the processes which use data. The IM system also includes both hardcopy and electronic means of generating, storing, organizing and archiving data and the efforts to achieve a functional IM process is all encompassing. To that end, all participants in the NCCA play an integral part within the IM system. The following table provides a summary of the IM responsibilities identified by NCCA group. Specific information on the field team responsibilities for tracking and sending information is found in the Field Operations Manual (EPA, 2010A). Table 4.1. Summary of IM Responsibilities.
NCCA Group Contact Primary Role Responsibility
Field Teams State partners and contractors
Acquire in-situ measurements and prescribed list of biotic/abiotic samples at each site targeted for the survey
•
•
•
•
•
Complete and review field data forms and sample tracking forms for accuracy, completeness, and legibility. Ship/fax field and sample tracking forms to NCCA IM Center so information can be integrated into the central database Work with the NCCA IM Center staff to develop acceptable file structures and electronic data transfer protocols should there be a need to transfer and integrate data into the central database Provide all data as specified in Field Operations Manual (EPA, 2010A) or as negotiated with the NCCA Project Leader. Maintain open communications with NCCA IM Center regarding any data issues
Analytical Laboratories
State partners and contractors
Analyze samples received from field teams in the manner appropriate to acquire biotic/abiotic indicators/measurements requested.
•
•
•
•
Review all electronic data transmittal files for completeness and accuracy (as identified in the Quality Assurance Project Plan). Work with the NCCA IM Center staff to develop file structures and electronic data transfer protocols for electronic-based data. Submit completed sample tracking forms to NCCA IM Center so information can be updated in the central database Provide all data and metadata as specified in the laboratory transmittal guidance section of the Quality Assurance Project Plan or as negotiated with the NCCA Project Leader.
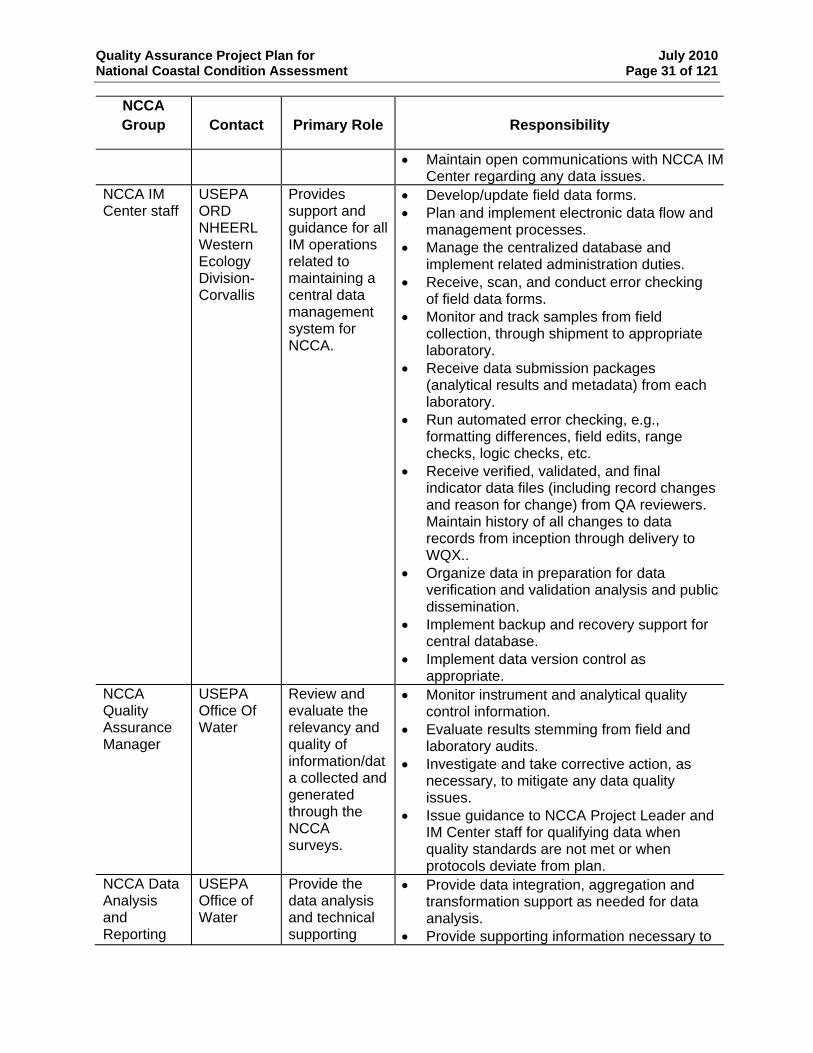
Quality Assurance Project Plan for July 2010 National Coastal Condition Assessment Page 31 of 121
NCCA Group Contact Primary Role Responsibility
• Maintain open communications with NCCA IM Center regarding any data issues.
NCCA IM Center staff
USEPA ORD NHEERL Western Ecology Division-Corvallis
Provides support and guidance for all IM operations related to maintaining a central data management system for NCCA.
• Develop/update field data forms. • Plan and implement electronic data flow and
management processes. • Manage the centralized database and
implement related administration duties. • Receive, scan, and conduct error checking
of field data forms. • Monitor and track samples from field
collection, through shipment to appropriate laboratory.
• Receive data submission packages (analytical results and metadata) from each laboratory.
• Run automated error checking, e.g., formatting differences, field edits, range checks, logic checks, etc.
• Receive verified, validated, and final indicator data files (including record changes and reason for change) from QA reviewers. Maintain history of all changes to data records from inception through delivery to WQX..
• Organize data in preparation for data verification and validation analysis and public dissemination.
• Implement backup and recovery support for central database.
• Implement data version control as appropriate.
NCCA Quality Assurance Manager
USEPA Office Of Water
Review and evaluate the relevancy and quality of information/data collected and generated through the NCCA surveys.
• Monitor instrument and analytical quality control information.
• Evaluate results stemming from field and laboratory audits.
• Investigate and take corrective action, as necessary, to mitigate any data quality issues.
• Issue guidance to NCCA Project Leader and IM Center staff for qualifying data when quality standards are not met or when protocols deviate from plan.
NCCA Data Analysis and Reporting
USEPA Office of Water
Provide the data analysis and technical supporting
• Provide data integration, aggregation and transformation support as needed for data analysis.
• Provide supporting information necessary to
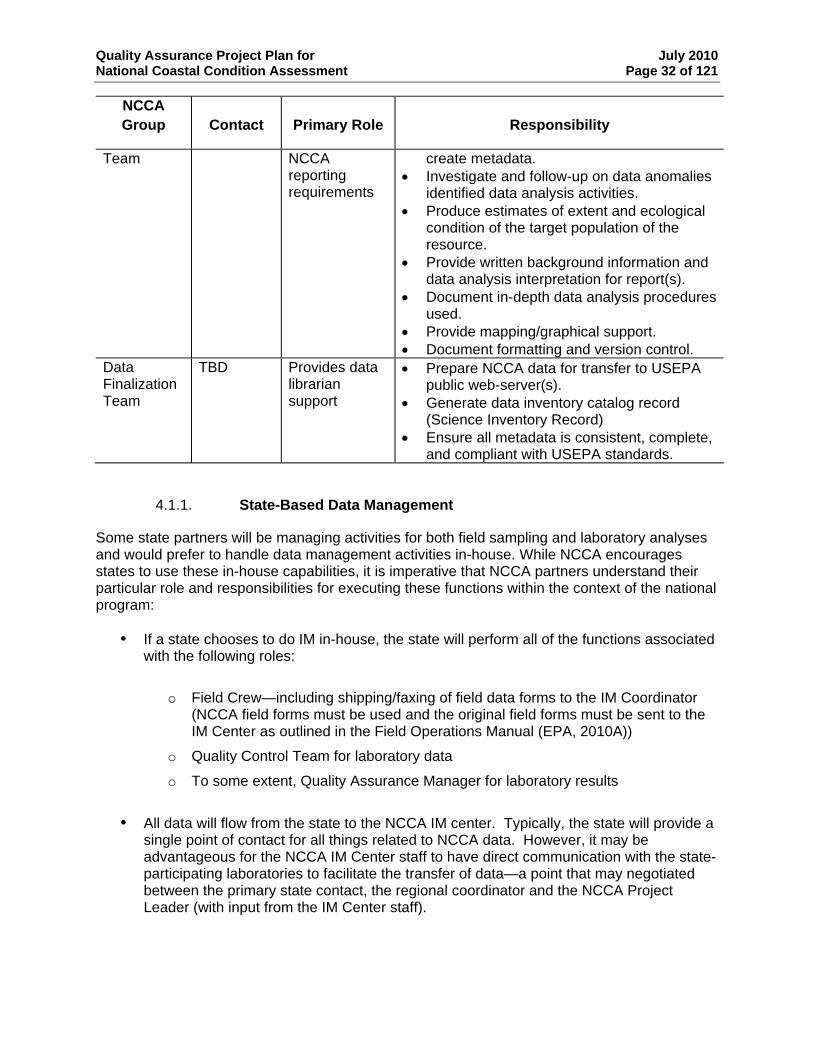
Quality Assurance Project Plan for July 2010 National Coastal Condition Assessment Page 32 of 121
NCCA Group Contact Primary Role Responsibility
Team NCCA create metadata. reporting • Investigate and follow-up on data anomalies requirements identified data analysis activities.
• Produce estimates of extent and ecological condition of the target population of the resource.
• Provide written background information and data analysis interpretation for report(s).
• Document in-depth data analysis procedures used.
• Provide mapping/graphical support. • Document formatting and version control.
Data TBD Provides data • Prepare NCCA data for transfer to USEPA Finalization librarian public web-server(s). Team support • Generate data inventory catalog record
(Science Inventory Record) • Ensure all metadata is consistent, complete,
and compliant with USEPA standards.
4.1.1. State-Based Data Management
Some state partners will be managing activities for both field sampling and laboratory analyses and would prefer to handle data management activities in-house. While NCCA encourages states to use these in-house capabilities, it is imperative that NCCA partners understand their particular role and responsibilities for executing these functions within the context of the national program:
If a state chooses to do IM in-house, the state will perform all of the functions associated with the following roles:
o Field Crew—including shipping/faxing of field data forms to the IM Coordinator
(NCCA field forms must be used and the original field forms must be sent to the IM Center as outlined in the Field Operations Manual (EPA, 2010A))
o Quality Control Team for laboratory data o To some extent, Quality Assurance Manager for laboratory results
All data will flow from the state to the NCCA IM center. Typically, the state will provide a single point of contact for all things related to NCCA data. However, it may be advantageous for the NCCA IM Center staff to have direct communication with the state-participating laboratories to facilitate the transfer of data—a point that may negotiated between the primary state contact, the regional coordinator and the NCCA Project Leader (with input from the IM Center staff).
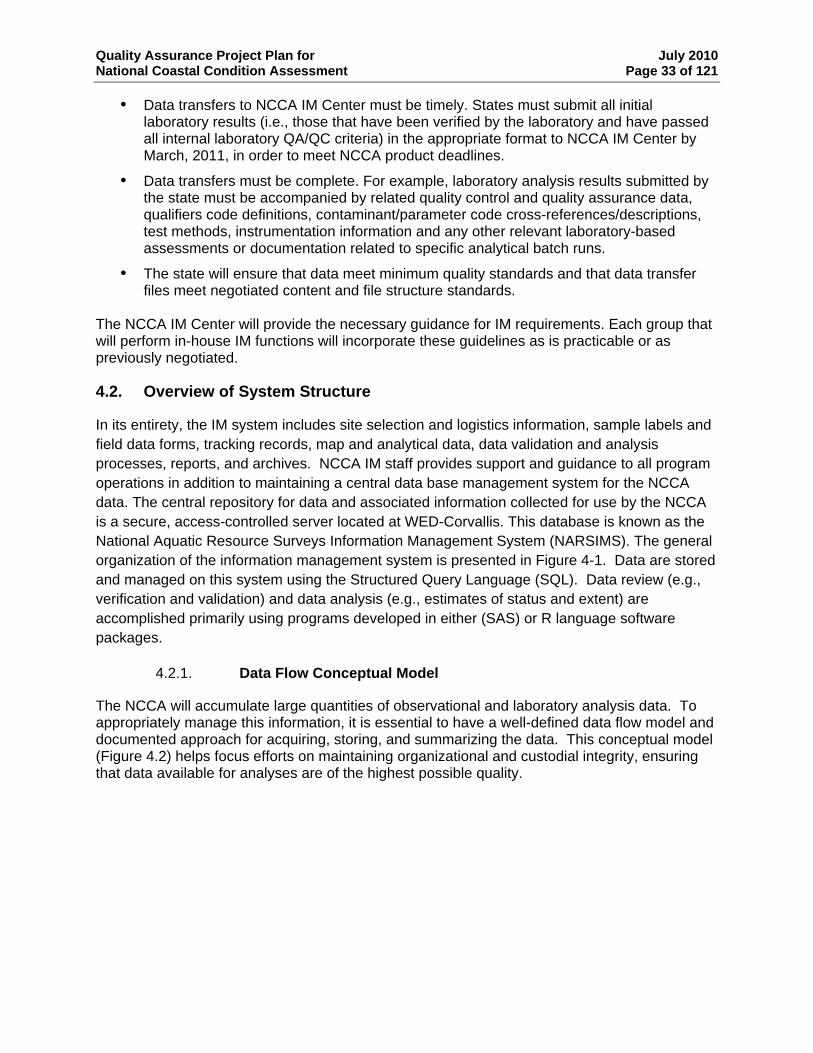
Quality Assurance Project Plan for July 2010 National Coastal Condition Assessment Page 33 of 121
Data transfers to NCCA IM Center must be timely. States must submit all initial laboratory results (i.e., those that have been verified by the laboratory and have passed all internal laboratory QA/QC criteria) in the appropriate format to NCCA IM Center by March, 2011, in order to meet NCCA product deadlines.
Data transfers must be complete. For example, laboratory analysis results submitted by the state must be accompanied by related quality control and quality assurance data, qualifiers code definitions, contaminant/parameter code cross-references/descriptions, test methods, instrumentation information and any other relevant laboratory-based assessments or documentation related to specific analytical batch runs.
The state will ensure that data meet minimum quality standards and that data transfer files meet negotiated content and file structure standards.
The NCCA IM Center will provide the necessary guidance for IM requirements. Each group that will perform in-house IM functions will incorporate these guidelines as is practicable or as previously negotiated.
4.2. Overview of System Structure
In its entirety, the IM system includes site selection and logistics information, sample labels and field data forms, tracking records, map and analytical data, data validation and analysis processes, reports, and archives. NCCA IM staff provides support and guidance to all program operations in addition to maintaining a central data base management system for the NCCA data. The central repository for data and associated information collected for use by the NCCA is a secure, access-controlled server located at WED-Corvallis. This database is known as the National Aquatic Resource Surveys Information Management System (NARSIMS). The general organization of the information management system is presented in Figure 4-1. Data are stored and managed on this system using the Structured Query Language (SQL). Data review (e.g., verification and validation) and data analysis (e.g., estimates of status and extent) are accomplished primarily using programs developed in either (SAS) or R language software packages.
4.2.1. Data Flow Conceptual Model
The NCCA will accumulate large quantities of observational and laboratory analysis data. To appropriately manage this information, it is essential to have a well-defined data flow model and documented approach for acquiring, storing, and summarizing the data. This conceptual model (Figure 4.2) helps focus efforts on maintaining organizational and custodial integrity, ensuring that data available for analyses are of the highest possible quality.
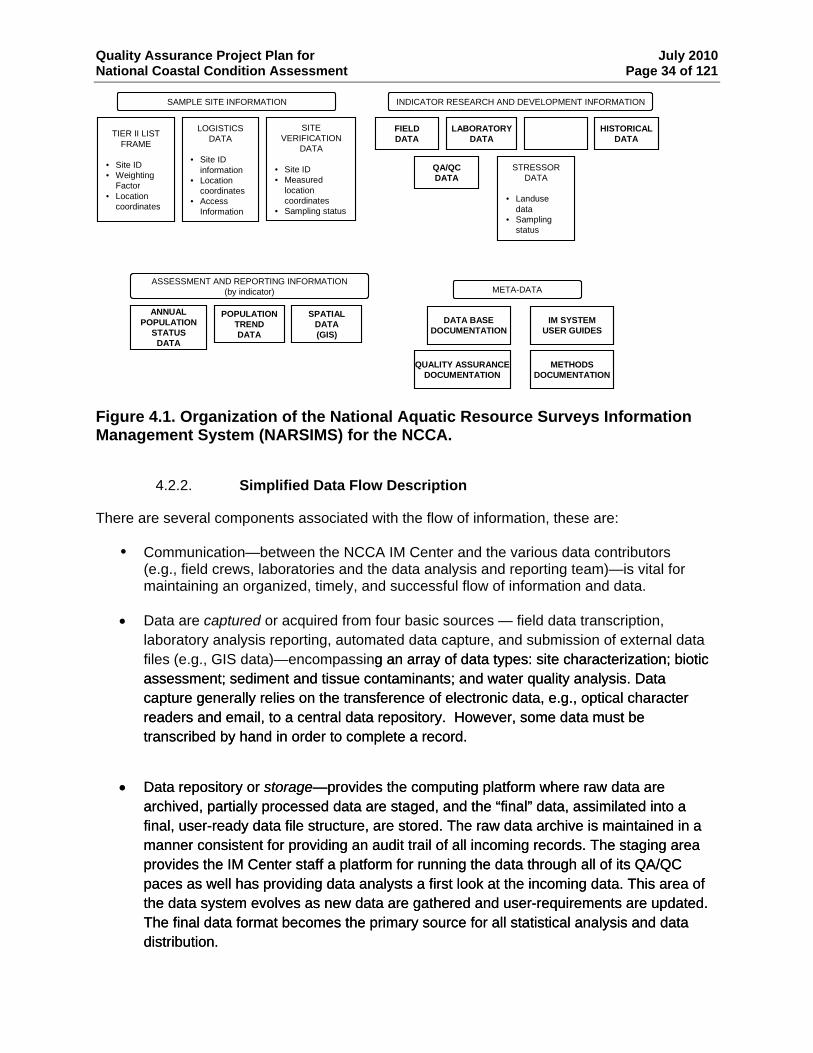
Quality Assurance Project Plan for July 2010 National Coastal Condition Assessment Page 34 of 121
SASAMPMPLLEETRTRAACCKIKINNGG
DADATTAA
FIELDDATAFIELDDATA
LABORATORYDATA
LABORATORYDATA
SAMPLE SITE INFORMATIONSAMPLE SITE INFORMATION INDICATOR RESEARCH AND DEVELOPMENT INFORMATIONINDICATOR RESEARCH AND DEVELOPMENT INFORMATION
META-DATAMETA-DATA
DATA BASEDOCUMENTATION
DATA BASEDOCUMENTATION
METHODSDOCUMENTATION
METHODSDOCUMENTATION
QA/QCDATAQA/QCDATA
IM SYSTEMUSER GUIDES
IM SYSTEMUSER GUIDES
QUALITY ASSURANCEDOCUMENTATION
QUALITY ASSURANCEDOCUMENTATION
ASSESSMENT AND REPORTING INFORMATION(by indicator)
ASSESSMENT AND REPORTING INFORMATION(by indicator)
ANNUALPOPULATION
STATUSDATA
ANNUALPOPULATION
STATUSDATA
POPULATIONTRENDDATA
POPULATIONTRENDDATA
SPATIALDATA(GIS)
SPATIALDATA(GIS)
HISTORICALDATA
HISTORICALDATATIER II LIST
FRAME
• Site ID• Weighting
Factor• Location
coordinates
TIER II LISTFRAME
• Site ID• Weighting
Factor• Location
coordinates
LOGISTICSDATA
• Site ID information
• Location coordinates
• Access Information
LOGISTICSDATA
• Site ID information
• Location coordinates
• Access Information
SITEVERIFICATION
DATA
• Site ID• Measured
location coordinates
• Sampling status
SITEVERIFICATION
DATA
• Site ID• Measured
location coordinates
• Sampling status
STRESSORDATA
• Landusedata
• Sampling status
STRESSORDATA
• Landusedata
• Sampling status
Figure 4.1. Organization of the National Aquatic Resource Surveys Information Management System (NARSIMS) for the NCCA.
4.2.2. Simplified Data Flow Description
There are several components associated with the flow of information, these are:
Communication—between the NCCA IM Center and the various data contributors (e.g., field crews, laboratories and the data analysis and reporting team)—is vital for maintaining an organized, timely, and successful flow of information and data.
• Data are captured or acquired from four basic sources — field data transcription,
laboratory analysis reporting, automated data capture, and submission of external data files (e.g., GIS data)—encompassing an array of data types: site characterization; biotic assessment; sediment and tissue contaminants; and water quality analysis. Data capture generally relies on the transference of electronic data, e.g., optical character readers and email, to a central data repository. However, some data must be transcribed by hand in order to complete a record.
g an array of data types: site characterization; biotic assessment; sediment and tissue contaminants; and water quality analysis. Data capture generally relies on the transference of electronic data, e.g., optical character readers and email, to a central data repository. However, some data must be transcribed by hand in order to complete a record.
• Data repository or storage—provides the computing platform where raw data are
archived, partially processed data are staged, and the “final” data, assimilated into a final, user-ready data file structure, are stored. The raw data archive is maintained in a manner consistent for providing an audit trail of all incoming records. The staging area provides the IM Center staff a platform for running the data through all of its QA/QC paces as well has providing data analysts a first look at the incoming data. This area of the data system evolves as new data are gathered and user-requirements are updated. The final data format becomes the primary source for all statistical analysis and data distribution.
• Data repository or storage—provides the computing platform where raw data are archived, partially processed data are staged, and the “final” data, assimilated into a final, user-ready data file structure, are stored. The raw data archive is maintained in a manner consistent for providing an audit trail of all incoming records. The staging area provides the IM Center staff a platform for running the data through all of its QA/QC paces as well has providing data analysts a first look at the incoming data. This area of the data system evolves as new data are gathered and user-requirements are updated. The final data format becomes the primary source for all statistical analysis and data distribution.
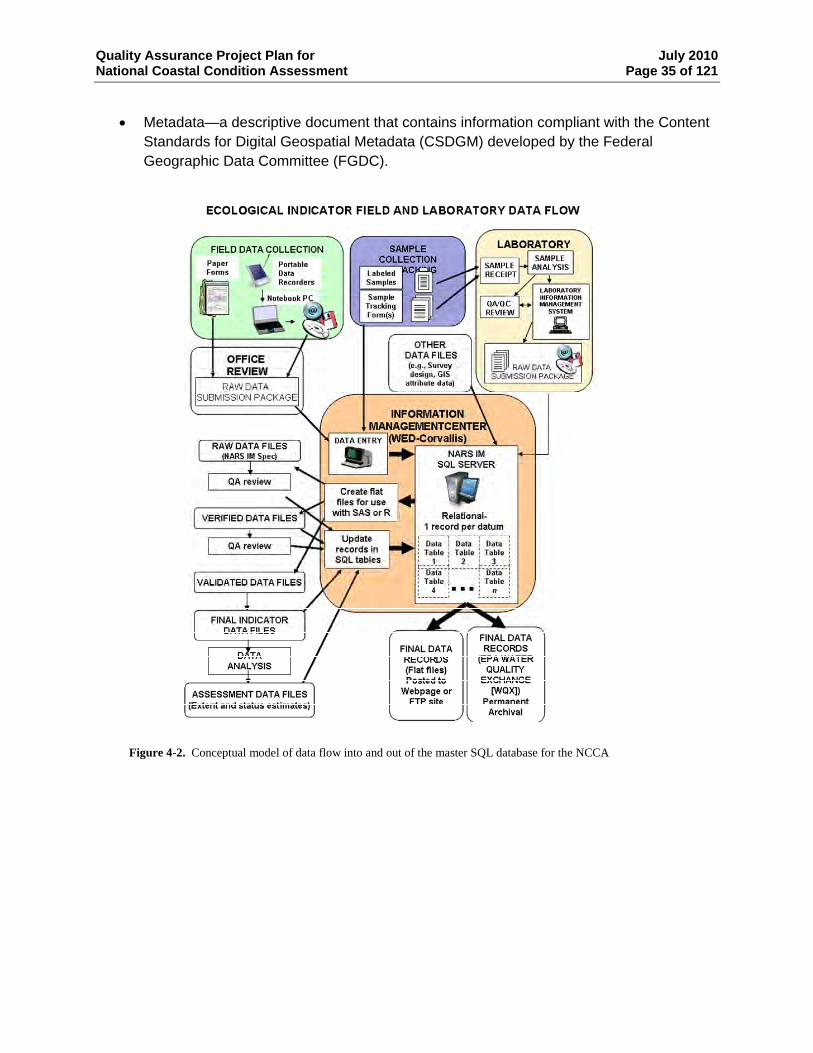
Quality Assurance Project Plan for July 2010 National Coastal Condition Assessment Page 35 of 121
• Metadata—a descriptive document that contains information compliant with the Content
Standards for Digital Geospatial Metadata (CSDGM) developed by the Federal Geographic Data Committee (FGDC).
Figure 4-2. Conceptual model of data flow into and out of the master SQL database for the NCCA
Quality Assurance Project Plan for July 2010 National Coastal Condition Assessment Page 36 of 121
4.3. Core Information Management Standards
The development and organization of the IM system is compliant with guidelines and standards established by the EMAP Information Management Technical Coordination Group, the EPA Office of Technology, Operations, and Planning (OTOP), and the ORD Office of Science Information Management. Areas addressed by these policies and guidelines include, but are not limited to, the following:
Taxonomic nomenclature and coding;
Locational data;
Sampling unit identification and reference;
Hardware and software; and
Data catalog documentation.
The NCCA is committed to compliance with all applicable regulations and guidance concerning hardware and software procurement, maintenance, configuration control, and QA/QC. To that end, the NCCA team has adopted several IM standards that help maximize the ability to exchange data within the study and with other aquatic resource surveys or similar large-scale monitoring and assessment studies (e.g. EMAP, R-EMAP, state probability surveys). These standards include those of the Federal Geographic Data Committee (FGDC 1999), the National Spatial Data Infrastructure (NSDI 1999), and the National Biological Information Infrastructure (NBII 1999). More specific information follows:
4.3.1. Data Formats
4.3.1.1. Attribute Data
• Sql Tables
• Sas Data Sets.
• R Data Sets.
• Ascii Files: Comma-Separated values, or space-delimited, or fixed column
4.3.1.2. GIS Data
• ARC/INFO native and export files; compressed .tar file of ARC/INFO workspace
• Spatial Data Transfer Standard (SDTS; FGDC 1999) format available on request
Quality Assurance Project Plan for July 2010 National Coastal Condition Assessment Page 37 of 121
4.3.1.3. Standard Coding Systems
Sampling Site (EPA Locational Data Policy; EPA 1991) Latitude and Longitude in decimal degrees ( +/- 7.4)
Negative longitude values (west of the prime meridian).
Datum used must be specified (e.g., NAD83, NAD27)
Chemical Compounds: Chemical Abstracts Service (CAS 1999)
Species Codes: Integrated Taxonomic Information System (ITIS 1999).
Land cover/land use codes: Multi-Resolution Land Characteristics (MRLC 1999); National Hydrography Dataset Plus Version 1.0 (NHDPlus 2005)
4.3.2. Public Accessibility
While any data created using public funds are subject to the Freedom of Information Act (FOIA), some basic rules apply for general public accessibility and use.
• Program must comply with Data Quality Act before making any data available to the public and must fill out and have a signed Information Quality Guidelines package before any posting to the web or distribution of any kind.
• Data and metadata files are made available to the contributor or participating group for review or other project-related use from NARSIMS or in flat files before moving to an EPA approved public website.
• Data to be placed on a public website will undergo QA/QC review according to the approved Quality Assurance Project Plan.
• Only “final” data (those used to prepare the final project report) are readily available through an EPA approved public website. Other data can be requested through the NCCA Project Leader or NARS Coordinator.
As new guidance and requirements are issued, the NCCA information management staff will assess the impact upon the IM system and develop plans for ensuring timely compliance.
Quality Assurance Project Plan for July 2010 National Coastal Condition Assessment Page 38 of 121
4.4. Data Transfer Protocols
Field crews are expected to send in hard copies of field forms containing in-situ measurement and event information to the IM Center as defined in the Field Operations Manual (EPA, 2010A). Electronic data files are submitted by laboratories (and possibly some field crews). Field crews and labs must submit all sample tracking and analytical results data to the NCCA IM Center in electronic form using a standard software package to export and format data. Examples of software and the associated formats are: Software Export Options (file extensions)
Microsoft Excel® xls, xlsx, csv, formatted txt Microsoft Access® mdb, csv, formatted txt SAS® sas7bdat, csv, formatted txt R csv, formatted txt
All electronic files must be accompanied by appropriate documentation, e.g., metadata, laboratory reports, QA/QC data and review results). This information should contain sufficient information to identify field contents, field formats, qualifier codes, etc. It is very important to keep EPA informed of the completeness of the analyses. Labs may send files periodically, before all samples are analyzed, but EPA must be informed that more data are pending if a partial file is submitted. All data files sent by the labs must be accompanied by text documentation describing the status of the analyses, any QA/QC problems encountered during processing, and any other information pertaining to the quality of the data. Following is a list of general transmittal requirements each laboratory or state-based IM group should consider when packaging data for electronic transfer to the IM Center:
• Provide data in row/column data file/table structure. Further considerations: o Include sample id provided on the sample container label in a field for each
record (row) to ensure that each data file/table record can be related to a site visit.
o Use a consistent set of column labels. o Use file structures consistently. o Use a consistent set of data qualifiers. o Use a consistent set of units. o Include method detection limit (MDL) as part of each result record. o Include reporting limit (RL) as part of each result record. o Provide a description of each result/QC/QA qualifier. o Provide results/measurements/MDL/RL in numeric form. o Maintain result qualifiers, e.g., <, ND, in a separate column. o Use a separate column to identify record-type. For example, if QA or QC
data are included in a data file, there should be a column that allows the NCCA IM staff to readily identify the different result types.
o Include laboratory sample identifier. o Include batch numbers/information so results can be paired with appropriate
QA/QC information. o Include “True Value” concentrations, if appropriate, in QA/QC records. o Include a short description of preparation and analytical methods used to
(where appropriate) either as part of the record or as a separate description
Quality Assurance Project Plan for July 2010 National Coastal Condition Assessment Page 39 of 121
for the test(s) performed on the sample. For example, EPAxxxx.x, ASTMxxx.x, etc. Provide a broader description, e.g., citation, if a non-standard method is used.
o Include a short description of instrumentation used to acquire the test result (where appropriate). This may be reported either as part of the record or as a separate description for each test performed on the sample. For example, GC/MS-ECD, ICP-MS, etc.
• Ensure that data ready for transfer to NCCA IM are verified and validated, and results are qualified to the extent possible (final verification and validation are conducted by EPA).
• Data results must complement expectations (analysis results) as specified by contract or agreement.
• Identify and qualify missing data (why is the data missing). • Submit any other associated quality assurance assessments and relevant data
related to laboratory results (i.e., chemistry, nutrients). Examples include summaries of QC sample analyses (blanks, duplicates, check standards, matrix spikes) standard or certified reference materials, etc.), results for external performance evaluation or proficiency testing samples, and any internal consistency checks conducted by the laboratory.
Labs may send electronic files by e-mail attachments or they may upload files through a secure FTP location.
4.5. Data Quality and Results Validation
Data quality is integrated throughout the life-cycle of the data. Data received in to the IM center from NCCA participants are examined for completeness, format compatibility, and internal consistency. Field collected data quality is evaluated using a variety of automated and other techniques. Analytical results are reviewed by subject matter experts. Any changes (deletions, additions, corrections) are submitted to the NCCA data center for inclusion into the validated data repository. All explanation for data changes is included in the record history.
4.5.1. Data Entry, Scanned, or Transferred Data
4.5.1.1. Field crews record sampling event observational data in a standard and consistent manner using field data collection forms (Appendix B of the NCCA Field Operations Manual (EPA, 2010A).
4.5.1.2. The IM Center either optically scans or transcribes information from field collection forms into an electronic format (sometimes using a combination of both processes). During the scanning process, incoming data are subjected to a number of automated error checking routines. Obvious errors are corrected immediately. Suspected errors that cannot be confirmed at the time of scanning are qualified for later review by someone with the appropriate background and experience (e.g., a chemist or aquatic ecologist). The process continues until the transcribed data are 100 % verified or no corrections are required.
4.5.1.3. Additional validation is accomplished by the IM Center staff using a specific set of guidelines and executing a series of programs (computer code) to check for: correct file structure and variable naming and formats, outliers, missing data, typographical
Quality Assurance Project Plan for July 2010 National Coastal Condition Assessment Page 40 of 121
errors and illogical or inconsistent data based on expected relationships to other variables. Data that fail any check routine are identified in an “exception report” that is reviewed by an appropriate scientist for resolution.
4.5.1.4. The IM Center brings any remaining questionable data to the attention of the QA manager and individuals responsible for collecting the data for resolution.
4.5.2. Analytical Results Validation
4.5.2.1. All data are evaluated to determine completeness and validity. Additionally, the data are run through a rigorous inspection using SQL queries or other computer programs such as SAS or R to check for anomalous data values that are especially large or small, or are noteworthy in other ways. Focus is on rare, extreme values since outliers may affect statistical quantities such as averages and standard deviations.
4.5.2.2. All laboratory quality assurance (QA) information is examined to determine if the laboratory met the predefined data quality objectives - available through the Quality Assurance Project Plan (QAPP).
4.5.2.3. All questionable data should be corrected or qualified through the NCCA IM staff with support of the project QA manager.
4.5.3. Database Changes
4.5.3.1. Data corrections are completed at the lowest level by the IM Center staff to ensure that any subsequent updates will contain only the most correct data. Laboratory results found to be in error are sent back to the originator (lab) for correction by the IM Team. After the originator makes any corrections, the entire batch or file is resubmitted to the IM Center. The IM Center uses these resubmissions to replace any previous versions of the same data.
4.5.3.2. The IM Center uses a version control methodology when receiving files. Incoming data are not always immediately transportable into a format compatible with the desired file structures. When these situations occur, the IM staff creates a copy of the original data file which then becomes the working file in which any formatting changes will take place. The original raw data will remain unchanged. This practice further ensures the integrity of the data and provides an additional data recovery avenue, should the need arise.
4.5.3.3. All significant changes are documented by the IM Center staff. The IM Center includes this information in the final summary documentation for the database (metadata).
4.5.3.4. After corrections have been applied to the data, the IM Center will rerun the validation programs to re-inspect the data.
4.5.3.5. The IM Center may implement database auditing features to track changes.
4.6. Metadata
Quality Assurance Project Plan for July 2010 National Coastal Condition Assessment Page 41 of 121
Federal Geographic Data Committee, Content standard for digital geospatial metadata, version 2.0. FGDC-STD-001-1998 (FGDC 1998).
4.7. Information Management Operations
4.7.1. Computing Infrastructure
Electronic data are collected and maintained within a central server housed at the Western Ecology Division using a Windows Server 2003 R2 (current configuration) or higher computing platform in SQL native tables for the primary data repository and SAS® native data sets or R datasets for data analysis. Official IM functions are conducted in a centralized environment.
4.7.2. Data Security and Accessibility
The IM Center ensures that all data files in the IM system are protected from corruption by computer viruses, unauthorized access, and hardware and software failures. Guidance and policy documents of EPA and management policies established by the IM Technical Coordination Group for data access and data confidentiality are followed. Raw and verified data files are accessible only to the NCCA collaborators. Validated data files are accessible only to users specifically authorized by the NCCA Project Leader. Data files in the central repository used for access and dissemination are marked as read-only to prevent corruption by inadvertent editing, additions, or deletions. Data generated, processed, and incorporated into the IM system are routinely stored as well as archived on redundant systems by the IM team. This ensures that if one system is destroyed or incapacitated, IM staff can reconstruct the databases. Procedures developed to archive the data, monitor the process, and recover the data are described in IM documentation. Data security and accessibility standards implemented for NCCA IM meet EPA’s standard security authentication (i.e., username, password) process in accordance to the EPA’s Information Management Security Manual (1999; EPA Directive 2195 A1) and EPA Order 2195.1 A4 (2001D). Any data sharing requiring file transfer protocol (FTP) or internet protocol is provided through an authenticated site.
4.7.3. Life Cycle
Data may be retrieved electronically by the NCCA team, partners and others throughout the records retention and disposition lifecycle or as practicable (See section 4.8).
Quality Assurance Project Plan for July 2010 National Coastal Condition Assessment Page 42 of 121
4.7.4. Data Recovery and Emergency Backup Procedures
The IM Team maintains several backup copies of all data files and of the programs used for processing the data are maintained. Backups of the entire system are maintained off-site by the IM Team. The IM process used by the IM Team for NCCA uses system backup procedures. The IM Team backs up and archives the central data base according to procedures already established for WED and NARSIM. All laboratories generating data and developing data files are expected to established procedures for backing up and archiving computerized data.
4.7.5. Long-Term Data Accessibility and Archive
All data are transferred by OW’s Water Quality Exchange (WQX) team working with the NCCA IM Team to U.S. EPA’s agency-wide WQX data management system for archival purposes. WQX is a repository for water quality, biological, and physical data and is used by state environmental agencies, EPA and other federal agencies, universities, private citizens, and many others. Revised from STORET, WQX provides a centralized system for storage of physical, chemical, and biological data and associated analytical tools for data analysis. Data from the NCCA project in an Excel format will be run through an Interface Module and uploaded to WQX by the WQX team. Once uploaded, states and tribes and the public will be able to download data (using Oracle software) from their region. Data will also be provided in flat files on the NCCA website.
4.8. Records Management
Removable storage media (i.e., CDs, diskettes, tapes) and paper records are maintained in a centrally located area at the NCCA IM center by the IM Team. Paper records will be returned to OW once the assessment is complete. The IM Team identifies and maintains files using standard divisional procedures. Records retention and disposition comply with U.S. EPA directive 2160 Records Management Manual (July, 1984) in accordance with the Federal Records Act of 1950.
5. INDICATORS
5.1. Indicator Summary
5.1.1. Introduction
Information common to most indicators can be found in this section. Indicator-specific details for each subheading in this section can be found as follows:
In situ measurements – pH, dissolved oxygen, temperature, conductivity/salinity, PAR and secchi depth (Section 5.2);
Water quality samples – total and dissolved nutrients, chlorophyll a, and phytoplankton (Section 5.3);
Benthic macroinvertebrates (Section 5.4);
Chemistry in sediment and fish tissue – organics and inorganics (Section 5.5);
Grain Size and TOC determinations (Section 5.6);
Quality Assurance Project Plan for July 2010 National Coastal Condition Assessment Page 43 of 121
Sediment Toxicity Testing (Section 5.7); and
Enterococcus sample (Section 5.8).
5.1.2. Sampling Design
The “X-site” coordinates, predetermined by EPA, will be located using GPS and most measurements will be collected within 0.02 nm, or ±37 m of the given coordinate. If the crew experiences difficulties locating an acceptable sediment grab sample, the radius, for sediment collection, can be expanded to a maximum of 100 m for marine sites and 500 m for Great Lakes sites. See specific procedures in the Field Operations Manual (EPA, 2010A).
5.1.3. Sampling and Analytical Methods
Sampling and analytical methods are specific to each indicator. In addition to the Field Operations Manual (EPA, 2010A), the NCCA project team developed and provided to the field crews a condensed description of key elements of the field activities for easy reference onsite by field crew members. See the Sampling and Analytical Methods section for each of the indicators described in Sections 5.2 through 5.8.
5.1.4. Quality Assurance Objectives
Precision objectives are presented in tables in each of the Quality Assurance Objective sections for each indicator. They represent the 99 percent confidence intervals about a single measurement and are thus based on the standard deviation of a set of repeated measurements (n > 1). Precision objectives at lower concentrations are equivalent to the corresponding LRL. At higher concentrations, the precision objective is expressed in relative terms, with the 99 percent confidence interval based on the relative standard deviation (Section 2.2.2). Objectives for accuracy are equal to the corresponding precision objective, and are based on the mean value of repeated measurements. Accuracy is generally estimated as net bias or relative net bias (Section 2.2.2). Precision and bias are monitored at the point of measurement (field or analytical laboratory) by several types of QC samples described for each indicator (Quality Assurance Objectives sections 5.2 – 5.8), where applicable, and from performance evaluation (PE) samples.
5.1.5. Quality Control Procedures: Field Operations
Field data quality is addressed, in part, by application and consistent performance of valid procedures documented in the standard operating procedures detailed in the NCCA Field Operations Manual (EPA, 2010A). That quality is enhanced by the training and experience of project staff and documentation of sampling activities. This QAPP, the NCCA Field Operations Manual (EPA, 2010A), and training materials will be distributed to all field sampling personnel. Training sessions will be conducted by EPA and EPA Contractors to distribute and discuss project materials. All sampling teams will be required to view the training materials, read the QAPP, and verify that they understand the procedures and requirements.
The recorded GPS measure displayed for the sampling site should be within 0.004167 decimal degrees of latitude and longitude of the map coordinates. This distance is approximately equal to the precision of the GPS receiver without differential correction of the position fix. Specific quality control measures for field measurements and observations are listed in each Quality Control Procedures section for each indicator in sections 5.2 – 5.8.
Quality Assurance Project Plan for July 2010 National Coastal Condition Assessment Page 44 of 121
5.1.6. Quality Control Procedures: Laboratory Operations
An array of laboratory-based stoichiometric determinations will be conducted on a variety of samples collected for NCCA. These analyses require extensive utilization of certified standards for instrument calibration. Additionally, many incorporate the use of SRMs as routine QC samples. The analytical standards and SRMs for all analyses will be provided by established, reputable suppliers and when available, only certified materials will be used; in cases where certified standards are not available, the analysts will obtain high purity (e.g., analytical or reagent grade) compounds to prepare in-house standards. Laboratory quality control procedures are summarized in the Quality Control Procedures section for each indicator in sections 5.2 - 5.8.
All laboratory instrumentation and equipment will be maintained in good repair as per manufacturer’s recommendations or best laboratory practices to ensure proper function. If not actual calibration, all general laboratory equipment requires some documentation of performance. Each piece of equipment should have an assigned logbook in which the calibration or performance records are maintained. Several pieces of equipment that may be utilized to analyze environmental data for NCCA should have periodic maintenance and calibration verification performed by manufacturer’s representatives or service consultants. These procedures should be documented by date and the signature of person performing the inspection.
Of particular interest are records for the analytical balances used for weighing out standards or analytical samples. These balances must be maintained under the manufacturer’s recommended calibration schedule and the performance of the balances should be verified before each series of weighings by using a set of NIST (or previous NBS)-approved standard weights. If the performance of a particular balance is historically stable, then the verifications may only be required on an appropriate periodic basis (e.g., weekly). As much as possible, the verifications should be conducted using standard weights that reflect the magnitude of the actual weighing. The results of the verifications should be recorded in the logbook for the balance.
5.1.6.1. Sample Receipt and Processing
The information management team is notified of sample receipt and any associated problems as soon as possible after samples are received. Critical holding times for the various analyses are the maximum allowable holding times, based on current EPA and American Public Health Association (APHA) requirements (American Public Health Association, 2006). Sample receipt and processing criteria can be found in Sample Receipt and Processing sections for each indicator in Sections 5.2-5.8. Sample residuals are retained by each laboratory until the EPA Project Lead has authorized the disposition of samples.
Quality Assurance Project Plan for July 2010 National Coastal Condition Assessment Page 45 of 121
5.1.6.2. Analysis of Samples
Each of the laboratory analyses will be conducted in accord with generally accepted laboratory procedures such as those described in Standard Methods for the Examination of Water and Wastewater or U.S. EPA Methods. Appropriate QC samples (e.g., standards, reagent blanks, duplicates, and standard reference materials) will be run with each batch of samples. If the prescribed quality criteria are not consistently met, the analyst will confer with the laboratory supervisor for corrective measures before proceeding with additional samples. Analytical quality control criteria can be found in the Analysis of Samples section for each indicator in Sections 5.2 – 5.8.
5.1.6.3. Data Reporting, Review, and Management
The data analysis teams and the project leads are ultimately responsible for ensuring the validity of the data, although performance of the specific checks may be delegated to other staff members. Once data have passed all acceptance requirements, computerized data files are prepared in a format specified for the NCCA project. The electronic data files are transferred to the NCCA IM Coordinator at WED-Corvallis for entry into a centralized data base. A hard copy output of all files will also be sent to the NCCA IM Coordinator. See section 4.2 for data management procedures, once it reaches the IM Coordinator.
5.2. In Situ Measurements
The first activities that should be conducted upon arriving onsite are those that involve water column measurements; these data need to be collected before disturbing bottom sediments.
5.2.1. Introduction
In situ measurements made using field meters are recorded on standardized data forms. Field crews will measure dissolved oxygen (DO), pH, conductivity (fresh water) or salinity (marine), and temperature using a multi-parameter water quality meter. A meter will be used to read photosynthetically active radiation (PAR) throughout the photic zone. Secchi disk depth will also be measured. At Great Lakes sites, underwater video will be taken at each site.
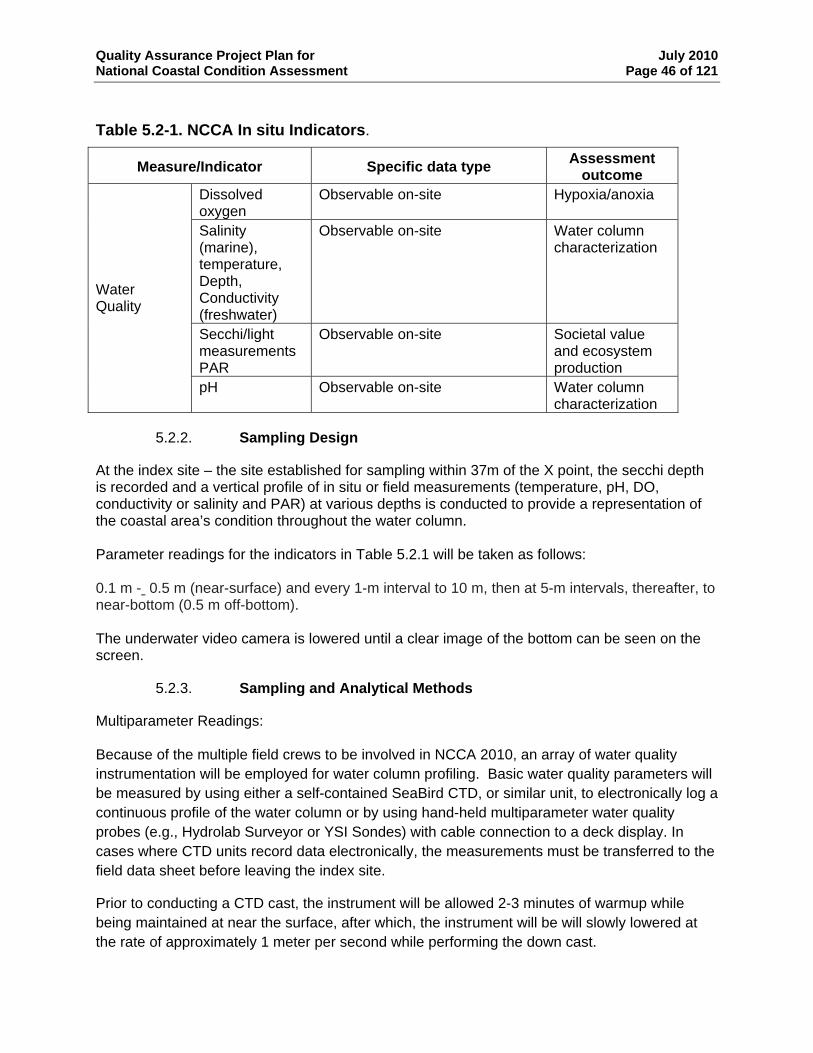
Quality Assurance Project Plan for July 2010 National Coastal Condition Assessment Page 46 of 121
Table 5.2-1. NCCA In situ Indicators.
Measure/Indicator Specific data type Assessment outcome
Dissolved oxygen
Observable on-site Hypoxia/anoxia
Salinity (marine), temperature, Depth, Conductivity (freshwater)
Observable on-site Water column characterization
Secchi/light measurements PAR
Observable on-site Societal value and ecosystem production
Water Quality
pH Observable on-site Water column characterization
5.2.2. Sampling Design
At the index site – the site established for sampling within 37m of the X point, the secchi depth is recorded and a vertical profile of in situ or field measurements (temperature, pH, DO, conductivity or salinity and PAR) at various depths is conducted to provide a representation of the coastal area’s condition throughout the water column. Parameter readings for the indicators in Table 5.2.1 will be taken as follows: 0.1 m - 0.5 m (near-surface) and every 1-m interval to 10 m, then at 5-m intervals, thereafter, to near-bottom (0.5 m off-bottom). The underwater video camera is lowered until a clear image of the bottom can be seen on the screen.
5.2.3. Sampling and Analytical Methods
Multiparameter Readings: Because of the multiple field crews to be involved in NCCA 2010, an array of water quality instrumentation will be employed for water column profiling. Basic water quality parameters will be measured by using either a self-contained SeaBird CTD, or similar unit, to electronically log a continuous profile of the water column or by using hand-held multiparameter water quality probes (e.g., Hydrolab Surveyor or YSI Sondes) with cable connection to a deck display. In cases where CTD units record data electronically, the measurements must be transferred to the field data sheet before leaving the index site.
Prior to conducting a CTD cast, the instrument will be allowed 2-3 minutes of warmup while being maintained at near the surface, after which, the instrument will be will slowly lowered at the rate of approximately 1 meter per second while performing the down cast.
Quality Assurance Project Plan for July 2010 National Coastal Condition Assessment Page 47 of 121
Near-bottom conditions will be measured at 0.5 m off bottom with both instrument types by first ascertaining on-bottom (e.g., slake line/cable), then pulling up approximately 0.5 m. The crews must then allow 2-3 minutes for disturbed conditions to settle before taking the near-bottom measurements. The profile will be repeated on the ascent and recorded for validation purposes, but only data from the down trip will be the reported in the final data.
PAR Readings:
Measurements of light penetration, taken by hand-held light meters, will be recorded for conditions at discrete depth intervals in a manner similar to that for profiling water quality parameters with the hand-held probe. The underwater (UW) sensor will be hand lowered at the regime described and at each discrete interval, and at each depth inmterval the deck reading and UW reading will be recorded. If the light measurements become negative before reaching bottom, the measurement terminates at that depth. The profile will be repeated on the ascent.
Secchi Depth Readings:
Secchi depth will be determined by using a standard 20-cm diameter black and white secchi disc. The disc will be lower to the depth at which it can no longer be discerned, then it is slowly retrieved until it just reappears; that depth is marked and recorded as secchi depth (rounded to the nearest 0.5 m). This process is repeated two additional times for a total of three depth readings for each disappear/reappear measurement.
Unerwater Video (Great Lakes sites only):
Detailed instructions on operation of the underwater video equipment can be found in the Field Operations Manual (EPA, 2010A). A component diagram is included.
5.2.4. Quality Assurance Objectives
Several pieces of equipment that may be utilized to collect or analyze environmental data for NCCA should have periodic maintenance and calibration verification performed by manufacturer’s representatives or service consultants. These procedures should be documented by date and the signature of person performing the inspection. Examples include: CTDs - annual maintenance and calibration check by manufacturer or certified service center;
Light (PAR) Meters - biannual verification of calibration coefficient by manufacturer;
Multiparameter probes – as needed maintenance and calibration check by manufacturer or certified service center.
Video cameras- as needed maintenance as described in the manufacturer information.
All other sampling gear and laboratory instrumentation will be maintained in good repair as per manufacturer’s recommendations or common sense to ensure proper function.
Measurement data quality objectives (measurement DQOs or MQOs) are given in Table 5.2-2. General requirements for comparability and representativeness are addressed in Section 2. The
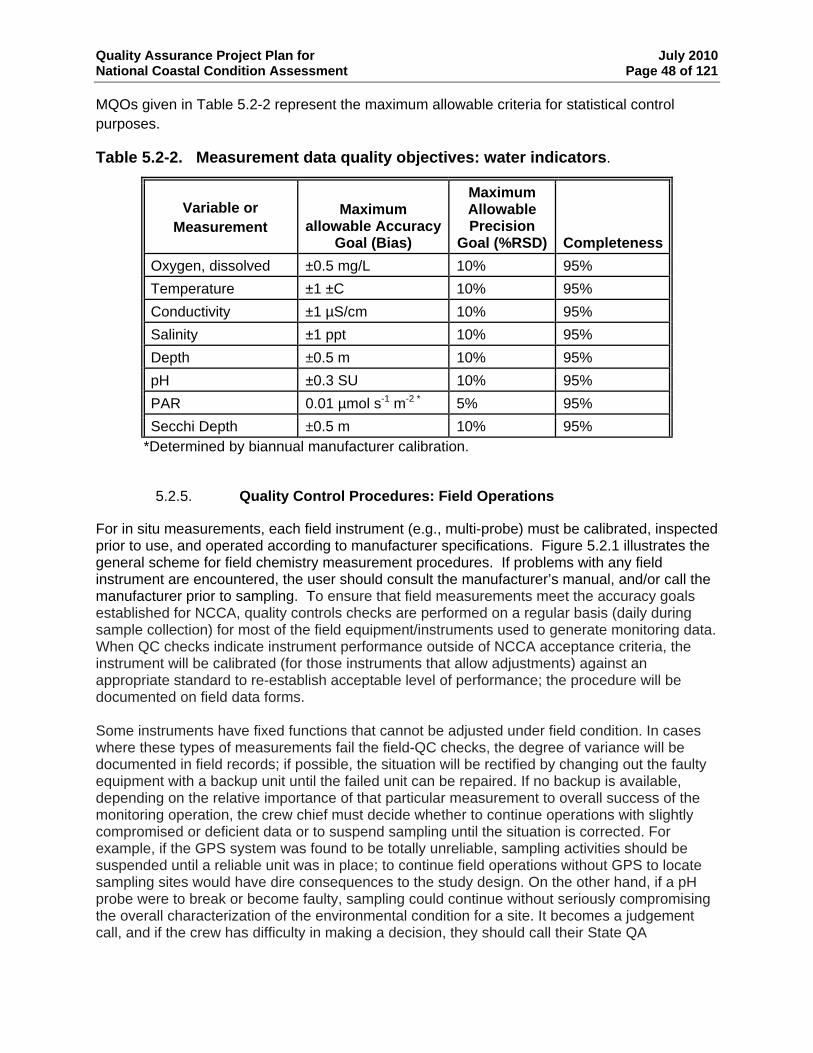
Quality Assurance Project Plan for July 2010 National Coastal Condition Assessment Page 48 of 121
MQOs given in Table 5.2-2 represent the maximum allowable criteria for statistical control purposes.
Table 5.2-2. Measurement data quality objectives: water indicators.
Variable or Measurement
Maximum allowable Accuracy
Goal (Bias)
Maximum Allowable Precision
Goal (%RSD) CompletenessOxygen, dissolved ±0.5 mg/L 10% 95% Temperature ±1 ±C 10% 95% Conductivity ±1 µS/cm 10% 95% Salinity ±1 ppt 10% 95% Depth ±0.5 m 10% 95% pH ±0.3 SU 10% 95% PAR 0.01 µmol s-1 m-2 * 5% 95% Secchi Depth ±0.5 m 10% 95%
*Determined by biannual manufacturer calibration.
5.2.5. Quality Control Procedures: Field Operations
For in situ measurements, each field instrument (e.g., multi-probe) must be calibrated, inspected prior to use, and operated according to manufacturer specifications. Figure 5.2.1 illustrates the general scheme for field chemistry measurement procedures. If problems with any field instrument are encountered, the user should consult the manufacturer’s manual, and/or call the manufacturer prior to sampling. To ensure that field measurements meet the accuracy goals established for NCCA, quality controls checks are performed on a regular basis (daily during sample collection) for most of the field equipment/instruments used to generate monitoring data. When QC checks indicate instrument performance outside of NCCA acceptance criteria, the instrument will be calibrated (for those instruments that allow adjustments) against an appropriate standard to re-establish acceptable level of performance; the procedure will be documented on field data forms. Some instruments have fixed functions that cannot be adjusted under field condition. In cases where these types of measurements fail the field-QC checks, the degree of variance will be documented in field records; if possible, the situation will be rectified by changing out the faulty equipment with a backup unit until the failed unit can be repaired. If no backup is available, depending on the relative importance of that particular measurement to overall success of the monitoring operation, the crew chief must decide whether to continue operations with slightly compromised or deficient data or to suspend sampling until the situation is corrected. For example, if the GPS system was found to be totally unreliable, sampling activities should be suspended until a reliable unit was in place; to continue field operations without GPS to locate sampling sites would have dire consequences to the study design. On the other hand, if a pH probe were to break or become faulty, sampling could continue without seriously compromising the overall characterization of the environmental condition for a site. It becomes a judgement call, and if the crew has difficulty in making a decision, they should call their State QA
Quality Assurance Project Plan for July 2010 National Coastal Condition Assessment Page 49 of 121
Coordinator for guidance. Proper maintenance and routine calibration checks are the key elements related to quality control for these instruments. Calibration of the CTD units is an involved procedure that is usually performed only periodically (e.g., semiannually) and at a center that is equipped for that function; however, the instruments have an established track record and tend to be reliable for the intervals between calibrations. The calibration procedures will follow those prescribed by Sea-Bird Electronics and should be performed at a facility set up for that purpose. Monthly calibration checks will be performed in the laboratory. In-field calibration checks will be conducted on a daily basis when the CTD unit is in use to document the instrument’s performance. The multiparameter probe/deck display units, on-the-other-hand, are easy to calibrate; these units will undergo QC checks on a daily basis and be calibrated if out of tolerance. Calibration requirements and QC checks for the various instruments are described in the following sections.
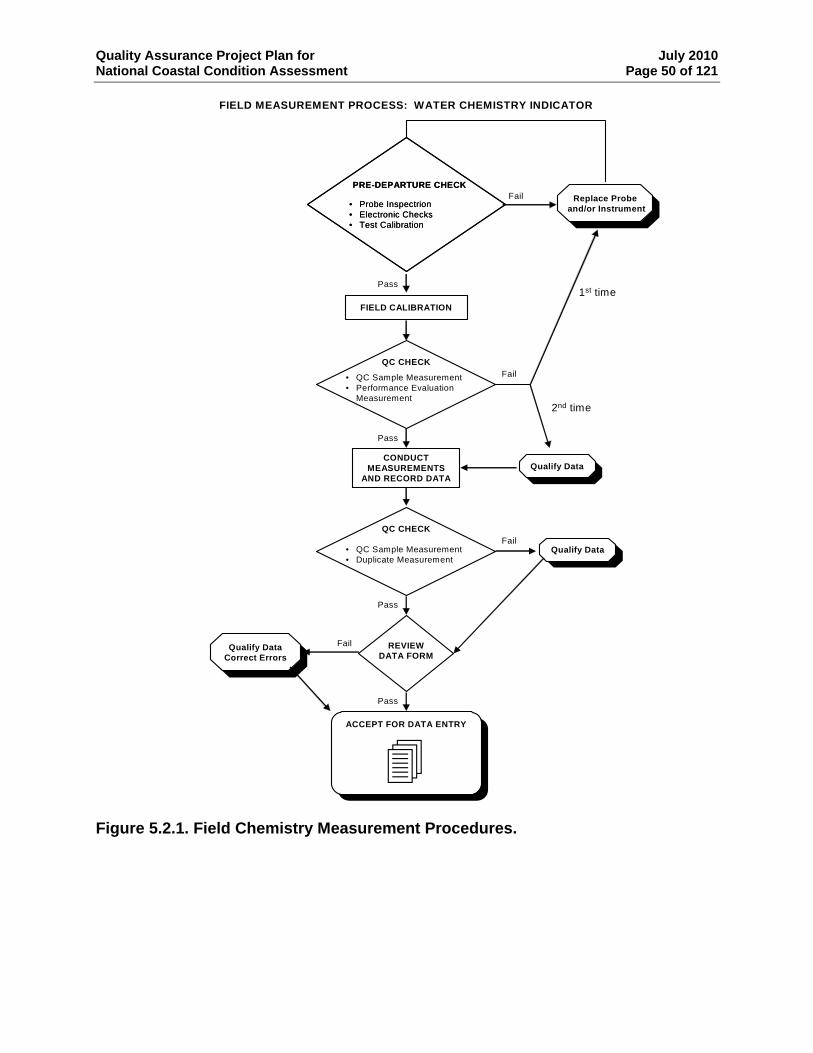
Quality Assurance Project Plan for July 2010 National Coastal Condition Assessment Page 50 of 121
FIELD MEASUREMENT PROCESS: WATER CHEMISTRY INDICATOR
Replace Probeand/or Instrument
Replace Probeand/or Instrument
CONDUCTMEASUREMENTS
AND RECORD DATA Qualify DataQualify Data
Pass
Pass
Fail
Fail
PRE-DEPARTURE CHECK
• Probe Inspectrion• Electronic Checks• Test Calibration
PRE-DEPARTURE CHECK
• Probe Inspectrion• Electronic Checks• Test Calibration
Fail
FIELD CALIBRATION
QC CHECK
• QC Sample Measurement• Performance Evaluation
Measurement
QC CHECK
• QC Sample Measurement• Duplicate Measurement Qualify Data
Qualify Data
Pass
REVIEWDATA FORMQualify Data
Correct Errors
Qualify DataCorrect Errors
ACCEPT FOR DATA ENTRYACCEPT FOR DATA ENTRY
Fail
Pass
1st time
2nd time
Figure 5.2.1. Field Chemistry Measurement Procedures.
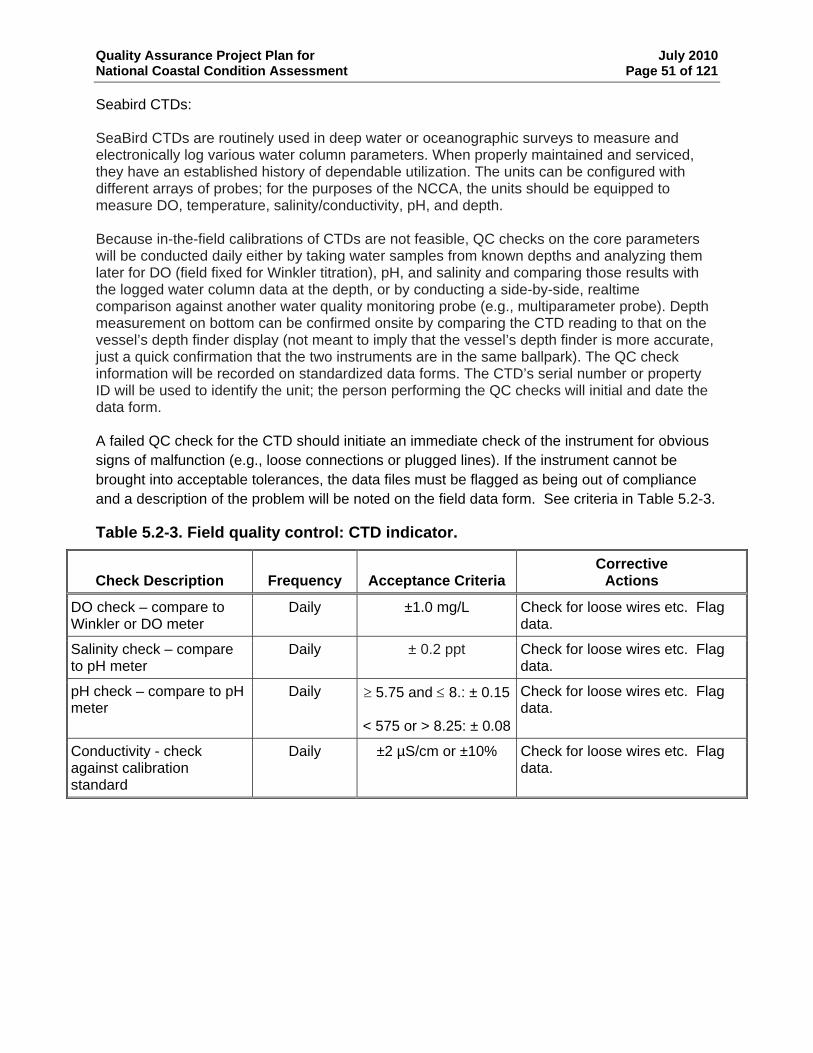
Quality Assurance Project Plan for July 2010 National Coastal Condition Assessment Page 51 of 121
Seabird CTDs: SeaBird CTDs are routinely used in deep water or oceanographic surveys to measure and electronically log various water column parameters. When properly maintained and serviced, they have an established history of dependable utilization. The units can be configured with different arrays of probes; for the purposes of the NCCA, the units should be equipped to measure DO, temperature, salinity/conductivity, pH, and depth. Because in-the-field calibrations of CTDs are not feasible, QC checks on the core parameters will be conducted daily either by taking water samples from known depths and analyzing them later for DO (field fixed for Winkler titration), pH, and salinity and comparing those results with the logged water column data at the depth, or by conducting a side-by-side, realtime comparison against another water quality monitoring probe (e.g., multiparameter probe). Depth measurement on bottom can be confirmed onsite by comparing the CTD reading to that on the vessel’s depth finder display (not meant to imply that the vessel’s depth finder is more accurate, just a quick confirmation that the two instruments are in the same ballpark). The QC check information will be recorded on standardized data forms. The CTD’s serial number or property ID will be used to identify the unit; the person performing the QC checks will initial and date the data form. A failed QC check for the CTD should initiate an immediate check of the instrument for obvious signs of malfunction (e.g., loose connections or plugged lines). If the instrument cannot be brought into acceptable tolerances, the data files must be flagged as being out of compliance and a description of the problem will be noted on the field data form. See criteria in Table 5.2-3.
Table 5.2-3. Field quality control: CTD indicator.
Check Description
Frequency
Acceptance Criteria
Corrective Actions
DO check – compare to Winkler or DO meter
Daily ±1.0 mg/L Check for loose wires etc. Flag data.
Salinity check – compare to pH meter
Daily ± 0.2 ppt Check for loose wires etc. Flag data.
pH check – compare to pH meter
Daily ≥ 5.75 and ≤ 8.: ± 0.15
< 575 or > 8.25: ± 0.08
Check for loose wires etc. Flag data.
Conductivity - check against calibration standard
Daily ±2 µS/cm or ±10% Check for loose wires etc. Flag data.
Quality Assurance Project Plan for July 2010 National Coastal Condition Assessment Page 52 of 121
Multiprobe Profiling Instrument:
Multiprobe instruments require calibration checks on a daily basis during periods of use. The instrument is used to make instantaneous (real time) measurements that are read from a deckside display unit while the probe is lowered and raised at discrete depth intervals (e.g., at 1- m increments) through the water column. Calibration procedures are described in detail in the Operating Manuals (and Performance Manual) of the specific instrument. The units will be used in applications to measure DO, salinity, pH, temperature, and depth. Discussion of the calibration procedures and standards specific to the individual parameters follows. DO will be calibrated by allowing the probe to equilibrate in an air-saturated-with-water environment, which represents 100% DO saturation at conditions of standard atmospheric pressure (760 mm Hg). This environment is established by positioning the polarographic DO sensor in a calibration cup that is filled with freshwater to a level just below the surface of the sensor’s membrane and then placing a lid or cover over the cup to create a saturated humidity. When equilibrium is attained, the operator will activate the instrument to accept the condition as the calibration input for 100% DO saturation. Once calibrated, a properly functioning instrument should hold its DO calibration from day to day with only a slight drift of 2-3% from the 100% saturation standard; drift exceeding that level is indicative of the need to change the membrane and electrolyte solution. The pH probe requires the establishment of a two point calibration curve using two standard buffer solutions to bracket the nominal range of pH expected to be measured. For NCCA 2010, standard buffers of pH 7.0 and 10.0 will be used to calibrate the equipment. The buffer solutions must be commercially supplied with accuracy of ± 0.02 pH units (or better), referenced to NIST SRMs; calibration solutions should be replaced with fresh buffer every 3-4 days. The conductivity/salinity cell will be calibrated using a primary conductivity/seawater standard. A secondary, seawater standard that has had its salinity referenced against a certified standard may be used. These procedures and results data for the preparation of the secondary standard will be logged into a QA notebook that will be maintained by the State Field Coordinators or in-house QA personnel. Salinity of the seawater standard should be generally representative of the conditions expected in the field (e.g., for NCCA 2010, a mid-range salinity, 20-30 ppt). A bulk supply (5 gal) of the secondary standard can be maintained in a central location and field crews should replace their calibration allotments (300- 500 ml portions) with fresh standard every 3-4 days, or at any time that it becomes suspect. The depth sensor (a pressure transducer) is calibrated to 0.0 m of depth while the instrument is non-immersed (absence of water pressure); this in effect becomes the standard for depth calibration. The temperature function of the instruments are set by the manufacturer and can not be adjusted or calibrated in the field. As part of the daily calibration checks, the instrument’s temperature reading will be compared to that of a hand-held laboratory thermometer (accuracy, ±1°C) as a pass/fail screen.
For each of the water quality parameters, the program has established a maximum range of allowable difference that the instrument may deviate from calibration standard (Table 5.2-4). It should be noted that while these limits are acceptable for the purpose of qualifying field
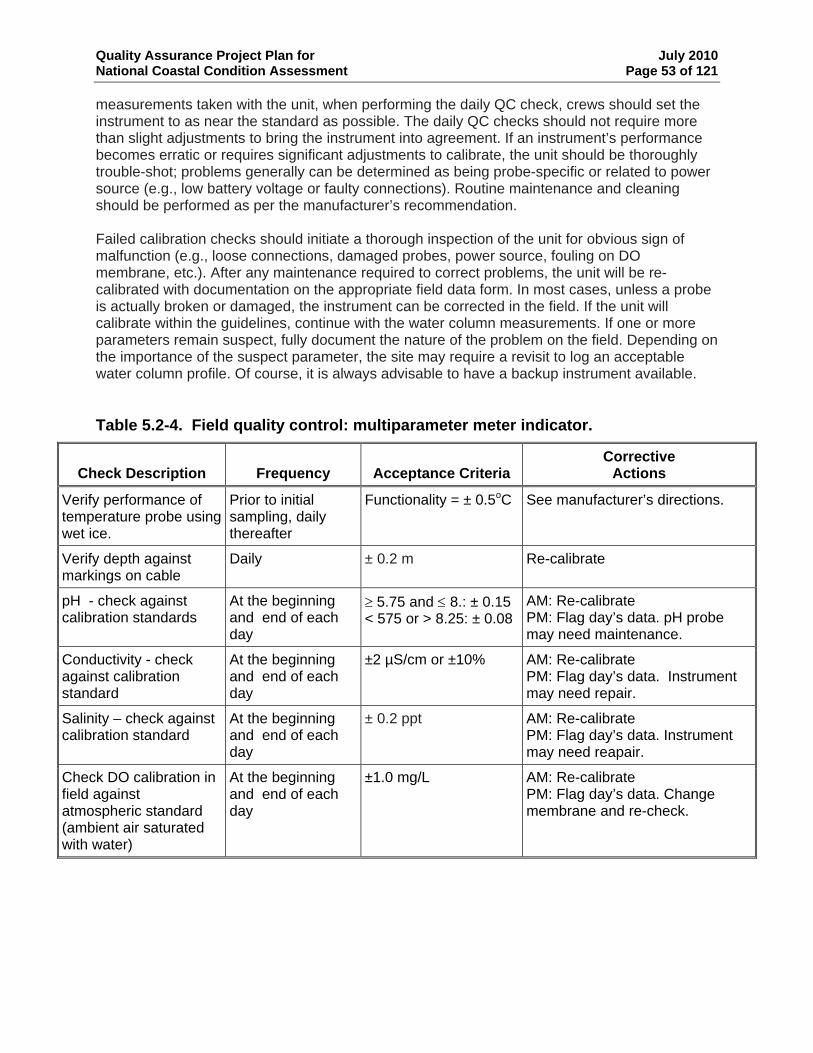
Quality Assurance Project Plan for July 2010 National Coastal Condition Assessment Page 53 of 121
measurements taken with the unit, when performing the daily QC check, crews should set the instrument to as near the standard as possible. The daily QC checks should not require more than slight adjustments to bring the instrument into agreement. If an instrument’s performance becomes erratic or requires significant adjustments to calibrate, the unit should be thoroughly trouble-shot; problems generally can be determined as being probe-specific or related to power source (e.g., low battery voltage or faulty connections). Routine maintenance and cleaning should be performed as per the manufacturer’s recommendation. Failed calibration checks should initiate a thorough inspection of the unit for obvious sign of malfunction (e.g., loose connections, damaged probes, power source, fouling on DO membrane, etc.). After any maintenance required to correct problems, the unit will be re-calibrated with documentation on the appropriate field data form. In most cases, unless a probe is actually broken or damaged, the instrument can be corrected in the field. If the unit will calibrate within the guidelines, continue with the water column measurements. If one or more parameters remain suspect, fully document the nature of the problem on the field. Depending on the importance of the suspect parameter, the site may require a revisit to log an acceptable water column profile. Of course, it is always advisable to have a backup instrument available.
Table 5.2-4. Field quality control: multiparameter meter indicator.
Check Description
Frequency
Acceptance Criteria
Corrective Actions
Verify performance of temperature probe using wet ice.
Prior to initial sampling, daily thereafter
Functionality = ± 0.5oC See manufacturer’s directions.
Verify depth against markings on cable
Daily ± 0.2 m Re-calibrate
pH - check against calibration standards
At the beginning and end of each day
≥ 5.75 and ≤ 8.: ± 0.15 < 575 or > 8.25: ± 0.08
AM: Re-calibrate PM: Flag day’s data. pH probe may need maintenance.
Conductivity - check against calibration standard
At the beginning and end of each day
±2 µS/cm or ±10% AM: Re-calibrate PM: Flag day’s data. Instrument may need repair.
Salinity – check against calibration standard
At the beginning and end of each day
± 0.2 ppt AM: Re-calibrate PM: Flag day’s data. Instrument may need reapair.
Check DO calibration in field against atmospheric standard (ambient air saturated with water)
At the beginning and end of each day
±1.0 mg/L AM: Re-calibrate PM: Flag day’s data. Change membrane and re-check.
Quality Assurance Project Plan for July 2010 National Coastal Condition Assessment Page 54 of 121
LICOR PAR meter:
No daily field calibration procedures are required for the LICOR light meter; however, the manufacturer recommends that the instrument be returned to the factory for bi-annual calibration check and resetting of the calibration coefficient. Calibration kits are available from LICOR and this procedure can be performed at the laboratory (see LICOR operation manual). There are several field QC measures to help ensure taking accurate measurements of light penetration. The “deck” sensor must be situated in full sunlight (i.e., out of any shadows). Likewise, the submerged sensor must be deployed from the sunny side of the vessel and care should be taken to avoid positioning the sensor in the shadow of the vessel. For the comparative light readings of deck and submerged sensors, (ratio of ambient vs. submerged), the time interval between readings should be minimized (approximately 1 sec).
Secchi Disk:
No field calibration procedures are required for the Secchi disk. QC procedures, when using the Secchi disk to make water clarity measurements, include designating a specific crew member as the Secchi depth reader; take all measurements from the shady side of the boat (unlike LICOR measurements which are taken from the sunny side); and do not wear sunglasses when taking Secchi readings.
Underwater Video (Great Lakes only):
No field calibration of camera is required but it should be checked prior to each field day to assure that it is operational. The battery should be charged regularly.
5.2.6. Quality Control Procedures: Laboratory Operations
There are no laboratory operations associated with this indicator.
5.2.7. Data Reporting, Review, and Management
Data reporting units and significant figures are given in Table 5.2-5.
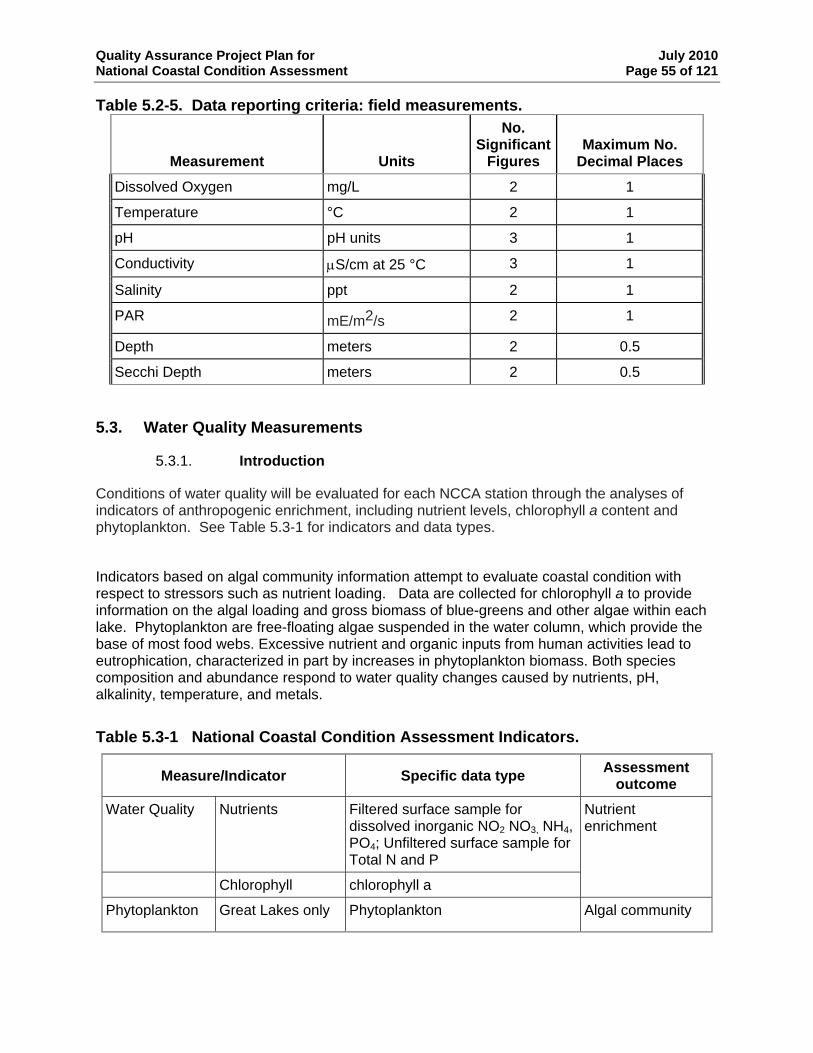
Quality Assurance Project Plan for July 2010 National Coastal Condition Assessment Page 55 of 121
Table 5.2-5. Data reporting criteria: field measurements.
Measurement Units
No. Significant
Figures Maximum No.
Decimal Places
Dissolved Oxygen mg/L 2 1
Temperature °C 2 1
pH pH units 3 1
Conductivity μS/cm at 25 °C 3 1
Salinity ppt 2 1
PAR mE/m2/s 2 1
Depth meters 2 0.5
Secchi Depth meters 2 0.5
5.3. Water Quality Measurements
5.3.1. Introduction
Conditions of water quality will be evaluated for each NCCA station through the analyses of indicators of anthropogenic enrichment, including nutrient levels, chlorophyll a content and phytoplankton. See Table 5.3-1 for indicators and data types.
Indicators based on algal community information attempt to evaluate coastal condition with respect to stressors such as nutrient loading. Data are collected for chlorophyll a to provide information on the algal loading and gross biomass of blue-greens and other algae within each lake. Phytoplankton are free-floating algae suspended in the water column, which provide the base of most food webs. Excessive nutrient and organic inputs from human activities lead to eutrophication, characterized in part by increases in phytoplankton biomass. Both species composition and abundance respond to water quality changes caused by nutrients, pH, alkalinity, temperature, and metals.
Table 5.3-1 National Coastal Condition Assessment Indicators.
Measure/Indicator Specific data type Assessment outcome
Water Quality Nutrients Filtered surface sample for dissolved inorganic NO2 NO3, NH4, PO4; Unfiltered surface sample for Total N and P
Chlorophyll chlorophyll a
Nutrient enrichment
Phytoplankton Great Lakes only Phytoplankton Algal community
Quality Assurance Project Plan for July 2010 National Coastal Condition Assessment Page 56 of 121
The Field Operations Manual (EPA, 2010A) contains a step by step process used to archive video footage. Video file names use the following format: DVRyymmdd_hhmm_xxx.avi.
5.3.2. Sampling Design
Water chemistry and phytoplankton (Great Lakes only) samples are collected at the index site. At a discrete depth of 0.5 m.
5.3.3. Sampling and Analytical Methods
Collection: Sample collection using a Van Dorn sampler, Niskin bottle or peristaltic pump will be followed by field processing of chlorophyll a and soluble nutrient samples. From the sampler, two bottles will be filled; a 250 mL brown Nalgene bottle for total nutrients and a 2-liter wide-mouth brown Nalgene container for chlorophyll and soluble nutrients. At Great Lakes sites a 1 L brown Nalgene bottle will be filled and 2 mL of Lugol’s solution will be added within 2 hours of sample collection for phytoplankton. Filtration: Chlorophyll and dissolved nutrients samples will be obtained by filtering site water (collected at the depth regimes described in Section 5.3.2) and retaining the filter with filtered material for the analyses of chlorophyll a; the filtrate will be used for the analyses of soluble nutrients. Chlorophyll samples will be collected by filtering up to 2 L of site water (or sufficient volume to produce a visible green residue on the filter) through the 47 mm GFF; the volume of sample water filtered must be recorded on the field data form and on the label on the centrifuge tube in which the filter is stored. After filtration, the filter is kept frozen in a tin-foil covered centrifuge tube. It is shipped to the laboratory on wet ice. The dissolved nutrient sample will be collected by pouring approximately 200 ml of the filtrate into a clean 250 ml Nalgene bottle. The sample will be capped and placed on ice until it is shipped to the laboratory. Detailed procedures for sample collection and processing are described in the Field Operations Manual (EPA, 2010A).
Laboratory:
The basic laboratory methods for these analyses will be:
chlorophyll a analysis - acetone extraction, fluorometric analysis total and soluble nutrients - spectrophotometry (autoanalyzer)
Phytoplankton identification and enumeration
Quality Assurance Project Plan for July 2010 National Coastal Condition Assessment Page 57 of 121
Nutrient Chemistry: The analytical method for both saltwater and freshwater ammonia samples is based upon the indophenol reaction adapted to automated gas-segmented continuous flow analysis. Freshwater ammonia samples are buffered at a pH of 9.5 with a borate buffer in order to decrease hydrolysis of cyanates and organic nitrogen compounds, and are distilled into a solution of boric acid. To obtain a nitrate concentration, a sample is passed through a column containing granulated copper/cadmium to reduce nitrate to nitrite. The nitrite (that was originally present plus reduced nitrate) is determined by diazotizing with sulfanilamide and coupling with N-(1-naphthyl)-ethylenediamine dihydrochloride to form a highly colored azo dye which is measured colorimetrically. The recommended method for total nitrogen is persulfate digestion followed by analysis by cadmium reduction. The cadmium column reduces nitrate to nitrite which is determined by diazotization with sulfanilamide. As an alternative, total nitrogen can be calculated by adding the total kjeldahl nitrogen (TKN) result to the nitrate+nitrite-as-nitrogen result. The TKN procedure converts nitrogen components of biological origin such as amino acids, proteins and peptides to ammonia. The sample is heated in the presence of sulfuric acid, H2SO4, cooled, diluted and analyzed for ammonia. For both undigested orthophosphate samples and digested total phosphorus samples, ammonium molybdate and antimony potassium tartrate react in an acid medium with dilute solutions of phosphorus to form an antimony-phosphomolybdate complex. This complex is reduced to an intensely blue-colored complex by ascorbic acid. The color is proportional to the phosphorus concentration. Total phosphorus in both freshwater and saltwater requires a manual persulfate digestion to convert organic phosphorus compounds to orthophosphate. Chlorophyll: Chlorophyll a content of phytoplankton filtered from a known volume of site-collected water will be analyzed fluorometrically in the laboratory. The recommended method is a non-acidification variation of EPA Method 445.0: “In Vitro Determination of Chlorophyll a and Pheophytin a in Marine and Freshwater Phytoplankton by Fluorescence” (Arar and Collins, 1992). Pigments are extracted from the filter with 90 % acetone, with the aid of a mechanical tissue grinder. Fluorescence of the extract is measured to determine chlorophyll a concentration. Phytoplankton: The modified utermohl method will be used for phytoplankton samples. This involves a microscopic examination of a preserved watr sample for soft bodied algae and a second examination is performed on a cleaned diatom preparation for identification and enumeration.
5.3.4. Quality Assurance Objectives
MQOs are given in Table 5.3-2 and 5.3-3. General requirements for comparability and representativeness are addressed in Section 2. The MQOs given in Table 5.3-2 and 5.3-3 represent the maximum allowable criteria for statistical control purposes. LT-MDLs are
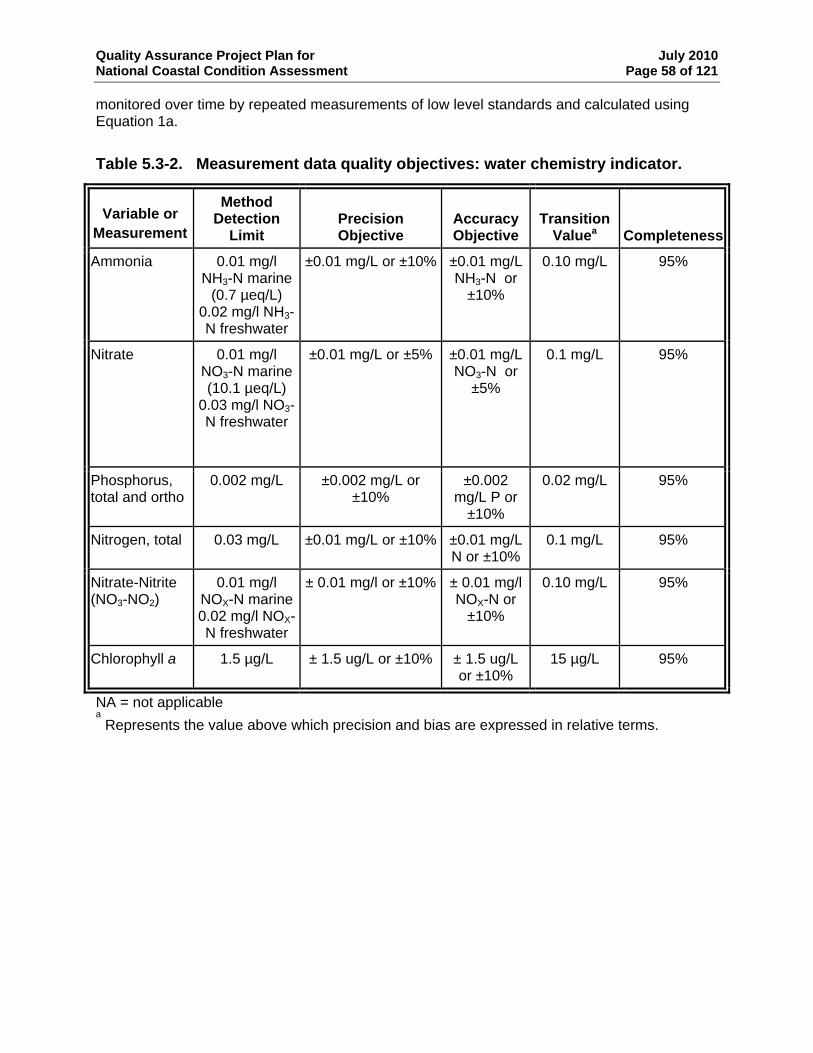
Quality Assurance Project Plan for July 2010 National Coastal Condition Assessment Page 58 of 121
monitored over time by repeated measurements of low level standards and calculated using Equation 1a.
Table 5.3-2. Measurement data quality objectives: water chemistry indicator.
Variable or Measurement
Method Detection
Limit Precision Objective
Accuracy Objective
Transition Valuea Completeness
Ammonia 0.01 mg/l NH3-N marine
(0.7 µeq/L) 0.02 mg/l NH3-N freshwater
±0.01 mg/L or ±10% ±0.01 mg/L NH3-N or
±10%
0.10 mg/L 95%
Nitrate 0.01 mg/l NO3-N marine (10.1 µeq/L)
0.03 mg/l NO3-N freshwater
±0.01 mg/L or ±5% ±0.01 mg/L NO3-N or
±5%
0.1 mg/L 95%
Phosphorus, total and ortho
0.002 mg/L ±0.002 mg/L or ±10%
±0.002 mg/L P or
±10%
0.02 mg/L 95%
Nitrogen, total 0.03 mg/L ±0.01 mg/L or ±10% ±0.01 mg/L N or ±10%
0.1 mg/L 95%
Nitrate-Nitrite (NO3-NO2)
0.01 mg/l NOX-N marine 0.02 mg/l NOX-N freshwater
± 0.01 mg/l or ±10% ± 0.01 mg/l NOX-N or
±10%
0.10 mg/L 95%
Chlorophyll a 1.5 µg/L ± 1.5 ug/L or ±10% ± 1.5 ug/L or ±10%
15 µg/L 95%
NA = not applicable a Represents the value above which precision and bias are expressed in relative terms.
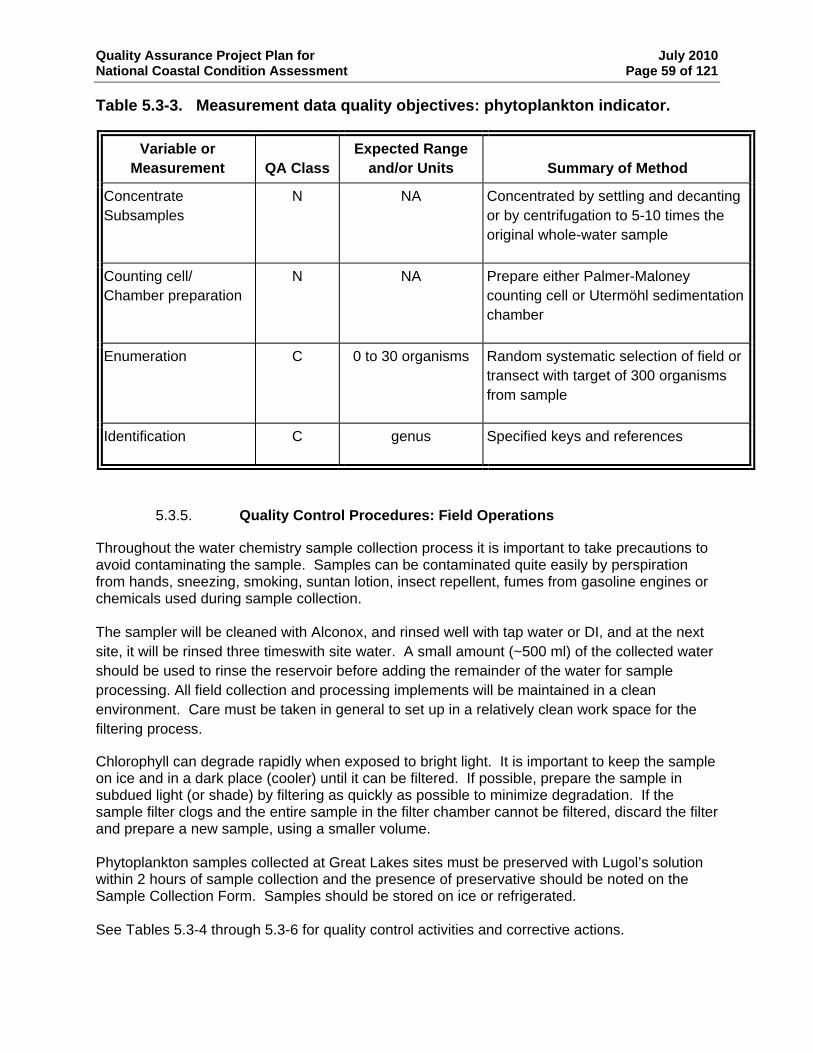
Quality Assurance Project Plan for July 2010 National Coastal Condition Assessment Page 59 of 121
Table 5.3-3. Measurement data quality objectives: phytoplankton indicator.
Variable or Measurement QA Class
Expected Range and/or Units Summary of Method
Concentrate Subsamples
N NA Concentrated by settling and decanting or by centrifugation to 5-10 times the original whole-water sample
Counting cell/ Chamber preparation
N NA Prepare either Palmer-Maloney counting cell or Utermöhl sedimentation chamber
Enumeration C 0 to 30 organisms Random systematic selection of field or transect with target of 300 organisms from sample
Identification C genus Specified keys and references
5.3.5. Quality Control Procedures: Field Operations
Throughout the water chemistry sample collection process it is important to take precautions to avoid contaminating the sample. Samples can be contaminated quite easily by perspiration from hands, sneezing, smoking, suntan lotion, insect repellent, fumes from gasoline engines or chemicals used during sample collection. The sampler will be cleaned with Alconox, and rinsed well with tap water or DI, and at the next site, it will be rinsed three timeswith site water. A small amount (~500 ml) of the collected water should be used to rinse the reservoir before adding the remainder of the water for sample processing. All field collection and processing implements will be maintained in a clean environment. Care must be taken in general to set up in a relatively clean work space for the filtering process.
Chlorophyll can degrade rapidly when exposed to bright light. It is important to keep the sample on ice and in a dark place (cooler) until it can be filtered. If possible, prepare the sample in subdued light (or shade) by filtering as quickly as possible to minimize degradation. If the sample filter clogs and the entire sample in the filter chamber cannot be filtered, discard the filter and prepare a new sample, using a smaller volume. Phytoplankton samples collected at Great Lakes sites must be preserved with Lugol’s solution within 2 hours of sample collection and the presence of preservative should be noted on the Sample Collection Form. Samples should be stored on ice or refrigerated. See Tables 5.3-4 through 5.3-6 for quality control activities and corrective actions.
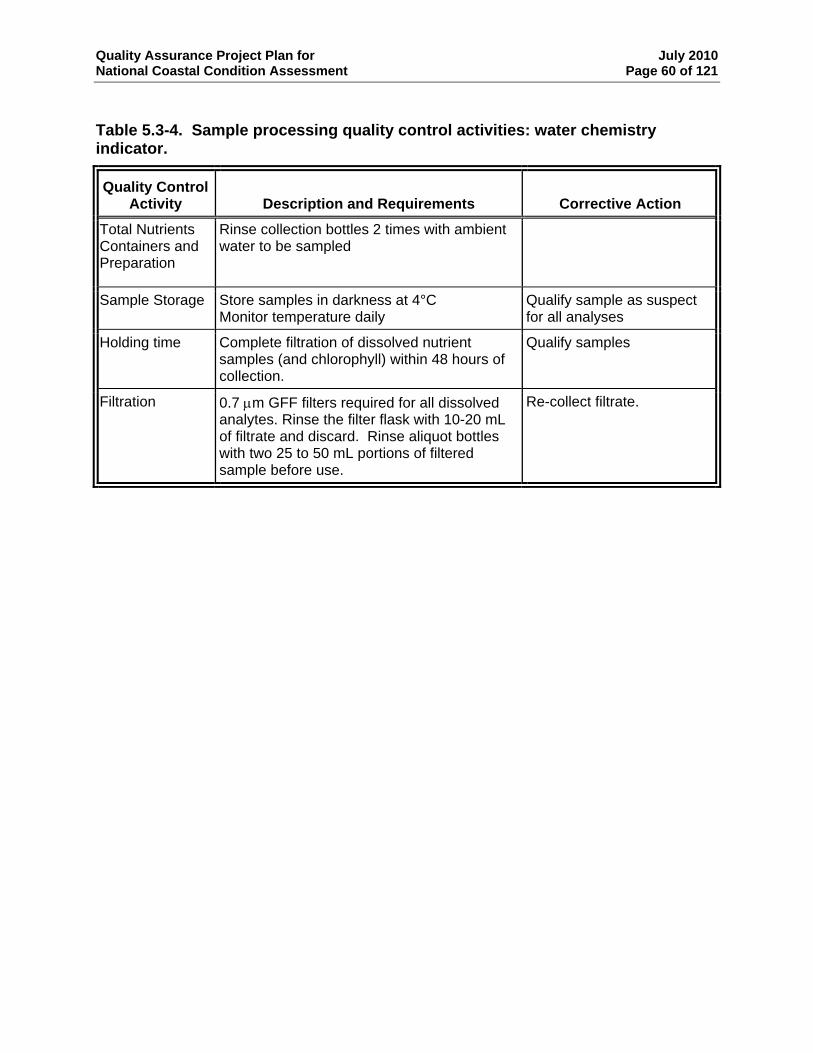
Quality Assurance Project Plan for July 2010 National Coastal Condition Assessment Page 60 of 121
Table 5.3-4. Sample processing quality control activities: water chemistry indicator.
Quality Control Activity Description and Requirements Corrective Action
Total Nutrients Containers and Preparation
Rinse collection bottles 2 times with ambient water to be sampled
Sample Storage Store samples in darkness at 4°C Monitor temperature daily
Qualify sample as suspect for all analyses
Holding time Complete filtration of dissolved nutrient samples (and chlorophyll) within 48 hours of collection.
Qualify samples
Filtration 0.7 μm GFF filters required for all dissolved analytes. Rinse the filter flask with 10-20 mL of filtrate and discard. Rinse aliquot bottles with two 25 to 50 mL portions of filtered sample before use.
Re-collect filtrate.
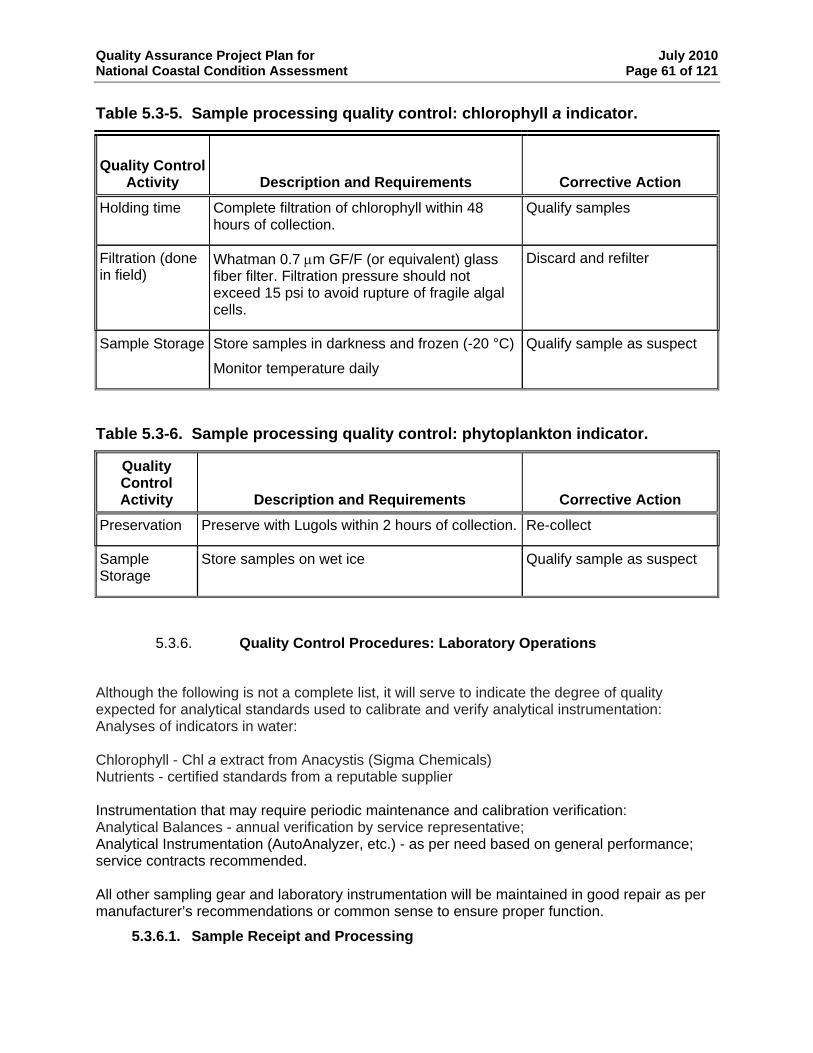
Quality Assurance Project Plan for July 2010 National Coastal Condition Assessment Page 61 of 121
Table 5.3-5. Sample processing quality control: chlorophyll a indicator.
Quality Control Activity
Description and Requirements
Corrective Action
Holding time Complete filtration of chlorophyll within 48 hours of collection.
Qualify samples
Filtration (done in field)
Whatman 0.7 μm GF/F (or equivalent) glass fiber filter. Filtration pressure should not exceed 15 psi to avoid rupture of fragile algal cells.
Discard and refilter
Sample Storage Store samples in darkness and frozen (-20 °C)
Monitor temperature daily
Qualify sample as suspect
Table 5.3-6. Sample processing quality control: phytoplankton indicator.
Quality Control Activity
Description and Requirements
Corrective Action
Preservation Preserve with Lugols within 2 hours of collection. Re-collect
Sample Storage
Store samples on wet ice Qualify sample as suspect
5.3.6. Quality Control Procedures: Laboratory Operations
Although the following is not a complete list, it will serve to indicate the degree of quality expected for analytical standards used to calibrate and verify analytical instrumentation: Analyses of indicators in water: Chlorophyll - Chl a extract from Anacystis (Sigma Chemicals) Nutrients - certified standards from a reputable supplier Instrumentation that may require periodic maintenance and calibration verification: Analytical Balances - annual verification by service representative; Analytical Instrumentation (AutoAnalyzer, etc.) - as per need based on general performance; service contracts recommended. All other sampling gear and laboratory instrumentation will be maintained in good repair as per manufacturer’s recommendations or common sense to ensure proper function.
5.3.6.1. Sample Receipt and Processing
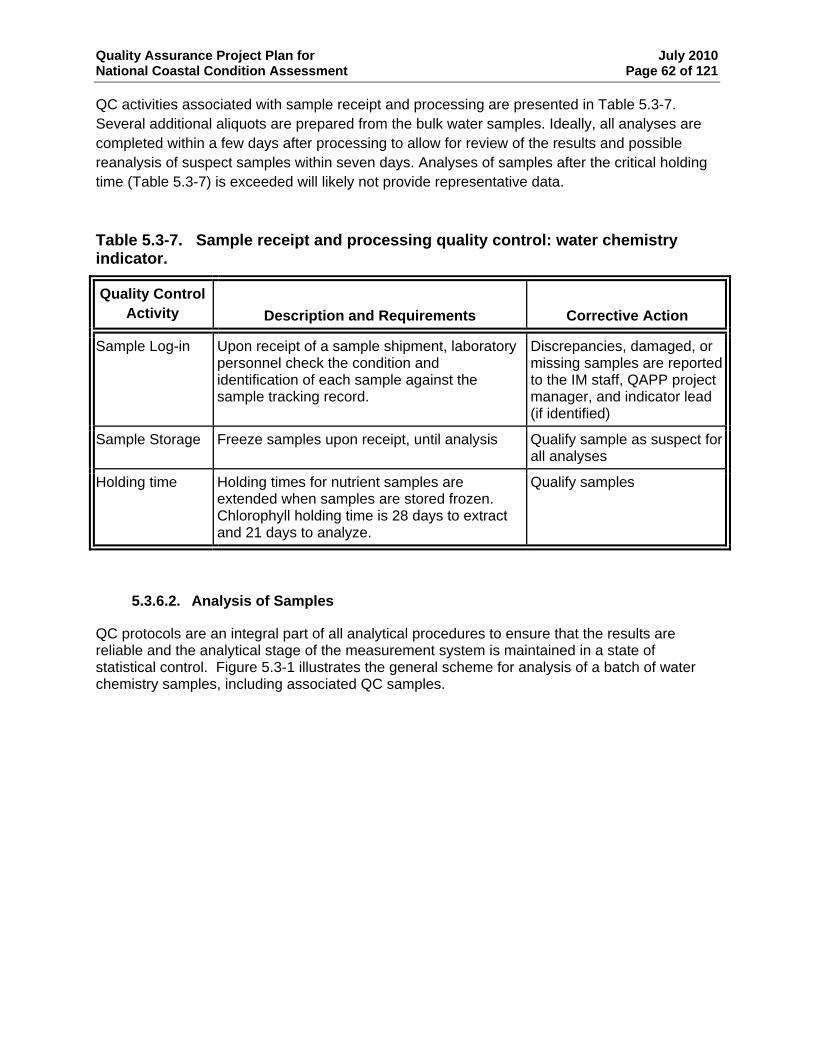
Quality Assurance Project Plan for July 2010 National Coastal Condition Assessment Page 62 of 121
QC activities associated with sample receipt and processing are presented in Table 5.3-7. Several additional aliquots are prepared from the bulk water samples. Ideally, all analyses are completed within a few days after processing to allow for review of the results and possible reanalysis of suspect samples within seven days. Analyses of samples after the critical holding time (Table 5.3-7) is exceeded will likely not provide representative data.
Table 5.3-7. Sample receipt and processing quality control: water chemistry indicator.
Quality Control Activity Description and Requirements Corrective Action
Sample Log-in Upon receipt of a sample shipment, laboratory personnel check the condition and identification of each sample against the sample tracking record.
Discrepancies, damaged, or missing samples are reported to the IM staff, QAPP project manager, and indicator lead (if identified)
Sample Storage Freeze samples upon receipt, until analysis Qualify sample as suspect for all analyses
Holding time Holding times for nutrient samples are extended when samples are stored frozen. Chlorophyll holding time is 28 days to extract and 21 days to analyze.
Qualify samples
5.3.6.2. Analysis of Samples
QC protocols are an integral part of all analytical procedures to ensure that the results are reliable and the analytical stage of the measurement system is maintained in a state of statistical control. Figure 5.3-1 illustrates the general scheme for analysis of a batch of water chemistry samples, including associated QC samples.
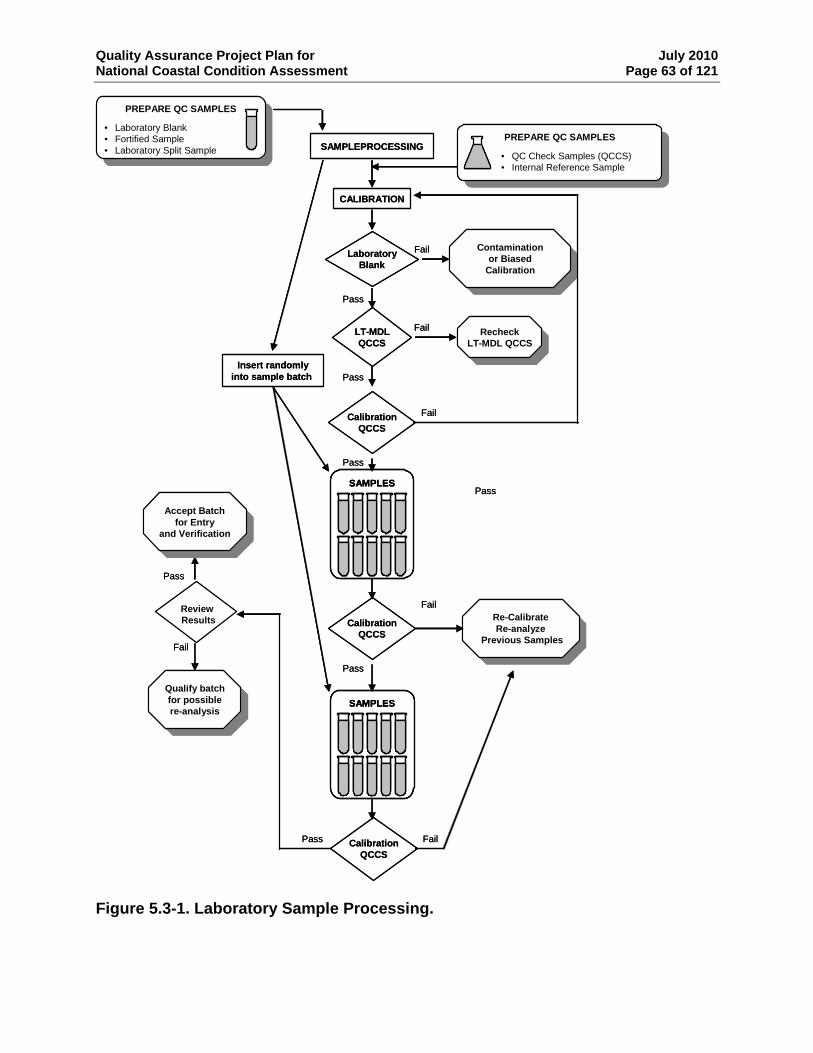
Quality Assurance Project Plan for July 2010 National Coastal Condition Assessment Page 63 of 121
PREPARE QC SAMPLESPREPARE QC SAMPLES
PREPARE QC SAMPLESPREPARE QC SAMPLES
SAMPLEPROCESSING
Contaminationor Biased
Calibration
Contaminationor Biased
Calibration
RecheckLT-MDL QCCS
RecheckLT-MDL QCCS
Re-CalibrateRe-analyze
Previous Samples
Re-CalibrateRe-analyze
Previous Samples
Insert randomlyinto sample batch
Qualify batchfor possiblere-analysis
Qualify batchfor possiblere-analysis
Accept Batchfor Entry
and Verification
Accept Batchfor Entry
and Verification
Pass
Pass
Pass
Pass
Pass
Pass
Fail
Fail
Fail
• Laboratory Blank• Fortified Sample• Laboratory Split Sample • QC Check Samples (QCCS)
• Internal Reference Sample
CALIBRATION
LaboratoryBlank
LT-MDLQCCS
CalibrationQCCS
Fail
CalibrationQCCS
Fail
Pass CalibrationQCCS
Fail
SAMPLES
Review Results
SAMPLES
PREPARE QC SAMPLESPREPARE QC SAMPLES
PREPARE QC SAMPLESPREPARE QC SAMPLES
SAMPLEPROCESSING
Contaminationor Biased
Calibration
Contaminationor Biased
Calibration
RecheckLT-MDL QCCS
RecheckLT-MDL QCCS
Re-CalibrateRe-analyze
Previous Samples
Re-CalibrateRe-analyze
Previous Samples
Insert randomlyinto sample batch
Qualify batchfor possiblere-analysis
Qualify batchfor possiblere-analysis
Accept Batchfor Entry
and Verification
Accept Batchfor Entry
and Verification
Pass
Pass
Pass
Pass
Pass
Pass
Fail
Fail
Fail
• Laboratory Blank• Fortified Sample• Laboratory Split Sample • QC Check Samples (QCCS)
• Internal Reference Sample
CALIBRATION
LaboratoryBlank
LT-MDLQCCS
CalibrationQCCS
Fail
CalibrationQCCS
Fail
Pass CalibrationQCCS
Fail
SAMPLESSAMPLES
Review Results
SAMPLESSAMPLES
Figure 5.3-1. Laboratory Sample Processing.
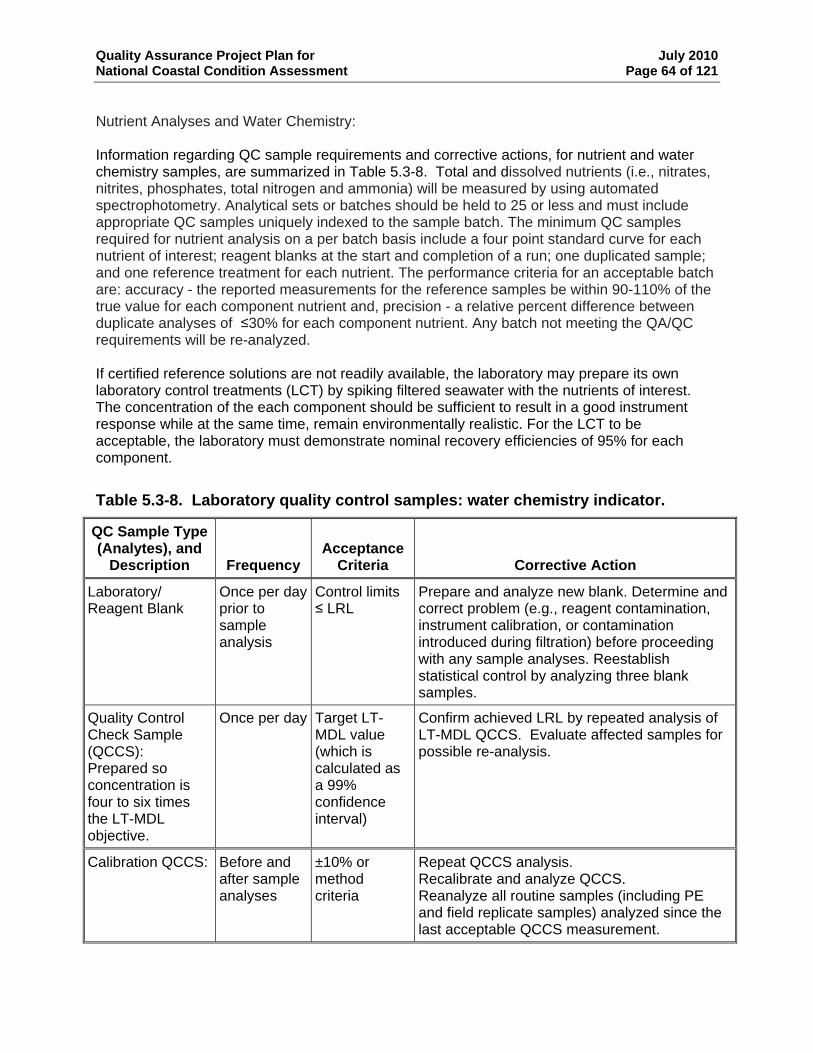
Quality Assurance Project Plan for July 2010 National Coastal Condition Assessment Page 64 of 121
Nutrient Analyses and Water Chemistry: Information regarding QC sample requirements and corrective actions, for nutrient and water chemistry samples, are summarized in Table 5.3-8. Total and dissolved nutrients (i.e., nitrates, nitrites, phosphates, total nitrogen and ammonia) will be measured by using automated spectrophotometry. Analytical sets or batches should be held to 25 or less and must include appropriate QC samples uniquely indexed to the sample batch. The minimum QC samples required for nutrient analysis on a per batch basis include a four point standard curve for each nutrient of interest; reagent blanks at the start and completion of a run; one duplicated sample; and one reference treatment for each nutrient. The performance criteria for an acceptable batch are: accuracy - the reported measurements for the reference samples be within 90-110% of the true value for each component nutrient and, precision - a relative percent difference between duplicate analyses of ≤30% for each component nutrient. Any batch not meeting the QA/QC requirements will be re-analyzed. If certified reference solutions are not readily available, the laboratory may prepare its own laboratory control treatments (LCT) by spiking filtered seawater with the nutrients of interest. The concentration of the each component should be sufficient to result in a good instrument response while at the same time, remain environmentally realistic. For the LCT to be acceptable, the laboratory must demonstrate nominal recovery efficiencies of 95% for each component.
Table 5.3-8. Laboratory quality control samples: water chemistry indicator.
QC Sample Type (Analytes), and
Description Frequency Acceptance
Criteria Corrective Action
Laboratory/ Once per day Control limits Prepare and analyze new blank. Determine and Reagent Blank prior to
sample analysis
≤ LRL correct problem (e.g., reagent contamination, instrument calibration, or contamination introduced during filtration) before proceeding with any sample analyses. Reestablish statistical control by analyzing three blank samples.
Quality Control Once per day Target LT- Confirm achieved LRL by repeated analysis of Check Sample MDL value LT-MDL QCCS. Evaluate affected samples for (QCCS): (which is possible re-analysis. Prepared so calculated as concentration is a 99% four to six times confidence the LT-MDL interval) objective.
Calibration QCCS:
Before and after sample analyses
±10% or method criteria
Repeat QCCS analysis. Recalibrate and analyze QCCS. Reanalyze all routine samples (including PE and field replicate samples) analyzed since the last acceptable QCCS measurement.
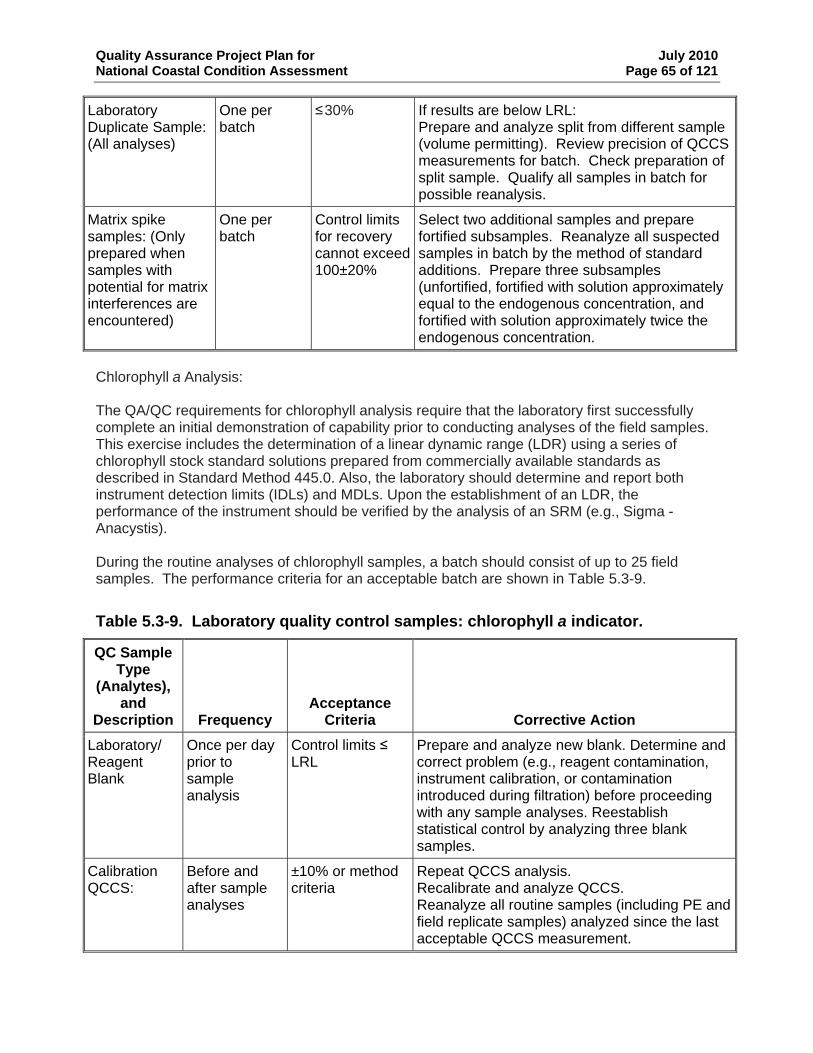
Quality Assurance Project Plan for July 2010 National Coastal Condition Assessment Page 65 of 121
Laboratory Duplicate Sample: (All analyses)
One per batch
≤30% If results are below LRL: Prepare and analyze split from different sample (volume permitting). Review precision of QCCS measurements for batch. Check preparation of split sample. Qualify all samples in batch for possible reanalysis.
Matrix spike samples: (Only prepared when samples with potential for matrix interferences are encountered)
One per batch
Control limits for recovery cannot exceed 100±20%
Select two additional samples and prepare fortified subsamples. Reanalyze all suspected samples in batch by the method of standard additions. Prepare three subsamples (unfortified, fortified with solution approximately equal to the endogenous concentration, and fortified with solution approximately twice the endogenous concentration.
Chlorophyll a Analysis: The QA/QC requirements for chlorophyll analysis require that the laboratory first successfully complete an initial demonstration of capability prior to conducting analyses of the field samples. This exercise includes the determination of a linear dynamic range (LDR) using a series of chlorophyll stock standard solutions prepared from commercially available standards as described in Standard Method 445.0. Also, the laboratory should determine and report both instrument detection limits (IDLs) and MDLs. Upon the establishment of an LDR, the performance of the instrument should be verified by the analysis of an SRM (e.g., Sigma - Anacystis). During the routine analyses of chlorophyll samples, a batch should consist of up to 25 field samples. The performance criteria for an acceptable batch are shown in Table 5.3-9.
Table 5.3-9. Laboratory quality control samples: chlorophyll a indicator.
QC Sample Type
(Analytes), and
Description Frequency Acceptance
Criteria Corrective Action Laboratory/ Reagent Blank
Once per day prior to sample analysis
Control limits ≤ LRL
Prepare and analyze new blank. Determine and correct problem (e.g., reagent contamination, instrument calibration, or contamination introduced during filtration) before proceeding with any sample analyses. Reestablish statistical control by analyzing three blank samples.
Calibration QCCS:
Before and after sample analyses
±10% or method criteria
Repeat QCCS analysis. Recalibrate and analyze QCCS. Reanalyze all routine samples (including PE and field replicate samples) analyzed since the last acceptable QCCS measurement.
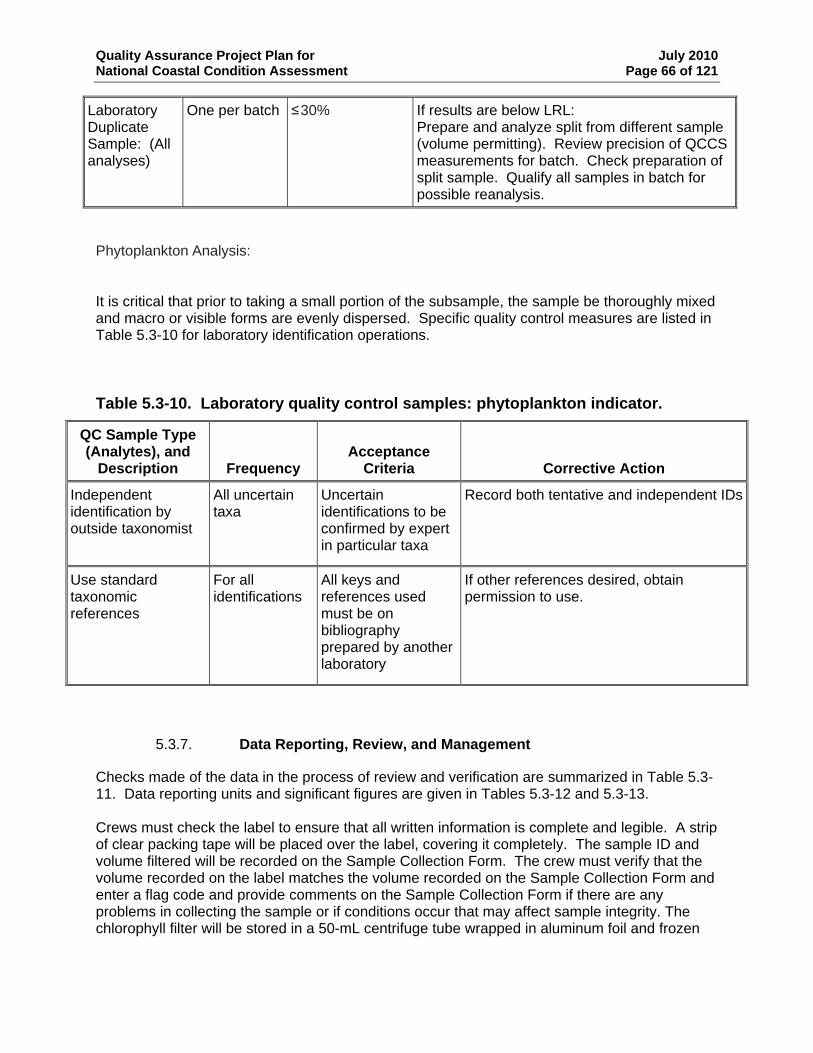
Quality Assurance Project Plan for July 2010 National Coastal Condition Assessment Page 66 of 121
Laboratory Duplicate Sample: (All analyses)
One per batch ≤30% If results are below LRL: Prepare and analyze split from different sample (volume permitting). Review precision of QCCS measurements for batch. Check preparation of split sample. Qualify all samples in batch for possible reanalysis.
Phytoplankton Analysis:
It is critical that prior to taking a small portion of the subsample, the sample be thoroughly mixed and macro or visible forms are evenly dispersed. Specific quality control measures are listed in Table 5.3-10 for laboratory identification operations.
Table 5.3-10. Laboratory quality control samples: phytoplankton indicator.
QC Sample Type (Analytes), and
Description Frequency Acceptance
Criteria Corrective Action
Independent identification by outside taxonomist
All uncertain taxa
Uncertain identifications to be confirmed by expert in particular taxa
Record both tentative and independent IDs
Use standard taxonomic references
For all identifications
All keys and references used must be on bibliography prepared by another laboratory
If other references desired, obtain permission to use.
5.3.7. Data Reporting, Review, and Management
Checks made of the data in the process of review and verification are summarized in Table 5.3-11. Data reporting units and significant figures are given in Tables 5.3-12 and 5.3-13. Crews must check the label to ensure that all written information is complete and legible. A strip of clear packing tape will be placed over the label, covering it completely. The sample ID and volume filtered will be recorded on the Sample Collection Form. The crew must verify that the volume recorded on the label matches the volume recorded on the Sample Collection Form and enter a flag code and provide comments on the Sample Collection Form if there are any problems in collecting the sample or if conditions occur that may affect sample integrity. The chlorophyll filter will be stored in a 50-mL centrifuge tube wrapped in aluminum foil and frozen
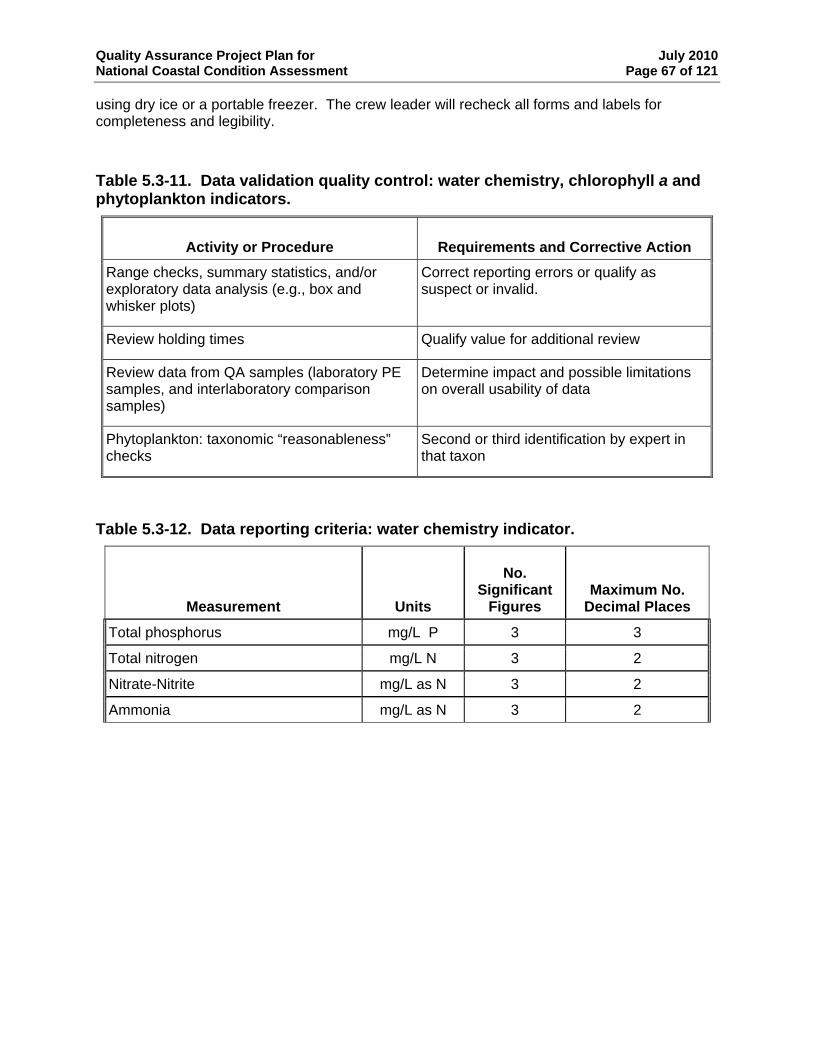
Quality Assurance Project Plan for July 2010 National Coastal Condition Assessment Page 67 of 121
using dry ice or a portable freezer. The crew leader will recheck all forms and labels for completeness and legibility.
Table 5.3-11. Data validation quality control: water chemistry, chlorophyll a and phytoplankton indicators.
Activity or Procedure Requirements and Corrective Action Range checks, summary statistics, and/or exploratory data analysis (e.g., box and whisker plots)
Correct reporting errors or qualify as suspect or invalid.
Review holding times Qualify value for additional review
Review data from QA samples (laboratory PE samples, and interlaboratory comparison samples)
Determine impact and possible limitations on overall usability of data
Phytoplankton: taxonomic “reasonableness” checks
Second or third identification by expert in that taxon
Table 5.3-12. Data reporting criteria: water chemistry indicator.
Measurement Units
No. Significant
Figures Maximum No.
Decimal Places
Total phosphorus mg/L P 3 3
Total nitrogen mg/L N 3 2
Nitrate-Nitrite mg/L as N 3 2
Ammonia mg/L as N 3 2
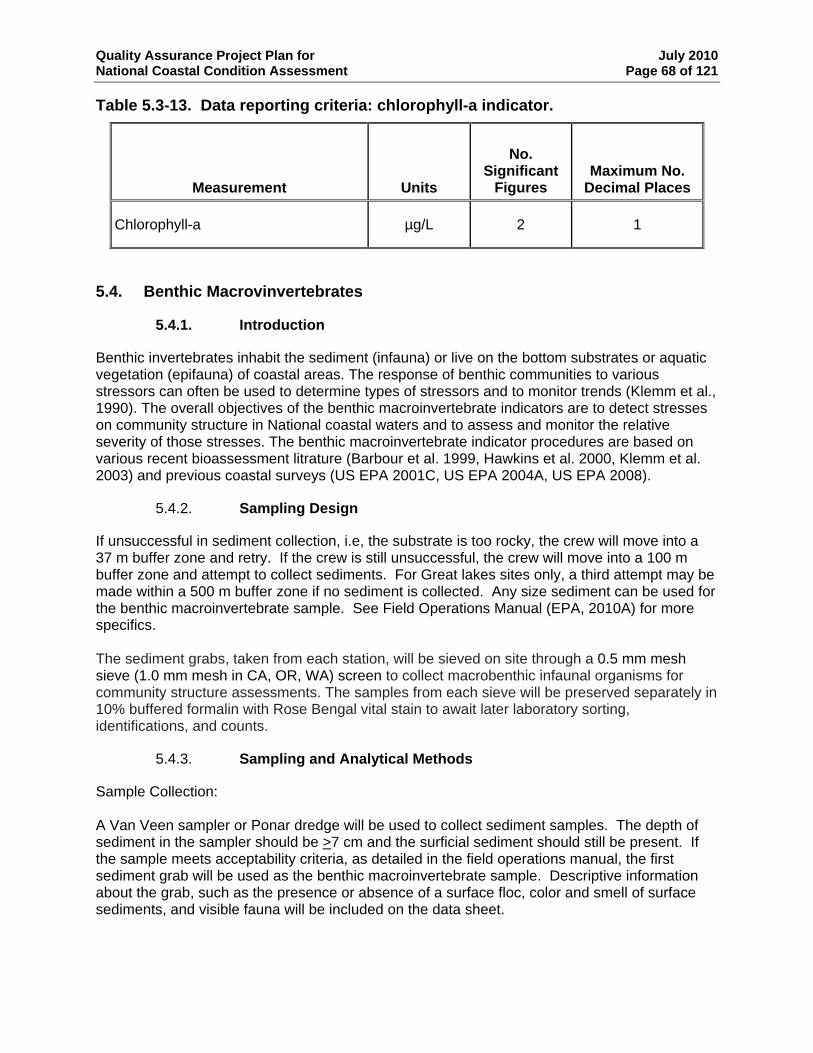
Quality Assurance Project Plan for July 2010 National Coastal Condition Assessment Page 68 of 121
Table 5.3-13. Data reporting criteria: chlorophyll-a indicator.
Measurement Units
No. Significant
Figures Maximum No.
Decimal Places
Chlorophyll-a µg/L 2 1
5.4. Benthic Macrovinvertebrates
5.4.1. Introduction
Benthic invertebrates inhabit the sediment (infauna) or live on the bottom substrates or aquatic vegetation (epifauna) of coastal areas. The response of benthic communities to various stressors can often be used to determine types of stressors and to monitor trends (Klemm et al., 1990). The overall objectives of the benthic macroinvertebrate indicators are to detect stresses on community structure in National coastal waters and to assess and monitor the relative severity of those stresses. The benthic macroinvertebrate indicator procedures are based on various recent bioassessment litrature (Barbour et al. 1999, Hawkins et al. 2000, Klemm et al. 2003) and previous coastal surveys (US EPA 2001C, US EPA 2004A, US EPA 2008).
5.4.2. Sampling Design
If unsuccessful in sediment collection, i.e, the substrate is too rocky, the crew will move into a 37 m buffer zone and retry. If the crew is still unsuccessful, the crew will move into a 100 m buffer zone and attempt to collect sediments. For Great lakes sites only, a third attempt may be made within a 500 m buffer zone if no sediment is collected. Any size sediment can be used for the benthic macroinvertebrate sample. See Field Operations Manual (EPA, 2010A) for more specifics. The sediment grabs, taken from each station, will be sieved on site through a 0.5 mm mesh sieve (1.0 mm mesh in CA, OR, WA) screen to collect macrobenthic infaunal organisms for community structure assessments. The samples from each sieve will be preserved separately in 10% buffered formalin with Rose Bengal vital stain to await later laboratory sorting, identifications, and counts.
5.4.3. Sampling and Analytical Methods
Sample Collection: A Van Veen sampler or Ponar dredge will be used to collect sediment samples. The depth of sediment in the sampler should be >7 cm and the surficial sediment should still be present. If the sample meets acceptability criteria, as detailed in the field operations manual, the first sediment grab will be used as the benthic macroinvertebrate sample. Descriptive information about the grab, such as the presence or absence of a surface floc, color and smell of surface sediments, and visible fauna will be included on the data sheet.
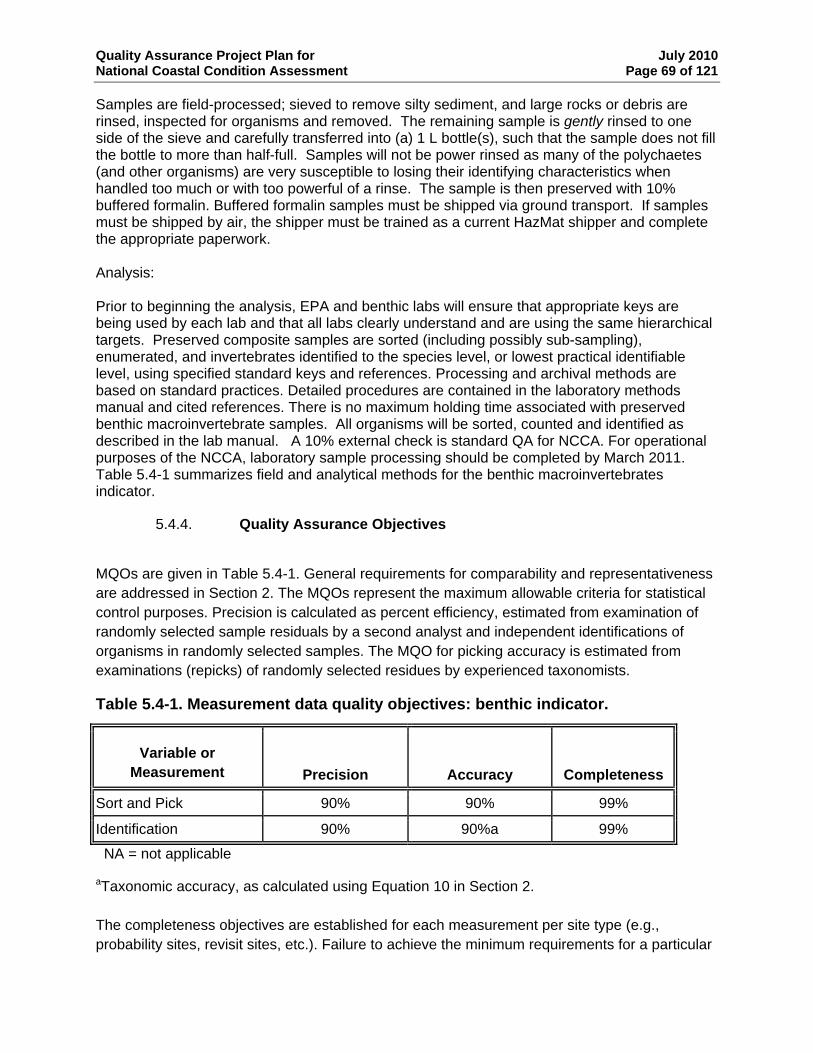
Quality Assurance Project Plan for July 2010 National Coastal Condition Assessment Page 69 of 121
Samples are field-processed; sieved to remove silty sediment, and large rocks or debris are rinsed, inspected for organisms and removed. The remaining sample is gently rinsed to one side of the sieve and carefully transferred into (a) 1 L bottle(s), such that the sample does not fill the bottle to more than half-full. Samples will not be power rinsed as many of the polychaetes (and other organisms) are very susceptible to losing their identifying characteristics when handled too much or with too powerful of a rinse. The sample is then preserved with 10% buffered formalin. Buffered formalin samples must be shipped via ground transport. If samples must be shipped by air, the shipper must be trained as a current HazMat shipper and complete the appropriate paperwork. Analysis: Prior to beginning the analysis, EPA and benthic labs will ensure that appropriate keys are being used by each lab and that all labs clearly understand and are using the same hierarchical targets. Preserved composite samples are sorted (including possibly sub-sampling), enumerated, and invertebrates identified to the species level, or lowest practical identifiable level, using specified standard keys and references. Processing and archival methods are based on standard practices. Detailed procedures are contained in the laboratory methods manual and cited references. There is no maximum holding time associated with preserved benthic macroinvertebrate samples. All organisms will be sorted, counted and identified as described in the lab manual. A 10% external check is standard QA for NCCA. For operational purposes of the NCCA, laboratory sample processing should be completed by March 2011. Table 5.4-1 summarizes field and analytical methods for the benthic macroinvertebrates indicator.
5.4.4. Quality Assurance Objectives
MQOs are given in Table 5.4-1. General requirements for comparability and representativeness are addressed in Section 2. The MQOs represent the maximum allowable criteria for statistical control purposes. Precision is calculated as percent efficiency, estimated from examination of randomly selected sample residuals by a second analyst and independent identifications of organisms in randomly selected samples. The MQO for picking accuracy is estimated from examinations (repicks) of randomly selected residues by experienced taxonomists.
Table 5.4-1. Measurement data quality objectives: benthic indicator.
Variable or Measurement Precision Accuracy Completeness
Sort and Pick 90% 90% 99%
Identification 90% 90%a 99%
NA = not applicable
aTaxonomic accuracy, as calculated using Equation 10 in Section 2. The completeness objectives are established for each measurement per site type (e.g., probability sites, revisit sites, etc.). Failure to achieve the minimum requirements for a particular
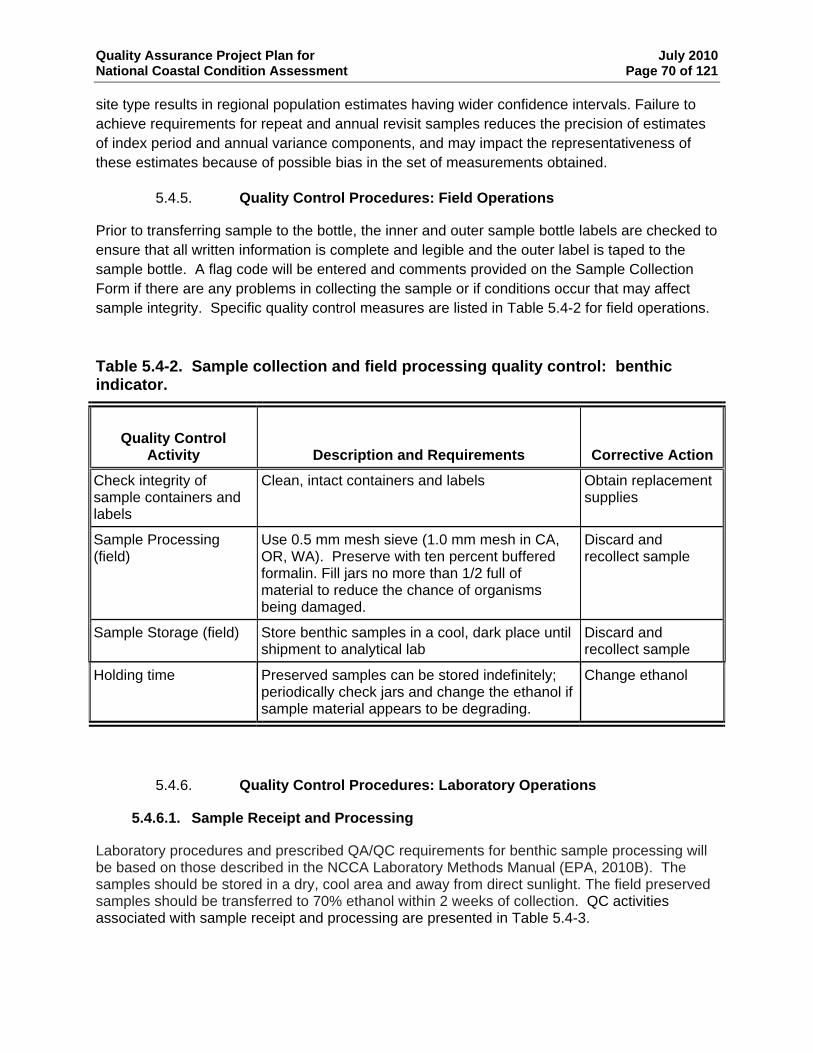
Quality Assurance Project Plan for July 2010 National Coastal Condition Assessment Page 70 of 121
site type results in regional population estimates having wider confidence intervals. Failure to achieve requirements for repeat and annual revisit samples reduces the precision of estimates of index period and annual variance components, and may impact the representativeness of these estimates because of possible bias in the set of measurements obtained.
5.4.5. Quality Control Procedures: Field Operations
Prior to transferring sample to the bottle, the inner and outer sample bottle labels are checked to ensure that all written information is complete and legible and the outer label is taped to the sample bottle. A flag code will be entered and comments provided on the Sample Collection Form if there are any problems in collecting the sample or if conditions occur that may affect sample integrity. Specific quality control measures are listed in Table 5.4-2 for field operations.
Table 5.4-2. Sample collection and field processing quality control: benthic indicator.
Quality Control Activity Description and Requirements Corrective Action
Check integrity of sample containers and labels
Clean, intact containers and labels Obtain replacement supplies
Sample Processing (field)
Use 0.5 mm mesh sieve (1.0 mm mesh in CA, OR, WA). Preserve with ten percent buffered formalin. Fill jars no more than 1/2 full of material to reduce the chance of organisms being damaged.
Discard and recollect sample
Sample Storage (field) Store benthic samples in a cool, dark place until shipment to analytical lab
Discard and recollect sample
Holding time Preserved samples can be stored indefinitely; periodically check jars and change the ethanol if sample material appears to be degrading.
Change ethanol
5.4.6. Quality Control Procedures: Laboratory Operations
5.4.6.1. Sample Receipt and Processing
Laboratory procedures and prescribed QA/QC requirements for benthic sample processing will be based on those described in the NCCA Laboratory Methods Manual (EPA, 2010B). The samples should be stored in a dry, cool area and away from direct sunlight. The field preserved samples should be transferred to 70% ethanol within 2 weeks of collection. QC activities associated with sample receipt and processing are presented in Table 5.4-3.
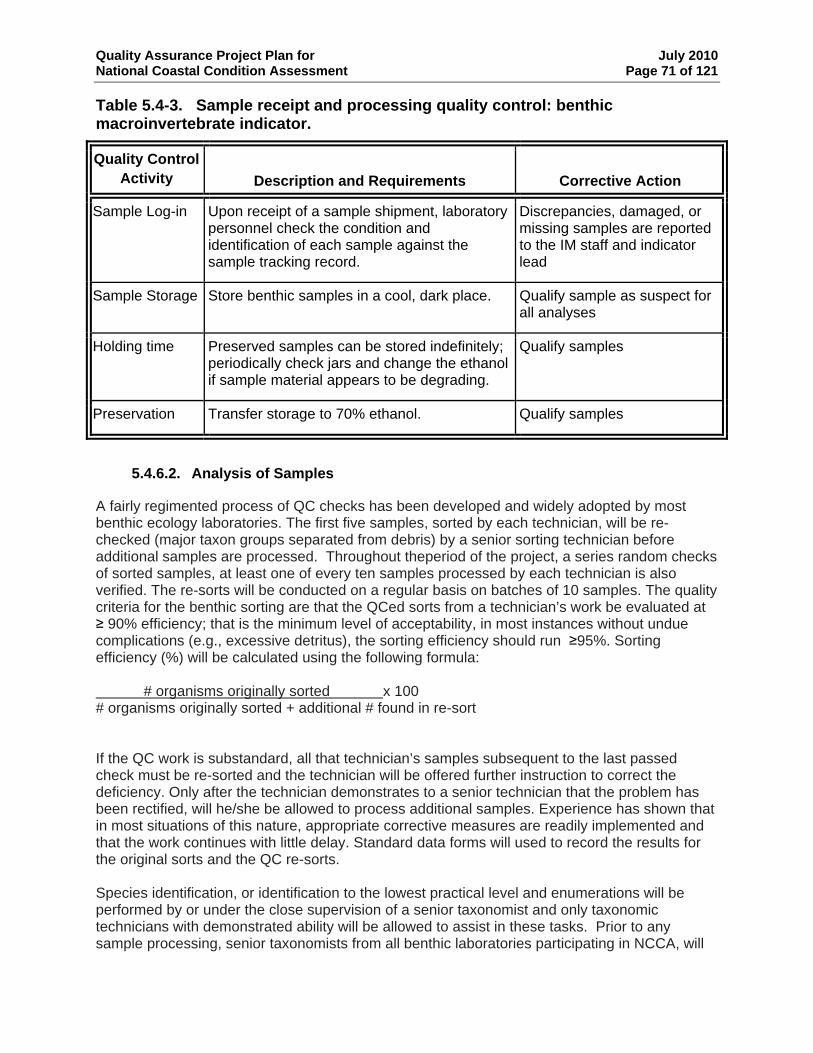
Quality Assurance Project Plan for July 2010 National Coastal Condition Assessment Page 71 of 121
Table 5.4-3. Sample receipt and processing quality control: benthic macroinvertebrate indicator.
Quality Control Activity Description and Requirements Corrective Action
Sample Log-in Upon receipt of a sample shipment, laboratory personnel check the condition and identification of each sample against the sample tracking record.
Discrepancies, damaged, or missing samples are reported to the IM staff and indicator lead
Sample Storage Store benthic samples in a cool, dark place. Qualify sample as suspect for all analyses
Holding time Preserved samples can be stored indefinitely; periodically check jars and change the ethanol if sample material appears to be degrading.
Qualify samples
Preservation Transfer storage to 70% ethanol. Qualify samples
5.4.6.2. Analysis of Samples
A fairly regimented process of QC checks has been developed and widely adopted by most benthic ecology laboratories. The first five samples, sorted by each technician, will be re-checked (major taxon groups separated from debris) by a senior sorting technician before additional samples are processed. Throughout theperiod of the project, a series random checks of sorted samples, at least one of every ten samples processed by each technician is also verified. The re-sorts will be conducted on a regular basis on batches of 10 samples. The quality criteria for the benthic sorting are that the QCed sorts from a technician’s work be evaluated at ≥ 90% efficiency; that is the minimum level of acceptability, in most instances without undue complications (e.g., excessive detritus), the sorting efficiency should run ≥95%. Sorting efficiency (%) will be calculated using the following formula: # organisms originally sorted x 100 # organisms originally sorted + additional # found in re-sort If the QC work is substandard, all that technician’s samples subsequent to the last passed check must be re-sorted and the technician will be offered further instruction to correct the deficiency. Only after the technician demonstrates to a senior technician that the problem has been rectified, will he/she be allowed to process additional samples. Experience has shown that in most situations of this nature, appropriate corrective measures are readily implemented and that the work continues with little delay. Standard data forms will used to record the results for the original sorts and the QC re-sorts. Species identification, or identification to the lowest practical level and enumerations will be performed by or under the close supervision of a senior taxonomist and only taxonomic technicians with demonstrated ability will be allowed to assist in these tasks. Prior to any sample processing, senior taxonomists from all benthic laboratories participating in NCCA, will
Quality Assurance Project Plan for July 2010 National Coastal Condition Assessment Page 72 of 121
agree upon procedures necessary to attain identification to the lowest practical level. The first five samples, counted and identified by each taxonomist, will be re-checked by a senior taxonomist or a designated competent taxonomic technician, to verify accuracy of species identification and enumerations, before work proceeds. As with the sorting process, at least one out of every ten samples processed by each taxonomic technician will be also be re-checked . The QC check will consist of confirming identifications and recounting individuals of each taxon group composing the sample. The total number of errors (either mis-IDs or miscounts) will be recorded and the overall percent accuracy will be computed using the following formula: Total # organisms in QC recount - total # or errors x 100
Total # of organisms in QC recount The minimum acceptable taxonomic efficiency will be 90%. If the efficiency is greater than 95%, no corrective action is required. However, if taxonomic efficiency is 90 - 95 %, the taxonomist will be consulted and problem areas will be identified. Taxonomic efficiencies below 90% will require re- identifying and enumerating all samples that comprised that batch. The taxonomist must demonstrate an understanding of the problematic areas before continuing with additional samples, and then, his/ her performance will be closely monitored for sustained improvement. In addition to the QC checks of taxonomist work, the QA program for benthic taxonomy requires that the laboratory maintains a voucher collection of representative specimens of all species identified in the NCCAbenthic samples. If possible, the collection should have the identifications verified by an outside source. The verified specimens should then become a part of the laboratory’s permanent reference collection which can be used in training new taxonomists. NOTE: Interlaboratory Calibration Exercise. Benthic community structure is a very critical element to the overall assessment of the ecological condition of a coastal system. The procedures to sort and correctly identify benthos are extremely tedious and require a high degree of expertise. Because of benthos’ importance to the study and the level of difficulty involved in processing, to evaluate comparability among the laboratories, indicator lead and/or quality assurance project manager may conduct interlaboratory calibration exercises in which replicate (or similar) benthic samples will analyzed by the multiple laboratories involved. Specific quality control measures are listed in Table 5.4-4 for laboratory operations. Figure 5.4.1 presents the general process for analyzing benthic invertebrate samples. Specific quality control measures are listed in Table 5.4-5 for laboratory identification operations.
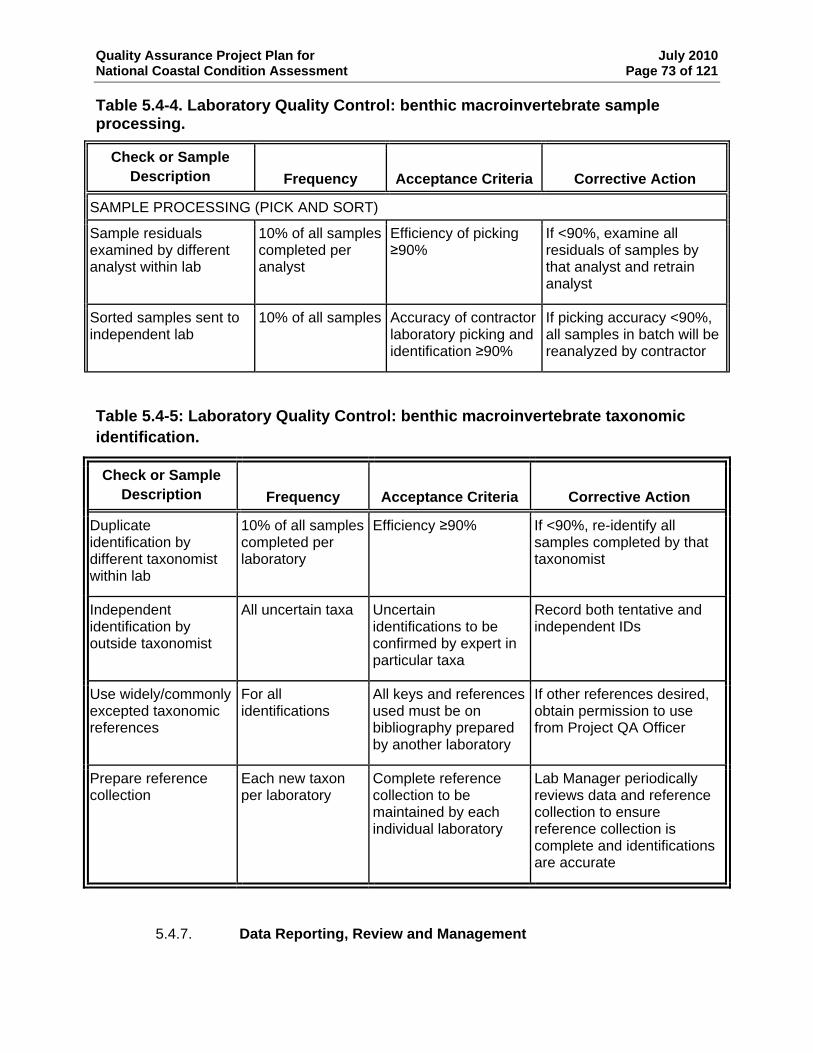
Quality Assurance Project Plan for July 2010 National Coastal Condition Assessment Page 73 of 121
Table 5.4-4. Laboratory Quality Control: benthic macroinvertebrate sample processing.
Check or Sample Description Frequency Acceptance Criteria Corrective Action
SAMPLE PROCESSING (PICK AND SORT)
Sample residuals examined by different analyst within lab
10% of all samples completed per analyst
Efficiency of picking ≥90%
If <90%, examine all residuals of samples by that analyst and retrain analyst
Sorted samples sent to independent lab
10% of all samples Accuracy of contractor laboratory picking and identification ≥90%
If picking accuracy <90%, all samples in batch will be reanalyzed by contractor
Table 5.4-5: Laboratory Quality Control: benthic macroinvertebrate taxonomic identification.
Check or Sample Description Frequency Acceptance Criteria Corrective Action
Duplicate identification by different taxonomist within lab
10% of all samples completed per laboratory
Efficiency ≥90% If <90%, re-identify all samples completed by that taxonomist
Independent identification by outside taxonomist
All uncertain taxa Uncertain identifications to be confirmed by expert in particular taxa
Record both tentative and independent IDs
Use widely/commonly excepted taxonomic references
For all identifications
All keys and references used must be on bibliography prepared by another laboratory
If other references desired, obtain permission to use from Project QA Officer
Prepare reference collection
Each new taxon per laboratory
Complete reference collection to be maintained by each individual laboratory
Lab Manager periodically reviews data and reference collection to ensure reference collection is complete and identifications are accurate
5.4.7. Data Reporting, Review and Management
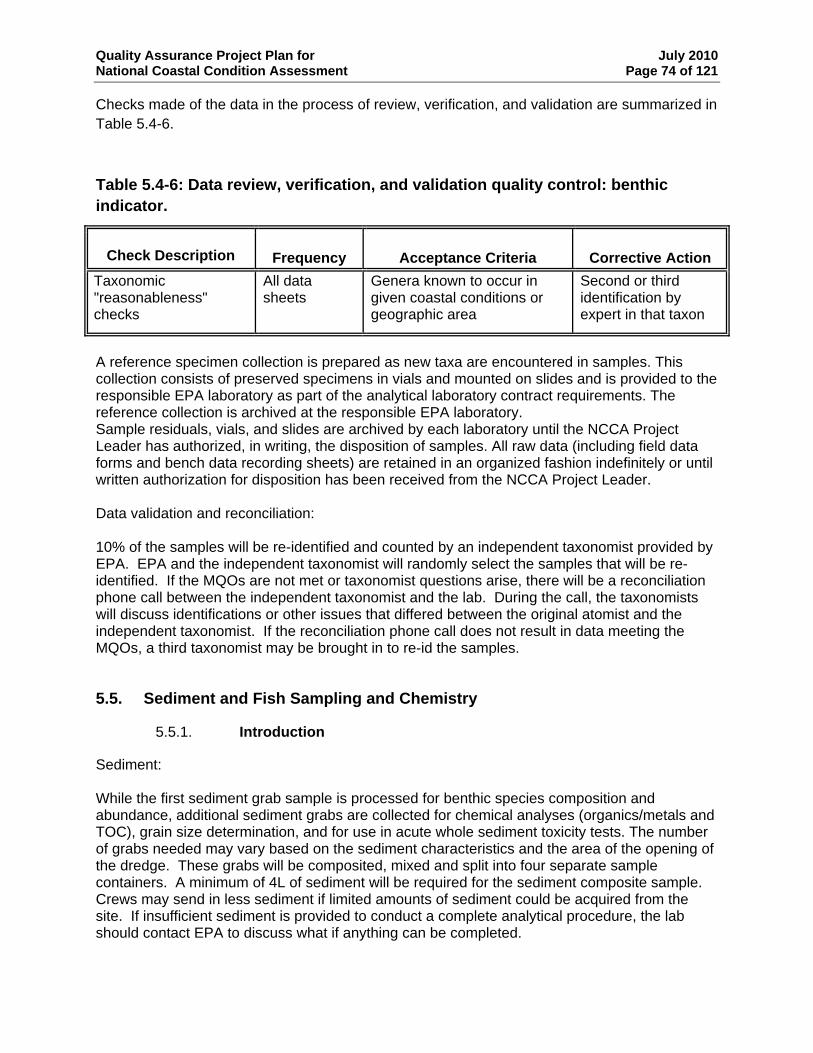
Quality Assurance Project Plan for July 2010 National Coastal Condition Assessment Page 74 of 121
Checks made of the data in the process of review, verification, and validation are summarized in Table 5.4-6.
Table 5.4-6: Data review, verification, and validation quality control: benthic indicator.
Check Description Frequency Acceptance Criteria Corrective Action Taxonomic "reasonableness" checks
All data sheets
Genera known to occur in given coastal conditions or geographic area
Second or third identification by expert in that taxon
A reference specimen collection is prepared as new taxa are encountered in samples. This collection consists of preserved specimens in vials and mounted on slides and is provided to the responsible EPA laboratory as part of the analytical laboratory contract requirements. The reference collection is archived at the responsible EPA laboratory. Sample residuals, vials, and slides are archived by each laboratory until the NCCA Project Leader has authorized, in writing, the disposition of samples. All raw data (including field data forms and bench data recording sheets) are retained in an organized fashion indefinitely or until written authorization for disposition has been received from the NCCA Project Leader. Data validation and reconciliation: 10% of the samples will be re-identified and counted by an independent taxonomist provided by EPA. EPA and the independent taxonomist will randomly select the samples that will be re-identified. If the MQOs are not met or taxonomist questions arise, there will be a reconciliation phone call between the independent taxonomist and the lab. During the call, the taxonomists will discuss identifications or other issues that differed between the original atomist and the independent taxonomist. If the reconciliation phone call does not result in data meeting the MQOs, a third taxonomist may be brought in to re-id the samples.
5.5. Sediment and Fish Sampling and Chemistry
5.5.1. Introduction
Sediment: While the first sediment grab sample is processed for benthic species composition and abundance, additional sediment grabs are collected for chemical analyses (organics/metals and TOC), grain size determination, and for use in acute whole sediment toxicity tests. The number of grabs needed may vary based on the sediment characteristics and the area of the opening of the dredge. These grabs will be composited, mixed and split into four separate sample containers. A minimum of 4L of sediment will be required for the sediment composite sample. Crews may send in less sediment if limited amounts of sediment could be acquired from the site. If insufficient sediment is provided to conduct a complete analytical procedure, the lab should contact EPA to discuss what if anything can be completed.
Quality Assurance Project Plan for July 2010 National Coastal Condition Assessment Page 75 of 121
Fish: Fish collected as indicators of ecological contamination (Eco-fish) will be collected at all sites to be analyzed for whole body concentrations of organic and inorganic contaminants. This will also include the analysis and reporting of lipid content, sample weight and percent moisture. Results from these analyses will be used to help determine the ecological integrity of U.S. coastal resources. Specimen collection will be based on biogeographically specific “target species” lists developed for each of the regional areas- Great Lakes, Northeast, Southeast, Gulf, and West Coast (see Table 5.5-1). In the event that target species cannot be caught at a site, then species of similar habit/habitat may be substituted. All attempts should be made to collect the targeted species. In the Great Lakes, additional fish composite samples will be collected, and fillets from these samples will be analyzed for concentrations of organic and inorganic contaminants. The Great Lakes Human Health fish tissue indicator (HH-fish) will provide information on the distribution of mercury, perfluorinated compound (PFC), polybrominated diphenyl ether (PBDE), omega-3 fatty acid, and pharmaceutical residues in fish species consumed by humans from coastal areas of the Great Lakes Region (see Table 5.5-2 for list of target species). Crews should attempt to adhere to the lists of target and alternative species for human health fish collection. The human health fish tissue indicator procedures are based on EPA’s National Study of Chemical Residues in Lake Fish Tissue (USEPA 2000a) and EPA’s Guidance for Assessing Chemical Contaminant Data for Use in Fish Advisories, Volume 1 (Third Edition) (USEPA 2000b).
5.5.2. Sampling Design
Sediment Collection: The search for soft sediment can be expanded to within 37 m to collect sediment. If no sediment is found, crews can expand the area to within 100 m. For Great Lakes sites only, if no acceptable sediment grabs are achieved, the crew may move the attempt to within 500 meters of the X site. See the Field Operations Manual (EPA, 2010A) for more information. The sample will be checked for acceptability and multiple grabs will make up the 4 L sample required for the composite sample. Unlike the benthic sample, the depth of sediment in the dredge need not be 7 cm, but surficial sediment must be present.
• Note: While the field crew should make every attempt to collect all samples, there will be some circumstances that will prevent this from happening. When an insufficient amount of sediment can be collected to complete all analyses, crews are to follow the guidelines below:
o Benthic sample should be collected. Any sediment size is acceptable so long as the definition of a “successful grab” is met (Benthic Grab criteria).
o Sediment composite material of sand-sized sediment grain or smaller, should be collected.
Quality Assurance Project Plan for July 2010 National Coastal Condition Assessment Page 76 of 121
Since there may be cases where only a limited amount of sediment can
be acquired for the sediment chemistry, characterization, and toxicity composite. In these cases, the outline below provides the expected sample in order of preference:
• Contaminants • TOC • Silt/Clay (Grain size) • Toxicity
Fish Collection: Any reasonable method which represents the most efficient or best use of the available time on station may be used to collect the needed specimens. Specimens collected should be identified by common name and genus-species and the length measured (appropriate to the species). This data along with the quantity sent for analysis should be recorded. Minimum length for an Eco-fish specimen is 4.0 cm with a preferred length of 10 – 40 cm. Up to 20 individuals should be collected and sent for chemical analysis. HH-fish specimens must consist of a composite of fish (i.e., five individuals of one predator species that will collectively provide greater than 500 grams of fillet tissue) from each site. Field teams will consist of one experienced fisheries biologist and one field technician. The experienced on-site fisheries biologist will select the most appropriate sampling equipment. Accurate taxonomic identification is essential to prevent mixing of species within composites. Five fish will be collected per composite at each site, all of which must be large enough to provide sufficient tissue for analysis (i.e., 500 grams of fillets, collectively). Fish in each composite must all be of the same species, satisfy legal requirements of harvestable size (or be of consumable size if there are no harvest limits), and be of similar size so that the smallest individual in the composite is no less that 75% of the total length of the largest individual. If the recommended target species are unavailable, the on-site fisheries biologist will select an alternative species (i.e., a predator species that is commonly consumed in the study area, with specimens of harvestable or consumable size, and in sufficient numbers to yield a composite).
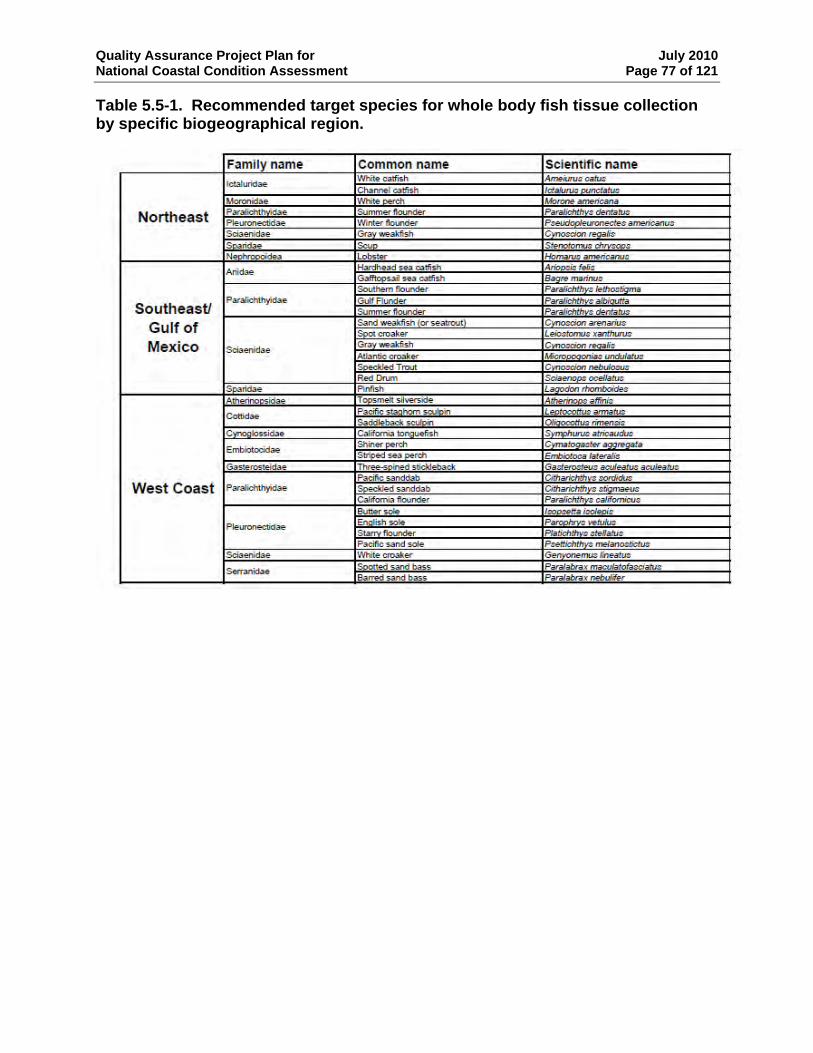
Quality Assurance Project Plan for July 2010 National Coastal Condition Assessment Page 77 of 121
Table 5.5-1. Recommended target species for whole body fish tissue collection by specific biogeographical region.
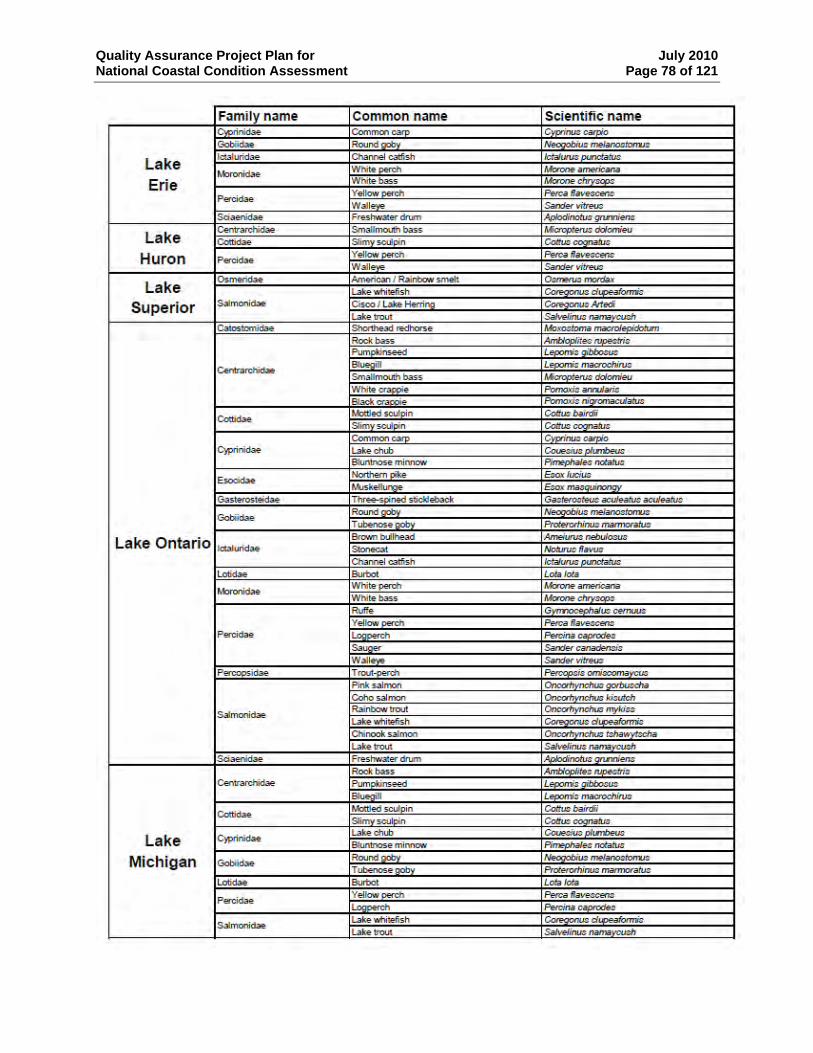
Quality Assurance Project Plan for July 2010 National Coastal Condition Assessment Page 78 of 121
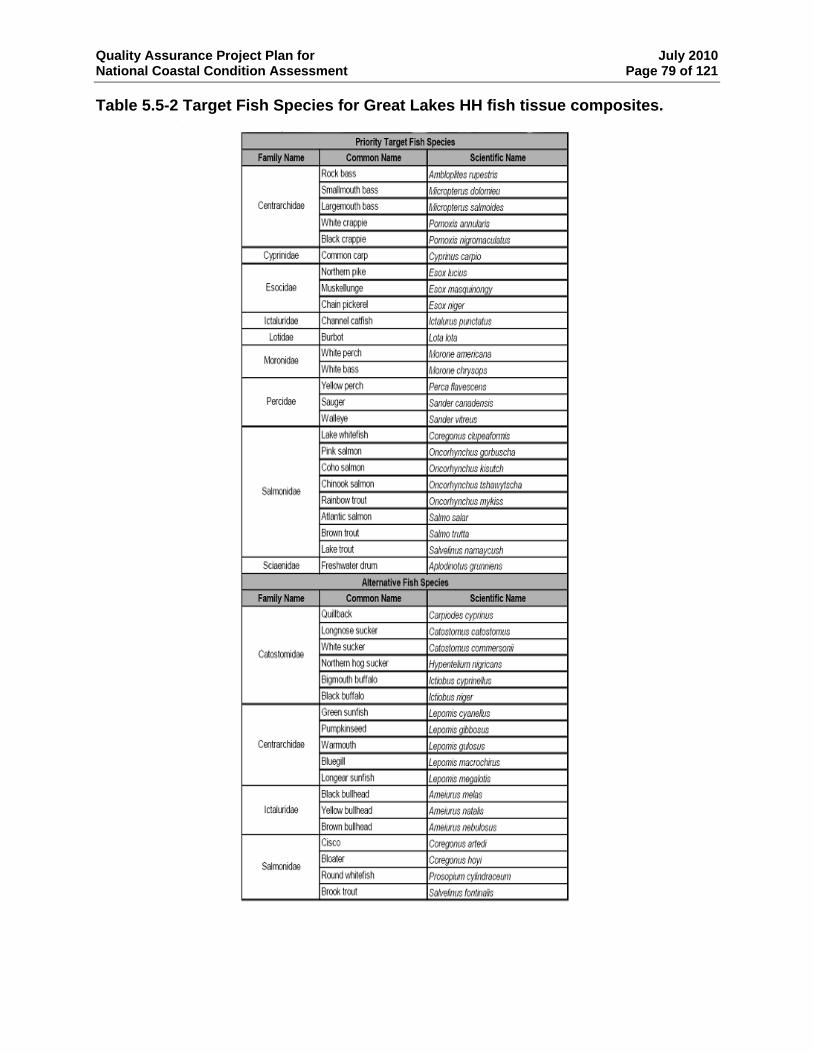
Quality Assurance Project Plan for July 2010 National Coastal Condition Assessment Page 79 of 121
Table 5.5-2 Target Fish Species for Great Lakes HH fish tissue composites.
Quality Assurance Project Plan for July 2010 National Coastal Condition Assessment Page 80 of 121
5.5.3. Sampling and Analytical Methods
Sediment Collection: The number of Van Veen or Ponar grabs required to yield an adequate volume of composited sediment will vary; however, surficial sediment from a minimum of three grabs should be composited for the final sample. Surficial sediment from the individual grabs will be combined in a clean, high-grade stainless steel or Teflon vessel. Between grabs, the composite will be held on ice and covered to protect the sample from contamination (e.g., fuel or combustion products). Each addition of sediment will be mixed in the composite bucket and the final mixture will be stirred well to homogenize prior to sub-sampling. Each grab sample will be inspected to ensure adherence to the criteria found in the Field Operations Manual (EPA, 2010A) before any sample is added to the composite. Once it has been determined that there was no loss of surficial sediment and all criteria are met the top two to three cm of sample will be collected with a stainless steel spoon and placed in the composite bucket. The sample in direct contact with the sides of the dredge is not collected, and contact between spoon and dredge should be minimal. Approximately 250 ml of the composite will be placed in a clean, prelabeled, 500 ml glass wide-mouth jar for organic and inorganic chemistry. The samples will be held on wet ice until transfer to lab, within seven days of collection, where the samples should be frozen to await processing. Fish Collection: To provide samples for the analyses of chemical contaminants, attempts will be made to collect fish by any reasonable method, representing the most efficient use of available time. Methods might include trawl, trap, seine, cast net or hook and line. All fish/shellfish collected for tissue analysis will be identified to species and recorded, with lengths, on the appropriate data sheet. The list of the target species for Eco-fish is in Table 5.5-1 and for HH-fish is in Table 5.5-2. EPA will provide fish tissue sample packing and shipping supplies (with the exception of dry ice). A list of equipment and expendable supplies is provided in the NCCA Field Operations Manual (EPA, 2010A). Eco-fish: At sites where target species are captured in sufficient numbers, five to ten individuals of the same species, with a length of 100 to 400 mm, will be combined into a composite sample of approximately 500 g. The fish will first be measured and recorded on the sampling form, then rinsed with site water, and bagged together with a sample identification label. The sample is double-bagged, the bag is sealed with a labeled zip-tie and the sample is frozen to await shipping. HH-fish: Five fish, each from the human health target list will be individually wrapped in extra heavy-duty aluminum foil. Each foil-wrapped fish and will be placed into waterproof plastic tubing that will be cut to fit the specimen (i.e., heavy duty food grade polyethylene tubing provided by EPA), and each end of the tubing will be sealed with a plastic cable tie. A sample label will be taped onto the outside of the tubing and all five individually-wrapped specimens from the site will be placed in a large plastic composite bag and sealed with a cable tie tagged with another sample identification label. These samples are also frozen to await shipping.
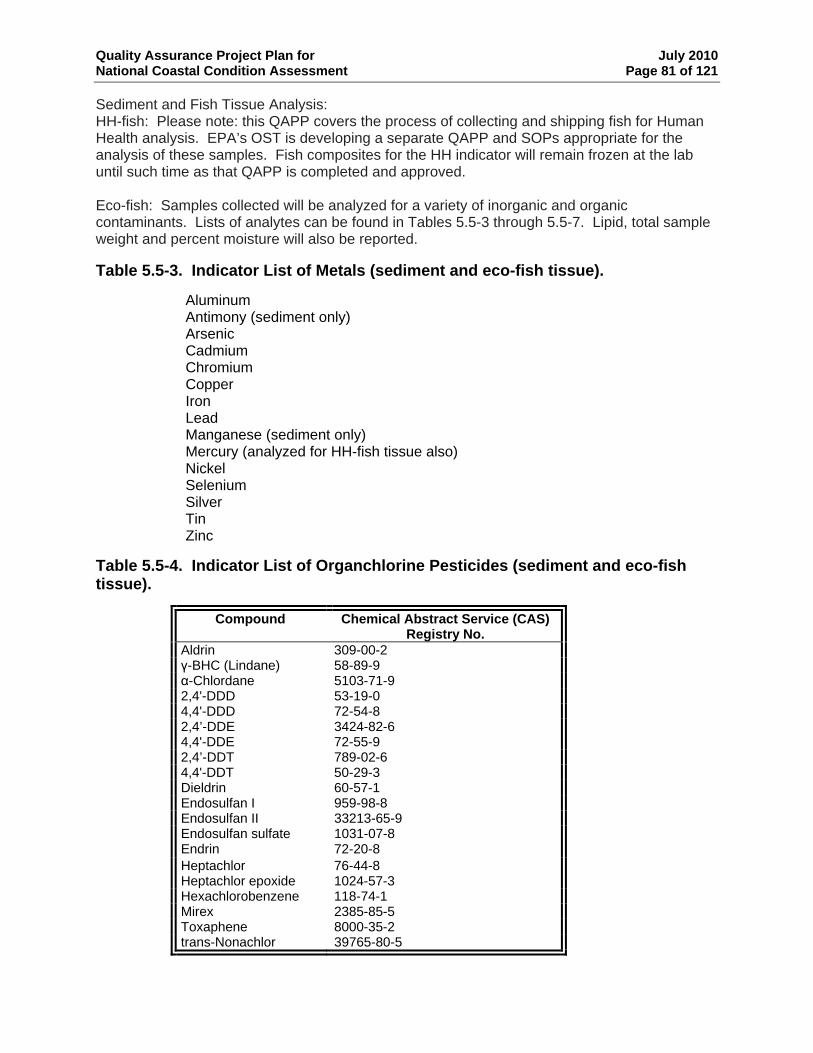
Quality Assurance Project Plan for July 2010 National Coastal Condition Assessment Page 81 of 121
Sediment and Fish Tissue Analysis: HH-fish: Please note: this QAPP covers the process of collecting and shipping fish for Human Health analysis. EPA’s OST is developing a separate QAPP and SOPs appropriate for the analysis of these samples. Fish composites for the HH indicator will remain frozen at the lab until such time as that QAPP is completed and approved. Eco-fish: Samples collected will be analyzed for a variety of inorganic and organic contaminants. Lists of analytes can be found in Tables 5.5-3 through 5.5-7. Lipid, total sample weight and percent moisture will also be reported. Table 5.5-3. Indicator List of Metals (sediment and eco-fish tissue).
Aluminum Antimony (sediment only) Arsenic Cadmium Chromium Copper Iron Lead Manganese (sediment only) Mercury (analyzed for HH-fish tissue also) Nickel Selenium Silver Tin Zinc
Table 5.5-4. Indicator List of Organchlorine Pesticides (sediment and eco-fish tissue).
Compound Chemical Abstract Service (CAS) Registry No.
Aldrin 309-00-2 γ-BHC (Lindane) 58-89-9 α-Chlordane 5103-71-9 2,4'-DDD 53-19-0 4,4'-DDD 72-54-8 2,4’-DDE 3424-82-6 4,4'-DDE 72-55-9 2,4’-DDT 789-02-6 4,4'-DDT 50-29-3 Dieldrin 60-57-1 Endosulfan I 959-98-8 Endosulfan II 33213-65-9 Endosulfan sulfate 1031-07-8 Endrin 72-20-8 Heptachlor 76-44-8 Heptachlor epoxide 1024-57-3 Hexachlorobenzene 118-74-1 Mirex 2385-85-5 Toxaphene 8000-35-2 trans-Nonachlor 39765-80-5
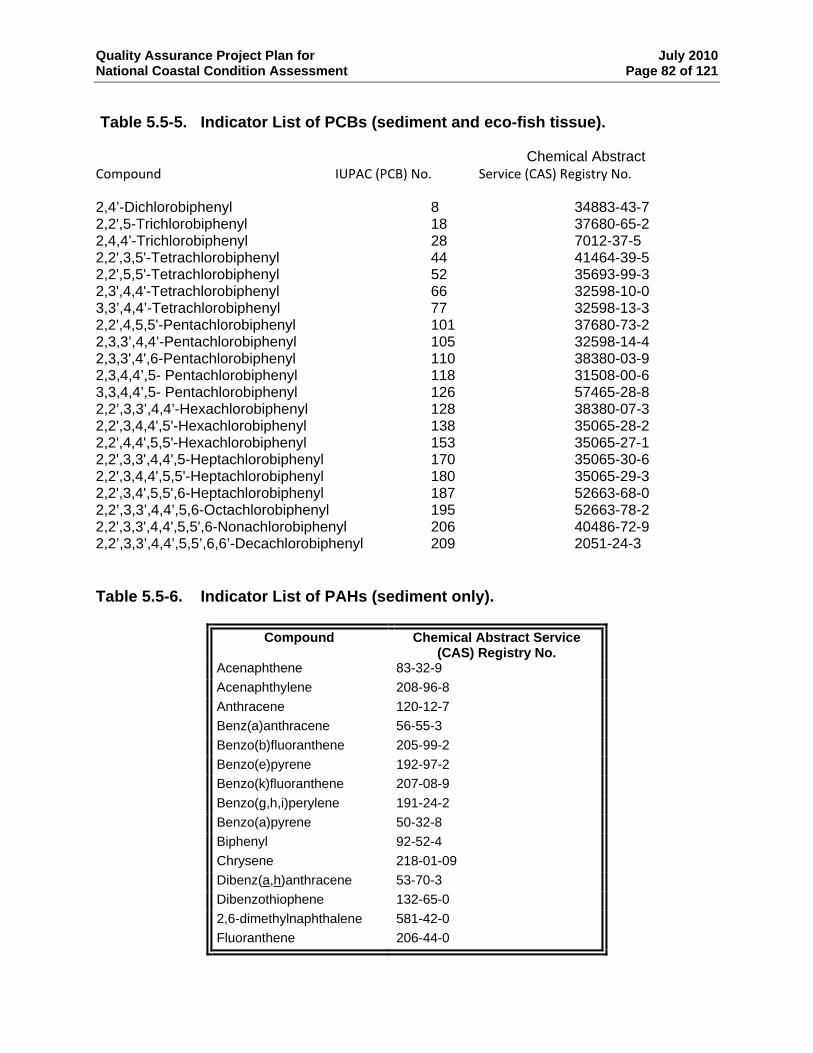
Quality Assurance Project Plan for July 2010 National Coastal Condition Assessment Page 82 of 121
Table 5.5-5. Indicator List of PCBs (sediment and eco-fish tissue). Chemical AbstCompound IUPAC (PCB) No. Service CAS)( Registry No.
2,4’-Dichlorobiphenyl 8 34883-43-72,2',5-Trichlorobiphenyl 18 37680-65-22,4,4’-Trichlorobiphenyl 28 7012-37-52,2',3,5'-Tetrachlorobiphenyl 44 41464-39-52,2',5,5'-Tetrachlorobiphenyl 52 35693-99-32,3',4,4'-Tetrachlorobiphenyl 66 32598-10-03,3’,4,4’-Tetrachlorobiphenyl 77 32598-13-32,2',4,5,5'-Pentachlorobiphenyl 101 37680-73-22,3,3’,4,4’-Pentachlorobiphenyl 105 32598-14-42,3,3',4',6-Pentachlorobiphenyl 110 38380-03-92,3,4,4’,5- Pentachlorobiphenyl 118 31508-00-63,3,4,4’,5- Pentachlorobiphenyl 126 57465-28-82,2’,3,3’,4,4’-Hexachlorobiphenyl 128 38380-07-32,2',3,4,4',5'-Hexachlorobiphenyl 138 35065-28-22,2',4,4',5,5'-Hexachlorobiphenyl 153 35065-27-12,2',3,3',4,4',5-Heptachlorobiphenyl 170 35065-30-62,2',3,4,4',5,5'-Heptachlorobiphenyl 180 35065-29-32,2',3,4',5,5',6-Heptachlorobiphenyl 187 52663-68-02,2’,3,3’,4,4’,5,6-Octachlorobiphenyl 195 52663-78-22,2',3,3',4,4',5,5',6-Nonachlorobiphenyl 206 40486-72-92,2’,3,3’,4,4’,5,5’,6,6’-Decachlorobiphenyl 209 2051-24-3
ract
Table 5.5-6. Indicator List of PAHs (sediment only).
Compound Chemical Abstract Service
Acenaphthene (CAS) Registry No.
83-32-9 Acenaphthylene 208-96-8 Anthracene 120-12-7 Benz(a)anthracene 56-55-3 Benzo(b)fluoranthene 205-99-2 Benzo(e)pyrene 192-97-2 Benzo(k)fluoranthene 207-08-9 Benzo(g,h,i)perylene 191-24-2 Benzo(a)pyrene 50-32-8 Biphenyl 92-52-4 Chrysene 218-01-09 Dibenz(a,h)anthracene 53-70-3 Dibenzothiophene 132-65-0 2,6-dimethylnaphthalene 581-42-0 Fluoranthene 206-44-0
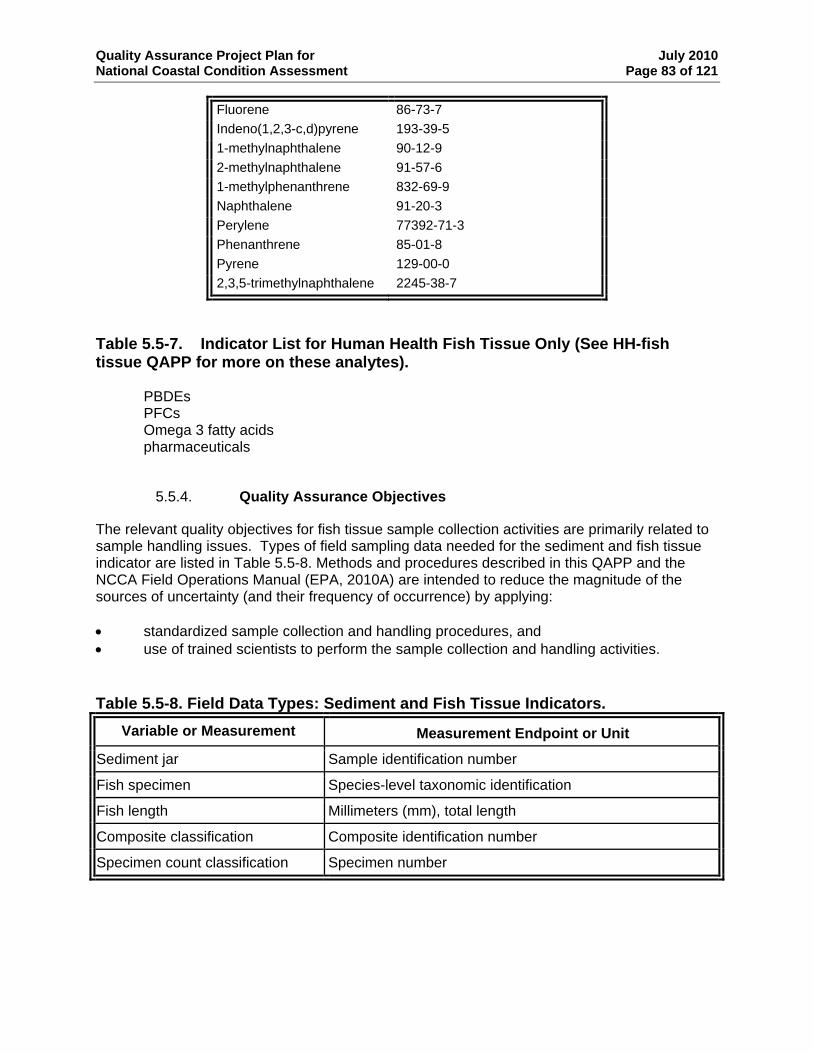
Quality Assurance Project Plan for July 2010 National Coastal Condition Assessment Page 83 of 121
Fluorene 86-73-7 Indeno(1,2,3-c,d)pyrene 193-39-5 1-methylnaphthalene 90-12-9 2-methylnaphthalene 91-57-6 1-methylphenanthrene 832-69-9 Naphthalene 91-20-3 Perylene 77392-71-3 Phenanthrene 85-01-8 Pyrene 129-00-0 2,3,5-trimethylnaphthalene 2245-38-7
Table 5.5-7. Indicator List for Human Health Fish Tissue Only (See HH-fish tissue QAPP for more on these analytes).
PBDEs PFCs Omega 3 fatty acids pharmaceuticals
5.5.4. Quality Assurance Objectives
The relevant quality objectives for fish tissue sample collection activities are primarily related to sample handling issues. Types of field sampling data needed for the sediment and fish tissue indicator are listed in Table 5.5-8. Methods and procedures described in this QAPP and the NCCA Field Operations Manual (EPA, 2010A) are intended to reduce the magnitude of the sources of uncertainty (and their frequency of occurrence) by applying: • standardized sample collection and handling procedures, and • use of trained scientists to perform the sample collection and handling activities. Table 5.5-8. Field Data Types: Sediment and Fish Tissue Indicators.
Variable or Measurement Measurement Endpoint or Unit
Sediment jar Sample identification number
Fish specimen Species-level taxonomic identification
Fish length Millimeters (mm), total length
Composite classification Composite identification number
Specimen count classification Specimen number
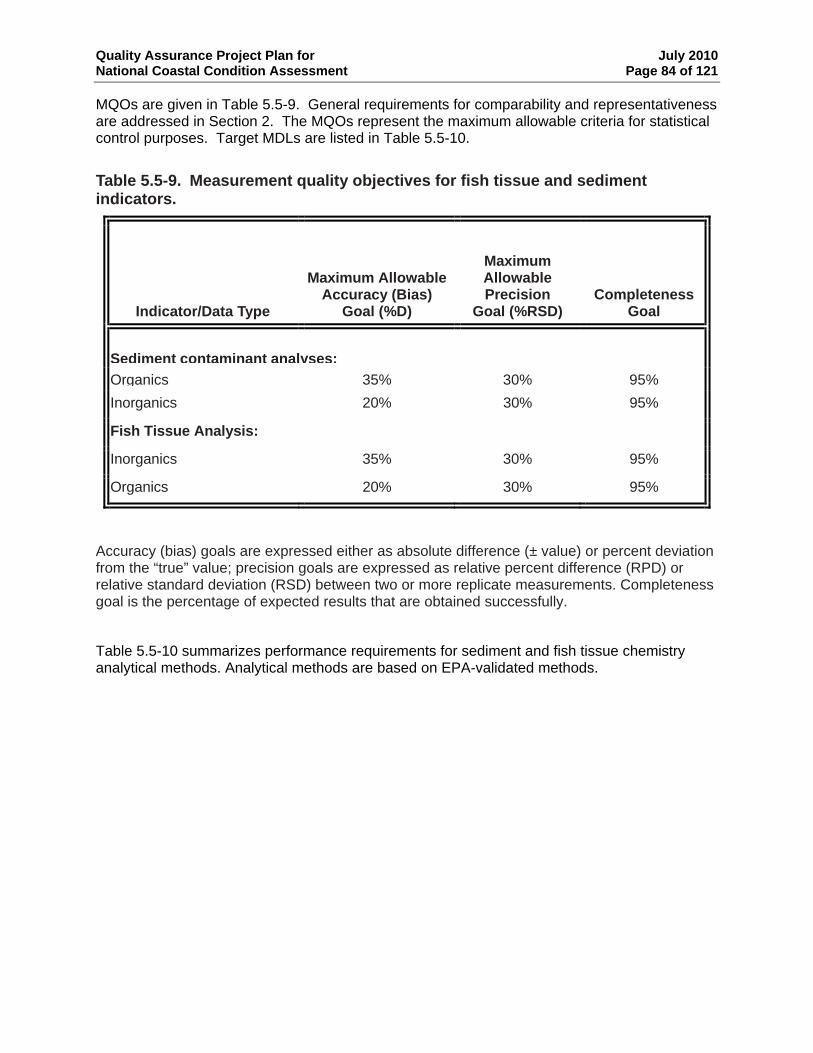
Quality Assurance Project Plan for July 2010 National Coastal Condition Assessment Page 84 of 121
MQOs are given in Table 5.5-9. General requirements for comparability and representativeness are addressed in Section 2. The MQOs represent the maximum allowable criteria for statistical control purposes. Target MDLs are listed in Table 5.5-10.
Table 5.5-9. Measurement quality objectives for fish tissue and sediment indicators.
Indicator/Data Type
Maximum Allowable
Accuracy (Bias) Goal (%D)
Maximum Allowable Precision
Goal (%RSD)
Completeness Goal
Sediment contaminant analyses:Organics 35% 30% 95%Inorganics 20% 30% 95%
Fish Tissue Analysis:
Inorganics 35% 30% 95%
Organics 20% 30% 95%
Accuracy (bias) goals are expressed either as absolute difference (± value) or percent deviation from the “true” value; precision goals are expressed as relative percent difference (RPD) or relative standard deviation (RSD) between two or more replicate measurements. Completeness goal is the percentage of expected results that are obtained successfully.
Table 5.5-10 summarizes performance requirements for sediment and fish tissue chemistry analytical methods. Analytical methods are based on EPA-validated methods.
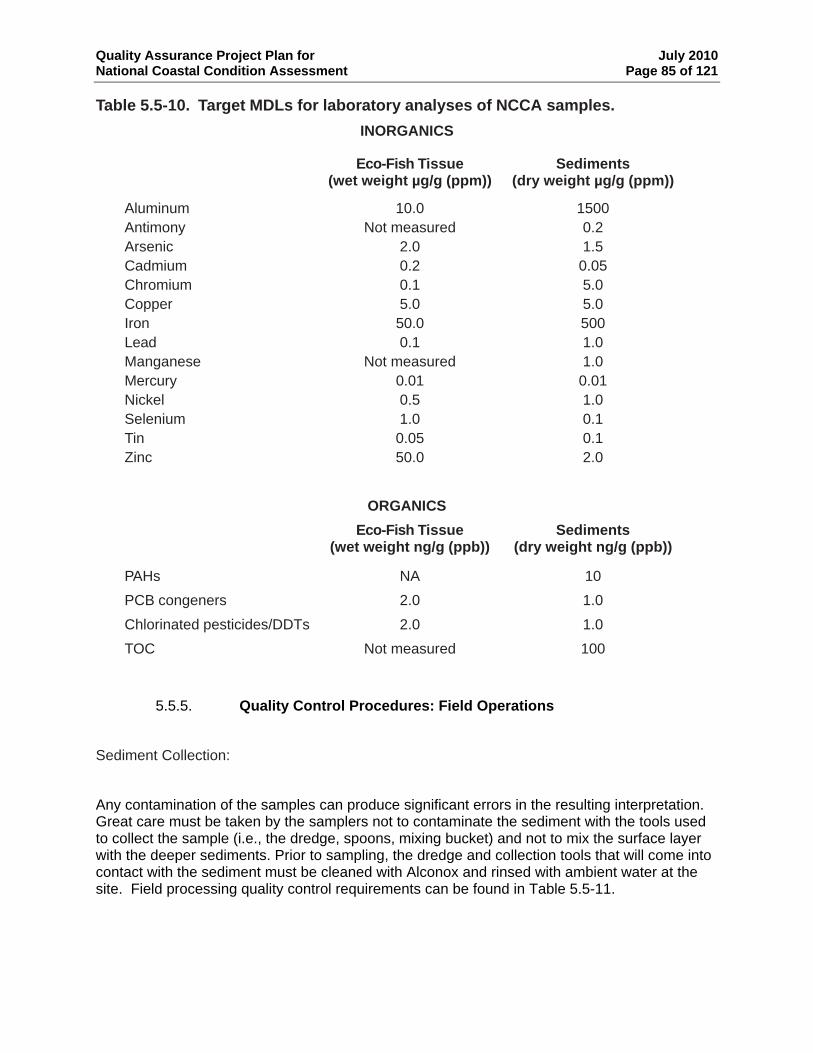
Quality Assurance Project Plan for July 2010 National Coastal Condition Assessment Page 85 of 121
Table 5.5-10. Target MDLs for laboratory analyses of NCCA samples. INORGANICS
Eco-Fish Tissue (wet weight µg/g (ppm))
Sediments (dry weight µg/g (ppm))
Aluminum 10.0 1500 Antimony Not measured 0.2 Arsenic 2.0 1.5 Cadmium 0.2 0.05 Chromium 0.1 5.0 Copper 5.0 5.0 Iron 50.0 500 Lead 0.1 1.0 Manganese Not measured 1.0 Mercury 0.01 0.01 Nickel 0.5 1.0 Selenium 1.0 0.1 Tin 0.05 0.1 Zinc 50.0 2.0
ORGANICS Eco-Fish Tissue
(wet weight ng/g (ppb))Sediments
(dry weight ng/g (ppb))
PAHs NA 10 PCB congeners 2.0 1.0 Chlorinated pesticides/DDTs 2.0 1.0 TOC Not measured 100
5.5.5. Quality Control Procedures: Field Operations
Sediment Collection:
Any contamination of the samples can produce significant errors in the resulting interpretation. Great care must be taken by the samplers not to contaminate the sediment with the tools used to collect the sample (i.e., the dredge, spoons, mixing bucket) and not to mix the surface layer with the deeper sediments. Prior to sampling, the dredge and collection tools that will come into contact with the sediment must be cleaned with Alconox and rinsed with ambient water at the site. Field processing quality control requirements can be found in Table 5.5-11.
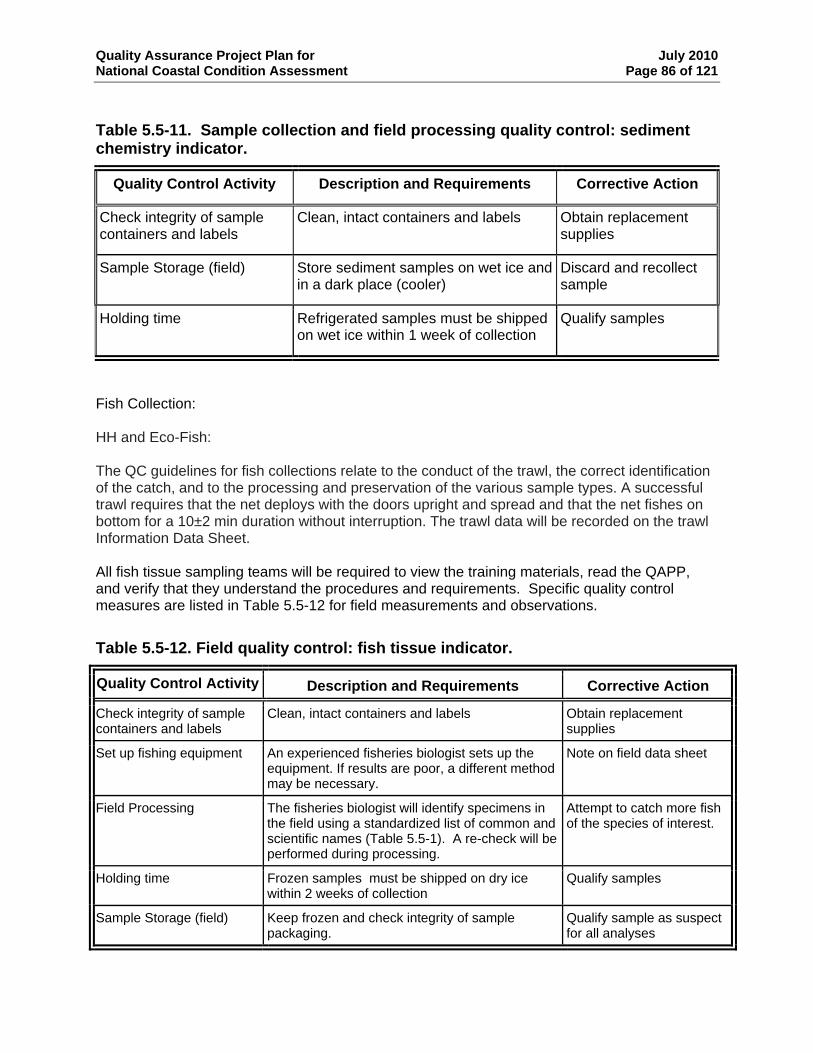
Quality Assurance Project Plan for July 2010 National Coastal Condition Assessment Page 86 of 121
Table 5.5-11. Sample collection and field processing quality control: sediment chemistry indicator.
Quality Control Activity Description and Requirements Corrective Action
Check integrity of sample containers and labels
Clean, intact containers and labels Obtain replacement supplies
Sample Storage (field) Store sediment samples on wet ice and in a dark place (cooler)
Discard and recollect sample
Holding time Refrigerated samples must be shipped on wet ice within 1 week of collection
Qualify samples
Fish Collection: HH and Eco-Fish: The QC guidelines for fish collections relate to the conduct of the trawl, the correct identification of the catch, and to the processing and preservation of the various sample types. A successful trawl requires that the net deploys with the doors upright and spread and that the net fishes on bottom for a 10±2 min duration without interruption. The trawl data will be recorded on the trawl Information Data Sheet. All fish tissue sampling teams will be required to view the training materials, read the QAPP, and verify that they understand the procedures and requirements. Specific quality control measures are listed in Table 5.5-12 for field measurements and observations.
Table 5.5-12. Field quality control: fish tissue indicator.
Quality Control Activity Description and Requirements Corrective Action
Check integrity of sample containers and labels
Clean, intact containers and labels Obtain replacement supplies
Set up fishing equipment An experienced fisheries biologist sets up the equipment. If results are poor, a different method may be necessary.
Note on field data sheet
Field Processing The fisheries biologist will identify specimens in the field using a standardized list of common and scientific names (Table 5.5-1). A re-check will be performed during processing.
Attempt to catch more fish of the species of interest.
Holding time Frozen samples must be shipped on dry ice within 2 weeks of collection
Qualify samples
Sample Storage (field) Keep frozen and check integrity of sample packaging.
Qualify sample as suspect for all analyses
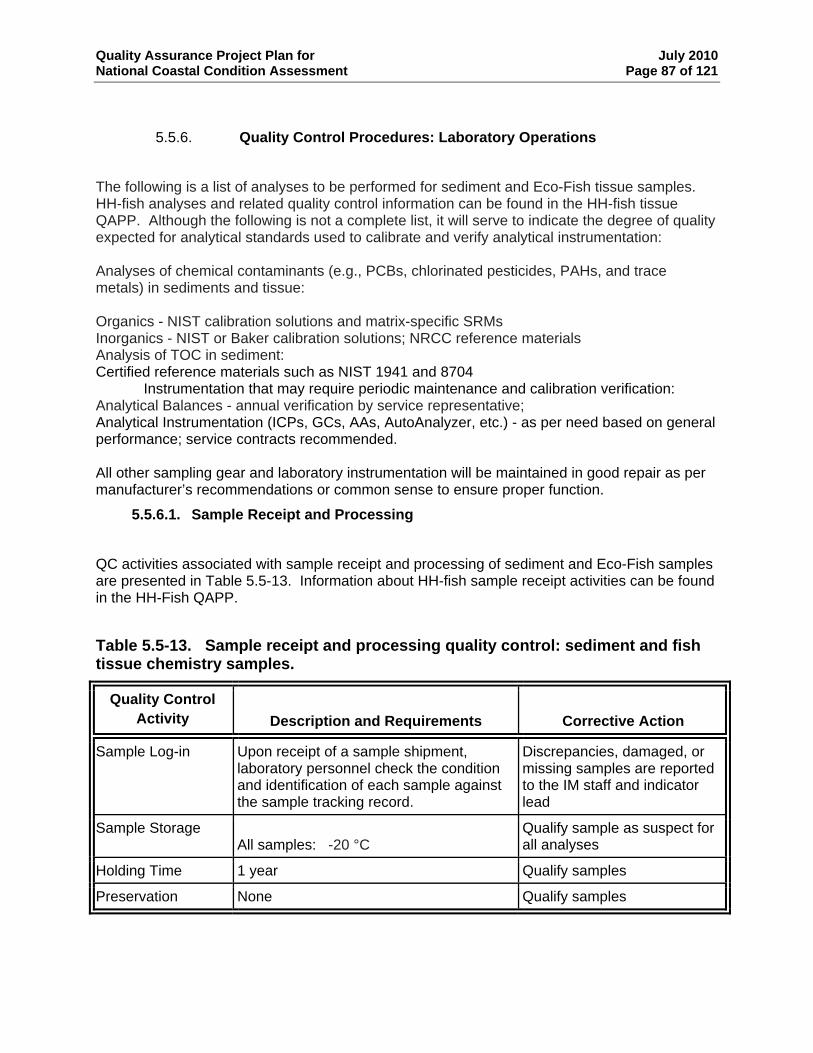
Quality Assurance Project Plan for July 2010 National Coastal Condition Assessment Page 87 of 121
5.5.6. Quality Control Procedures: Laboratory Operations
The following is a list of analyses to be performed for sediment and Eco-Fish tissue samples. HH-fish analyses and related quality control information can be found in the HH-fish tissue QAPP. Although the following is not a complete list, it will serve to indicate the degree of quality expected for analytical standards used to calibrate and verify analytical instrumentation: Analyses of chemical contaminants (e.g., PCBs, chlorinated pesticides, PAHs, and trace metals) in sediments and tissue: Organics - NIST calibration solutions and matrix-specific SRMs Inorganics - NIST or Baker calibration solutions; NRCC reference materials Analysis of TOC in sediment: Certified reference materials such as NIST 1941 and 8704 Instrumentation that may require periodic maintenance and calibration verification: Analytical Balances - annual verification by service representative; Analytical Instrumentation (ICPs, GCs, AAs, AutoAnalyzer, etc.) - as per need based on general performance; service contracts recommended. All other sampling gear and laboratory instrumentation will be maintained in good repair as per manufacturer’s recommendations or common sense to ensure proper function.
5.5.6.1. Sample Receipt and Processing
QC activities associated with sample receipt and processing of sediment and Eco-Fish samples are presented in Table 5.5-13. Information about HH-fish sample receipt activities can be found in the HH-Fish QAPP.
Table 5.5-13. Sample receipt and processing quality control: sediment and fish tissue chemistry samples.
Quality Control Activity Description and Requirements Corrective Action
Sample Log-in Upon receipt of a sample shipment, laboratory personnel check the condition and identification of each sample against the sample tracking record.
Discrepancies, damaged, or missing samples are reported to the IM staff and indicator lead
Sample Storage All samples: -20 °C
Qualify sample as suspect for all analyses
Holding Time 1 year Qualify samples
Preservation None Qualify samples
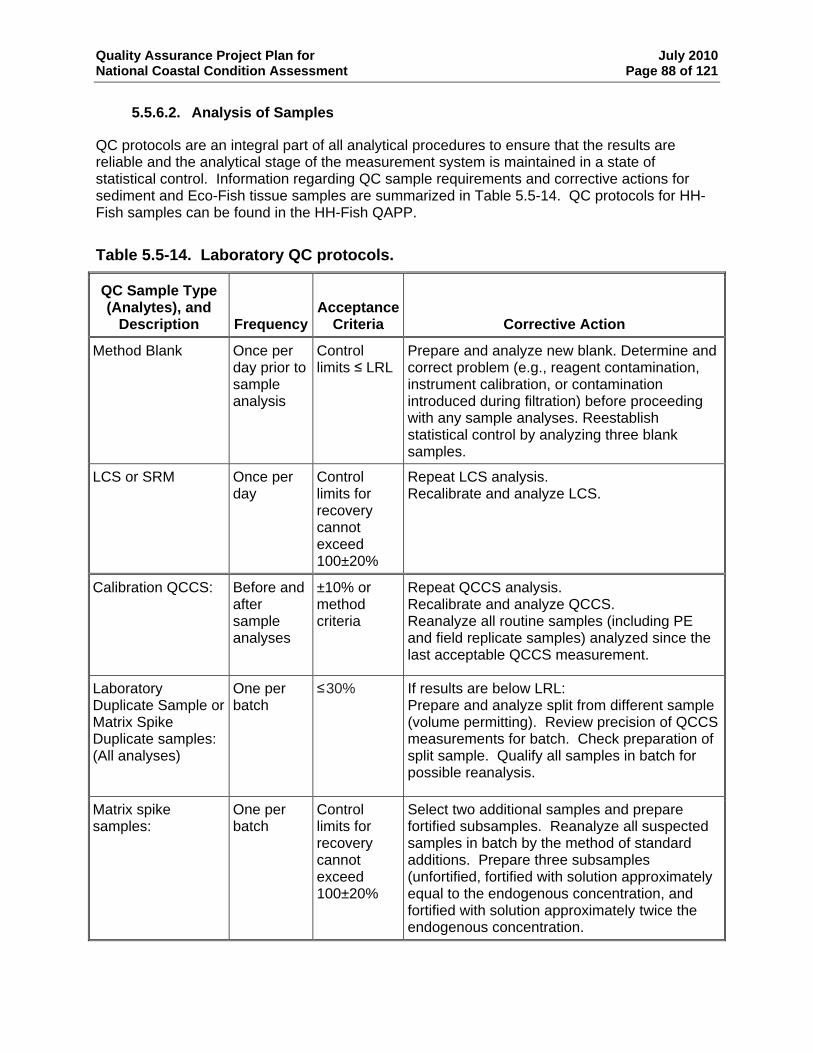
Quality Assurance Project Plan for July 2010 National Coastal Condition Assessment Page 88 of 121
5.5.6.2. Analysis of Samples
QC protocols are an integral part of all analytical procedures to ensure that the results are reliable and the analytical stage of the measurement system is maintained in a state of statistical control. Information regarding QC sample requirements and corrective actions for sediment and Eco-Fish tissue samples are summarized in Table 5.5-14. QC protocols for HH-Fish samples can be found in the HH-Fish QAPP.
Table 5.5-14. Laboratory QC protocols.
QC Sample Type (Analytes), and
Description Frequency Acceptance
Criteria Corrective Action
Method Blank Once per day prior to sample analysis
Control limits ≤ LRL
Prepare and analyze new blank. Determine and correct problem (e.g., reagent contamination, instrument calibration, or contamination introduced during filtration) before proceeding with any sample analyses. Reestablish statistical control by analyzing three blank samples.
LCS or SRM Once per day
Control limits for recovery cannot exceed 100±20%
Repeat LCS analysis. Recalibrate and analyze LCS.
Calibration QCCS:
Before and after sample analyses
±10% or method criteria
Repeat QCCS analysis. Recalibrate and analyze QCCS. Reanalyze all routine samples (including PE and field replicate samples) analyzed since the last acceptable QCCS measurement.
Laboratory Duplicate Sample or Matrix Spike Duplicate samples: (All analyses)
One per batch
≤30% If results are below LRL: Prepare and analyze split from different sample (volume permitting). Review precision of QCCS measurements for batch. Check preparation of split sample. Qualify all samples in batch for possible reanalysis.
Matrix spike samples:
One per batch
Control limits for recovery cannot exceed 100±20%
Select two additional samples and prepare fortified subsamples. Reanalyze all suspected samples in batch by the method of standard additions. Prepare three subsamples (unfortified, fortified with solution approximately equal to the endogenous concentration, and fortified with solution approximately twice the endogenous concentration.
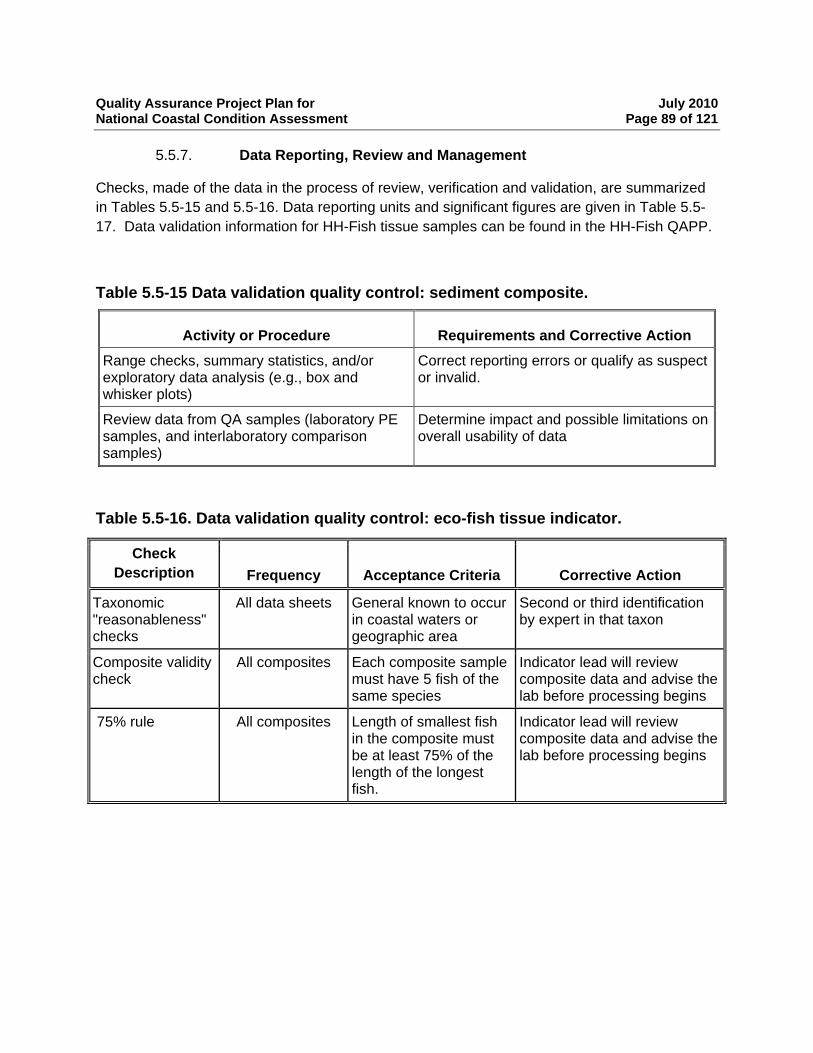
Quality Assurance Project Plan for July 2010 National Coastal Condition Assessment Page 89 of 121
5.5.7. Data Reporting, Review and Management
Checks, made of the data in the process of review, verification and validation, are summarized in Tables 5.5-15 and 5.5-16. Data reporting units and significant figures are given in Table 5.5-17. Data validation information for HH-Fish tissue samples can be found in the HH-Fish QAPP.
Table 5.5-15 Data validation quality control: sediment composite.
Activity or Procedure Requirements and Corrective Action Range checks, summary statistics, and/or exploratory data analysis (e.g., box and whisker plots)
Correct reporting errors or qualify as suspect or invalid.
Review data from QA samples (laboratory PE samples, and interlaboratory comparison samples)
Determine impact and possible limitations on overall usability of data
Table 5.5-16. Data validation quality control: eco-fish tissue indicator.
Check Description Frequency Acceptance Criteria Corrective Action
Taxonomic "reasonableness" checks
All data sheets General known to occur in coastal waters or geographic area
Second or third identification by expert in that taxon
Composite validity check
All composites Each composite sample must have 5 fish of the same species
Indicator lead will review composite data and advise the lab before processing begins
75% rule All composites Length of smallest fish in the composite must be at least 75% of the length of the longest fish.
Indicator lead will review composite data and advise the lab before processing begins
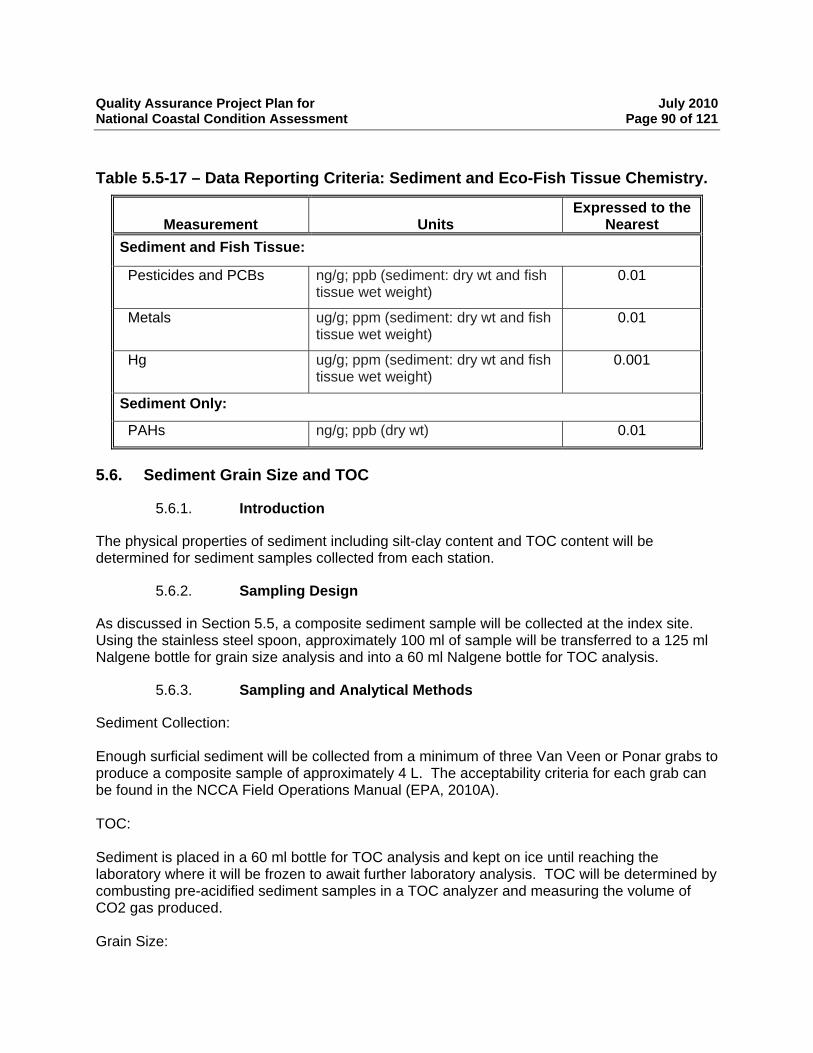
Quality Assurance Project Plan for July 2010 National Coastal Condition Assessment Page 90 of 121
Table 5.5-17 – Data Reporting Criteria: Sediment and Eco-Fish Tissue Chemistry.
Measurement Units Expressed to the
Nearest Sediment and Fish Tissue:
Pesticides and PCBs ng/g; ppb (sediment: dry wt and fish tissue wet weight)
0.01
Metals ug/g; ppm (sediment: dry wt and fish tissue wet weight)
0.01
Hg ug/g; ppm (sediment: dry wt and fish tissue wet weight)
0.001
Sediment Only:
PAHs ng/g; ppb (dry wt) 0.01
5.6. Sediment Grain Size and TOC
5.6.1. Introduction
The physical properties of sediment including silt-clay content and TOC content will be determined for sediment samples collected from each station.
5.6.2. Sampling Design
As discussed in Section 5.5, a composite sediment sample will be collected at the index site. Using the stainless steel spoon, approximately 100 ml of sample will be transferred to a 125 ml Nalgene bottle for grain size analysis and into a 60 ml Nalgene bottle for TOC analysis.
5.6.3. Sampling and Analytical Methods
Sediment Collection: Enough surficial sediment will be collected from a minimum of three Van Veen or Ponar grabs to produce a composite sample of approximately 4 L. The acceptability criteria for each grab can be found in the NCCA Field Operations Manual (EPA, 2010A). TOC: Sediment is placed in a 60 ml bottle for TOC analysis and kept on ice until reaching the laboratory where it will be frozen to await further laboratory analysis. TOC will be determined by combusting pre-acidified sediment samples in a TOC analyzer and measuring the volume of CO2 gas produced. Grain Size:
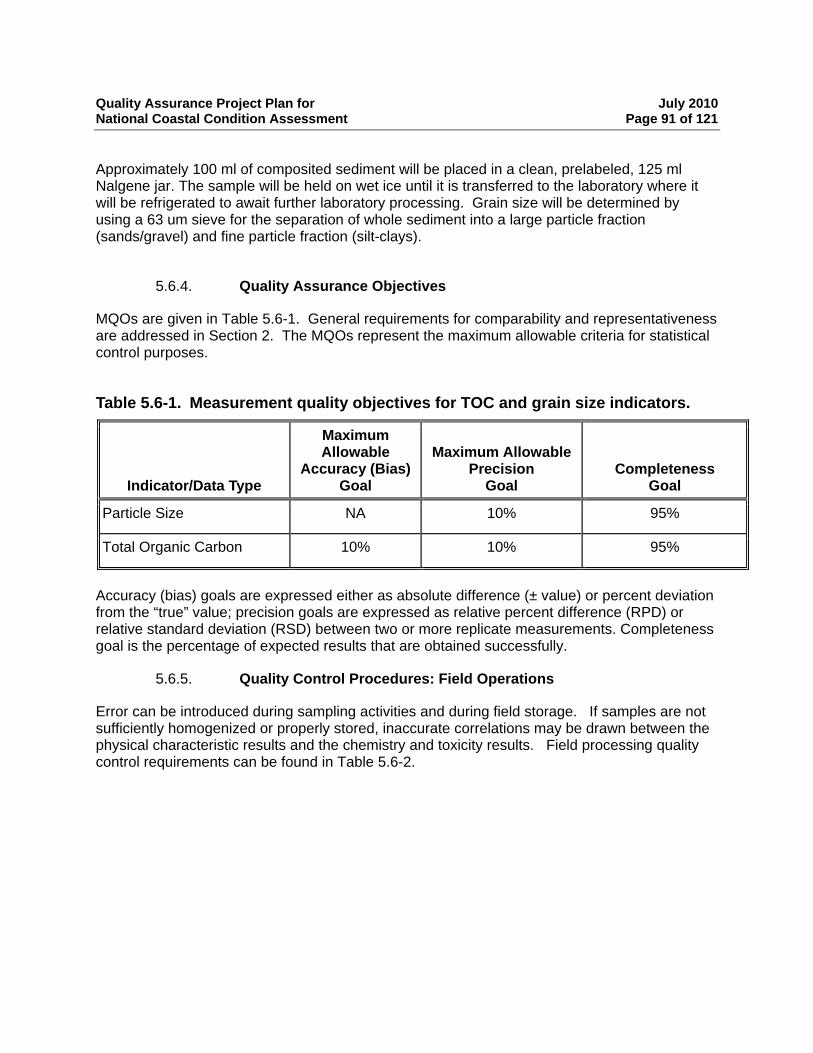
Quality Assurance Project Plan for July 2010 National Coastal Condition Assessment Page 91 of 121
Approximately 100 ml of composited sediment will be placed in a clean, prelabeled, 125 ml Nalgene jar. The sample will be held on wet ice until it is transferred to the laboratory where it will be refrigerated to await further laboratory processing. Grain size will be determined by using a 63 um sieve for the separation of whole sediment into a large particle fraction (sands/gravel) and fine particle fraction (silt-clays).
5.6.4. Quality Assurance Objectives
MQOs are given in Table 5.6-1. General requirements for comparability and representativeness are addressed in Section 2. The MQOs represent the maximum allowable criteria for statistical control purposes.
Table 5.6-1. Measurement quality objectives for TOC and grain size indicators.
Indicator/Data Type
Maximum Allowable
Accuracy (Bias) Goal
Maximum Allowable Precision
Goal
Completeness
Goal
Particle Size NA 10% 95%
Total Organic Carbon 10% 10% 95%
Accuracy (bias) goals are expressed either as absolute difference (± value) or percent deviation from the “true” value; precision goals are expressed as relative percent difference (RPD) or relative standard deviation (RSD) between two or more replicate measurements. Completeness goal is the percentage of expected results that are obtained successfully.
5.6.5. Quality Control Procedures: Field Operations
Error can be introduced during sampling activities and during field storage. If samples are not sufficiently homogenized or properly stored, inaccurate correlations may be drawn between the physical characteristic results and the chemistry and toxicity results. Field processing quality control requirements can be found in Table 5.6-2.
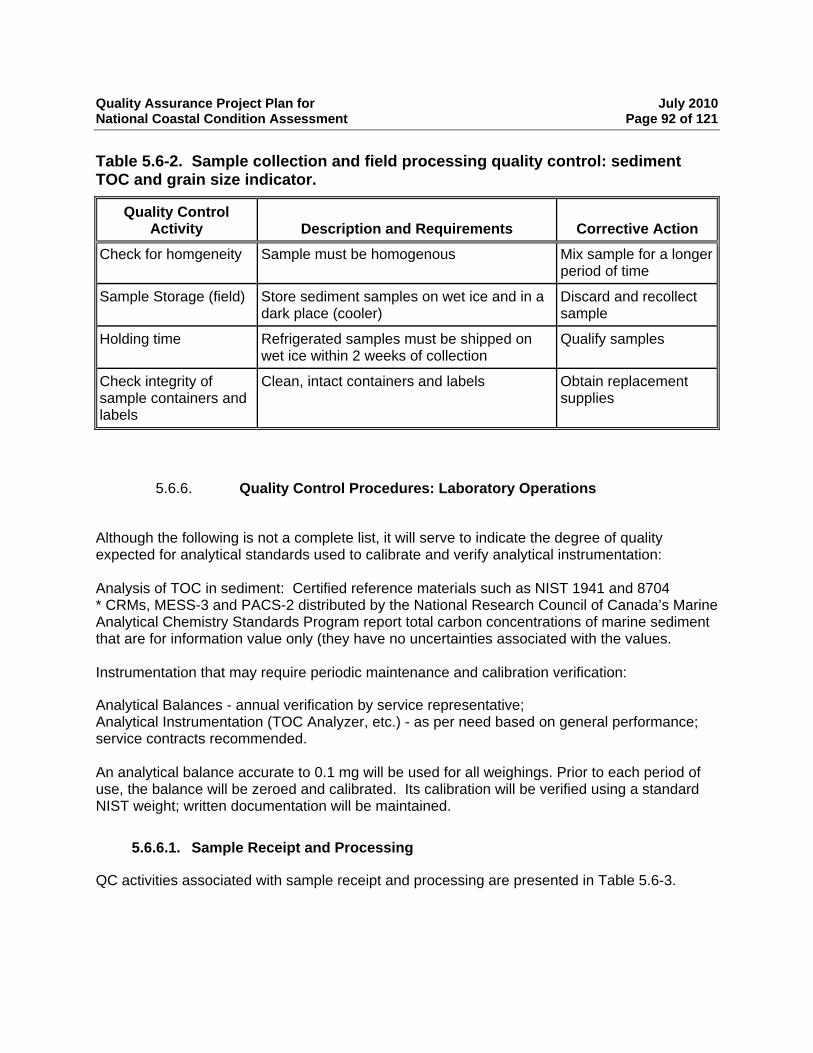
Quality Assurance Project Plan for July 2010 National Coastal Condition Assessment Page 92 of 121
Table 5.6-2. Sample collection and field processing quality control: sediment TOC and grain size indicator.
Quality Control Activity Description and Requirements Corrective Action
Check for homgeneity Sample must be homogenous Mix sample for a longer period of time
Sample Storage (field) Store sediment samples on wet ice and in a dark place (cooler)
Discard and recollect sample
Holding time Refrigerated samples must be shipped on wet ice within 2 weeks of collection
Qualify samples
Check integrity of sample containers and labels
Clean, intact containers and labels Obtain replacement supplies
5.6.6. Quality Control Procedures: Laboratory Operations
Although the following is not a complete list, it will serve to indicate the degree of quality expected for analytical standards used to calibrate and verify analytical instrumentation: Analysis of TOC in sediment: Certified reference materials such as NIST 1941 and 8704 * CRMs, MESS-3 and PACS-2 distributed by the National Research Council of Canada’s Marine Analytical Chemistry Standards Program report total carbon concentrations of marine sediment that are for information value only (they have no uncertainties associated with the values. Instrumentation that may require periodic maintenance and calibration verification:
Analytical Balances - annual verification by service representative; Analytical Instrumentation (TOC Analyzer, etc.) - as per need based on general performance; service contracts recommended. An analytical balance accurate to 0.1 mg will be used for all weighings. Prior to each period of use, the balance will be zeroed and calibrated. Its calibration will be verified using a standard NIST weight; written documentation will be maintained.
5.6.6.1. Sample Receipt and Processing
QC activities associated with sample receipt and processing are presented in Table 5.6-3.
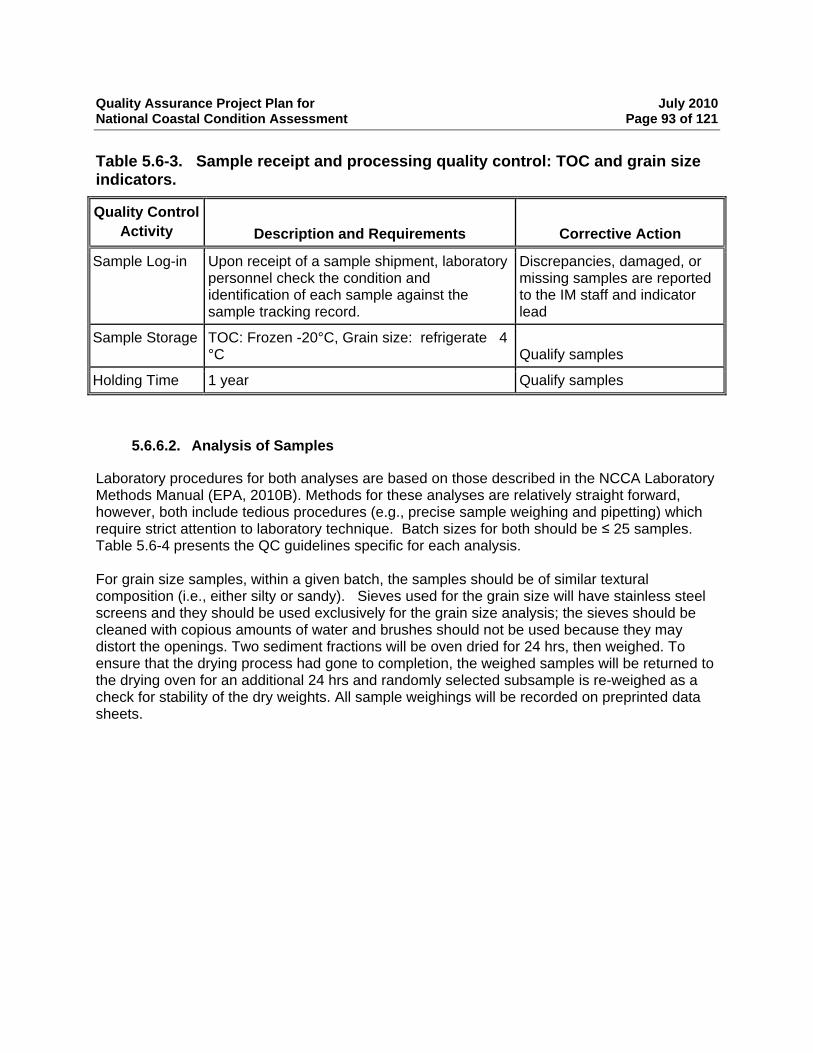
Quality Assurance Project Plan for July 2010 National Coastal Condition Assessment Page 93 of 121
Table 5.6-3. Sample receipt and processing quality control: TOC and grain size indicators.
Quality Control Activity Description and Requirements Corrective Action
Sample Log-in Upon receipt of a sample shipment, laboratory personnel check the condition and identification of each sample against the sample tracking record.
Discrepancies, damaged, or missing samples are reported to the IM staff and indicator lead
Sample Storage TOC: Frozen -20°C, Grain size: refrigerate 4 °C Qualify samples
Holding Time 1 year Qualify samples
5.6.6.2. Analysis of Samples
Laboratory procedures for both analyses are based on those described in the NCCA Laboratory Methods Manual (EPA, 2010B). Methods for these analyses are relatively straight forward, however, both include tedious procedures (e.g., precise sample weighing and pipetting) which require strict attention to laboratory technique. Batch sizes for both should be ≤ 25 samples. Table 5.6-4 presents the QC guidelines specific for each analysis. For grain size samples, within a given batch, the samples should be of similar textural composition (i.e., either silty or sandy). Sieves used for the grain size will have stainless steel screens and they should be used exclusively for the grain size analysis; the sieves should be cleaned with copious amounts of water and brushes should not be used because they may distort the openings. Two sediment fractions will be oven dried for 24 hrs, then weighed. To ensure that the drying process had gone to completion, the weighed samples will be returned to the drying oven for an additional 24 hrs and randomly selected subsample is re-weighed as a check for stability of the dry weights. All sample weighings will be recorded on preprinted data sheets.
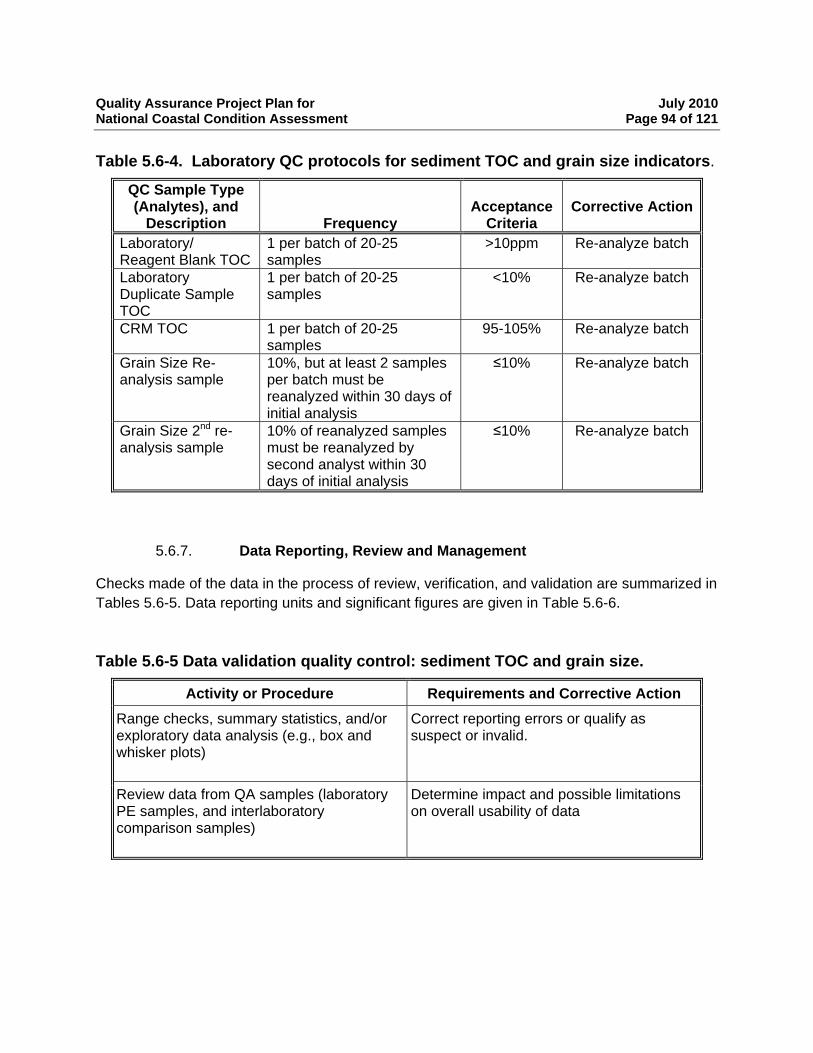
Quality Assurance Project Plan for July 2010 National Coastal Condition Assessment Page 94 of 121
Table 5.6-4. Laboratory QC protocols for sediment TOC and grain size indicators.
QC Sample Type (Analytes), and
Description Frequency Acceptance
Criteria Corrective Action
Laboratory/ Reagent Blank TOC
1 per batch of 20-25 samples
>10ppm Re-analyze batch
Laboratory Duplicate Sample TOC
1 per batch of 20-25 samples
<10% Re-analyze batch
CRM TOC 1 per batch of 20-25 samples
95-105% Re-analyze batch
Grain Size Re-analysis sample
10%, but at least 2 samples per batch must be reanalyzed within 30 days of initial analysis
≤10% Re-analyze batch
Grain Size 2nd re-analysis sample
10% of reanalyzed samples must be reanalyzed by second analyst within 30 days of initial analysis
≤10% Re-analyze batch
5.6.7. Data Reporting, Review and Management
Checks made of the data in the process of review, verification, and validation are summarized in Tables 5.6-5. Data reporting units and significant figures are given in Table 5.6-6.
Table 5.6-5 Data validation quality control: sediment TOC and grain size.
Activity or Procedure Requirements and Corrective Action Range checks, summary statistics, and/or exploratory data analysis (e.g., box and whisker plots)
Correct reporting errors or qualify as suspect or invalid.
Review data from QA samples (laboratory PE samples, and interlaboratory comparison samples)
Determine impact and possible limitations on overall usability of data
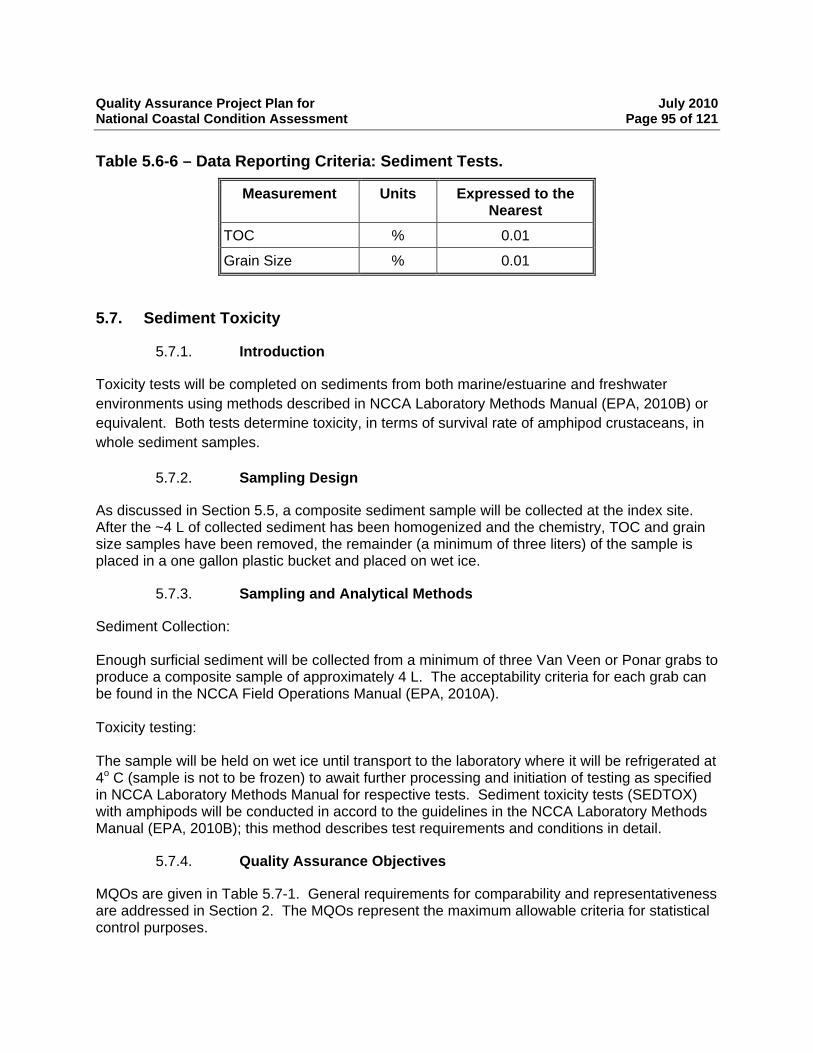
Quality Assurance Project Plan for July 2010 National Coastal Condition Assessment Page 95 of 121
Table 5.6-6 – Data Reporting Criteria: Sediment Tests.
Measurement Units Expressed to the Nearest
TOC % 0.01
Grain Size % 0.01
5.7. Sediment Toxicity
5.7.1. Introduction
Toxicity tests will be completed on sediments from both marine/estuarine and freshwater environments using methods described in NCCA Laboratory Methods Manual (EPA, 2010B) or equivalent. Both tests determine toxicity, in terms of survival rate of amphipod crustaceans, in whole sediment samples.
5.7.2. Sampling Design
As discussed in Section 5.5, a composite sediment sample will be collected at the index site. After the ~4 L of collected sediment has been homogenized and the chemistry, TOC and grain size samples have been removed, the remainder (a minimum of three liters) of the sample is placed in a one gallon plastic bucket and placed on wet ice.
5.7.3. Sampling and Analytical Methods
Sediment Collection: Enough surficial sediment will be collected from a minimum of three Van Veen or Ponar grabs to produce a composite sample of approximately 4 L. The acceptability criteria for each grab can be found in the NCCA Field Operations Manual (EPA, 2010A). Toxicity testing: The sample will be held on wet ice until transport to the laboratory where it will be refrigerated at 4o C (sample is not to be frozen) to await further processing and initiation of testing as specified in NCCA Laboratory Methods Manual for respective tests. Sediment toxicity tests (SEDTOX) with amphipods will be conducted in accord to the guidelines in the NCCA Laboratory Methods Manual (EPA, 2010B); this method describes test requirements and conditions in detail.
5.7.4. Quality Assurance Objectives
MQOs are given in Table 5.7-1. General requirements for comparability and representativeness are addressed in Section 2. The MQOs represent the maximum allowable criteria for statistical control purposes.
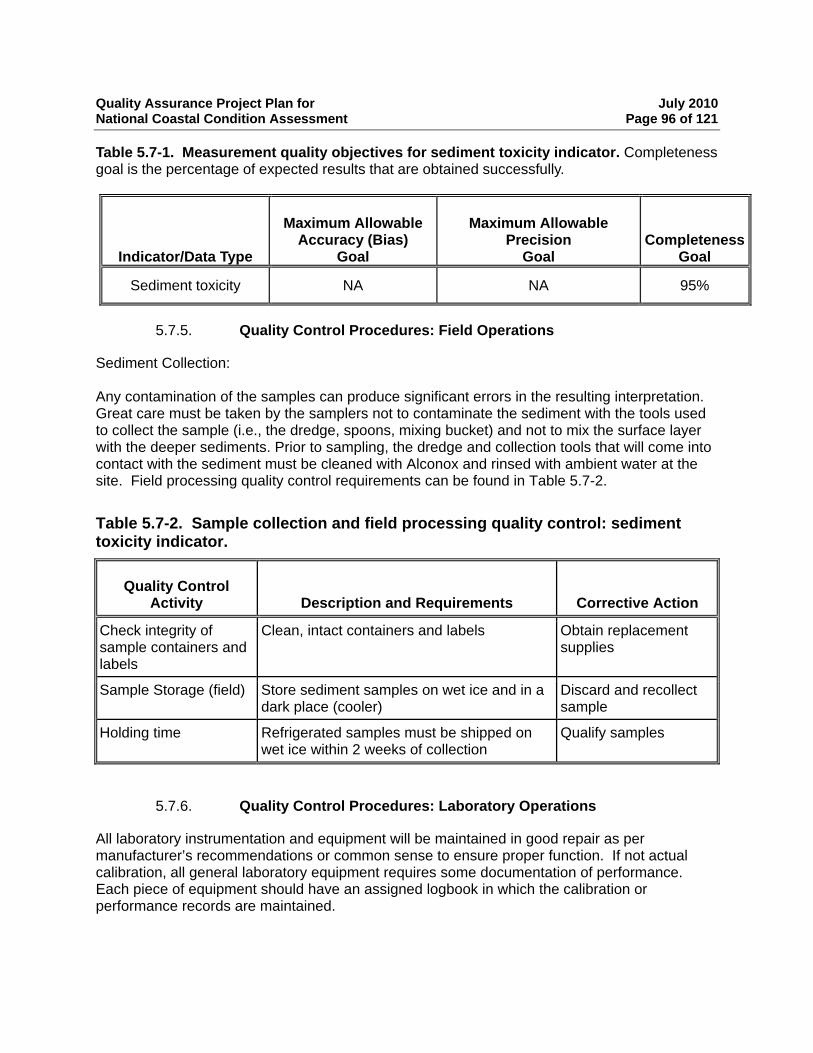
Quality Assurance Project Plan for July 2010 National Coastal Condition Assessment Page 96 of 121
Table 5.7-1. Measurement quality objectives for sediment toxicity indicator. Completeness goal is the percentage of expected results that are obtained successfully.
Indicator/Data Type
Maximum Allowable Accuracy (Bias)
Goal
Maximum Allowable Precision
Goal Completeness
Goal
Sediment toxicity NA NA 95%
5.7.5. Quality Control Procedures: Field Operations
Sediment Collection: Any contamination of the samples can produce significant errors in the resulting interpretation. Great care must be taken by the samplers not to contaminate the sediment with the tools used to collect the sample (i.e., the dredge, spoons, mixing bucket) and not to mix the surface layer with the deeper sediments. Prior to sampling, the dredge and collection tools that will come into contact with the sediment must be cleaned with Alconox and rinsed with ambient water at the site. Field processing quality control requirements can be found in Table 5.7-2.
Table 5.7-2. Sample collection and field processing quality control: sediment toxicity indicator.
Quality Control Activity Description and Requirements Corrective Action
Check integrity of sample containers and labels
Clean, intact containers and labels Obtain replacement supplies
Sample Storage (field) Store sediment samples on wet ice and in a dark place (cooler)
Discard and recollect sample
Holding time Refrigerated samples must be shipped on wet ice within 2 weeks of collection
Qualify samples
5.7.6. Quality Control Procedures: Laboratory Operations
All laboratory instrumentation and equipment will be maintained in good repair as per manufacturer’s recommendations or common sense to ensure proper function. If not actual calibration, all general laboratory equipment requires some documentation of performance. Each piece of equipment should have an assigned logbook in which the calibration or performance records are maintained.
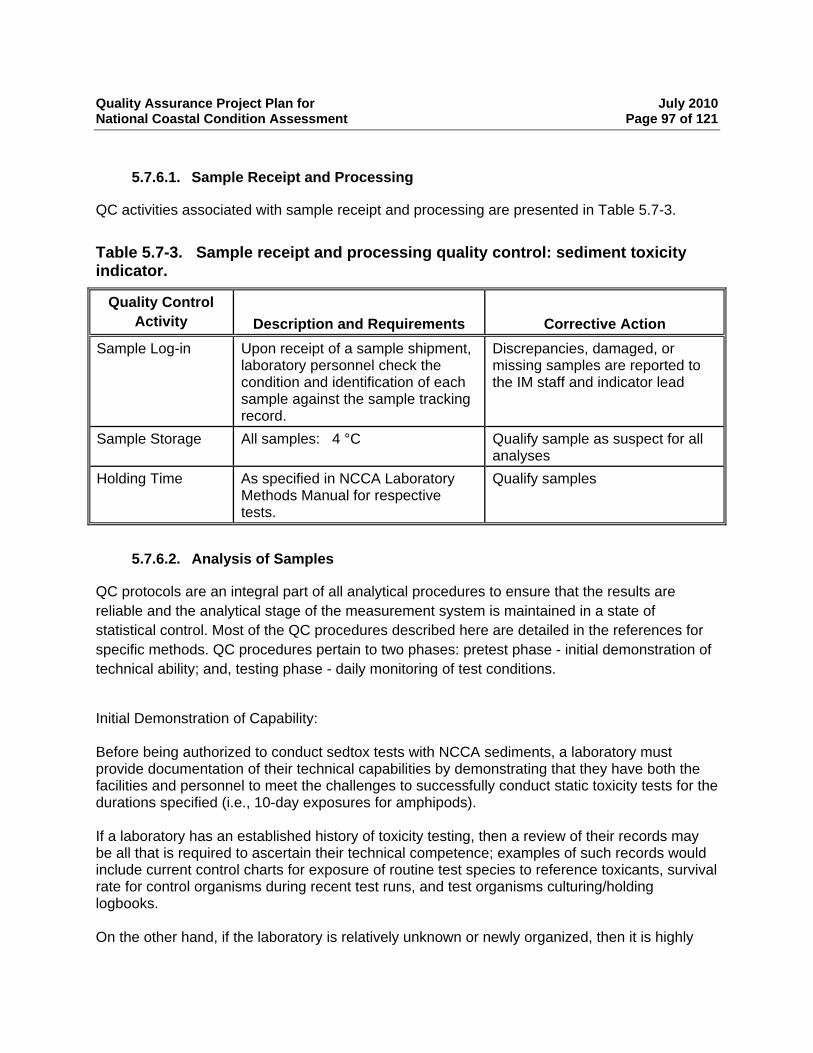
Quality Assurance Project Plan for July 2010 National Coastal Condition Assessment Page 97 of 121
5.7.6.1. Sample Receipt and Processing
QC activities associated with sample receipt and processing are presented in Table 5.7-3.
Table 5.7-3. Sample receipt and processing quality control: sediment toxicity indicator.
Quality Control Activity Description and Requirements Corrective Action
Sample Log-in Upon receipt of a sample shipment, laboratory personnel check the condition and identification of each sample against the sample tracking record.
Discrepancies, damaged, or missing samples are reported to the IM staff and indicator lead
Sample Storage All samples: 4 °C Qualify sample as suspect for all analyses
Holding Time As specified in NCCA Laboratory Methods Manual for respective tests.
Qualify samples
5.7.6.2. Analysis of Samples
QC protocols are an integral part of all analytical procedures to ensure that the results are reliable and the analytical stage of the measurement system is maintained in a state of statistical control. Most of the QC procedures described here are detailed in the references for specific methods. QC procedures pertain to two phases: pretest phase - initial demonstration of technical ability; and, testing phase - daily monitoring of test conditions.
Initial Demonstration of Capability: Before being authorized to conduct sedtox tests with NCCA sediments, a laboratory must provide documentation of their technical capabilities by demonstrating that they have both the facilities and personnel to meet the challenges to successfully conduct static toxicity tests for the durations specified (i.e., 10-day exposures for amphipods). If a laboratory has an established history of toxicity testing, then a review of their records may be all that is required to ascertain their technical competence; examples of such records would include current control charts for exposure of routine test species to reference toxicants, survival rate for control organisms during recent test runs, and test organisms culturing/holding logbooks. On the other hand, if the laboratory is relatively unknown or newly organized, then it is highly
Quality Assurance Project Plan for July 2010 National Coastal Condition Assessment Page 98 of 121
suggested that they first conduct a series of performance evaluation (PE) exercises prior to being authorized to conduct toxicity test with NCCA sediments; also, a site visit to the testing facility is recommended to verify the laboratory’s physical conditions. PE exercises should include having the laboratory capture/culture or commercially obtain batches of approved test species and hold them under the conditions described by test methods, without exposure to toxic agents, to ensure that the laboratory technicians have the expertise required and that the laboratory’s systems are adequate to support the organisms in an apparent healthy state for the designated period of testing (e.g., 10 days for marine amphipods). The laboratory should also conduct a series of replicated exposures to reference toxicants to determine if the organisms respond to the range of concentrations where effects are expected and to evaluate the laboratory’s degree of precision or reproducibility. Acceptability criteria for these PEs are for the laboratory to demonstrate that they can successfully hold test organisms for up to 10 days with survival rates of >90%. For reference toxicant tests, the laboratory should produce calculated LC50s (concentration estimated to be lethal to 50 percent of the organisms exposed to a test treatment) within the range routinely reported by other testing laboratories with established programs, and, the degree of precision between 4 or more replicated tests should be within a range of 2 standard deviations (2 sigma). Evaluation should be made by the EPA Project Officer. A laboratory should not start testing with NCCA sediments until notified in writing that they are qualified to initiate testing. Daily Monitoring: Tests will be conducted in accord to the procedures described in the NCCA Laboratory Methods Manual (EPA, 2010B). QC requirements during the test period include: daily checks of testing conditions (e.g., dissolved oxygen concentration, temperature, and lighting) and observations on condition of test organisms. These data will be checked on a daily basis and recorded on standard data sheets as prescribed by the test method. As much as possible, testing conditions should remain within the measurement thresholds appropriate for a specific test (e.g., hyalella, leptocheirus). For a test to be considered valid, mean survival in hyalella and leptocheirus treatments must remain >80% and >90%, respectively. Additional QA evaluations may be considered in those instances where a mean control survival result includes any single control replicate measure falling below 85%.
5.7.7. Data Reporting, Review and Management
Checks made of the data in the process of review, verification, and validation are summarized in Tables 5.7-4. Data reporting units and significant figures are given in Table 5.7-5.
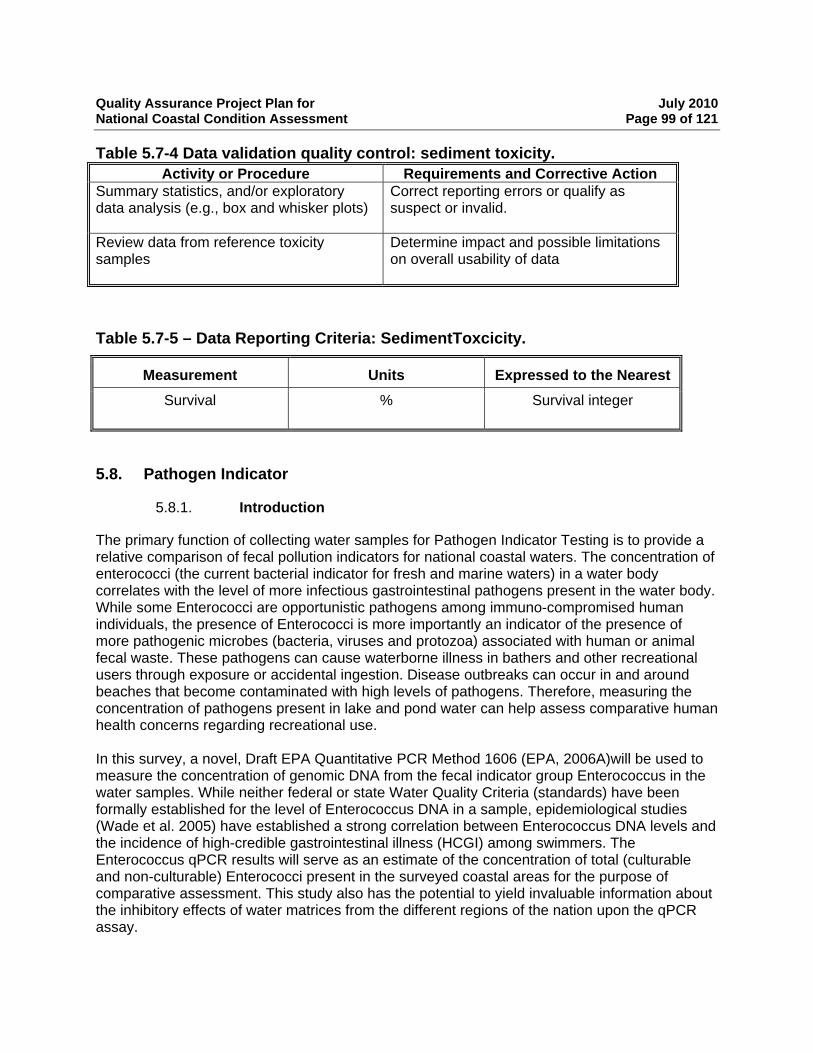
Quality Assurance Project Plan for July 2010 National Coastal Condition Assessment Page 99 of 121
Table 5.7-4 Data validation quality control: sediment toxicity. Activity or Procedure Requirements and Corrective Action
Summary statistics, and/or exploratory Correct reporting errors or qualify as data analysis (e.g., box and whisker plots) suspect or invalid. Review data from reference toxicity Determine impact and possible limitations samples on overall usability of data
Table 5.7-5 – Data Reporting Criteria: SedimentToxcicity.
Measurement Units Expressed to the Nearest Survival % Survival integer
5.8. Pathogen Indicator
5.8.1. Introduction
The primary function of collecting water samples for Pathogen Indicator Testing is to provide a relative comparison of fecal pollution indicators for national coastal waters. The concentration of enterococci (the current bacterial indicator for fresh and marine waters) in a water body correlates with the level of more infectious gastrointestinal pathogens present in the water body. While some Enterococci are opportunistic pathogens among immuno-compromised human individuals, the presence of Enterococci is more importantly an indicator of the presence of more pathogenic microbes (bacteria, viruses and protozoa) associated with human or animal fecal waste. These pathogens can cause waterborne illness in bathers and other recreational users through exposure or accidental ingestion. Disease outbreaks can occur in and around beaches that become contaminated with high levels of pathogens. Therefore, measuring the concentration of pathogens present in lake and pond water can help assess comparative human health concerns regarding recreational use. In this survey, a novel, Draft EPA Quantitative PCR Method 1606 (EPA, 2006A)will be used to measure the concentration of genomic DNA from the fecal indicator group Enterococcus in the water samples. While neither federal or state Water Quality Criteria (standards) have been formally established for the level of Enterococcus DNA in a sample, epidemiological studies (Wade et al. 2005) have established a strong correlation between Enterococcus DNA levels and the incidence of high-credible gastrointestinal illness (HCGI) among swimmers. The Enterococcus qPCR results will serve as an estimate of the concentration of total (culturable and non-culturable) Enterococci present in the surveyed coastal areas for the purpose of comparative assessment. This study also has the potential to yield invaluable information about the inhibitory effects of water matrices from the different regions of the nation upon the qPCR assay.
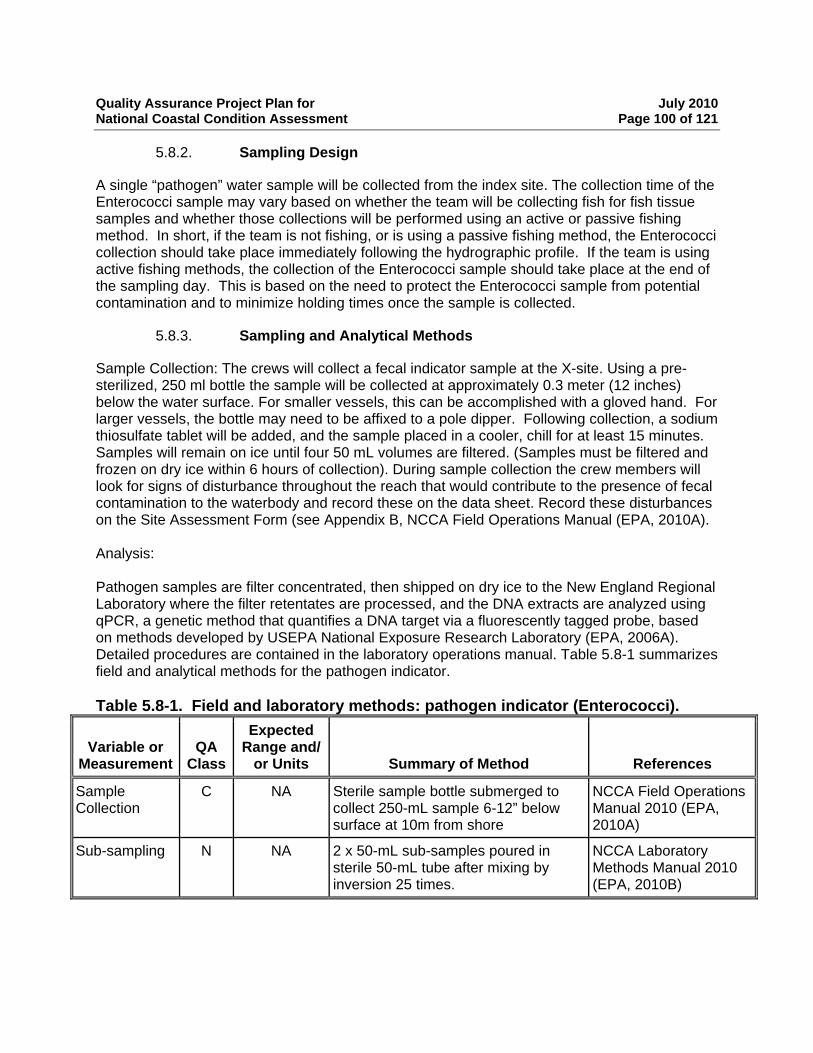
Quality Assurance Project Plan for July 2010 National Coastal Condition Assessment Page 100 of 121
5.8.2. Sampling Design
A single “pathogen” water sample will be collected from the index site. The collection time of the Enterococci sample may vary based on whether the team will be collecting fish for fish tissue samples and whether those collections will be performed using an active or passive fishing method. In short, if the team is not fishing, or is using a passive fishing method, the Enterococci collection should take place immediately following the hydrographic profile. If the team is using active fishing methods, the collection of the Enterococci sample should take place at the end of the sampling day. This is based on the need to protect the Enterococci sample from potential contamination and to minimize holding times once the sample is collected.
5.8.3. Sampling and Analytical Methods
Sample Collection: The crews will collect a fecal indicator sample at the X-site. Using a pre-sterilized, 250 ml bottle the sample will be collected at approximately 0.3 meter (12 inches) below the water surface. For smaller vessels, this can be accomplished with a gloved hand. For larger vessels, the bottle may need to be affixed to a pole dipper. Following collection, a sodium thiosulfate tablet will be added, and the sample placed in a cooler, chill for at least 15 minutes. Samples will remain on ice until four 50 mL volumes are filtered. (Samples must be filtered and frozen on dry ice within 6 hours of collection). During sample collection the crew members will look for signs of disturbance throughout the reach that would contribute to the presence of fecal contamination to the waterbody and record these on the data sheet. Record these disturbances on the Site Assessment Form (see Appendix B, NCCA Field Operations Manual (EPA, 2010A). Analysis: Pathogen samples are filter concentrated, then shipped on dry ice to the New England Regional Laboratory where the filter retentates are processed, and the DNA extracts are analyzed using qPCR, a genetic method that quantifies a DNA target via a fluorescently tagged probe, based on methods developed by USEPA National Exposure Research Laboratory (EPA, 2006A). Detailed procedures are contained in the laboratory operations manual. Table 5.8-1 summarizes field and analytical methods for the pathogen indicator. Table 5.8-1. Field and laboratory methods: pathogen indicator (Enterococci).
Variable or Measurement
QA Class
Expected Range and/
or Units
Summary of Method
References
Sample C NA Sterile sample bottle submerged to NCCA Field Operations Collection collect 250-mL sample 6-12” below Manual 2010 (EPA,
surface at 10m from shore 2010A)
Sub-sampling N NA 2 x 50-mL sub-samples poured in NCCA Laboratory sterile 50-mL tube after mixing by Methods Manual 2010 inversion 25 times. (EPA, 2010B)
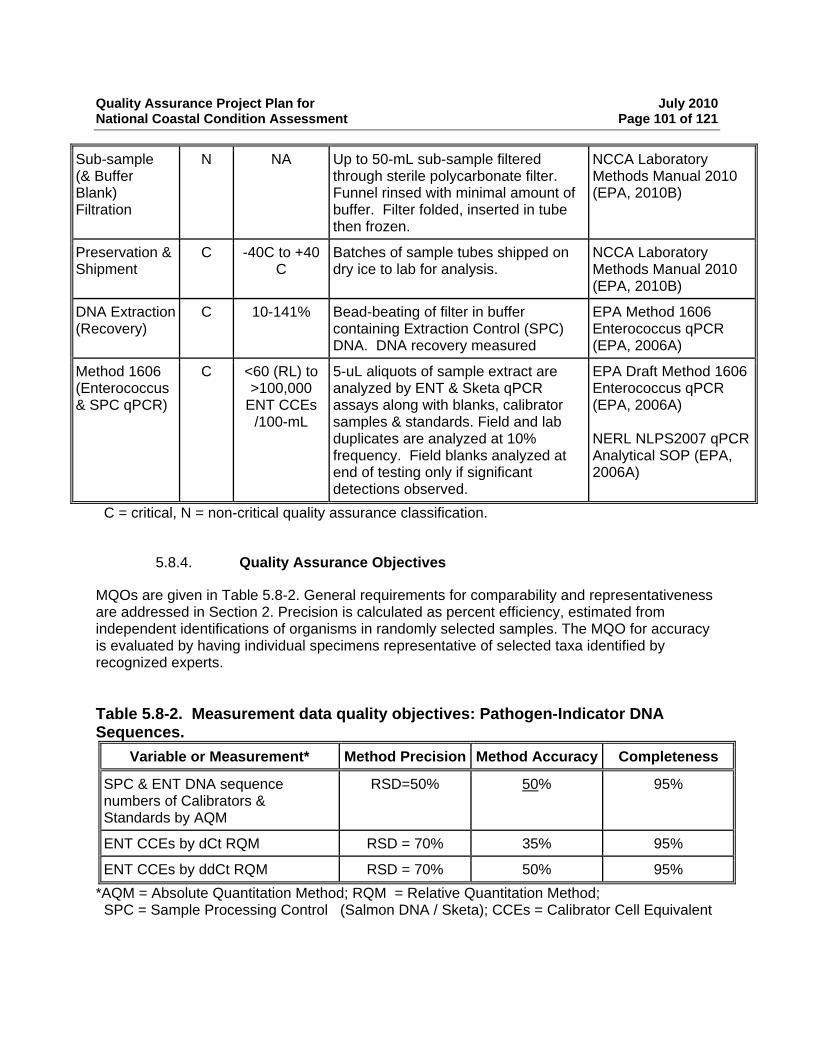
Quality Assurance Project Plan for July 2010 National Coastal Condition Assessment Page 101 of 121
Sub-sample (& Buffer Blank) Filtration
N NA Up to 50-mL sub-sample filtered through sterile polycarbonate filter. Funnel rinsed with minimal amount of buffer. Filter folded, inserted in tube then frozen.
NCCA Laboratory Methods Manual 2010 (EPA, 2010B)
Preservation & Shipment
C -40C to +40 C
Batches of sample tubes shipped on dry ice to lab for analysis.
NCCA Laboratory Methods Manual 2010 (EPA, 2010B)
DNA Extraction (Recovery)
C 10-141% Bead-beating of filter in buffer containing Extraction Control (SPC) DNA. DNA recovery measured
EPA Method 1606 Enterococcus qPCR (EPA, 2006A)
Method 1606 (Enterococcus & SPC qPCR)
C <60 (RL) to >100,000
ENT CCEs /100-mL
5-uL aliquots of sample extract are analyzed by ENT & Sketa qPCR assays along with blanks, calibrator samples & standards. Field and lab duplicates are analyzed at 10% frequency. Field blanks analyzed at end of testing only if significant detections observed.
EPA Draft Method 1606 Enterococcus qPCR (EPA, 2006A) NERL NLPS2007 qPCR Analytical SOP (EPA, 2006A)
C = critical, N = non-critical quality assurance classification.
5.8.4. Quality Assurance Objectives
MQOs are given in Table 5.8-2. General requirements for comparability and representativeness are addressed in Section 2. Precision is calculated as percent efficiency, estimated from independent identifications of organisms in randomly selected samples. The MQO for accuracy is evaluated by having individual specimens representative of selected taxa identified by recognized experts. Table 5.8-2. Measurement data quality objectives: Pathogen-Indicator DNA Sequences.
Variable or Measurement* Method Precision Method Accuracy Completeness
SPC & ENT DNA sequence numbers of Calibrators & Standards by AQM
RSD=50% 50% 95%
ENT CCEs by dCt RQM RSD = 70% 35% 95%
ENT CCEs by ddCt RQM RSD = 70% 50% 95% *AQM = Absolute Quantitation Method; RQM = Relative Quantitation Method; SPC = Sample Processing Control (Salmon DNA / Sketa); CCEs = Calibrator Cell Equivalent
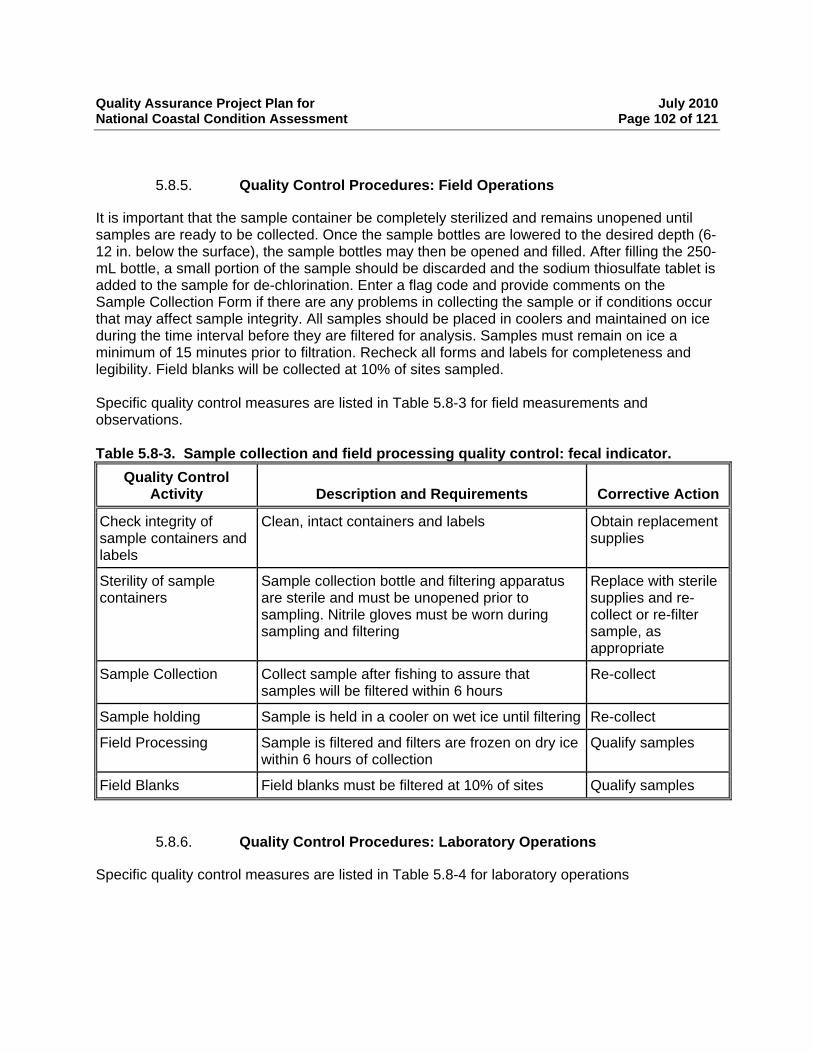
Quality Assurance Project Plan for July 2010 National Coastal Condition Assessment Page 102 of 121
5.8.5. Quality Control Procedures: Field Operations
It is important that the sample container be completely sterilized and remains unopened until samples are ready to be collected. Once the sample bottles are lowered to the desired depth (6-12 in. below the surface), the sample bottles may then be opened and filled. After filling the 250-mL bottle, a small portion of the sample should be discarded and the sodium thiosulfate tablet is added to the sample for de-chlorination. Enter a flag code and provide comments on the Sample Collection Form if there are any problems in collecting the sample or if conditions occur that may affect sample integrity. All samples should be placed in coolers and maintained on ice during the time interval before they are filtered for analysis. Samples must remain on ice a minimum of 15 minutes prior to filtration. Recheck all forms and labels for completeness and legibility. Field blanks will be collected at 10% of sites sampled. Specific quality control measures are listed in Table 5.8-3 for field measurements and observations. Table 5.8-3. Sample collection and field processing quality control: fecal indicator.
Quality Control Activity Description and Requirements Corrective Action
Check integrity of sample containers and labels
Clean, intact containers and labels Obtain replacement supplies
Sterility of sample containers
Sample collection bottle and filtering apparatus are sterile and must be unopened prior to sampling. Nitrile gloves must be worn during sampling and filtering
Replace with sterile supplies and re-collect or re-filter sample, as appropriate
Sample Collection Collect sample after fishing to assure that samples will be filtered within 6 hours
Re-collect
Sample holding Sample is held in a cooler on wet ice until filtering Re-collect
Field Processing Sample is filtered and filters are frozen on dry ice within 6 hours of collection
Qualify samples
Field Blanks Field blanks must be filtered at 10% of sites Qualify samples
5.8.6. Quality Control Procedures: Laboratory Operations
Specific quality control measures are listed in Table 5.8-4 for laboratory operations
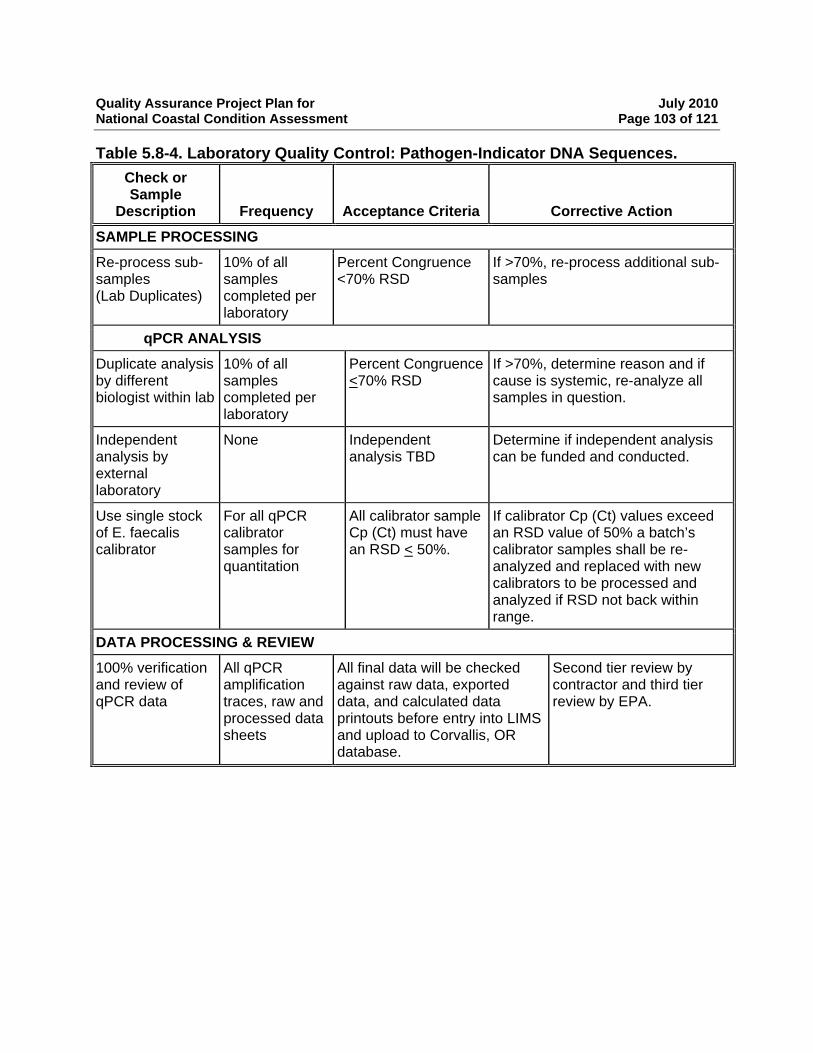
Quality Assurance Project Plan for July 2010 National Coastal Condition Assessment Page 103 of 121
Table 5.8-4. Laboratory Quality Control: Pathogen-Indicator DNA Sequences. Check or Sample
Description
Frequency
Acceptance Criteria
Corrective Action
SAMPLE PROCESSING
Re-process sub-samples (Lab Duplicates)
10% of all samples completed per laboratory
Percent Congruence <70% RSD
If >70%, re-process additional sub-samples
qPCR ANALYSIS
Duplicate analysis by different biologist within lab
10% of all samples completed per laboratory
Percent Congruence <70% RSD
If >70%, determine reason and if cause is systemic, re-analyze all samples in question.
Independent analysis by external laboratory
None Independent analysis TBD
Determine if independent analysis can be funded and conducted.
Use single stock of E. faecalis calibrator
For all qPCR calibrator samples for quantitation
All calibrator sample Cp (Ct) must have an RSD < 50%.
If calibrator Cp (Ct) values exceed an RSD value of 50% a batch’s calibrator samples shall be re-analyzed and replaced with new calibrators to be processed and analyzed if RSD not back within range.
DATA PROCESSING & REVIEW
100% verification and review of qPCR data
All qPCR amplification traces, raw and processed data sheets
All final data will be checked against raw data, exported data, and calculated data printouts before entry into LIMS and upload to Corvallis, OR database.
Second tier review by contractor and third tier review by EPA.
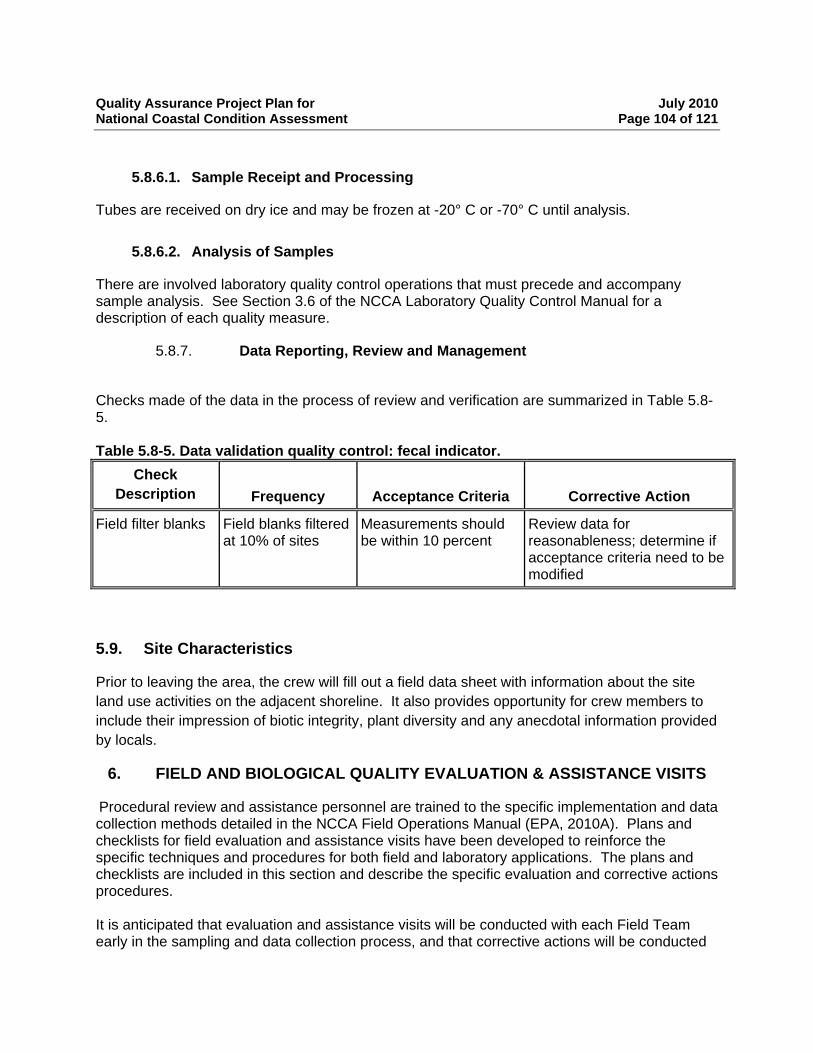
Quality Assurance Project Plan for July 2010 National Coastal Condition Assessment Page 104 of 121
5.8.6.1. Sample Receipt and Processing
Tubes are received on dry ice and may be frozen at -20° C or -70° C until analysis.
5.8.6.2. Analysis of Samples
There are involved laboratory quality control operations that must precede and accompany sample analysis. See Section 3.6 of the NCCA Laboratory Quality Control Manual for a description of each quality measure.
5.8.7. Data Reporting, Review and Management
Checks made of the data in the process of review and verification are summarized in Table 5.8-5. Table 5.8-5. Data validation quality control: fecal indicator.
Check Description Frequency Acceptance Criteria Corrective Action
Field filter blanks Field blanks filtered at 10% of sites
Measurements should be within 10 percent
Review data for reasonableness; determine if acceptance criteria need to be modified
5.9. Site Characteristics
Prior to leaving the area, the crew will fill out a field data sheet with information about the site land use activities on the adjacent shoreline. It also provides opportunity for crew members to include their impression of biotic integrity, plant diversity and any anecdotal information provided by locals.
6. FIELD AND BIOLOGICAL QUALITY EVALUATION & ASSISTANCE VISITS
Procedural review and assistance personnel are trained to the specific implementation and data collection methods detailed in the NCCA Field Operations Manual (EPA, 2010A). Plans and checklists for field evaluation and assistance visits have been developed to reinforce the specific techniques and procedures for both field and laboratory applications. The plans and checklists are included in this section and describe the specific evaluation and corrective actions procedures. It is anticipated that evaluation and assistance visits will be conducted with each Field Team early in the sampling and data collection process, and that corrective actions will be conducted
Quality Assurance Project Plan for July 2010 National Coastal Condition Assessment Page 105 of 121
in real time. These visits provide a basis for the uniform evaluation of the data collection techniques, and an opportunity to conduct procedural reviews as required to minimize data loss due to improper technique or interpretation of program guidance. Through uniform training of field crews and review cycles conducted early in the data collection process, sampling variability associated with specific implementation or interpretation of the protocols will be significantly reduced. The field sampling evaluations, while performed by a number of different supporting collaborator agencies and participants, will be based on the uniform training, plans, and checklists. This review and assistance task will be conducted for each crew collecting and contributing data under this program; hence no data will be recorded to the project database that were produced by an ‘unaudited’ process, or individual. Similarly, laboratory evaluation and assistance visits will be conducted early in the project schedule and soon after sample processing begins at each laboratory to ensure that specific laboratory techniques are implemented consistently across the multiple laboratories generating data for the program. Laboratory evaluation and assistance visit plans and checklists have been developed to ensure uniform interpretation and guidance in the procedural reviews. These laboratory visits are designed such that full corrective action plans and remedies can be implemented in the case of unacceptable deviations from the documented procedures observed in the review process without recollection of samples. NCCA represents a matrix of diverse environmental monitoring measurements and data acquisition activities. Data quality criteria have been established for most of these measurements and the QA program will monitor the success rate of NCCA in meeting the quality goals. While all of the data acquisition activities are of value to the project, certain of them have a higher degree of import than others and will, therefore, receive priority regarding review and assessment of the data quality, especially in the more structured format of audits. Nonetheless, for those activities that are not audited, there are sufficient QA/QC elements associated with each data generating activity to enable the responsible analyst to make a determination on the acceptability of the data. In most cases if the process fails QC checks, the QA policy requires that the samples be re- analyzed until acceptable data are attained. The following sections outline the structured data reviews and assessments of data quality planned for NCCA. Note, if situations warrant, any QA Coordinator delegated NCCA responsibilities will have authority to initiate an audit or review of any NCCA environmental data collection activity that fall under their purview. The States may also elect to initiate audits of their respective in-house activities, at anytime.
Quality Assurance Project Plan for July 2010 National Coastal Condition Assessment Page 106 of 121
6.1 Field Quality Evaluation and Assistance Visit Plan for the NCCA
FIELD MONITORING Field Crew Certification Prior to the start of the 2010 field monitoring, each field crew will be required to complete a 3-4-day field training to be authorized to collect actual NCCA field data and samples. Training will consist primarily of hands-on sessions during which field crew members will be instructed by the QA and Logistics specialists on the sampling methods and protocols developed for NCCA. The training for each crew will culminate with an exercise in which crew members are observed and evaluated as they perform the full suite of core field activities (i.e., complete sampling for a NCCA site). Although that is the preferred approach, because of time and logistical constraints, it may be necessary to certify the crews as they master each major component (e.g., sediment grabs for surficial sediment), then move on to the next, without observing in the context of a real world situation. If a crew fails to qualify on some aspect, the members will receive further instruction in the area of their deficiencies until they perform at an acceptable level. The training schedule can be found in section 1.2.1. Field Reviews A number of field teams will be responsible for the collection of environmental data and samples from the NCCA sampling sites.. It is necessary to maintain an acceptable degree of uniformity between the multiple groups conducting these tasks. NCCA incorporates standard protocols and guidelines to help ensure that the data collected are of known quality. These guidelines allow for the use of different equipment (e.g., various hydrographic meters, work vessels, etc.) as long as the data generated meet NCCA acceptability criteria. Such performance-based QA/QC is a key factor to NCCA’s success in deriving comparable data from diverse participants. Prior to the actual collection of NCCA field data, the field crews are instructed in the approved field methods and protocols during their required initial training. The format for the evaluations will be more of a field “surveillance review.” than “audit.” The surveillance reviews or audits will be conducted by appropriate NCCA Regional, Headquarters, ORD or contractor personnel. The goal is to conduct at least one review per crew early in the crew’s field season. The evaluator will meet the crew in the field and accompany them as they conduct full-scale monitoring activities at one or more sampling sites. The evaluator will use an approved NCCA checklist to systematically document acceptable/unacceptable performance on all pertinent aspects of the sampling (see EPA Site Evaluation Guidelines document (EPA, 2010C)).
Any minor deficiencies observed during a field surveillance (e.g., slight deviation from approved procedures, labeling irregularities, data reporting, etc.) should be immediately pointed out to the crew and corrective actions imposed on-the-spot. The evaluator will document with a brief note
Quality Assurance Project Plan for July 2010 National Coastal Condition Assessment Page 107 of 121
on the checklist and no further writeups are required. If significant deficiencies (i.e., data quality is seriously compromised) are observed, the evaluator will make the appropriate on-the-spot correction, and, if the case warrants, call a halt to the field activities until the problems are resolved to the satisfaction of the QA Coordinator. All cases of this nature will be documented through a written report submitted to the QA Coordinator.
Evaluators: One or more designated EPA or Contractor staff members who are qualified (i.e., have completed training) in the procedures of the NCCA field sampling operations. To Evaluate: Field Sampling Teams during sampling operations on site. Purpose: To identify and correct deficiencies during field sampling operations. 1. Marla Smith and Joe Hall will review the Field Evaluation and Assistance Visit Plan and
Check List with each Evaluator during field operations training sessions. 2. Marla Smith and Joe Hall will send a copy of the final Plan and the final Check List pages,
NCCA QAPP and Field Operations Manual (EPA, 2010A) to each participating Evaluator. 3. Each Evaluator is responsible for providing their own field gear sufficient to accompany the
Field Sampling Teams (e.g., protective clothing, sunscreen, insect repellent, hat, water bottle, food, back pack, cell phone) during a complete sampling cycle. Schedule of the Field visits will be made by the Evaluator in consultation with the Marla Smith and the respective Field sampling crew Leader. Evaluators should be prepared to spend additional time in the field if needed (see below).
4. Working with Marla Smith, EPA evaluators will arrange the schedule of visitation with each Field Team. When appropriate, Marla Smith will work with the contractor to schedule field audits. Ideally, each Field Team will be evaluated within the first two weeks of beginning sampling operations, so that procedures can be corrected or additional training provided, if needed.
5. A Field Team for the NCCA consists of a two- to four-person crew where, at a minimum, the Field sampling crew Leader is fully trained.
6. The Evaluator will view the performance of a team through one complete set of sampling activities as detailed on the Field Evaluation and Assistance Check List. a. Scheduling might necessitate starting the evaluation midway on the list of tasks at a site,
instead of at the beginning. In that case, the Evaluator will follow the team to the next site to complete the evaluation of the first activities on the list.
b. If the Team misses or incorrectly performs a procedure, the Evaluator will note this on the checklist and immediately point this out so the mistake can be corrected on the spot. The role of the Evaluator is to provide additional training and guidance so that the procedures are being performed consistent with the Field Operations Manual (EPA, 2010A), all data are recorded correctly, and paperwork is properly completed at the site.
c. When the sampling operation has been completed, the Evaluator will review the results of the evaluation with the Field Team before leaving the site (if practicable), noting positive practices and problems (i.e., weaknesses [might affect data quality]; deficiencies [would adversely affect data quality]). The Evaluator will ensure that the Team understands the findings and will be able to perform the procedures properly in the future.
d. The Evaluator will record responses or concerns, if any, on the Field Evaluation and
Quality Assurance Project Plan for July 2010 National Coastal Condition Assessment Page 108 of 121
Assistance Check List. They will review this list with the field sampling crew at the site. e. If the Evaluator's findings indicate that the Field Team is not performing the procedures
correctly, safely, or thoroughly, the Evaluator must continue working with this Field Team until certain of the Team's ability to conduct the sampling properly so that data quality is not adversely affected.
f. If the Evaluator finds major deficiencies in the Field Team operations (e.g., less than two members, equipment or performance problems) the Evaluator must contact one of the following QA officials:
i. Marla Smith (202-566-1047) ii. Joe Hall, EPA NCCA QA Officer (202-566-1241)
7. The QA official will contact the EPA Project Leader (Gregory Colianni) or Alternate EPA Project Leader (Treda Grayson) to determine the appropriate course of action.
8. Data records from sampling sites previously visited by this Field Team will be checked to determine whether any sampling sites must be redone.
9. Complete the Field Evaluation and Assistance Check List, including a brief summary of findings, and ensure that all Team members have read this and signed off before leaving the Team.
10. Make a copy of the Field Evaluation and Assistance Check List. Mail the original of each completed Laboratory Evaluation and Assistance Check List to Marla Smith whose address is in Table 1.2-1 in Section 1.
11. Marla Smith and Joe Hall will review the returned Field Evaluation and Assistance Check Lists, note any issues, check off the completion of the evaluation for each participating Laboratory. The original will be filed in the NCCA QA Officer file, Washington DC and pdf versions will be emailed to the appropriate lab, state and regional contacts.
6.2. Laboratory Quality Evaluation and Assistance Visit Plan for the NCCA
LABORATORY ACTIVITIES Analytical Chemistry: The analyses of chemical contaminants (organics and inorganics) in environmental samples are the more difficult analytical activities within the project. NCCA has a vigorous performance based QA/QC program to help ensure that data are of known and acceptable quality (see Quality Control Procedures section for each indicator in Section 5 of this document for detailed description). Because these analyses are technically challenging and relatively expensive to conduct, NCCA will require each analytical laboratory to successfully complete an initial demonstration of technical capability prior to being authorized to conduct analyses with actual NCCA samples. First the laboratory must demonstrate that it is capable of meeting the target MDLs for each analyte of interest in the matrices to be analyzed. Each laboratory must calculate and report MDLs following the procedure specified in 40 CFR Part 136 (Federal Register, Oct. 28, 1984). The matrix and the amount of sample used to determine MDLs should match as closely as possible the matrix and amount of sample that will be used in the analyses of the field samples. Laboratories can demonstrate the capability to conduct analyses in multiple ways. They may provide the results from an accredited lab certification program (i.e. NELAC), audit results
Quality Assurance Project Plan for July 2010 National Coastal Condition Assessment Page 109 of 121
conducted from other projects, results from laboratory intercomparison studies, or choose to analyze a blind evaluation sample. Routine analyses of samples will be conducted in batch runs consisting of 25 or less field samples along with a full complement of QC samples, typically including: continuing calibration curves, reagent blanks, matrix spikes (MS) and MS duplicates, and a reference material (either a SRM or a laboratory control material). These QC samples should be sufficient to allow the analyst, on a real time basis, to evaluate the overall data quality of the sample batch; please refer to the NCCA Laboratory Methods Manual (EPA, 2010B) for a comprehensive discussion of the performance-based QC philosophy and components. If the quality criteria are not met, the analyst should take corrective actions and rerun the batch. When laboratories adhere to this level of in-house data review, only batches that pass the general QC checks should be submitted as final data to the NCCA. Data reports submitted for to NCCA from analytical chemistry laboratories should include the results of all required QC samples. These data will be thoroughly reviewed by NCCA personnel to verify that the quality goals were satisfied. Analytical results that do not meet the general QC requirements will be identified in the NCCA data set with an appropriate QC code. Laboratories conducting analyses are subject to audits at all phases of their association with the project. The audits can be relatively informal site visits or technical systems audits (TSA) conducted prior to, or early in, the project, primarily to confirm that the laboratory has appropriate facilities, personnel, and resources required to conduct the analyses. A more formalized “audit of data quality” may be scheduled after the analyses are well underway or completed, but not beyond a 2-year period of their completion. Audits of data quality are formatted to determine if the QA/QC requirements outlined in the QAPP were in fact followed and documented. If at all possible, NCCA will conduct both TSAs and audits of data quality for each analytical laboratory participating in the project. These audits will be announced well in advance (no surprise audits). However, EPA retains the right to request periodic briefing on the status of QA/QC or specific QC data at any time and if there is reason to suspect that the quality standards are not being met, the NCCA management (i.e, Project Manager or QA Coordinator) can suspend the analysis until the laboratory demonstrates the analytical process is back in control. Water Quality Analyses This suite of analyses consists of separate laboratory determinations for several indices of eutrophication conditions in water (e.g., soluble nutrient levels and chlorophyll content). Although different methods and instrumentation are utilized for the specific measurements, all are conducted using analytical systems that incorporate similar QC requirements (e.g., standard curves, blanks, replicates, and spikes or reference samples) on a batch basis. The QC elements provide the analyst with an immediate indicator of the data quality for a given batch of field samples. If a batch run is substandard, the analyst should halt the analytical process until the problem has been resolved. If the problem is straightforward, the analyst should make the appropriate corrective actions, document the event, then continue or repeated the analysis. If the problem appears complex, for example – such that the entire data set is jeopardized, then the analyst (or laboratory) must inform the State or Regional QA Coordinator of the situation and await further guidance before resuming with the analysis.
Quality Assurance Project Plan for July 2010 National Coastal Condition Assessment Page 110 of 121
The performance level for these analyses will be assessed during several stages of their conduct. The laboratory must supply documentation that they can successfully conduct the required analyses and meet the required QA. The EPA Project Officer must first approve the overall performance for the analytical process before the laboratory (or analyst) is authorized to proceed with the analysis of NCCA field samples. NCCA management personnel will attempt to visit each group, firsthand, and observe the analyses while in progress. If at any time, NCCA management is not satisfied that the quality standards are being met, the analysis may be suspended until corrective measures are taken and the analysis is shown to be under control. The data report submitted by each group should include all QA/QC results. An audit of data quality may be conducted for any of the analytical activities within 2 years following their completion. Sediment Characterizations Percent Silt-Clay:
Sediment grain size will be characterized as percent silt-clay. The procedures, while tedious, are basically a gravimetric determination. The primary QA governing this analysis is strict adherence to the methods described in the NCCA Laboratory Methods (EPA, 2010B). The QC checks for this activity involve replicate samples (10% of all samples) as a check on precision; there are no accuracy-based checks. If the QC replicate fails the quality criteria, the technician will re-analyze all samples from the failed batch. Before silt-clay determinations are conducted with actual NCCA samples, the laboratories slated to perform the assays may be provided with a series of performance evaluation samples representing the range of silt-clay expected in the CM sediments. An audit of data quality may be conducted for this activity at anytime during a 2-year period following its completion.
TOC:
Sediment samples from each NCCA sampling station will be analyzed for TOC. These analyses will be conducted by using a TOC analyzer; QC samples including carbon standards, blanks, duplicate samples, and a SRM will be utilized on a per batch basis. Once the TOC analyzer is calibrated, the analysis is relatively straightforward. Prior to the startup of actual NCCA sample analysis, the analyst must demonstrate that the instrument is in calibration and producing precise, accurate results for a certified reference material. The NCCA field samples should be analyzed in batches of 25 or less samples; the analyst will review the results of the QC samples upon the completion of the analytical run. If the quality criteria are not met, the batch will be re-analyzed. Sediment TOC data is subject to an audit of data quality during the 2-year period following the completion of the analysis.
Quality Assurance Project Plan for July 2010 National Coastal Condition Assessment Page 111 of 121
Benthic Community Assessment:
Sediment grabs will be collected from each NCCA station for evaluations of macrobenthic infanual community structure. These types of benthic evaluations should only be undertaken by experienced personnel with demonstrated competence in the field of benthic ecology. An established regime of in-house QC checks will be adhered to in which a portion of each technician’s work is reviewed by a senior taxonomist; a failed check requires that all of that technician’s samples, since the last passed check, be re-sorted or re-identified (depending on the assigned task). The same types of QC checks apply throughout the process of identifying and quantifying the benthos; technicians and taxonomists have their work verified by a peer or more senior taxonomist. The QC checks must be well documented in a laboratory notebook that will be available to NCCA QA personnel upon request. The benthic data will be subject to an audit of data quality during the 2-year period following the completion of the benthic community assessments.
Evaluators: One or more designated Contractor staff members who are qualified (i.e., have participated in lab audit discussions/ training as appropriate) in the procedures of the NCCA laboratory operations. To Evaluate: Laboratories performing nutrient, sediment chemistry, sediment toxicity, whole fish tissue processing and analysis, pathogen or subsampling, sorting, and taxonomic procedures to analyze coastal samples. Purpose: To identify and correct deficiencies during laboratory operations and procedures.
1. Marla Smith and Joe Hall will review the Laboratory and Assistance Visit Plan and Check List for this lab process/indicator as appropriate with each Evaluator during lab audit conference calls.
2. Marla Smith and Joe Hall will send a copy of the final Plan and the final Check List pages, NCCA lab manual and QAPP to each participating Evaluator.
3. Schedule of lab visits will be made by the Evaluator in consultation with Marla Smith, Joe Hall and the respective Laboratory Supervisor Staff. Evaluators should be prepared to spend additional time in the laboratory if needed (see below).
4. Evaluators, working with Marla Smith, will arrange the schedule of visitation with each participating Laboratory,. Ideally, each Laboratory will be evaluated within the first two weeks following initial receipt of samples, so that procedures can be corrected or additional training provided, if needed.
5. The Evaluator will view the performance of the laboratory procedures and QC Officer through one complete set of sample processing activities as detailed on the Laboratory Evaluation and Assistance Check List.
a. Scheduling might necessitate starting the evaluation midway on the list of tasks for processing a sample, instead of at the beginning. In that case, the Evaluator will view the activities of the laboratory personnel when a new sample is started to complete the evaluation of the first activities on the list.
b. If laboratory personnel miss or incorrectly perform a procedure, the Evaluator will
Quality Assurance Project Plan for July 2010 National Coastal Condition Assessment Page 112 of 121
note this on the checklist and immediately point this out so the mistake can be corrected on the spot. The role of the Evaluator is to provide additional training and guidance so that the procedures are being performed consistent with the Laboratory Methods manual, all data are recorded correctly, and paperwork is properly completed at the site.
6. When the sample has been completely processed or analyzed, the Evaluator will review the results of the evaluation with laboratory personnel and QC Officer, noting positive practices and problems (i.e., weaknesses [might affect data quality]; deficiencies [would adversely affect data quality]). The Evaluator will ensure that the laboratory personnel and QC Officer understand the findings and will be able to perform the procedures properly in the future.
a. The Evaluator will record responses or concerns, if any, on the Laboratory Evaluation and Assistance Check List.
b. If the Evaluator's findings indicate that Laboratory staff are not performing the procedures correctly, safely, or thoroughly, the Evaluator must continue working with these staff members until certain of their ability to process the sample properly so that data quality is not adversely affected.
i. Marla Smith (202-566-1047) ii. Joe Hall, EPA NCCA QA Officer (202-566-1241)
7. The QA official will contact the EPA Project Leader (Gregory Colianni) or Alternate EPA Project Leader (Treda Grayson or John Macauley) to determine the appropriate course of action
8. Data records from samples previously processed by this Laboratory will be checked to determine whether any samples must be redone.
9. Complete the Laboratory and Assistance Visit Plan and Check List for this lab process/indicator as appropriate, including a brief summary of findings, and ensure that all Team members have read this and signed off before leaving the Team.
10. Make a copy of the Laboratory Evaluation and Assistance Check List. Mail the original of each completed Laboratory Evaluation and Assistance Check List to Marla Smith : USEPA Headquarters, Ariel Rios Building, 1200 Pensylvania Ave, N.W., Washington, D.C. 20460.
Marla Smith and Joe Hall will review the returned Laboratory Evaluation and Assistance Check Lists, note any issues, check off the completion of the evaluation for each participating Laboratory. The original will be filed in the NCCA QA Officer file, Washington DC and pdf versions will be emailed to the appropriate lab, state and regional contacts.
Quality Assurance Project Plan for July 2010 National Coastal Condition Assessment Page 113 of 121
7. DATA ANALYSIS PLAN
The goal of the NCCA is to address two key questions about the quality of the Nation’s coastal waters:
• What percent of the Nation’s coastal waters are in good, fair, and poor condition for key indicators of chemical water quality, ecological condition, and suitability for recreation?
• What is the relative importance of key stressors (e.g., nutrients and pathogens) in impacting the biota?
The Data Analysis Plan describes the approach used to process the data generated during the field survey to answer these two questions. Results from the analysis will be included in the final report and used in future analysis.
7.1. Data Interpretation Background
The intent of data analyses is to describe the occurrence and distribution of selected indicators throughout the estuaries and coastal waters of the United States within the context of regionally relevant expectations. The analyses will culminate by categorize and reporting the condition of coastal waters as being good, fair, or poor condition. Statistical analysis techniques appropriate for using data collected using probabilistic survey designs such as those described at EPA’s Aquatic Resource Monitoring website, http://www.epa.gov/nheerl/arm/index.htm, will serve as the primary method for interpreting survey results. However, other data analyses will be used for further assessment investigations as described below. Because of the large-scale and multijurisdictional nature of this effort, the key issues for data interpretation are: the scale of assessment, selecting the effective indicators across the range of systems included in the survey, and determining thresholds for judging condition. An NCCA Data Analysis work group will be created to address these points and to help strengthen NCCA assessments.
7.1.1. Scale of Assessment
EPA selected the sampling locations for the NCCA survey using a probability based design, and developed rules for selection to meet certain distribution criteria, while ensuring that the design yielded a set of coastal areas that would provide for statistically valid conclusions about the condition of the population of coastal areas across the nation.
7.1.2. Selecting Indicators
Indicators for the 2010 survey will basically remain the same as those used in the historic National Coastal Report, with a few modifications. The most prominent change in this year’s survey is the inclusion of coasts along the Great Lakes. Therefore both sample collection methods and laboratory methods reflect freshwater and saltwater matrices.
Quality Assurance Project Plan for July 2010 National Coastal Condition Assessment Page 114 of 121
The NCCA workgroup, based on recommendations from a state workshop held in 2008, decided on a few modifications to the original NCCA indicators. The changes are: 1) measuring Enterococcus levels as a human health indicator; 2) requiring the measurement of photosynthetically active radiation (PAR) using instrumentation to help standardize the water clarity indicator; 3) for sediment toxicity testing, lab methods will use Eohaustorius or Leptochirus instead of Ampelisca sp. for saline sites and Hyalella for freshwater sites; 4) ecological fish tissue studies will be conducted using whole fish, and 5) fish community structure, Total Suspended Solids (TSS), and PAHs in fish tissue will no longer be included.
7.2. Datasets to be used for the Report
The Dataset used for the 2010 assessment consists of data collected during 2010 NCCA and data from historic National Coastal Condition Reports (NCCRs) for tracking changes in water quality data. Other data may be added as appropriate.
7.3. Indicators for the Coastal Assessment
7.3.1. Water Chemistry and Chlorophyll
A wide array of water chemistry parameters will be measured. Water chemistry analysis is critical for interpreting the biological indicators. Chlorophyll-a, Secchi depth, light attenuation and nutrient measurements will be used to create a water quality index and identify stressors.
7.3.2. Benthic Macroinvertebrates
To distinguish degraded benthic habitats from undegraded benthic habitats, EMAP and NCA have developed regional (Southeast, Northeast, and Gulf coasts) benthic indices of environmental condition (Engle et al., 1994; Weisberg et al., 1997; Engle and Summers, 1999; Van Dolah et al., 1999; Hale and Heltshe, 2008).
7.3.3. Sediment Chemistry/Characteristics
The NCCA is collecting sediment samples, measuring the concentrations of chemical constituents and percent TOC in the sediments, and evaluating sediment toxicity as described in the QAPP, field operations manual and laboratory operations manual. The results of these evaluations will be used to identify the most-polluted the sediment quality index is based on measurements of three component indicators of sediment condition: sediment toxicity, sediment contaminants, and sediment TOC. This information will also be used in identifying stressors to ecological/biological condition.
7.3.4. Enterococci Data Analysis
The presence of certain levels of enterococci is associated with pathogenic bacterial contamination of the resource. A single enterococci water sample will be collected at each site, then filtered, processed, and analyzed using qPCR. Bacterial occurrence and distribution will be
Quality Assurance Project Plan for July 2010 National Coastal Condition Assessment Page 115 of 121
reported. Data interpretation will be enhanced by comparison to USEPA qPCR pilot studies as well as to thresholds recommended from the Great Lakes qPCR studies. In addition, some states are doing parallel studies with better known culturing techniques that have a vast historical database which to compare.
7.3.5. Fish Chemistry
For the NCCA, both juvenile and adult target fish species will be collected from all monitoring stations where fish were available, and whole-body contaminant burdens will be determined. The target species typically included demersal (bottom dwelling) and pelagic (water column-dwelling) species that are representative of each of the geographic regions. The EPA recommended values for fish advisories will serve as the threshold against which to evaluate risk.
7.4. NCCR Index Development Approach
EPA intends to calculate the indices used in previous NCCR reports. Information on this approach, the indices and related thresholds can be found in the National Coastal Condition Report III (EPA 2008.)
7.5. Calculation of Population Estimates
Once the individual indicator values are calculated for each sampling location, population estimates will be generated using the procedures outlined by EMAP and found on the Aquatic Resource Monitoring website (give location). The population estimates will include estimates of uncertainty for each indicator. The output of these analyses are the specific results that will appear in the coastal assessment report.
7.6. Relative Extent, Relative Risk and Attributable Risk Analysis
EPA intends to estimate the relative extent of poor conditions for each stressor, the relative risk posed to biota by that stressor and the population attributable risk analysis as outline by Van Sickle and Paulsen (2008).
7.7. Other Change Analyses
Biological and stressor/chemical data from the NCCA and previous reports will be analyzed to see what changes have occurred over time.
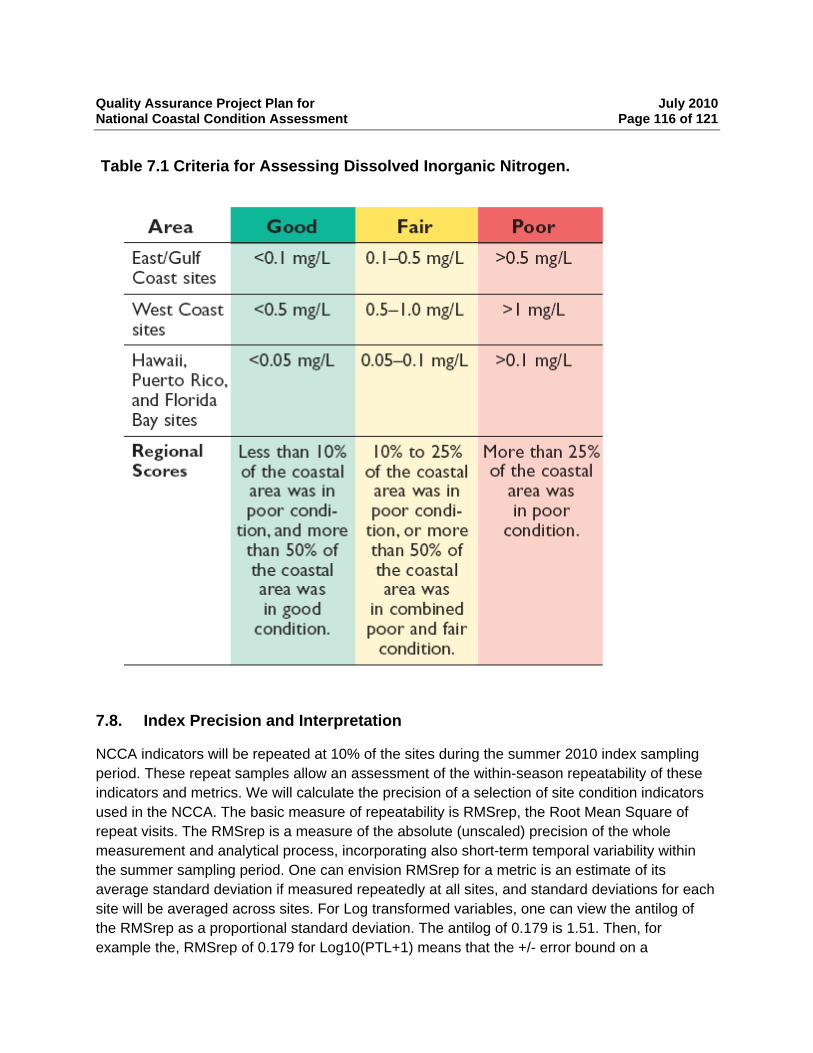
Quality Assurance Project Plan for July 2010 National Coastal Condition Assessment Page 116 of 121
Table 7.1 Criteria for Assessing Dissolved Inorganic Nitrogen.
7.8. Index Precision and Interpretation
NCCA indicators will be repeated at 10% of the sites during the summer 2010 index sampling period. These repeat samples allow an assessment of the within-season repeatability of these indicators and metrics. We will calculate the precision of a selection of site condition indicators used in the NCCA. The basic measure of repeatability is RMSrep, the Root Mean Square of repeat visits. The RMSrep is a measure of the absolute (unscaled) precision of the whole measurement and analytical process, incorporating also short-term temporal variability within the summer sampling period. One can envision RMSrep for a metric is an estimate of its average standard deviation if measured repeatedly at all sites, and standard deviations for each site will be averaged across sites. For Log transformed variables, one can view the antilog of the RMSrep as a proportional standard deviation. The antilog of 0.179 is 1.51. Then, for example the, RMSrep of 0.179 for Log10(PTL+1) means that the +/- error bound on a
Quality Assurance Project Plan for July 2010 National Coastal Condition Assessment Page 117 of 121
measurement in at a site is the measured value times 1.51 and divided by 1.51. So, the +/- 1 StdDev error bounds on a PTL measurement of 10 ug/L during the index period is (10 ÷ 1.51) to (10 ×1.51) or 6.6 to 15.1.
Another way of scaling the precision of metrics is to examine their components of variance. We will calculate signal to noise rations for each indicator in determining whether they are acceptable for use in the data analysis described above. The ratio of variance among sites to that due to measurement (or temporal) variation within individual sites has been termed a “Signal-to-noise” ratio. One can think of S/N as the ability of the metric to discern differences among sites in this survey context. If the among-site variance in the region/large estuary/Great Lake or nation is a meaningful variation in site condition, then the S/N is a measure of the ability of a metric to discern site condition. This variance-partitioning approach is explained in Kaufmann et al. (1999) and Faustini and Kaufmann (2007), where the authors referred to RMSrep as RMSE and evaluated S/N in stream physical habitat variables. In those publications, the authors generally interpreted precision to be high relative to regional variation if S/N >10, low if S/N <2.0, and moderate if in-between. When S/N is over about 10, the effect of measurement error on most interpretations is nearly insignificant within the national context; between 6 and 10 these effects are minor. Between S/N of 2 and 5, the effects of imprecision should be acknowledged, examined and evaluated. From 2 to 4 they are usually adequate to make good-fair-poor classifications, but there is some distortion of CDFs and a significant limitation of the amount of variance that can be explained by approaches such as multiple linear regression (The magnitude of the within-site variance component limits on the amount of among-site variance that can be explained by multiple linear regression using single visit data).
8. REFERENCES
American Public Health Association. 2006. Standard Methods for the Examination of Water and Wastewater. 21st Edition. American Public Health Association, Washington, D.C.
American Society for Testing and Materials. 1991. Guide for conducting 10-day static sediment toxicity tests with marine and estuarine amphipods. ASTM Standard Methods Volume 1104, Method Number E-1367-90. American Society for Testing and Materials, Philadelphia, PA.
Arar, E.J., and J.B. Collins, 1992. EPA Method 445.0: “In Vitro Determination of Chlorophyll a and Pheophytin a in Marine and Freshwater Phytoplankton by Fluorescence” EPA/600/R-2/121.
Barbour, M.T., J. Gerritsen, B.D. Snyder, and J.B. Stribling. 1999. Rapid Bioassessment Protocols for Use in Streams and Wadeable Rivers: Periphyton, Benthic Macroinvertebrates and Fish, Second Edition. EPA 841-B-99-002. U.S. Environmental Protection Agency; Office of Water; Washington, D.C.
CAS - Chemical Abstracts Service (CAS 1999)
Quality Assurance Project Plan for July 2010 National Coastal Condition Assessment Page 118 of 121
Engle, V.D., J.K. Summers, and G.R. Gaston. 1994. A benthic index of environmental condition of the Gulf of Mexico Estuaries. Estuaries 17:372-384.
Engle, V.D., and J.K. Summers. 1999. Refinement, validation, and application of a benthic index for northern Gulf of Mexico estuaries. Estuaries 22(3A):624-635.
Faustini, John M. and Philip R. Kaufman. 2007. Adequacy of visually classified particle count statistics from regional stream habitat surveys. Journal of the American Water Resources Association 43(5): 1293-1315. WED-06-126.
Federal Register, Part VIII, EPA. “Guidelines Establishing Test Procedures for the Analysis ofPollutants Under the Clean Water Act: Final Rule and Proposed Rule.” 40 CFR Part 136, Oct. 28, 1984.
FGDC, 1998. Content Standard for Digital Geospatial Metadata. FGDC-STD-001-1998, Federal Geographic DataCommittee, Reston, VA-USA.
FGDC, 1999. Geospatial Metadata, Part 1: Biological Data Profile. FGDC-STD-001.1-1999, Federal Geographic Data Committee, Reston, VA-USA.
Glaser, P.H.; Wheeler, G.A.; Gorham, E.; Wright, H.E., Jr. 1981. The patterned mires of the Red Lake Peatland, northern Minnesota: vegetation, water chemistry, and landforms. Ecology. 69: 575-599.
Hale, S.S., and J.F. Heltshe. 2008. Signals from the benthos: Development and evaluationof a benthic index for the nearshore Gulf of Maine. Ecological Indicators 8: 338-350.
Hawkins, C. P., R. H. Norris, J. N. Hogue, and J. W. Feminella. 2000. Development and evaluation of predictive models for measuring the biological integrity of streams. Ecological Applications 10:1456-1477.
Heinz Center. 2002. The State of the Nation’s Ecosystems. The Cambridge University Press.
Hunt, D.T.E., and A.L. Wilson. 1986. The Chemical Analysis of Water: General Principles and Techniques. 2nd ed. Royal Society of Chemistry, London, England. 683 pp.
Hydrolab Corporation. 1990. DataSonde 3 Operation Manual (and Performance Manual). Hydrolab Corporation , Austin, TX.
Integrated Taxonomic Information System, 1999 (ITIS, http://www.itis.usda.gov/)
Kaufmann, P. R., P. Levine, E. G. Robison, C. Seeliger, and D. V. Peck. 1999. QuantifyingPhysical Habitat in Wadeable Streams. EPA 620/R-99/003. US Environmental ProtectionAgency, Washington, D.C.
Quality Assurance Project Plan for July 2010 National Coastal Condition Assessment Page 119 of 121
Kirchner, C.J. 1983. Quality control in water analysis. Environ. Sci. and Technol. 17 (4):174A-181A.
Klemm, D. J., K. A. Blocksom, F. A. Fulk, A. T. Herlihy, R. M. Hughes, P. R. Kaufmann, D. V.Peck, J. L. Stoddard, W. T. Thoeny, M. B. Griffith, and W. S. Davis. 2003. Development andevaluation of a macroinvertebrate biotic integrity index (MBII) for regionally assessing Mid-Atlantic Highlands streams. Environmental Management 31(5): 656-669.
MRLC - Multi-Resolution Land Characteristics (MRLC 1999) http://www.epa.gov/mrlc/
NAPA. 2002. Environment.gov. National Academy of Public Administration. ISBN: 1-57744-083-8. 219 pages.
NBII - National Biological Information Infrastructure (NBII 1999) http://www.nbii.gov/datainfo/metadata/
NHD - National Hydrography Dataset Plus Version 1.0 (NHDPlus 2005) http://www.horizon-systems.com/nhdplus/index.php
NRC. 2000. Ecological Indicators for the Nation. National Research Council.
NSDI - National Spatial Data Infrastructure (NSDI 1999) http://www.fgdc.gov/nsdi/nsdi.html
National Water Quality Monitoring Network for U.S. Coastal Waters and Their Tributaries, http://acwi.gov/monitoring/network/index.html
Oblinger Childress, C.J., Foreman, W.T., Connor, B.F. and T.J. Maloney. 1999. New reporting procedures based on long-term method detection levels and some considerations for interpretations of water-quality data provided by the U.S. Geological Survey National Water Quality Laboratory. U.S.G.S Open-File Report 99–193, Reston, Virginia.
Paulsen, S.G., D.P. Larsen, P.R. Kaufmann, T.R. Whittier, J.R. Baker, D. Peck, J.McGue, R.M. Hughes, D. McMullen, D. Stevens, J.L. Stoddard, J. Lazorchak, W. Kinney, A.R. Selle, and R. Hjort. 1991. EMAP - surface waters monitoring and research strategy, fiscal year 1991. EPA-600-3-91-002. U.S. Environmental Protection Agency, Office of Research and Development, Washington, D.C. and Environmental Research Laboratory, Corvallis, Oregon.
SDTS - Spatial Data Transfer Standard (SDTS) http://mcmcweb.er.usgs.gov/sdts/
Stanley, T.W., and S.S. Verner. 1985. The U.S. Environmental Protection Agency’s quality assurance program. pp12-19 In: J.K. Taylor and T.W. Stanley (eds.). Quality Assurance for Environmental Measurements, ASTM SPT 867. American Society for Testing and Materials, Philadelphia, PA.
Stevens, D. L., Jr., 1994. Implementation of a National Monitoring Program. Journal Environ. Management 42:1-29.
Quality Assurance Project Plan for July 2010 National Coastal Condition Assessment Page 120 of 121
Strobel, C.J. 2000. Coastal 2000 - Northeast Component: Field Operations Manual. U. S. Environmental Protection Agency, National Health and Environmental Effects Research Laboratory, Atlantic Ecology Division, Narragansett, RI. EPA/620/R-00/002.
U.S. EPA, 1984. EPA Order 2160 (July 1984), Records Management Manual, U.S. Environmental Protection Agency, Washington, DC.
U.S. EPA 1993. EPA Requirements for Quality Assurance Project Plans for Environmental Data Operations (EPA QA/R-5). U.S. Environmental Protection Agency, Quality Assurance Management Staff, Washington, DC.
U.S. EPA. 1995. Environmental Monitoring and Assessment Program (EMAP): Laboratory Methods Manual-Estuaries, Volume 1: Biological and Physical Analyses. U.S. Environmental Protection Agency, Office of Research and Development , Narragansett, RI. EPA/620/R-95/008.
U.S. EPA, 1999. EPA’s Information Management Security Manual. EPA Directive 2195 A1.
U.S. EPA, 2000a. EPA’s National Study of Chemical Residues in Lake Fish Tissue. http://www.epa.gov/fishadvisories/study/sampling.htm.
U.S. EPA. 2000b. Guidance for assessing chemical contaminant data for use in fish advisories, volume 1: Fish sampling and analysis. Third edition. EPA/823/B-00/007. http://www.epa.gov/waterscience/fish/ (available under "National Guidance").
U.S. EPA 2001A. Environmental Monitoring and Assessment Program (EMAP) National Coastal Assessment Quality Assurance Project Plan 2001-2004, Office of Research and Development, National Health and Environmental Effects Research Laboratory, Gulf Ecology Division, Gulf Breeze, FL. EPA/620/R-01/002
U.S. EPA 2001B. National Coastal Assessment: Field Operations Manual 2001, Office of Research and Development, National Health and Environmental Effects Research Laboratory, Gulf Ecology Division, Gulf Breeze, FL. EPA/620/R-01/003.
U.S. EPA 2001C. National Coastal Condition Report. Office of Research and Development/ Office of Water. Washington, DC 20460. /www.epa.gov/owow/oceans/nccr/downloads.html.ice
U.S. EPA, 2001D. Agency Network Security Policy. EPA Order 2195.1 A4.
U.S. EPA 2002. Guidance for Quality Assurance Plans EPA240/R-02/009 U.S. Environmental Protection Agency, Office of Environmental Information, Washington, D.C.
U.S. EPA 2004A. National Coastal Condition Report II, Office of Research and Development/Office of Water. Washington, DC 20460. EPA-620/R-03/002.
U.S. EPA. 2004B. Revised Assessment of Detection and Quantitation Approaches. EPA-821-B-04-005. U.S. Environmental Protection Agency, Office of Science and Technology, Washington, D.C.
Quality Assurance Project Plan for July 2010 National Coastal Condition Assessment Page 121 of 121
U.S. EPA, 2006A. Method 1606: Enterococci in water by Taqman Quantitative Polymerase Chain Reaction (qPCR) assay (draft). U.S. EPA Office of Water, Washington DC December 2006.
U.S. EPA. 2006B. Guidance on Systematic Planning Using the Data Quality Objectives Process. EPA/240/B-06/001. U.S. Environmental Protection Agency, Office of Environmental Information, Washington, D.C.
U.S. EPA 2008. National Coastal Condition Report III, Office of Research and Development/Office of Water. Washington, DC 20460. EPA/842-R-08-002.
U.S. EPA, 2009. National Coastal Condition Assessment Field Operations Manual. United States Environmental Protection Agency, Office of Water, Office of Wetlands, Oceans and Watersheds. Washington, D.C. EPA/841-R-09-003.
U.S. EPA, 2009. National Coastal Condition Assessment Laboratory Methods Manual. United States Environmental Protection Agency, Office of Water, Office of Wetlands, Oceans and Watersheds. Washington, D.C. EPA/841-R-09-002.
U.S.GAO. 2000. Water Quality. GAO/RCED-00-54.
Van Dolah, R.F., J.L. Hyland, A.F. Holland, J.S. Rosen, and T.T. Snoots. 1999. A benthic index of biological integrity for assessing habitat quality in estuaries of the southeastern USA. Mar. Environ. Res. 48(4-5):269-283.
Van Sickle, J. and S.G. Paulsen. 2008. Assessing the attributable risks, relative risks, and regional extents of aquatic stressors. Journal of the North American Benthological Society 27:920-931.
Wade - Enterococcus DNA in a sample, epidemiological studies (Wade et al. 2005)
Weisberg, S.B., J.A. Ranasinghe, D.D. Dauer, L.C. Schnaffer, R.J. Diaz, and J.B. Frithsen. 1997. An estuarine benthic index of biotic integrity (B-IBI) for Chesapeake Bay. Estuaries 20(1):149-158.