Embed Size (px)
Citation preview
WHO STEPS Surveillance
NATIONAL HEALTH & NUTRITION SURVEY
Non-Communicable Disease
Risk Factor Surveillance
REPORT FOR
ST. VINCENT & THE GRENADINES
MARCH 2015
Submitted To: The Government of St. Vincent and the Grenadines
The production of this report was funded by the European Union 10th European
Development Fund

ii
Message from the Ministry for Health, Wellness and the Environment
This is the first WHO STEPS Surveillance to be conducted in St. Vincent and
the Grenadines, also referred to in locally as the National Health and Nutrition
Survey (NHNS).
It is of national concern that Chronic Non-Communicable Diseases (CNCDs)
such as Diabetes, High Blood Pressure, Heart Diseases, Cancers and Kidney
Diseases continue to increase in St. Vincent and the Grenadines. This survey
aims to understand the impact of the risk factors that contribute to NCDs. By
understanding these risk factors the Ministry of Health, Wellness and the
Environment can therefore formulate a situation analysis of the problem and
devise a response mechanism to tackle the rising scourge of NCDs.
Raising awareness for the promotion of good health and well-being represents an ideal opportunity to
draw public attention to the risk factors, sign and symptoms, and complications associated with
unhealthy lifestyles. Raising health consciousness and health awareness contribute to intensifying
efforts to reverse and reduce the burden of lifestyle diseases and taking serious consideration for
‘Prevention’ as a key factor for investment in good health.
NCDs conditions and their risk factors, including obesity, diabetes, heart diseases, high blood pressure,
strokes and cancer, are a top health priority in St. Vincent and the Grenadines. The prevalence of these
diseases is high and increasing; therefore, we have to address these immediately.
The Ministry of Health, Wellness and the Environment will continue to coordinate with stakeholders to
advocate for healthy public policies, creating supportive environments, reorienting health services and
mobilizing communities and individuals to take action.
The data from this survey will serve as a baseline for the Ministry of Health, Wellness and the
Environment, and it is our hope that when the survey is repeated in the not too distant future we can
see a substantial reduction in these risk factors for NCD.
I thank everyone for their participation in the survey.
Hon. Clayon Burgin Minister of Health, Wellness and the Environment St. Vincent and the Grenadines.
iii
Acknowledgements
Implementing the inaugural St. Vincent and the Grenadines NCD STEPS Survey /National Health and Nutrition Survey was an important activity for Ministry of Health, Wellness and the Environment, which would not be successful without the contributions of many valuable partners who gave of their expertise and the respondents who gave of their time.
The Ministry of Health, Wellness and the Environment would like to acknowledge and thank all the
stakeholders who helped in making the inaugural Survey a success:
The planning committee and country STEP coordinator;
All data collection and data entry officers, field supervisors;
All to the participants, without whose time this would be an impossible task;
CARPHA for providing statistical support, training, resources and result generation;
The staff in the National health sector for their support in conducting this survey, including the
Laboratory staff for conducting the biochemical tests;
Frame & Associates who verified the results and drafted the NHNS Report; and
The European Union (EU) under the 10th EDF for their contribution towards this important
health exercise in SVG.
iv
Executive Summary
In SVG, NCDs in the form of cancers, diabetes mellitus, diseases of the circulatory system (i.e. ischemic health disease, cerebrovascular diseases, hypertension and hypertensive diseases), injuries and violence are among the top ten causes of death and contribute on average 60%-70% of all deaths. The 2013-2014 WHO STEPS on NCD Risk Factor Surveillance, designated in SVG as the National Health and Nutrition Survey (NHNS) discussed in this report was to develop and strengthen the country’s capacity to better monitor non-communicable diseases (NCDs) and their risk factors by implementing a population based survey using the Pan American Version of WHO STEPS. The NHNS is utilizing the Pan American Version of WHO STEPS version 3.0 to conduct the surveillance of chronic diseases and risk factors. This approach uses tools that collect data and measure chronic disease and risk factors through a sequential process of gathering information about behavioural and biological risk factors across the population: Step1, Step 2 and Step 3 (Core and Expanded). The total survey sample that consents to participate in the survey was required to participate in STEPS 1 and 2 whilst 50% of the total survey sample was selected for STEP 3 and the optional nutrition intake module. The sample size was proportionately divided between the three main reporting strata (St.Vincent/Northern Grenadines/Southern Grenadines). The survey was stratified by sex, age groups 18-29, 30-44 and 45-69 years based on the 2001 national census and by geographical location. A three-stage cluster sampling approach was used and 199 enumeration districts were randomly selected using Probability Proportional to Size (PPS) from the sampling frame. Eligible persons at the household level were randomly selected using the Kish method. If no one was present in the selected household, a notification of visit card was left and the interviewer revisited. The level of confidence and the corresponding margin of error used for the sample size calculations for the survey were 95% and 0.05, respectively. Data analysis was conducted utilizing Epi Info software. The survey was implemented for a 9-month period between January 2013 and December 2014.
The key findings of behavioural risks present the baseline data on various health behaviours, including
smoking, drinking alcohol, eating fruits and vegetables, dietary salt consumption, and physical activity.
The percentage that currently smokes tobacco products was 12%, with 57% being daily smokers. There
was a nine-fold higher current smoking rate among males (21.9%) than females (2.5%). Forty-nine
percent (66.9% males; 31.4% females) of respondents reported drinking currently (i.e. in the past 30
days, while an additional 16.3% (13.5% males; 19% females) reported drinking in the past 12 month, but
not currently. Overall, fruits and vegetables were consumed an average of 3.3 days and 3.1 days,
respectively, with no difference among males and females. Respondents reported consuming an
average number of 1.7 servings of fruit and vegetable combined per day with no sex or age differences
observed. Only 5.1% of respondents reported consuming five or more servings of fruits and/or
vegetables combined (5.9% males; 4.4% females); the majority of respondents reported consuming 1-2
servings (43.3%).
The key findings of physical measurements include blood pressure, weight, height, and waist. An overall
mean systolic blood pressure (SBP) and diastolic blood pressure (DBP) of 123.5 mmHg (126.3 mmHg
males; 120.8 mmHg females) and 74 mmHg (73.4 mmHg males; 74.6 mmHg females), respectively was
found. The proportion of those that were overweight (i.e. BMI of 25.0-29.9) in the study population was
27.3% (28.1% males; 26.4% females), and 26.9% (13.2% males; 40.8% females) recorded as obese (i.e.
v
BMI of 30 or more). Females weighed more than males, with a mean weight of 78.6 kg and 76.1 kg
respectively. Participants with the heaviest weight was recorded in age group 45-69 years. Mean waist
circumferences for males was recorded as 85.8 cm and for females 93.2 cm.
Overall 1.8% of the study population demonstrated the lowest risk for NCDs (that is with none of the 5
risk factors), comprising of 2.7% males and 0.9% of females. Although most respondents (71.2%)
reported having 1-2 risk factors (77.4% males; 65% females), 26.9% of respondents reported having 3-5
risk factors (19.9% males; 34% females). Participants in age group 45-69 comprised a significantly higher
proportion (46.5%) of respondents with 3-5 risk factors.
The recommendations are guided by the WHO “Best Buy” Interventions, which identify key
interventions to reduce the public health and economic impact of CNCDs and their risk factors. The
specific recommendations emanating from the survey addresses are based on the national context of
SVG and the regional context of the Caribbean, and are categorised according to: policy; advocacy and
dissemination of the NHNS findings; risk factors; patient management; and NCD surveillance.
Ultimately, the battle against NCDs can only be won through a Regional approach involving all sectors of
government and society, as that set out in the Caribbean Community (CARICOM) heads of government
multisector Port-of-Spain Summit Declaration “Uniting to Stop the Epidemic of Chronic
Noncommunicable Diseases,” of 15 September 2007.
6
Table of Contents
Message from the Ministry for Health, Wellness and the Environment .................................................. ii
Acknowledgements .................................................................................................................................. iii
Executive Summary .................................................................................................................................. iv
Table of Contents ...................................................................................................................................... 6
List of Tables ............................................................................................................................................. 8
List of Figures ............................................................................................................................................ 9
Introduction ................................................................................................................................................ 12
Goals and Objectives of the Survey ........................................................................................................ 12
Methodology ............................................................................................................................................... 13
Scope ....................................................................................................................................................... 13
Geographical Coverage ........................................................................................................................... 14
Sample Size ............................................................................................................................................. 14
Sampling and Recruitment ...................................................................................................................... 15
Eligibility Criteria ..................................................................................................................................... 16
Survey Staff and Training ........................................................................................................................ 17
Data Collection Questionnaire ................................................................................................................ 17
Biological samples, testing and Nutrition intake (24 hour recall) ........................................................... 17
Approaches to Data Analysis .................................................................................................................. 17
Sustainability and future surveys ............................................................................................................ 18
Timeframe ............................................................................................................................................... 18
Survey Results ............................................................................................................................................. 19
Socio-Demographic Information (Step 1) ....................................................................................... 19
Employment status ............................................................................................................................. 20
Estimated household earnings ............................................................................................................ 21
Behavioral Risk Factors (Step 1) ...................................................................................................... 21
Tobacco Use ............................................................................................................................................ 21
Exposure to second-hand smoke in home in past 30 days ................................................................. 25
Alcohol Consumption .............................................................................................................................. 25
Alcohol consumption status................................................................................................................ 25
Frequency of alcohol consumption..................................................................................................... 26
7
Drinking occasions in the past 30 days ............................................................................................... 27
Average volume drinking levels among current (past 30 days) drinkers ............................................ 27
Past 7 days drinking ............................................................................................................................ 28
Six or more drinks on a single occasion .............................................................................................. 28
Fruit and Vegetable Consumption .......................................................................................................... 29
Mean number of days of fruit and vegetable consumption ............................................................... 29
Mean number of servings of fruit and vegetable consumption ......................................................... 30
Fruit and vegetable consumption per day .......................................................................................... 30
Type of oil used most frequently ........................................................................................................ 32
Eating outside home ........................................................................................................................... 32
Physical Activity ...................................................................................................................................... 33
Not meeting WHO recommendations on physical activity for health ................................................ 33
Mean total physical activity ................................................................................................................ 34
Composition of total physical activity ................................................................................................. 35
Sedentary ............................................................................................................................................ 35
History of Raised Blood Pressure ............................................................................................................ 36
Blood pressure measurement and diagnosis ...................................................................................... 36
Dietary Salt .............................................................................................................................................. 36
History of Diabetes ................................................................................................................................. 38
Blood sugar measurement and diagnosis ........................................................................................... 38
History of Raised Total Cholesterol ......................................................................................................... 39
Cholesterol measurement and diagnosis ........................................................................................... 39
Cholesterol treatment among those diagnosed ................................................................................. 40
History of Cardiovascular Diseases ......................................................................................................... 41
Prevention and treatment of heart disease ........................................................................................ 41
Lifestyle Advice ....................................................................................................................................... 42
Lifestyle advice .................................................................................................................................... 42
Cervical Cancer Screening ....................................................................................................................... 43
Cervical cancer screening .................................................................................................................... 43
Health Screening ..................................................................................................................................... 44
Prostate and Rectal Exams .................................................................................................................. 44
Breast Cancer – Breast Self-Exam and Mammogram ......................................................................... 45
Date of last pap test exam .................................................................................................................. 46
8
Physical Measurements (Step 3) ............................................................................................................. 46
Raised blood pressure ......................................................................................................................... 46
Treatment and control of raised blood pressure ................................................................................ 47
Overweight & Obesity ............................................................................................................................. 48
Height, weight and BMI ...................................................................................................................... 48
BMI categories .................................................................................................................................... 49
BMI ≥25 ............................................................................................................................................... 50
Waist circumference ........................................................................................................................... 50
Biochemical Measurement (Step3)................................................................................................. 51
Raised blood glucose........................................................................................................................... 51
High density lipoprotein (HDL) ............................................................................................................ 52
Triglycerides ........................................................................................................................................ 52
Summary of Combined Risk Factors ....................................................................................................... 53
Discussion.................................................................................................................................................... 54
Tobacco Use ........................................................................................................................................ 54
Recommendations ...................................................................................................................................... 61
Policy directions ...................................................................................................................................... 62
Advocacy and Dissemination of NHNS Findings ..................................................................................... 62
Actions for addressing risk factors for NCD Prevention ......................................................................... 63
Actions for management of patients ...................................................................................................... 64
Actions for NCD Surveillance .................................................................................................................. 65
References .................................................................................................................................................. 67
List of Tables
Table 1 List of parameters and values for sample size calculation ............................................................. 14
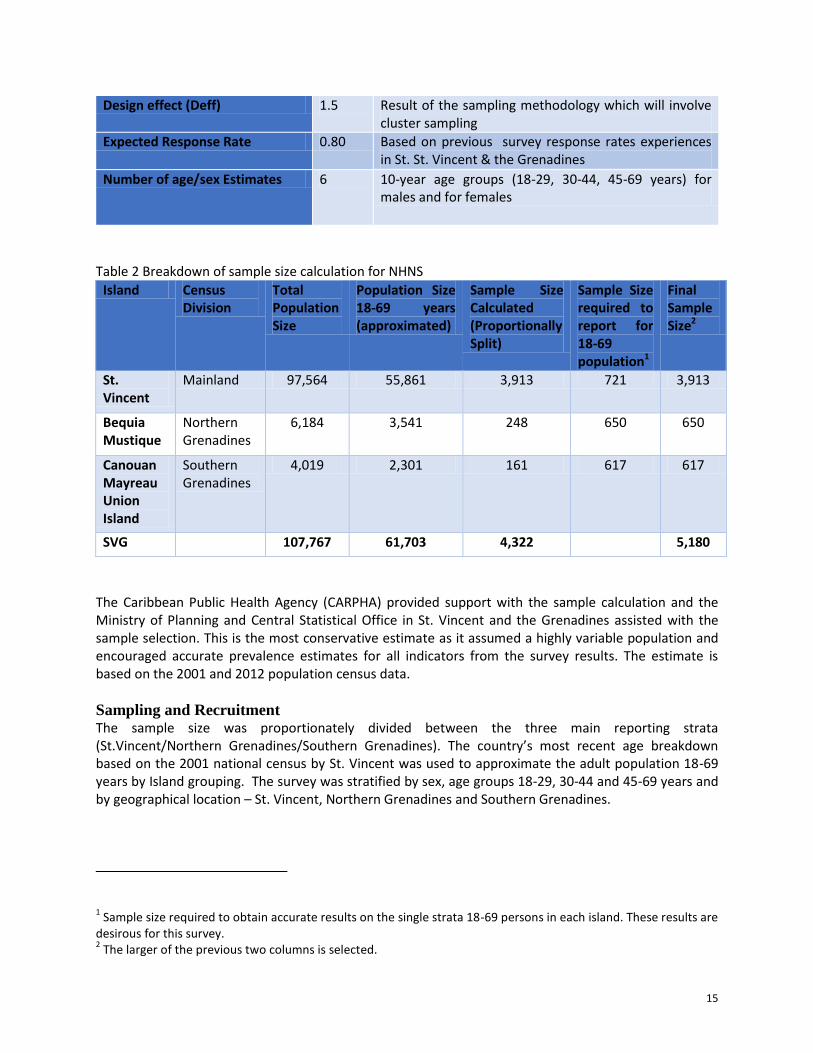
Table 2 Breakdown of sample size calculation for NHNS ........................................................................... 15
Table 3 Age group and sex of the survey respondents ............................................................................... 19
Table 4 Highest level of education by age group and sex ........................................................................... 20
Table 5 Employment Status by age group and sex ..................................................................................... 21
Table 6 Percent estimated household earnings ......................................................................................... 21
9
Table 7 Percentage of current smokers who smoke a range of tobacco products .................................... 23
Table 8 Frequency of daily smokers smoking quantities of manufactured or hand-rolled cigarette per day
.................................................................................................................................................................... 24
Table 9 Exposure to second-hand smoke at home and in the workplace .................................................. 25
Table 10 Number of servings of fruit and/or vegetables on average per day by age group ...................... 31
Table 11 Mean minutes of types of physical activity on average per day .................................................. 34
Table 12 Percent composition of total physical activity by age .................................................................. 35
Table 13 Blood Pressure measurement and diagnosis among all respondents by age.............................. 36
Table 14 Distribution of measures to control salt intake among the respondents by age group and sex . 37
Table 15 Blood sugar measurement and diagnosis by age group and sex ................................................. 38
Table 16 Percentage of respondents diagnosed with diabetes in the past 12 months and ...................... 39
Table 17 Percentage of respondents having total cholesterol measurement and diagnosis .................... 40
Table 18 Cholesterol treatment for levels of raised cholesterol among those diagnosed by age ............. 40
Table 19 Percentage of respondents currently taking aspirin or statins .................................................... 42
Table 20 Percentage of respondents advised by a doctor or health worker to change lifestyle by age
group and sex .............................................................................................................................................. 43
Table 21 Percentage of respondents who had feces checked.................................................................... 45
Table 22 Date of last breast exam and mammogram................................................................................. 46
Table 23 Percentage of respondents with different levels of raised blood ................................................ 47
Table 24 Percentage of respondents with treated and/or controlled raised blood .................................. 48
Table 25 Mean weight (kg) among all respondents by age ........................................................................ 48
Table 26 Percentage of respondents in each BMI classifications by age group and sex ............................ 50
Table 27 Percentage of respondent with raised blood glucose level categories ....................................... 51
Table 28 Percentage of respondent according to HDL level by age group and sex ................................... 52
Table 29 Percentage of respondents with fasting triglycerides at different levels by age group and sex . 52
Table 30 Summary of combined risk factors by age group and sex ........................................................... 53
List of Figures
Figure 1 Ethnicity of the survey respondents ............................................................................................. 20
Figure 2 Percentage of current smokers by age and sex ............................................................................ 22
10
Figure 3 Smoking status by sex ................................................................................................................... 22
Figure 4 Average age of smoking initiation by age group and sex ............................................................. 23
Figure 5 Percentage of current smokers who tried to stop smoking in the past 12 months ..................... 24
Figure 6 Percentage of alcohol consumed among all survey respondents, 18-69 years ........................... 26
Figure 7 Frequency of alcohol consumption in the past 12 months among all respondents, 18-69 years 26
Figure 8 Mean number of occasions for consuming at least one drink in the past.................................... 27
Figure 9 Percentage of current drinkers aged 18-69 years, with drinking volumes ................................... 27
Figure 10 Frequency of past 7-day alcohol consumption among current drinkers .................................... 28
Figure 11 Percentage of all respondents drinking six or more drinks on a single ...................................... 28
Figure 12 Mean number of days fruit consumed in a typical week by age ................................................ 29
Figure 13 Mean number of vegetables consumed in a typical week by..................................................... 30
Figure 14 Mean number of servings of fruits and/or vegetables on average ............................................ 30
Figure 15 Percentage of respondents consuming less than five servings of .............................................. 31
Figure 16 Types of oil or fat most often used for meal preparation in household..................................... 32
Figure 17 Mean number of meals eaten outside the home ....................................................................... 32
Figure 18 Percentage of respondents not meeting WHO recommendations on ....................................... 34
Figure 19 Minutes spent in sedentary activity on average per day by age group and gender .................. 35
Figure 20 Percentage of respondents who ever had a heart attack or chest pain from ............................ 41
Figure 21 Percentage of women who had ever had a cervical cancer screening ....................................... 43
Figure 22 Distribution of women aged 30-49 years who ever ha a cervical screen ................................... 44
Figure 23 Percentage males have had a prostate exam ............................................................................. 44
Figure 24 Date of last pap or cytological test ............................................................................................. 46
Figure 25 Mean BMI (kg/m2) among all respondents by age group and sex ............................................. 49
Figure 26 Percentage of respondents with BMI of ≥25 by age group and sex ........................................... 50
Figure 27 Mean waist circumference by age group and sex ...................................................................... 51

11
List of Acronyms
BMI Body Mass Index
CI Confidence Intervals
DALYs Disability Adjusted Life Years
DBP Diastolic Blood Pressure
EDS Enumeration Districts
GSVG Government of St. Vincent and the Grenadines
GSHS Global School Health Survey
NCD Non Communicable Disease
GYTS Global Youth Tobacco Survey
MoHW Ministry of Health, Wellness and the Environment
MET Metabolic Equivalent Time
SBP Systolic Blood Pressure
SVG St. Vincent and the Grenadines
WHO World Health Organization
12
Introduction Non-Communicable diseases (NCDs) such as heart disease, stroke, cancer, diabetes, and chronic
respiratory diseases are the leading cause of death globally, and were responsible for 38 million (68%) of
the world’s 56 million deaths in 2012. More than 40% (16 million) of them were premature deaths
under age 70 years. Almost three quarters (28 million) of all NCD deaths, and the majority of premature
deaths (82%), occur in low- and middle-income countries. Furthermore, loss of productivity due to
premature deaths, and the individual and national costs of addressing NCDs are important barriers to
poverty reduction and sustainable development. As such, NCDs are one of the major health and
development challenges of the 21st century (WHO, 2014).
In the past, NCDs were associated with affluent lifestyles, however, since the start of the 21st century
these diseases have become more prevalent and more democratic as a result of forces such as the rapid
urbanization; population ageing; and powerful global marketing of unhealthy products like cigarettes,
alcohol, sugar-filled beverages, and foods that are rich in unhealthy fats, sugar, and salt (WHO, 2014).
In the Caribbean Region, NCDs are responsible for six of the top ten leading causes of death, and
represent a growing proportion of health spending, and impose a large economic burden at the societal,
community, and household level. For example, in the Organization of the Eastern Caribbean States
(OECS), including St. Vincent and the Grenadines (SVG), the annual cost for treating a diabetic ranges
from US$322 to US$769. Some NCD patients spend 36% of their total household expenditure annually
for care. Poorer households spend 48% of their per capita expenditure on healthcare (Government of St.
Vincent & the Grenadines (GSVG), 2008).
In SVG, NCDs in the form of cancers, diabetes mellitus, diseases of the circulatory system (i.e. ischemic
health disease, cerebrovascular diseases, hypertension and hypertensive diseases), injuries and violence
are among the top ten causes of death and contribute on average 60%-70% of all deaths (GSVG, 2013).
Most of these deaths could have been prevented, and future deaths could be prevented if the
Government of SVG heeds the global, regional and national call to action on NCD.
The following is a report of key findings and discussion of the implications of the 2013-2014 WHO STEPS
on NCD Risk Factor Surveillance, designated in SVG as the National Health and Nutrition Survey (NHNS).
The Report concludes with some recommendations based on the translation of the findings into
actionable interventions guided by the WHO Global action plan for prevention and control of non-
communicable diseases 2013–2020 and the Strategic Plan of Action for the Prevention and Control of
Chronic Non-Communicable Diseases (NCDs) in the Countries of the Caribbean Community (CARICOM)
coming from the 2007 CARICOM Summit on Chronic Non-Communicable Diseases in Port-of-Spain
Declaration of 2007, Uniting to Stop the Epidemic of Chronic NCDs, which is aligned with the
WHO/PAHO plans to prevent and control NCDs.
Goals and Objectives of the Survey The goals of the WHO STEPS locally referred to in St. Vincent and the Grenadines as the National Health and Nutrition Survey (NHNS) were:
13
1. To develop and strengthen the country’s capacity to better monitor non-communicable diseases (NCDs) and their risk factors by implementing a population based survey using the Pan American Version of WHO STEPS
2. To assess mean energy, nutrient and food intake, nutritional adequacy and dietary patterns in the adult population aged 18-69 years and their relationship to obesity and other NCD risk factors by implementing 24-hour recall methodology
The objectives were to:
i) To collect data on the current levels of risk factors for chronic diseases in St. Vincent and the Grenadines
ii) To collect data on the nutritional intake and dietary patterns of the population in St. Vincent and the Grenadines
iii) To monitor and evaluate the trends of risk factors nationally iv) To develop standardized tools to enable comparisons over time and across countries v) To prevent chronic disease epidemics before they occur vi) To provide information in order to develop a Health & Wellness/Public Awareness Strategy vii) To assist health services in the planning and determination of public health priorities
Methodology
Scope The NHNS is utilizing the Pan American Version of WHO STEPS version 3.0 to conduct the surveillance of chronic diseases and risk factors. This approach uses tools that collect data and measure chronic disease and risk factors through a sequential process of gathering information about behavioural and biological risk factors across the population: Step1, Step 2 and Step 3 (Core and Expanded) and optional modules Dietary Salt and nutrition intake (24 hour recall) – the results from the latter optional module is not included in this report, but may be added as an annex upon completion of the analysis and reporting. The NHNS collected data on:
Behavioural (diet, physical activity, tobacco and alcohol),
Physical measurements (blood pressure, height, weight , waist and heart rate)
metabolic risk factors (fasting blood glucose, blood lipids, triglycerides and HDL cholesterol)
lifestyle advice,
cervical cancer screening,
family history,
health screening,
dietary salt
Nutrition intake. The total survey sample that consents to participate in the survey was required to participate in STEPS 1 and 2 whilst 50% of the total survey sample was selected for STEP 3 and the optional nutrition intake
14
module. St. Vincent and the Grenadines used a combination of two (2) methodologies in order to collect data:
1) The Pan American version of the WHO STEPS Instrument; the data collection was done electronically, which involved the use of Personal Digital Assistants (PDAs). As a PDA-based data collection tool, eSTEPS provided the following benefits:
immediate error-checking during data collection (e.g. inadvertently skipped questions or out-of-range responses);
marked reduction of materials to be carried by data collectors (one PDA vs. hundreds of paper instruments);
no data entry needed no cost for data entry; fewer errors arising from data entry; final dataset can be created quickly following completion of data collection
2) A twenty-four (24) hour food recall form adapted from the Caribbean Food and Nutrition Institute (PAHO/CFNI); the data collection will be done manually (paper based). Portion-size measurement aids (PSMAs) was used to estimate food quantities eaten over the period. The PSMAs used in this survey was food models, household measures and rulers.
Geographical Coverage The survey covered the entire island St. Vincent and the Grenadines, and was conducted using the following zoning categories:
1) Mainland (St. Vincent) 2) Northern Grenadines (Bequia and Mustique) 3) Southern Grenadines (Canouan and Union Island)
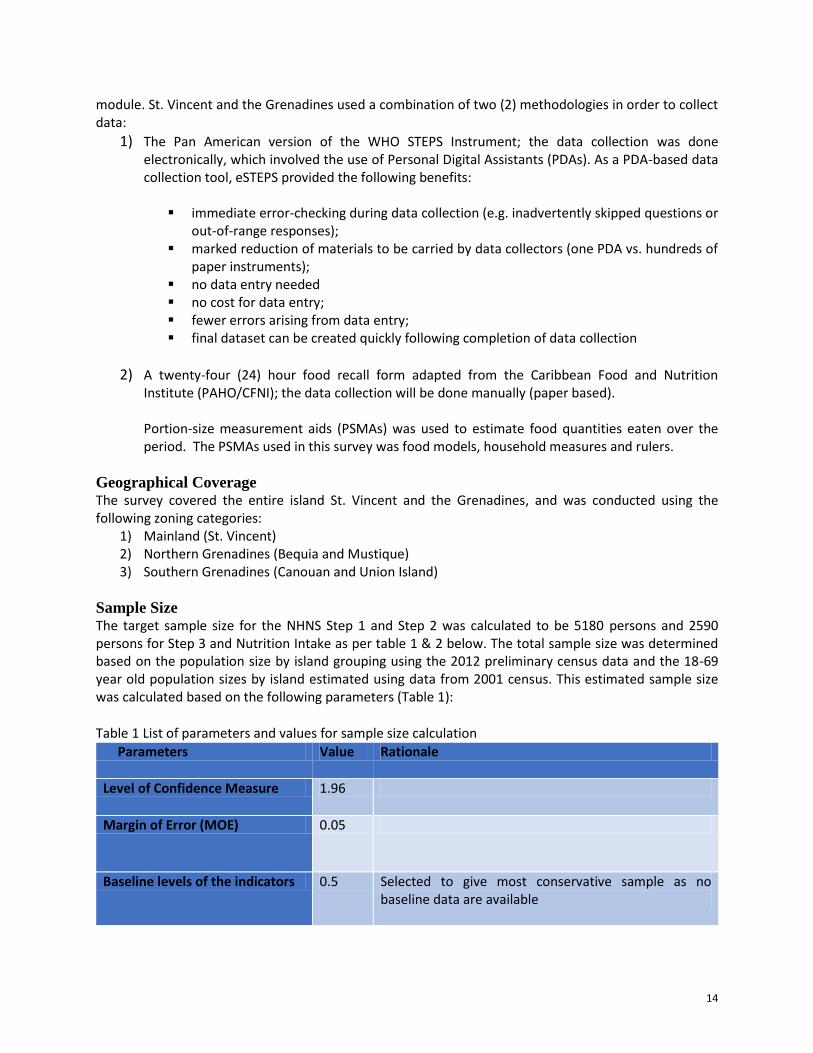
Sample Size The target sample size for the NHNS Step 1 and Step 2 was calculated to be 5180 persons and 2590 persons for Step 3 and Nutrition Intake as per table 1 & 2 below. The total sample size was determined based on the population size by island grouping using the 2012 preliminary census data and the 18-69 year old population sizes by island estimated using data from 2001 census. This estimated sample size was calculated based on the following parameters (Table 1):
Table 1 List of parameters and values for sample size calculation
Parameters Value Rationale
Level of Confidence Measure 1.96
Margin of Error (MOE) 0.05
Baseline levels of the indicators 0.5 Selected to give most conservative sample as no baseline data are available
15
Design effect (Deff) 1.5 Result of the sampling methodology which will involve cluster sampling
Expected Response Rate 0.80 Based on previous survey response rates experiences in St. St. Vincent & the Grenadines
Number of age/sex Estimates 6 10-year age groups (18-29, 30-44, 45-69 years) for males and for females
Table 2 Breakdown of sample size calculation for NHNS
Island Census Division
Total Population Size
Population Size 18-69 years (approximated)
Sample Size Calculated (Proportionally Split)
Sample Size required to report for 18-69 population1
Final Sample Size2
St. Vincent
Mainland 97,564 55,861 3,913 721 3,913
Bequia Mustique
Northern Grenadines
6,184 3,541 248 650 650
Canouan Mayreau Union Island
Southern Grenadines
4,019 2,301 161 617 617
SVG 107,767 61,703 4,322 5,180
The Caribbean Public Health Agency (CARPHA) provided support with the sample calculation and the Ministry of Planning and Central Statistical Office in St. Vincent and the Grenadines assisted with the sample selection. This is the most conservative estimate as it assumed a highly variable population and encouraged accurate prevalence estimates for all indicators from the survey results. The estimate is based on the 2001 and 2012 population census data.
Sampling and Recruitment The sample size was proportionately divided between the three main reporting strata (St.Vincent/Northern Grenadines/Southern Grenadines). The country’s most recent age breakdown based on the 2001 national census by St. Vincent was used to approximate the adult population 18-69 years by Island grouping. The survey was stratified by sex, age groups 18-29, 30-44 and 45-69 years and by geographical location – St. Vincent, Northern Grenadines and Southern Grenadines.
1 Sample size required to obtain accurate results on the single strata 18-69 persons in each island. These results are
desirous for this survey. 2 The larger of the previous two columns is selected.
16
A three-stage cluster sampling approach was used. Enumeration districts were randomly selected using Probability Proportional to Size (PPS) from the sampling frame. A total of 199 enumeration districts were selected. The sampling frame was developed using the number of households per enumeration district taken from the 2012 preliminary census report; enumeration districts had been subsequently revised (2010-2011) so that no enumeration district containing more than 150 Households would be randomly selected from the selected enumeration districts. The number of households per enumeration district to be selected was 26. Where an enumeration district had been split into 2 or more new enumeration districts the number of households in the previously defined enumeration district was divided equally between the newly revised enumeration districts. The household list for each selected enumeration district was updated prior to selection of households during a re-listing exercise. This was necessary as the existing household listing for each enumeration district was outdated.
Eligible persons at the household level were randomly selected using the Kish method. If no one was present in the selected household, a notification of visit card was left and the interviewer revisited. There was a total of three visits to the household before it was listed as non-response (one initial recruitment visit and two call backs). The interviewer then moved on to the next house on the list in the original order. Although the person selected for interview were to be at least 18 years and not older than 69 years on the last birthday, there were a few instances where some participants were turning 18 or 70 years; those cases were addressed during data cleaning.
Interviewers met participants at home mainly in the evenings and on weekends. The collection of blood samples and the nutrition intake (24 hour recall) was also done at participants’ homes in the mornings while participants were fasting and was completed on a revisit.
Eligibility Criteria Ethical approval in order for the study to be conducted in St. Vincent and the Grenadines was granted by the National Ethics Committee. In order to be considered eligible to participate in the survey a person:
Belonged within the age group of 18-69 years old
Appeared in the interviewer’s judgment to be capable of understanding the information
provided about the survey and who is therefore able to provide informed consent (i.e. must not
be intoxicated, doped sick or cognitively challenged).
Lived or worked in St. Vincent and the Grenadines at the time of the survey.
Understood English.
Also, exclusion from the study was acceptable only if persons (within the age criterion) were bedridden or mentally challenged. Pregnant participants were excluded from having waist measurement conducted. If eligible according to the above criteria, the participant was further eligible to complete an interview if he/she has not already participated in the current survey. Informed consent was sought prior to the interview being conducted.
17
Survey Staff and Training The overall conceptualization and planning for the NHNS was done via partnership with the Ministry of Health, Wellness and the Environment and Central Planning Department (European Development Fund Office) in St. Vincent and the Grenadines and the Pan American Health Organization Eastern Caribbean Countries Office and the Caribbean Public Health Agency.
The survey team consisted of one field coordinator, 16 field supervisors and approximately 117 interviewers. The training of the field staff was conducted by the Caribbean Public Health Agency, Ministry of Health, Wellness and the Environment personnel and Central Statistical Office personnel. Training was guided by the use of procedural guidelines specific to the implementation of the Pan American Version of WHO STEPS version 3.0 to surveillance of non-communicable diseases (STEPS) and the 24-hour recall methodology.
Data Collection Questionnaire A questionnaire (see Annex 1) was used to collect the needed information from the survey participants along with the collection of physical measurements. The survey questionnaire was adapted from the tools available from the Caribbean Public Health Agency for standardized surveillance of non-communicable diseases (STEPS) and nutrition (24 hour recall). The questionnaire themes included: socio-demographics, tobacco use, alcohol consumption, diet, physical activity, physical measurements, nutrition and health screening, lifestyle advice, family history, cervical cancer screening and dietary salt. The questionnaire was interviewer administered. The participants’ responses were entered directly into a hand-help Personal Digital Assistant (PDA) and a paper based instrument. The field supervisor routinely reviewed the completed questionnaire for completion. The questionnaire was only be offered in English.
Biological samples, testing and Nutrition intake (24 hour recall) Fifty percent (50%) of the survey participants were asked to provide a biological specimen (finger prick) for Glucose and cholesterol testing using Glucose and Lipid Sampling Kits and respond to the nutrition intake (24 hour recall). The biological sample was only collected with participants’ explicit consent; the samples were not stored or used for additional undetermined or undisclosed future testing to which respondents did not agree at the time of participation.
Approaches to Data Analysis The following reports are the key outputs of the data analysis:
Fact Sheet (Annex 2) Data Book Site report
The recommended data analysis software Epi Info (version 3.3 or higher) was used. The data analysis process ranged from cleaning the database to producing the final results for the site report. Once the data was downloaded from the PDAs, it was cleaned and analysed in Epi Info and the interview tracking information was attached to the survey data. Prior to production of any reports, there were four (4) main steps of the data analysis process:
1) Data Cleaning 2) Calculating response properties 3) Weighting
18
4) Finalizing the dataset
Sustainability and future surveys It is recommended that surveys geared to address risk factor surveillance are repeated every 3-5 years. In St. Vincent and the Grenadines the strategies to combat the development of chronic diseases and encourage behaviour change which will be implemented following completion of the survey must be monitored and evaluated. Systems must therefore be institutionalized to ensure the provision of appropriate resource allocation for such repeat surveys.
Timeframe The survey was implemented for a 9-month period between January 2013 and December 2014. The preparatory phase took place from September 2011. The field work for the collection of data on risk factors and nutritional intake was conducted during the period October-November 2013. The final report was drafted in March 2015 after consultation with stakeholders on the findings, and a National Launch of the Report is planned to occur by the third quarter of 2015.
Resources The NHNS was funded under the 10th European Development Fund (EDF) as part of support to the St. Vincent and the Grenadines Health Sector. The technical support for the survey was provided by Pan American Health Organization and the Caribbean Public Health Agency.
19
Survey Results
Socio-Demographic Information (Step 1)
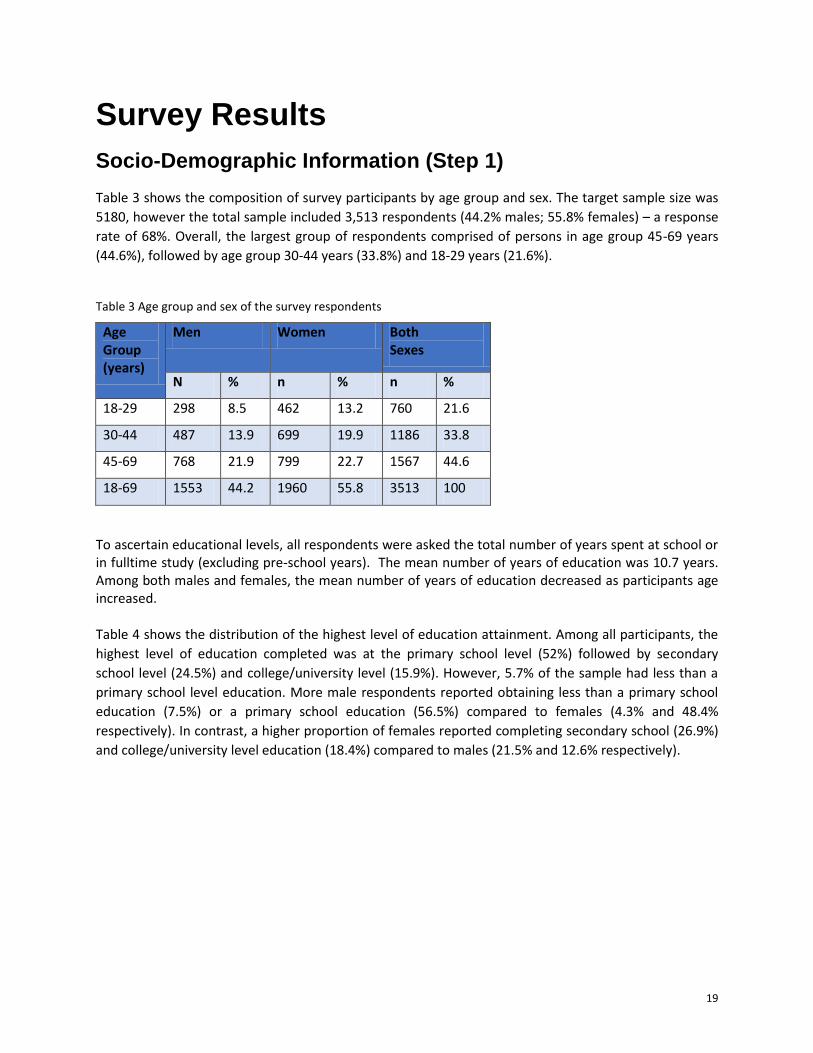
Table 3 shows the composition of survey participants by age group and sex. The target sample size was
5180, however the total sample included 3,513 respondents (44.2% males; 55.8% females) – a response
rate of 68%. Overall, the largest group of respondents comprised of persons in age group 45-69 years
(44.6%), followed by age group 30-44 years (33.8%) and 18-29 years (21.6%).
Table 3 Age group and sex of the survey respondents
Age Group (years)
Men Women Both Sexes
N % n % n %
18-29 298 8.5 462 13.2 760 21.6
30-44 487 13.9 699 19.9 1186 33.8
45-69 768 21.9 799 22.7 1567 44.6
18-69 1553 44.2 1960 55.8 3513 100
To ascertain educational levels, all respondents were asked the total number of years spent at school or in fulltime study (excluding pre-school years). The mean number of years of education was 10.7 years. Among both males and females, the mean number of years of education decreased as participants age increased.
Table 4 shows the distribution of the highest level of education attainment. Among all participants, the
highest level of education completed was at the primary school level (52%) followed by secondary
school level (24.5%) and college/university level (15.9%). However, 5.7% of the sample had less than a
primary school level education. More male respondents reported obtaining less than a primary school
education (7.5%) or a primary school education (56.5%) compared to females (4.3% and 48.4%
respectively). In contrast, a higher proportion of females reported completing secondary school (26.9%)
and college/university level education (18.4%) compared to males (21.5% and 12.6% respectively).
20
Table 4 Highest level of education by age group and sex
Age Group (years)
Sex n No formal
schooling
Less than
primary school
Primary school
completed
Secondary school
completed
College/ University completed
Post- graduate degree
completed
18-29 M 297 0.3 2.4 36.0 42.1 18.5 0.7
F 462 0.2 0.9 26.0 43.9 27.5 1.5
30-44 M 486 0.2 6.4 57.0 23.3 11.9 1.2
F 698 0.1 1.7 49.0 28.1 19.9 1.1
45-69 M 765 1.0 10.2 64.1 12.4 10.7 1.6
F 797 1.4 8.5 61.0 15.9 11.9 1.3
18-69 Total 3505 0.7 5.7 52.0 24.5 15.9 1.3
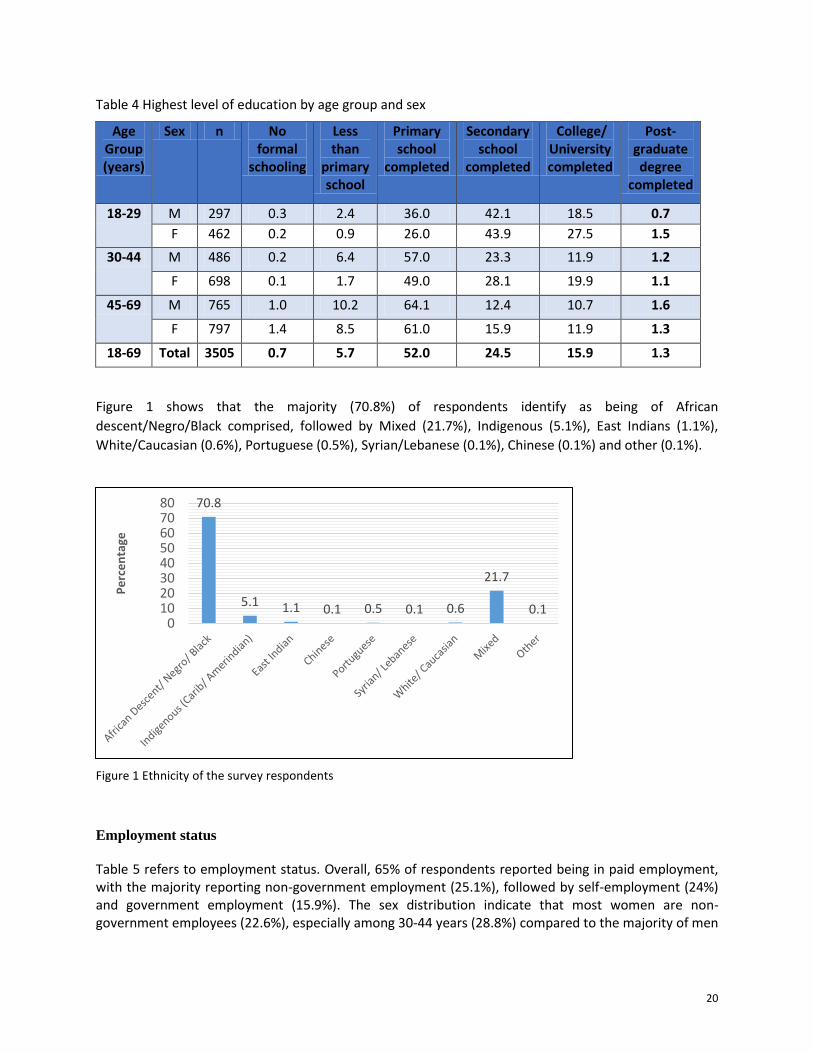
Figure 1 shows that the majority (70.8%) of respondents identify as being of African
descent/Negro/Black comprised, followed by Mixed (21.7%), Indigenous (5.1%), East Indians (1.1%),
White/Caucasian (0.6%), Portuguese (0.5%), Syrian/Lebanese (0.1%), Chinese (0.1%) and other (0.1%).
Figure 1 Ethnicity of the survey respondents
Employment status
Table 5 refers to employment status. Overall, 65% of respondents reported being in paid employment, with the majority reporting non-government employment (25.1%), followed by self-employment (24%) and government employment (15.9%). The sex distribution indicate that most women are non-government employees (22.6%), especially among 30-44 years (28.8%) compared to the majority of men
70.8
5.1 1.1 0.1 0.5 0.1 0.6
21.7
0.1 0
1020304050607080
Pe
rce
nta
ge
21
being self-employed (35.5%), especially the 45-69 (42.8%) and 30-44 (36.1%) age groups. Overall, the age group 30-44 years comprised the highest group of paid employees (74.5%). The Table also shows that 35% of respondents identified as unpaid (i.e. persons who are non-paid, students, homemakers, retired, and unemployed), comprising disproportionately of females and persons in age groups 18-29 years and 45-69 years.
Table 5 Employment Status by age group and sex
Age Group (years)
Sex n Government employee
Non government employee
%Self- employed
% Unpaid
18-29 M 296 12.5 31.4 15.9 40.2
F 461 15.2 20.8 5.6 58.4
30-44 M 487 16.4 37.0 36.1 10.5
F 698 20.2 28.8 15.0 36.0
45-69 M 767 14.9 21.5 42.8 20.9
F 798 14.3 18.3 20.2 47.2
18-69 Total 3507 15.9 25.1 24.0 35.0
Estimated household earnings
Table 6 shows that almost one-quarter of participants reported an estimated annual household earning
of between EC $2500.00-$4999.00, followed by 18.2% with $5000.00-$9999.00, 16.8% with under
$2500.00, 13.60% with $10000.00-14999, 12.20% with $15000.00-$24999.00, 10.70% with $25000.00-
$49999.00, 4.7% with $50000.00-$74999.00, and 2% earning the highest amount with more than
$75000.00.
Table 6 Percent estimated household earnings
N Under $2500
$2500-$4999
$5000-$9999
$10000-$14999
$15000-24999
$25000-$49999
$50000-$74999
More than
$75000
2552 16.8% 21.9% 18.2% 13.60% 12.20% 10.70% 4.70% 2.00%
Behavioral Risk Factors (Step 1)
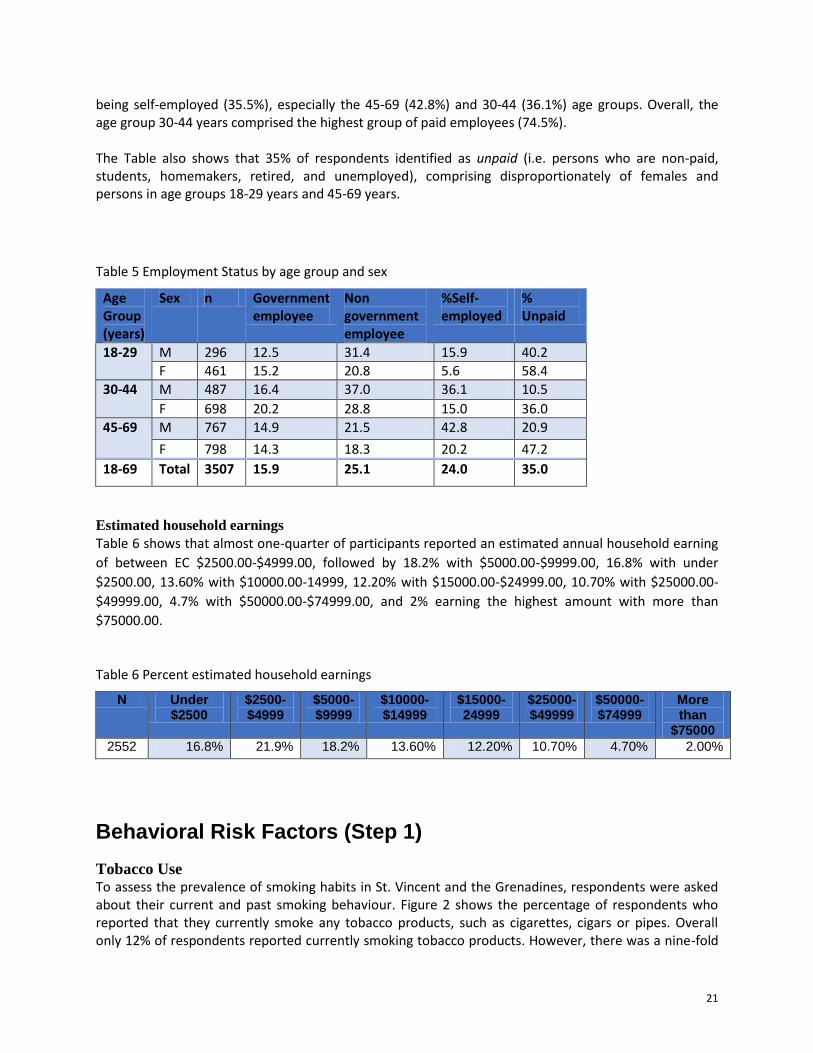
Tobacco Use To assess the prevalence of smoking habits in St. Vincent and the Grenadines, respondents were asked about their current and past smoking behaviour. Figure 2 shows the percentage of respondents who reported that they currently smoke any tobacco products, such as cigarettes, cigars or pipes. Overall only 12% of respondents reported currently smoking tobacco products. However, there was a nine-fold
22
higher current smoking rate among males (21.9%) than females (2.5%). Although there was a higher proportion of males who smoked in all age groups than females, it is noteworthy that among males, the proportion of current smokers was highest among respondents in age group 30-44 years (25.5%) and 45-69 years (21.9%), while the lowest proportion was in age group 18-29 years. In contrast, among females, the high proportion of current smokers was found in age group 45-69 years (3.6%) and lowest among in age group 30-44 years (1.9%).
Figure 2 Percentage of current smokers by age and sex
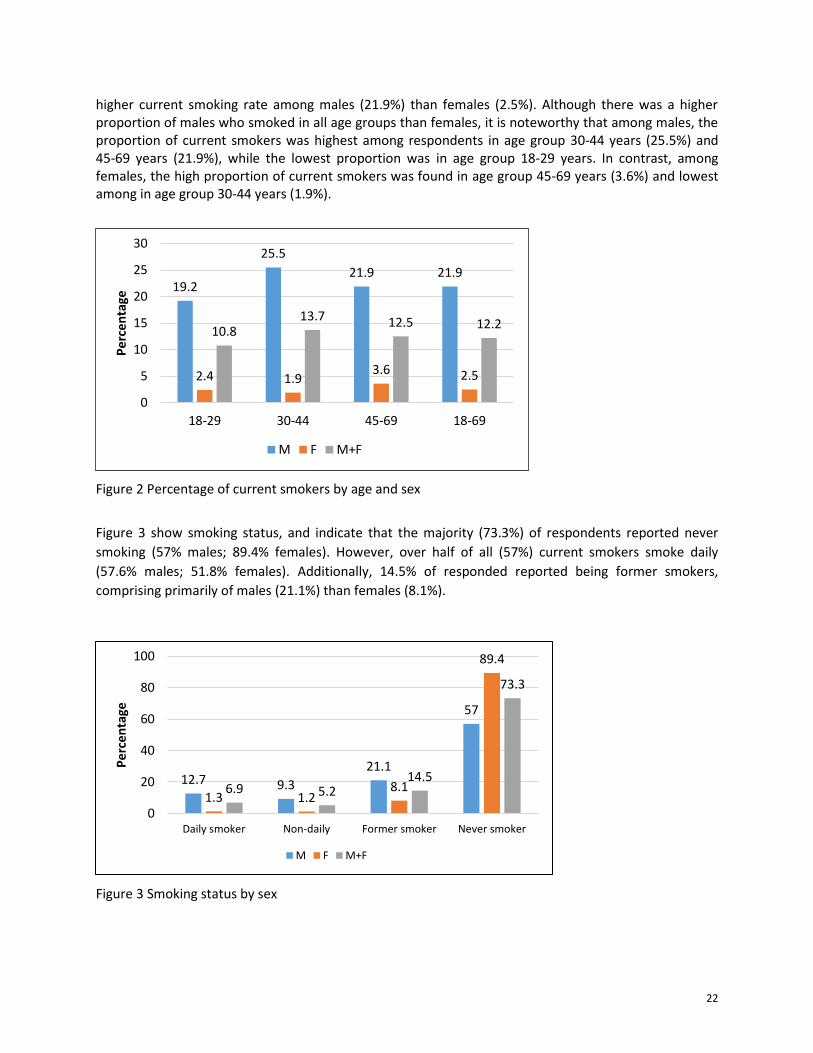
Figure 3 show smoking status, and indicate that the majority (73.3%) of respondents reported never
smoking (57% males; 89.4% females). However, over half of all (57%) current smokers smoke daily
(57.6% males; 51.8% females). Additionally, 14.5% of responded reported being former smokers,
comprising primarily of males (21.1%) than females (8.1%).
Figure 3 Smoking status by sex
19.2
25.5
21.9 21.9
2.4 1.9 3.6 2.5
10.8 13.7 12.5 12.2
0
5
10
15
20
25
30
18-29 30-44 45-69 18-69
Pe
rce
nta
ge
M F M+F
12.7 9.3
21.1
57
1.3 1.2 8.1
89.4
6.9 5.2 14.5
73.3
0
20
40
60
80
100
Daily smoker Non-daily Former smoker Never smoker
Pe
rce
nta
ge
M F M+F
23
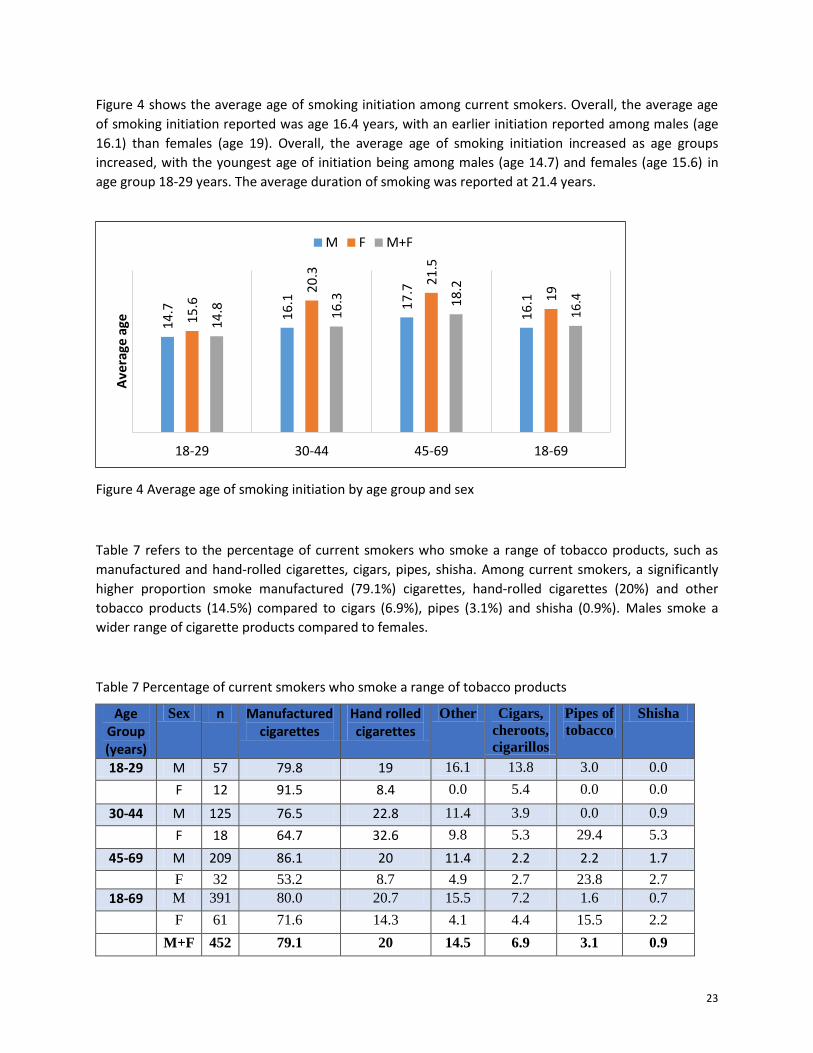
Figure 4 shows the average age of smoking initiation among current smokers. Overall, the average age
of smoking initiation reported was age 16.4 years, with an earlier initiation reported among males (age
16.1) than females (age 19). Overall, the average age of smoking initiation increased as age groups
increased, with the youngest age of initiation being among males (age 14.7) and females (age 15.6) in
age group 18-29 years. The average duration of smoking was reported at 21.4 years.
Figure 4 Average age of smoking initiation by age group and sex
Table 7 refers to the percentage of current smokers who smoke a range of tobacco products, such as
manufactured and hand-rolled cigarettes, cigars, pipes, shisha. Among current smokers, a significantly
higher proportion smoke manufactured (79.1%) cigarettes, hand-rolled cigarettes (20%) and other
tobacco products (14.5%) compared to cigars (6.9%), pipes (3.1%) and shisha (0.9%). Males smoke a
wider range of cigarette products compared to females.
Table 7 Percentage of current smokers who smoke a range of tobacco products
Age Group (years)
Sex n Manufactured cigarettes
Hand rolled cigarettes
Other Cigars,
cheroots,
cigarillos
Pipes of
tobacco Shisha
18-29 M 57 79.8 19 16.1 13.8 3.0 0.0
F 12 91.5 8.4 0.0 5.4 0.0 0.0
30-44 M 125 76.5 22.8 11.4 3.9 0.0 0.9
F 18 64.7 32.6 9.8 5.3 29.4 5.3
45-69 M 209 86.1 20 11.4 2.2 2.2 1.7
F 32 53.2 8.7 4.9 2.7 23.8 2.7
18-69 M 391 80.0 20.7 15.5 7.2 1.6 0.7
F 61 71.6 14.3 4.1 4.4 15.5 2.2
M+F 452 79.1 20 14.5 6.9 3.1 0.9
14
.7
16
.1
17
.7
16
.1
15
.6 2
0.3
21
.5
19
14
.8
16
.3
18
.2
16
.4
18-29 30-44 45-69 18-69
Ave
rage
age
M F M+F
24
Table 8 refers to the percentage of daily cigarette smokers who smoke given quantities of manufactured
or hand-rolled cigarettes per day. The majority of all daily smokers smoke between 10-14 cigarettes
(35.8%) per day, followed by 5-9 cigarettes (29.5%), less than 5 cigarettes (20%), 15-24 cigarettes (13%)
and 1.7% smoke 25 or more cigarettes. Examinations of frequency patterns between males and females
indicate that more females smoke 10-14 cigarettes per day and less than 5 cigarettes per day, whereas
more males smoke 5-9, 15-24 and more than 24 manufactured or hand-rolled cigarettes per day.
Table 8 Frequency of daily smokers smoking quantities of manufactured or hand-rolled cigarette per day
Age Group
(years)
Sex n <5 Cigs. 5-9 Cigs. 10-14 Cigs. 15-24 Cigs. ≥ 25 Cigs.
18-29 M 22 22.5 31.2 26.2 20.1 0
F 3 23.4 0 76.6 0 0
30-44 M 64 19.1 37.4 32.2 9 2.2
F 5 87.4 0 0 12.6 0
45-69 M 110 13.8 24 45.6 13.1 3.4
F 10 24.7 21.6 35.4 18.4 0
18-69 M 196 18.7 31.7 34.2 13.5 1.9
F 18 33.9 6.6 52.0 7.6 0
M+F 214 20 29.5 35.8 13 1.7
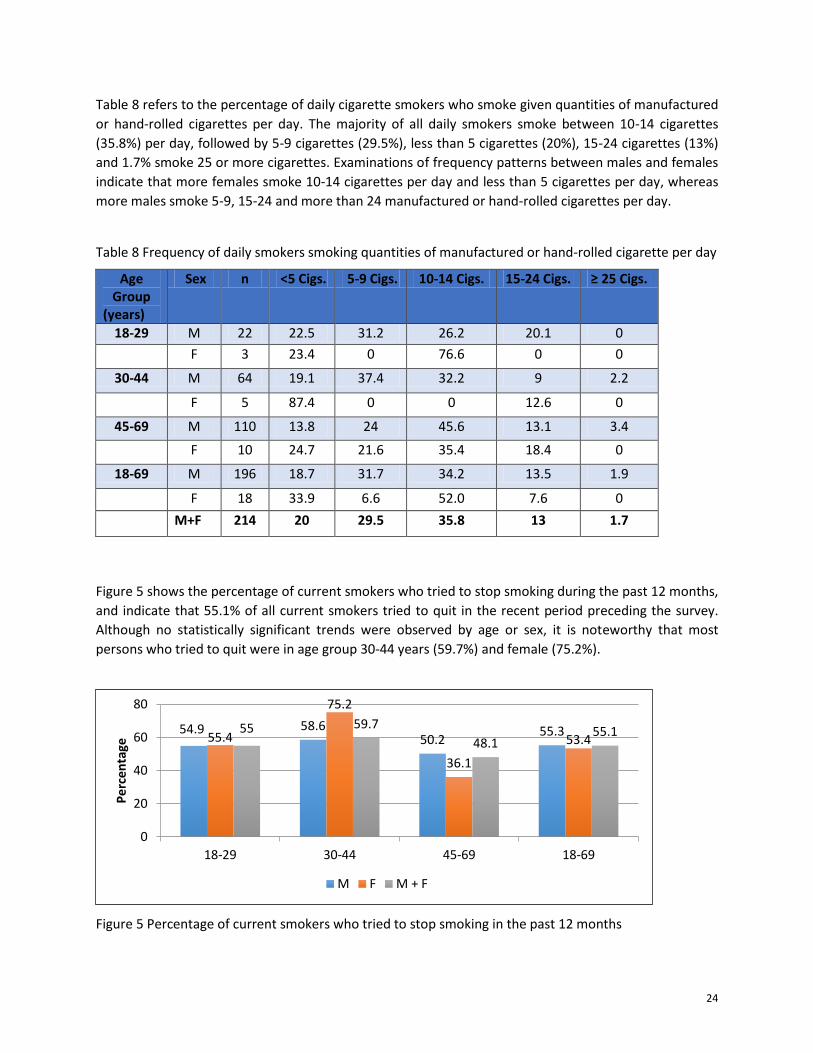
Figure 5 shows the percentage of current smokers who tried to stop smoking during the past 12 months,
and indicate that 55.1% of all current smokers tried to quit in the recent period preceding the survey.
Although no statistically significant trends were observed by age or sex, it is noteworthy that most
persons who tried to quit were in age group 30-44 years (59.7%) and female (75.2%).
Figure 5 Percentage of current smokers who tried to stop smoking in the past 12 months
54.9 58.6 50.2
55.3 55.4
75.2
36.1
53.4 55 59.7
48.1 55.1
0
20
40
60
80
18-29 30-44 45-69 18-69
Pe
rce
nta
ge
M F M + F
25
Exposure to second-hand smoke in home in past 30 days
Tables 9 refer to environment smoke exposure at home and in the workplace during the past 30 day
among all respondents. Overall, 16.9% and 18.8% reported exposure to second-hand smoke in the home
and workplace environment respectively, in the past 30 days. More males that females reported
exposure to second-hand smoke. Although no trends were observed, the highest proportion of persons
exposed in the home consisted of respondents in age group 18-29 years (20.1%), while the highest
proportion of respondents exposed in the workplace comprised of respondents in age group 30-44 years
(22.1%).
Table 9 Exposure to second-hand smoke at home and in the workplace during the past 30-days
Alcohol Consumption
Alcohol consumption status
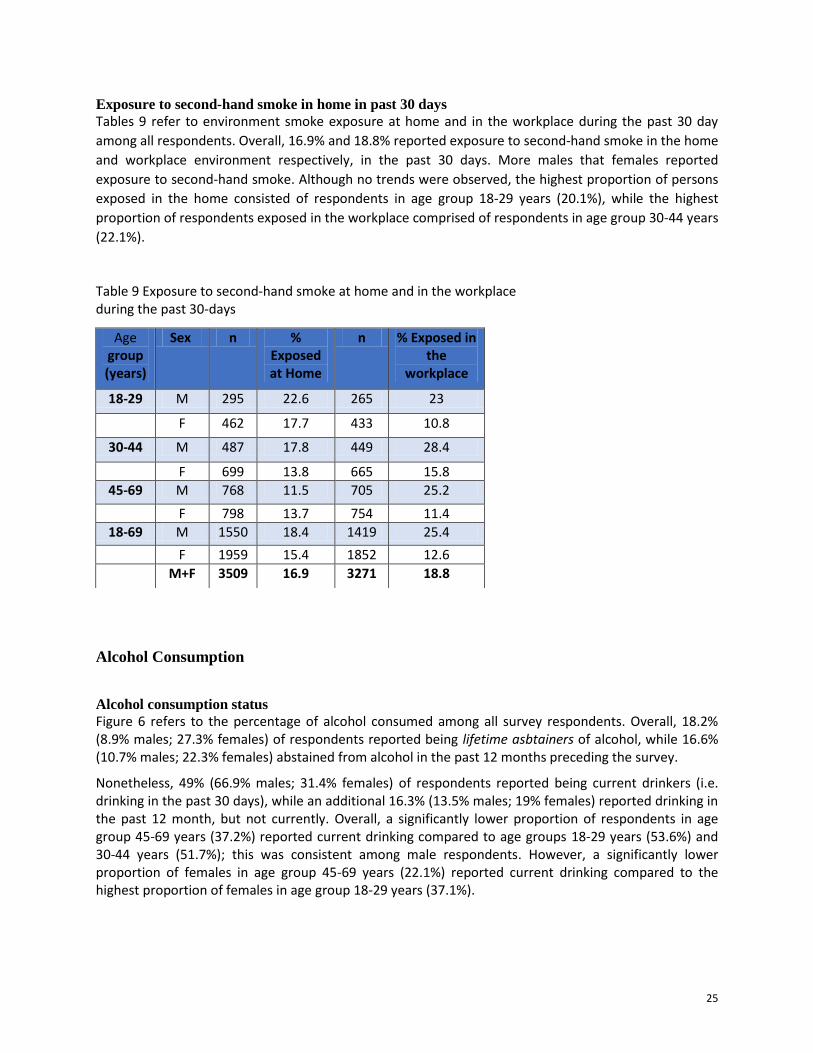
Figure 6 refers to the percentage of alcohol consumed among all survey respondents. Overall, 18.2% (8.9% males; 27.3% females) of respondents reported being lifetime asbtainers of alcohol, while 16.6% (10.7% males; 22.3% females) abstained from alcohol in the past 12 months preceding the survey.
Nonetheless, 49% (66.9% males; 31.4% females) of respondents reported being current drinkers (i.e. drinking in the past 30 days), while an additional 16.3% (13.5% males; 19% females) reported drinking in the past 12 month, but not currently. Overall, a significantly lower proportion of respondents in age group 45-69 years (37.2%) reported current drinking compared to age groups 18-29 years (53.6%) and 30-44 years (51.7%); this was consistent among male respondents. However, a significantly lower proportion of females in age group 45-69 years (22.1%) reported current drinking compared to the highest proportion of females in age group 18-29 years (37.1%).
Age group (years)
Sex n % Exposed at Home
n % Exposed in the
workplace
18-29 M 295 22.6 265 23
F 462 17.7 433 10.8
30-44 M 487 17.8 449 28.4
F 699 13.8 665 15.8
45-69 M 768 11.5 705 25.2
F 798 13.7 754 11.4
18-69 M 1550 18.4 1419 25.4
F 1959 15.4 1852 12.6
M+F 3509 16.9 3271 18.8
26
Figure 6 Percentage of alcohol consumed among all survey respondents, 18-69 years
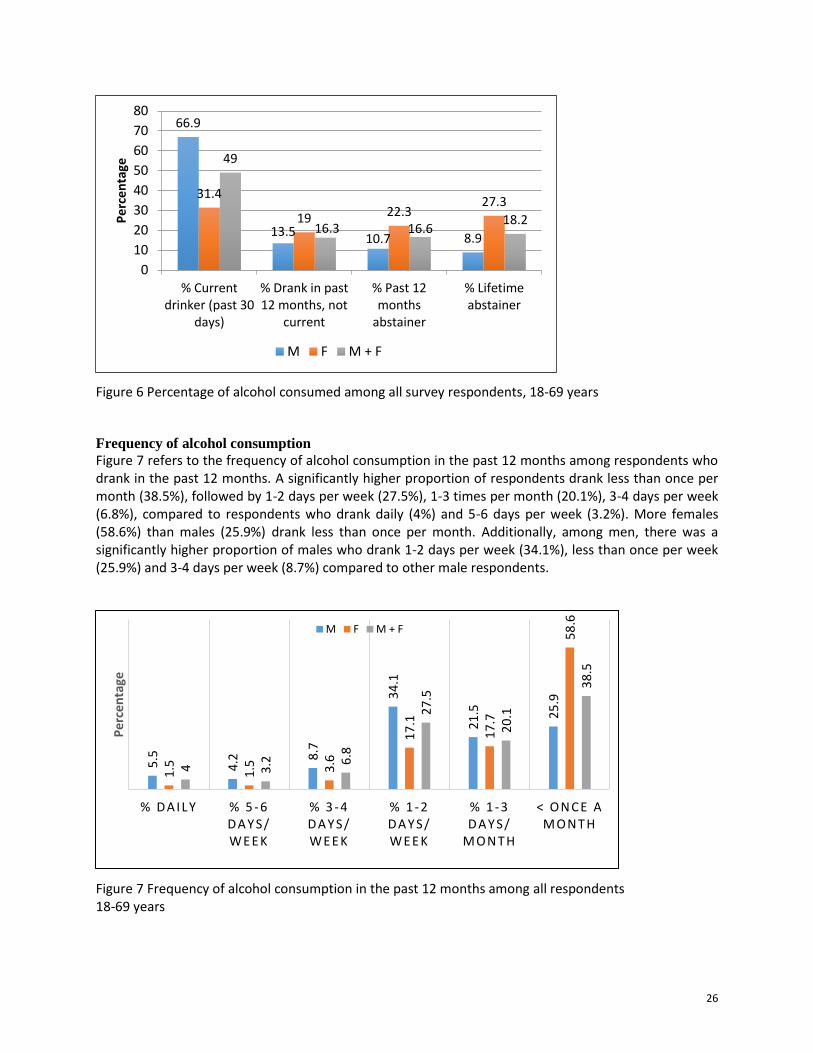
Frequency of alcohol consumption
Figure 7 refers to the frequency of alcohol consumption in the past 12 months among respondents who drank in the past 12 months. A significantly higher proportion of respondents drank less than once per month (38.5%), followed by 1-2 days per week (27.5%), 1-3 times per month (20.1%), 3-4 days per week (6.8%), compared to respondents who drank daily (4%) and 5-6 days per week (3.2%). More females (58.6%) than males (25.9%) drank less than once per month. Additionally, among men, there was a significantly higher proportion of males who drank 1-2 days per week (34.1%), less than once per week (25.9%) and 3-4 days per week (8.7%) compared to other male respondents.
Figure 7 Frequency of alcohol consumption in the past 12 months among all respondents 18-69 years
66.9
13.5 10.7 8.9
31.4
19 22.3 27.3
49
16.3 16.6 18.2
0
10
20
30
40
50
60
70
80
% Currentdrinker (past 30
days)
% Drank in past12 months, not
current
% Past 12months
abstainer
% Lifetimeabstainer
Pe
rce
nta
ge
M F M + F
5.5
4.2
8.7
34
.1
21
.5
25
.9
1.5
1.5
3.6
17
.1
17
.7
58
.6
4
3.2
6.8
27
.5
20
.1
38
.5
% DAILY % 5 - 6 DAY S/ WEEK
% 3 - 4 DAY S/ WEEK
% 1 - 2 DAY S/ WEEK
% 1 - 3 DAY S/
MON T H
< ON C E A MON T H
Pe
rce
nta
ge
M F M + F
27
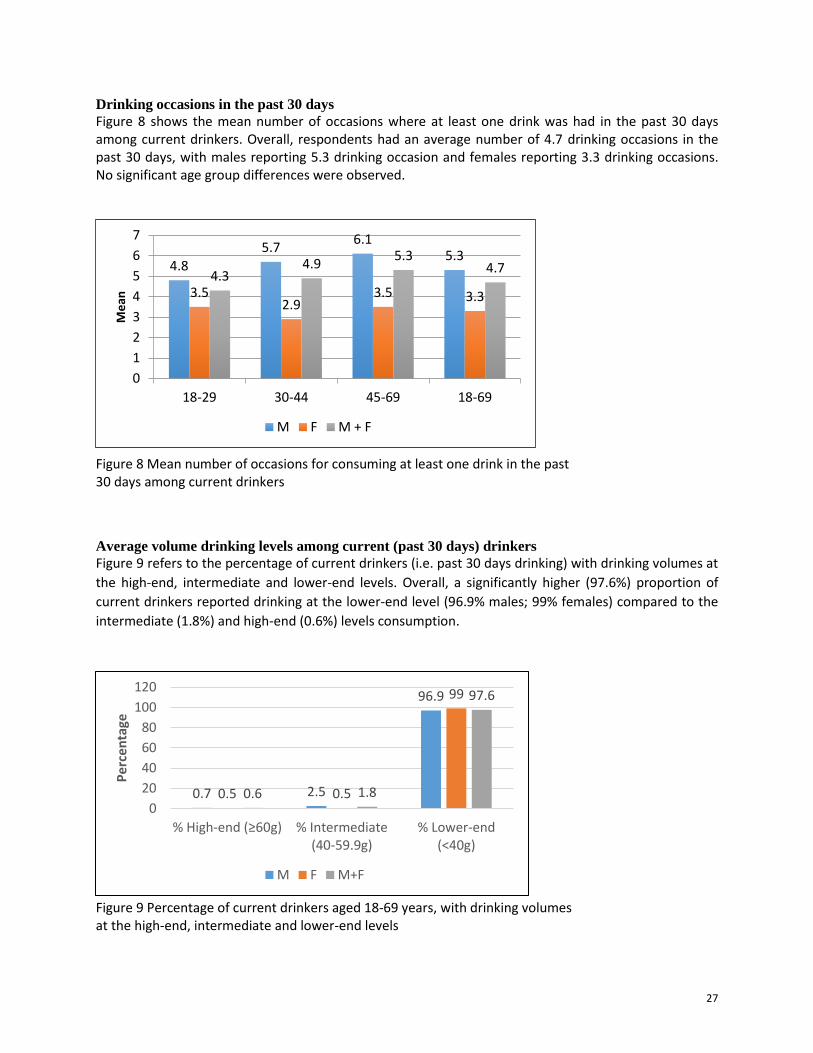
Drinking occasions in the past 30 days
Figure 8 shows the mean number of occasions where at least one drink was had in the past 30 days among current drinkers. Overall, respondents had an average number of 4.7 drinking occasions in the past 30 days, with males reporting 5.3 drinking occasion and females reporting 3.3 drinking occasions. No significant age group differences were observed.
Figure 8 Mean number of occasions for consuming at least one drink in the past 30 days among current drinkers
Average volume drinking levels among current (past 30 days) drinkers
Figure 9 refers to the percentage of current drinkers (i.e. past 30 days drinking) with drinking volumes at
the high-end, intermediate and lower-end levels. Overall, a significantly higher (97.6%) proportion of
current drinkers reported drinking at the lower-end level (96.9% males; 99% females) compared to the
intermediate (1.8%) and high-end (0.6%) levels consumption.
Figure 9 Percentage of current drinkers aged 18-69 years, with drinking volumes at the high-end, intermediate and lower-end levels
0.7 2.5
96.9
0.5 0.5
99
0.6 1.8
97.6
0
20
40
60
80
100
120
% High-end (≥60g) % Intermediate(40-59.9g)
% Lower-end(<40g)
Pe
rcen
tage
M F M+F
4.8
5.7 6.1
5.3
3.5 2.9
3.5 3.3
4.3 4.9
5.3 4.7
0
1
2
3
4
5
6
7
18-29 30-44 45-69 18-69
Me
an
M F M + F
28
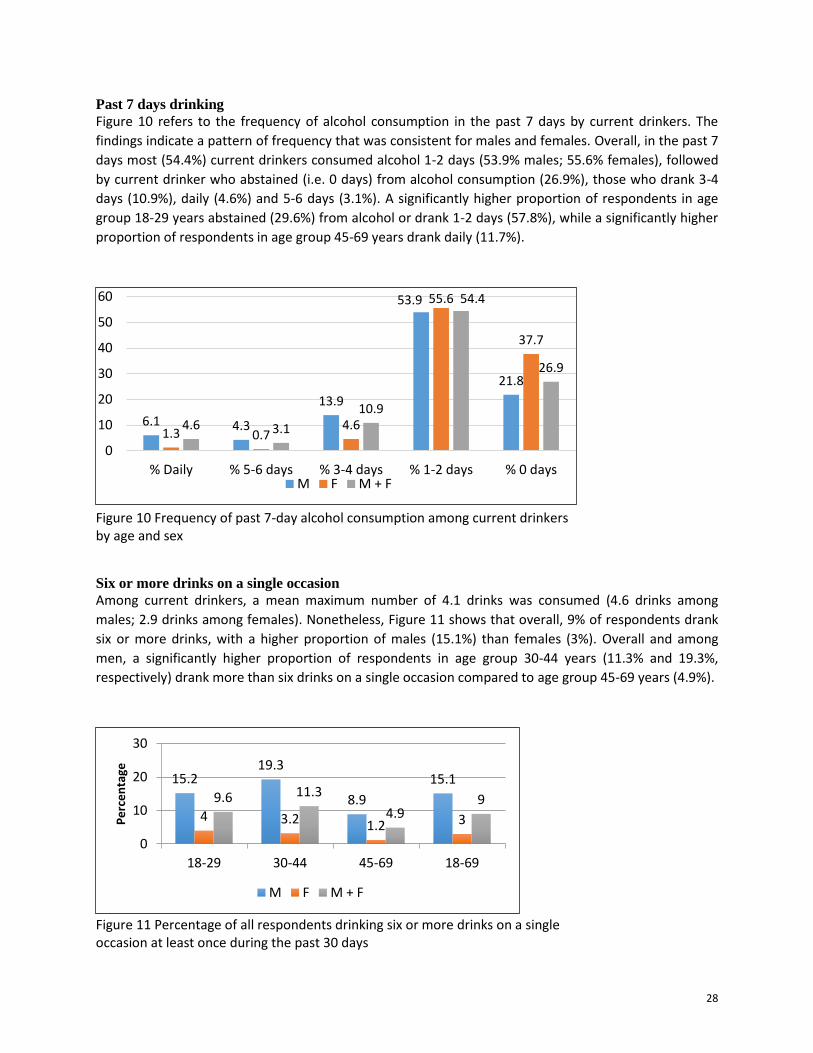
Past 7 days drinking
Figure 10 refers to the frequency of alcohol consumption in the past 7 days by current drinkers. The
findings indicate a pattern of frequency that was consistent for males and females. Overall, in the past 7
days most (54.4%) current drinkers consumed alcohol 1-2 days (53.9% males; 55.6% females), followed
by current drinker who abstained (i.e. 0 days) from alcohol consumption (26.9%), those who drank 3-4
days (10.9%), daily (4.6%) and 5-6 days (3.1%). A significantly higher proportion of respondents in age
group 18-29 years abstained (29.6%) from alcohol or drank 1-2 days (57.8%), while a significantly higher
proportion of respondents in age group 45-69 years drank daily (11.7%).
Figure 10 Frequency of past 7-day alcohol consumption among current drinkers by age and sex
Six or more drinks on a single occasion
Among current drinkers, a mean maximum number of 4.1 drinks was consumed (4.6 drinks among
males; 2.9 drinks among females). Nonetheless, Figure 11 shows that overall, 9% of respondents drank
six or more drinks, with a higher proportion of males (15.1%) than females (3%). Overall and among
men, a significantly higher proportion of respondents in age group 30-44 years (11.3% and 19.3%,
respectively) drank more than six drinks on a single occasion compared to age group 45-69 years (4.9%).
Figure 11 Percentage of all respondents drinking six or more drinks on a single occasion at least once during the past 30 days
6.1 4.3
13.9
53.9
21.8
1.3 0.7 4.6
55.6
37.7
4.6 3.1
10.9
54.4
26.9
0
10
20
30
40
50
60
% Daily % 5-6 days % 3-4 days % 1-2 days % 0 daysM F M + F
15.2 19.3
8.9
15.1
4 3.2 1.2 3
9.6 11.3
4.9 9
0
10
20
30
18-29 30-44 45-69 18-69
Pe
rce
nta
ge
M F M + F
29
It is noteworthy that the majority of respondents did not report problematic behaviours related to their alcohol consumption, such as failing to do what was normally expected (92%) and drinking in the morning to get going (95.8%), as well as, problems with family/partner due to someone else’s drinking (97.3%).
Fruit and Vegetable Consumption
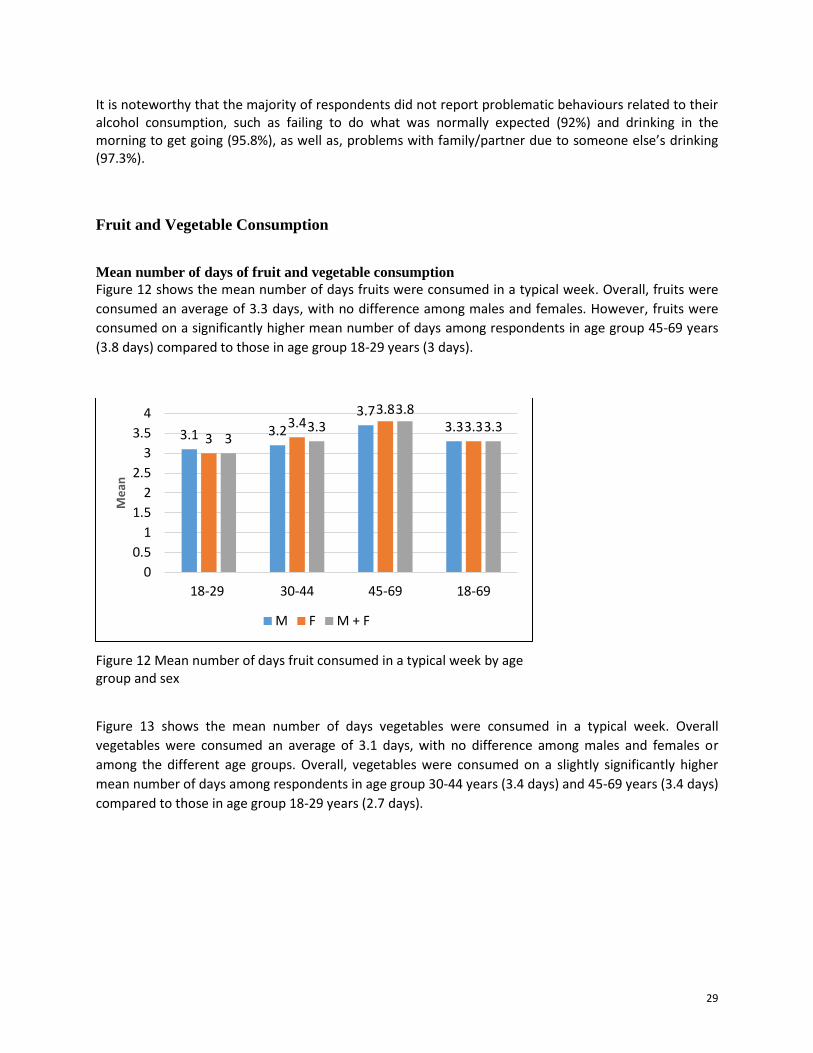
Mean number of days of fruit and vegetable consumption
Figure 12 shows the mean number of days fruits were consumed in a typical week. Overall, fruits were
consumed an average of 3.3 days, with no difference among males and females. However, fruits were
consumed on a significantly higher mean number of days among respondents in age group 45-69 years
(3.8 days) compared to those in age group 18-29 years (3 days).
Figure 12 Mean number of days fruit consumed in a typical week by age group and sex
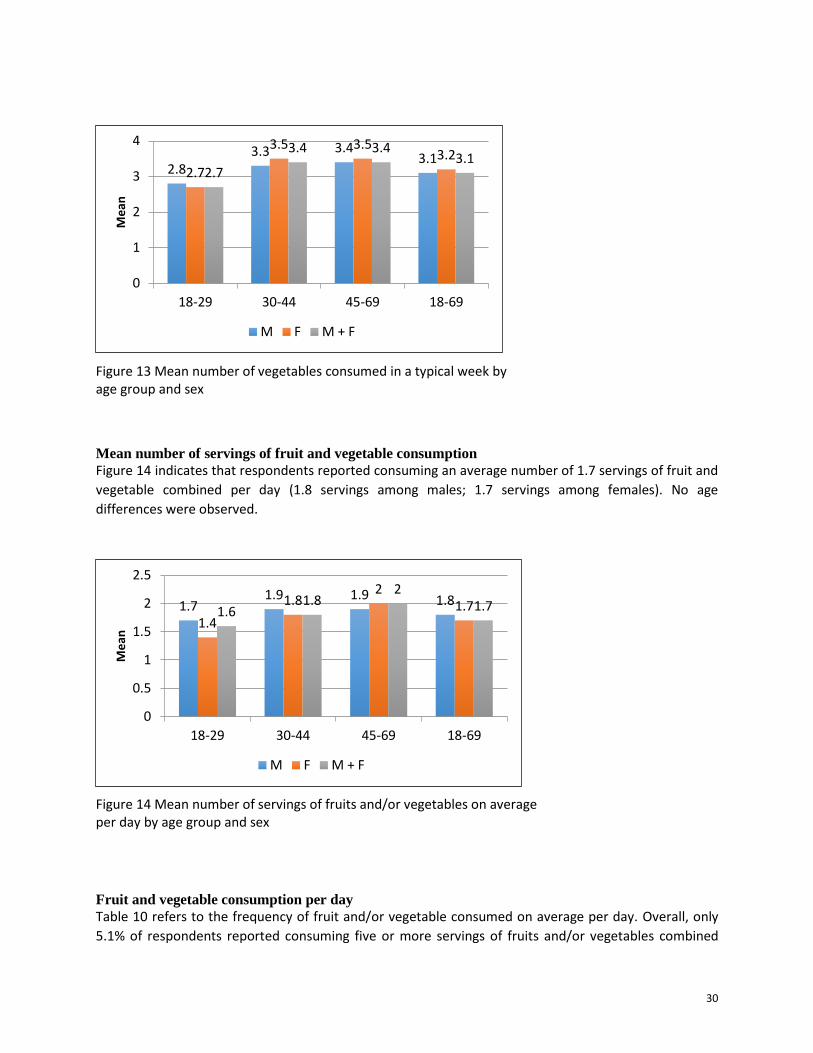
Figure 13 shows the mean number of days vegetables were consumed in a typical week. Overall
vegetables were consumed an average of 3.1 days, with no difference among males and females or
among the different age groups. Overall, vegetables were consumed on a slightly significantly higher
mean number of days among respondents in age group 30-44 years (3.4 days) and 45-69 years (3.4 days)
compared to those in age group 18-29 years (2.7 days).
3.1 3.2
3.7 3.3
3 3.4
3.8 3.3
3 3.3
3.8 3.3
0
0.5
1
1.5
2
2.5
3
3.5
4
18-29 30-44 45-69 18-69
Me
an
M F M + F
30
Figure 13 Mean number of vegetables consumed in a typical week by age group and sex
Mean number of servings of fruit and vegetable consumption
Figure 14 indicates that respondents reported consuming an average number of 1.7 servings of fruit and
vegetable combined per day (1.8 servings among males; 1.7 servings among females). No age
differences were observed.
Figure 14 Mean number of servings of fruits and/or vegetables on average per day by age group and sex
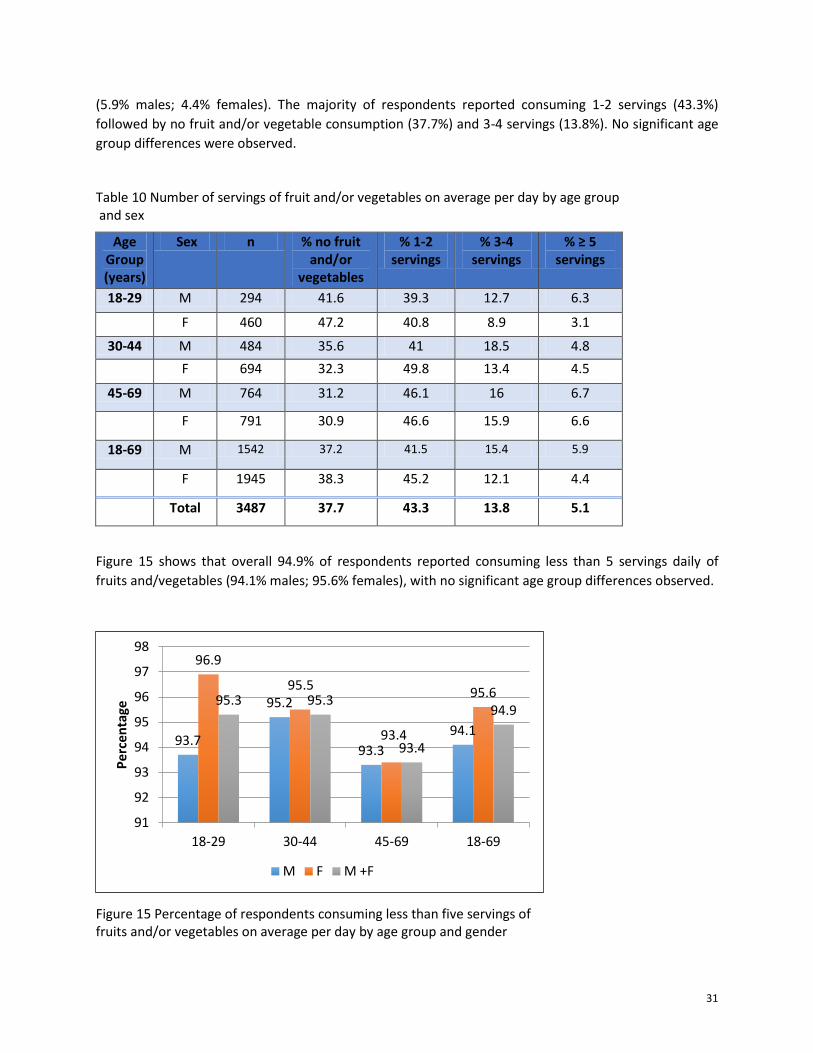
Fruit and vegetable consumption per day
Table 10 refers to the frequency of fruit and/or vegetable consumed on average per day. Overall, only
5.1% of respondents reported consuming five or more servings of fruits and/or vegetables combined
1.7 1.9 1.9 1.8
1.4
1.8 2
1.7 1.6 1.8
2 1.7
0
0.5
1
1.5
2
2.5
18-29 30-44 45-69 18-69
Me
an
M F M + F
2.8 3.3 3.4
3.1 2.7
3.5 3.5 3.2
2.7
3.4 3.4 3.1
0
1
2
3
4
18-29 30-44 45-69 18-69
Me
an
M F M + F
31
(5.9% males; 4.4% females). The majority of respondents reported consuming 1-2 servings (43.3%)
followed by no fruit and/or vegetable consumption (37.7%) and 3-4 servings (13.8%). No significant age
group differences were observed.
Table 10 Number of servings of fruit and/or vegetables on average per day by age group and sex
Age Group (years)
Sex n % no fruit and/or
vegetables
% 1-2 servings
% 3-4 servings
% ≥ 5 servings
18-29 M 294 41.6 39.3 12.7 6.3
F 460 47.2 40.8 8.9 3.1
30-44 M 484 35.6 41 18.5 4.8
F 694 32.3 49.8 13.4 4.5
45-69 M 764 31.2 46.1 16 6.7
F 791 30.9 46.6 15.9 6.6
18-69 M 1542 37.2 41.5 15.4 5.9
F 1945 38.3 45.2 12.1 4.4
Total 3487 37.7 43.3 13.8 5.1
Figure 15 shows that overall 94.9% of respondents reported consuming less than 5 servings daily of
fruits and/vegetables (94.1% males; 95.6% females), with no significant age group differences observed.
Figure 15 Percentage of respondents consuming less than five servings of fruits and/or vegetables on average per day by age group and gender
93.7
95.2
93.3
94.1
96.9
95.5
93.4
95.6 95.3 95.3
93.4
94.9
91
92
93
94
95
96
97
98
18-29 30-44 45-69 18-69
Pe
rcen
tage
M F M +F
32
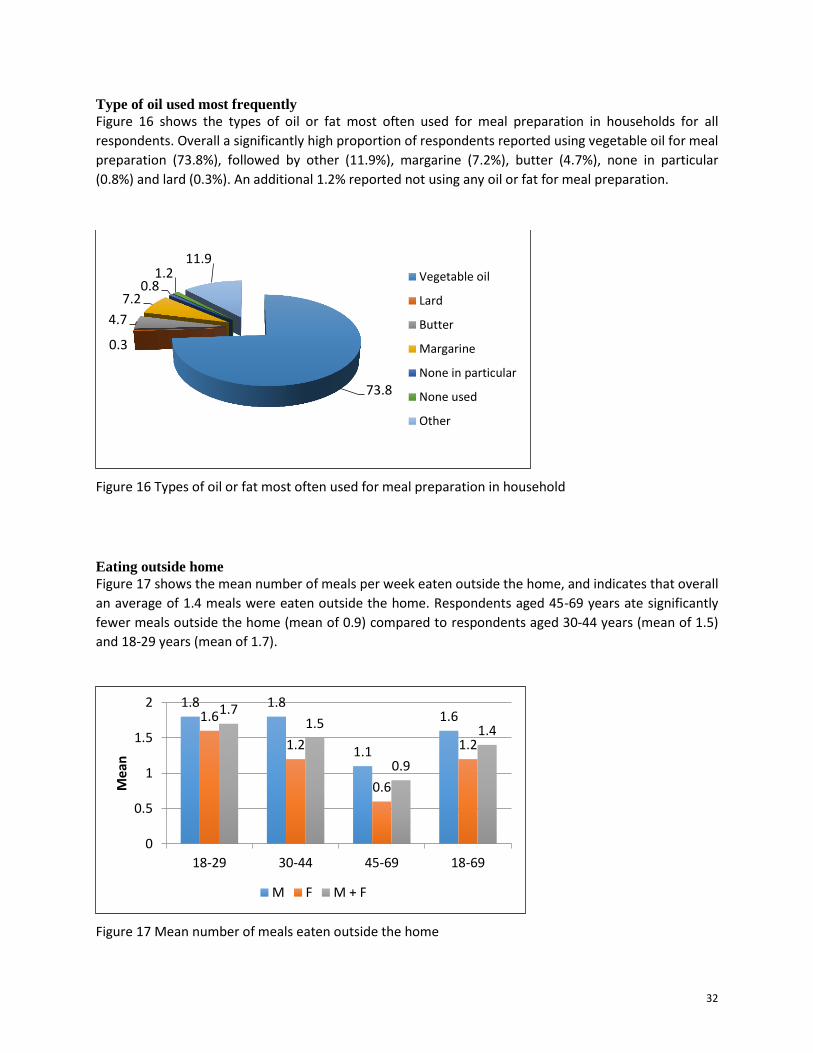
Type of oil used most frequently
Figure 16 shows the types of oil or fat most often used for meal preparation in households for all
respondents. Overall a significantly high proportion of respondents reported using vegetable oil for meal
preparation (73.8%), followed by other (11.9%), margarine (7.2%), butter (4.7%), none in particular
(0.8%) and lard (0.3%). An additional 1.2% reported not using any oil or fat for meal preparation.
Figure 16 Types of oil or fat most often used for meal preparation in household
Eating outside home
Figure 17 shows the mean number of meals per week eaten outside the home, and indicates that overall
an average of 1.4 meals were eaten outside the home. Respondents aged 45-69 years ate significantly
fewer meals outside the home (mean of 0.9) compared to respondents aged 30-44 years (mean of 1.5)
and 18-29 years (mean of 1.7).
Figure 17 Mean number of meals eaten outside the home
73.8
0.3
4.7
7.2 0.8
1.2 11.9
Vegetable oil
Lard
Butter
Margarine
None in particular
None used
Other
1.8 1.8
1.1
1.6 1.6
1.2
0.6
1.2
1.7 1.5
0.9
1.4
0
0.5
1
1.5
2
18-29 30-44 45-69 18-69
Mea
n
M F M + F
33
Physical Activity
Respondents were asked how often (frequency) and how long (duration) they engaged in three domains
of physical activity in a typical week: work-related, transport-related and recreation/leisure-related. In
the work and leisure domains, respondents were asked how many days per week and how many
hours/minutes per day they participate in moderate and vigorous intensity activities. In the transport
domain, respondents were asked how often and how long they either walk and/or cycle to and from
places.
The three physical activity domains were first examined separately to determine the mean minutes of
activity per day undertaken in each domain. Taking all domains into account, mean minutes of total
activity were computed, as well as three overall levels of activity: low, moderate, and high. To account
for the different levels of energy expenditure required for the activities (i.e. moderate and vigorous), the
daily duration of activity was converted into MET minutes per day.
The term MET (metabolic equivalent) is used as an indication of the intensity of physical activity. A MET
is the ratio of the associated metabolic rate for a specific activity divided by the resting metabolic rate.
The energy cost of sitting is equivalent to a resting metabolic rate of 1 MET. Similar to all STEPS Reports,
in this report, the following MET values were allocated to the three physical activity domains:
Moderate physical activity (work and leisure domain) = 4.0 METS
Vigorous physical activity (work and leisure domain) = 8.0 METS
Travel related walking/cycling = 4.0 METS
The following levels of activity in terms of MET minutes were defined as:
Low activity: <600 MET minutes per week
Moderate activity: 600-1500 MET minutes per week
High activity: >1500 MET minutes per week
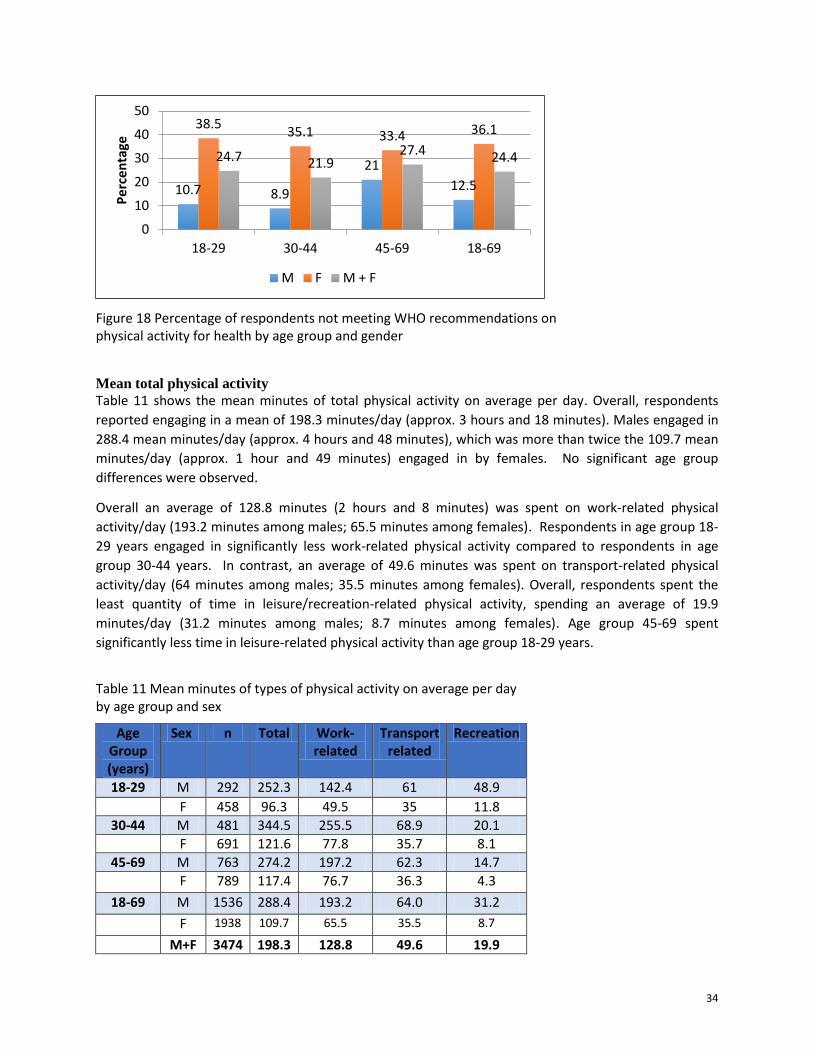
Not meeting WHO recommendations on physical activity for health
Figure 18 shows the percentage of respondents who were not meeting the WHO recommendation on
physical activity for health. Overall 24.4% (12.5% males; 36.1% females) of respondents were not
meeting the WHO recommendations. There were no significant differences among the different age
groups, however, females in age group 18-29 years (38.5%) and males in age group 45-69 years (21%)
comprised the highest proportion of respondents not meeting the recommendations.
34
Figure 18 Percentage of respondents not meeting WHO recommendations on physical activity for health by age group and gender
Mean total physical activity
Table 11 shows the mean minutes of total physical activity on average per day. Overall, respondents
reported engaging in a mean of 198.3 minutes/day (approx. 3 hours and 18 minutes). Males engaged in
288.4 mean minutes/day (approx. 4 hours and 48 minutes), which was more than twice the 109.7 mean
minutes/day (approx. 1 hour and 49 minutes) engaged in by females. No significant age group
differences were observed.
Overall an average of 128.8 minutes (2 hours and 8 minutes) was spent on work-related physical
activity/day (193.2 minutes among males; 65.5 minutes among females). Respondents in age group 18-
29 years engaged in significantly less work-related physical activity compared to respondents in age
group 30-44 years. In contrast, an average of 49.6 minutes was spent on transport-related physical
activity/day (64 minutes among males; 35.5 minutes among females). Overall, respondents spent the
least quantity of time in leisure/recreation-related physical activity, spending an average of 19.9
minutes/day (31.2 minutes among males; 8.7 minutes among females). Age group 45-69 spent
significantly less time in leisure-related physical activity than age group 18-29 years.
Table 11 Mean minutes of types of physical activity on average per day by age group and sex
Age Group (years)
Sex n Total Work-related
Transport related
Recreation
18-29 M 292 252.3 142.4 61 48.9
F 458 96.3 49.5 35 11.8
30-44 M 481 344.5 255.5 68.9 20.1
F 691 121.6 77.8 35.7 8.1
45-69 M 763 274.2 197.2 62.3 14.7
F 789 117.4 76.7 36.3 4.3
18-69 M 1536 288.4 193.2 64.0 31.2
F 1938 109.7 65.5 35.5 8.7
M+F 3474 198.3 128.8 49.6 19.9
10.7 8.9
21
12.5
38.5 35.1 33.4 36.1
24.7 21.9 27.4 24.4
0
10
20
30
40
50
18-29 30-44 45-69 18-69
Pe
rcen
tage
M F M + F
35
Composition of total physical activity
Table 12 refers to the percentage of work-, transport-, and leisure-activity contributing to total physical
activity. Overall, the largest proportion of respondents (46.9%) spent their time on transport-related
physical activity (36.2% males; 58.9% males). The second largest group of respondents (38.7%) engaged
in work-related physical activity (47% males; 29.2%). Activity during leisure time (14.4%) comprised the
small proportion of respondents (16.6% males; 11.8% females). A significantly lower percentage of
respondents in age group 18-29 years (29.4%) compared to age group 30-44 years (47.6%) and 45-69
years (43.2%) reported engaging in activity for work compared to activity for transport (50.3%).
Table 12 Percent composition of total physical activity by age group and sex
Age Group (years)
Sex n Work Transport Leisure time
18-29 M 283 36.5 38.6 25
F 386 21.3 63.8 14.9
30-44 M 453 59.2 29.6 11.2
F 571 34.1 54.8 11.2
45-69 M 703 49.5 41.4 9.1
F 676 36.7 55.9 7.4
18-69 M 1439 47.0 36.2 16.7
F 1633 29.2 58.9 11.8
M+F 3072 38.7 46.9 14.4
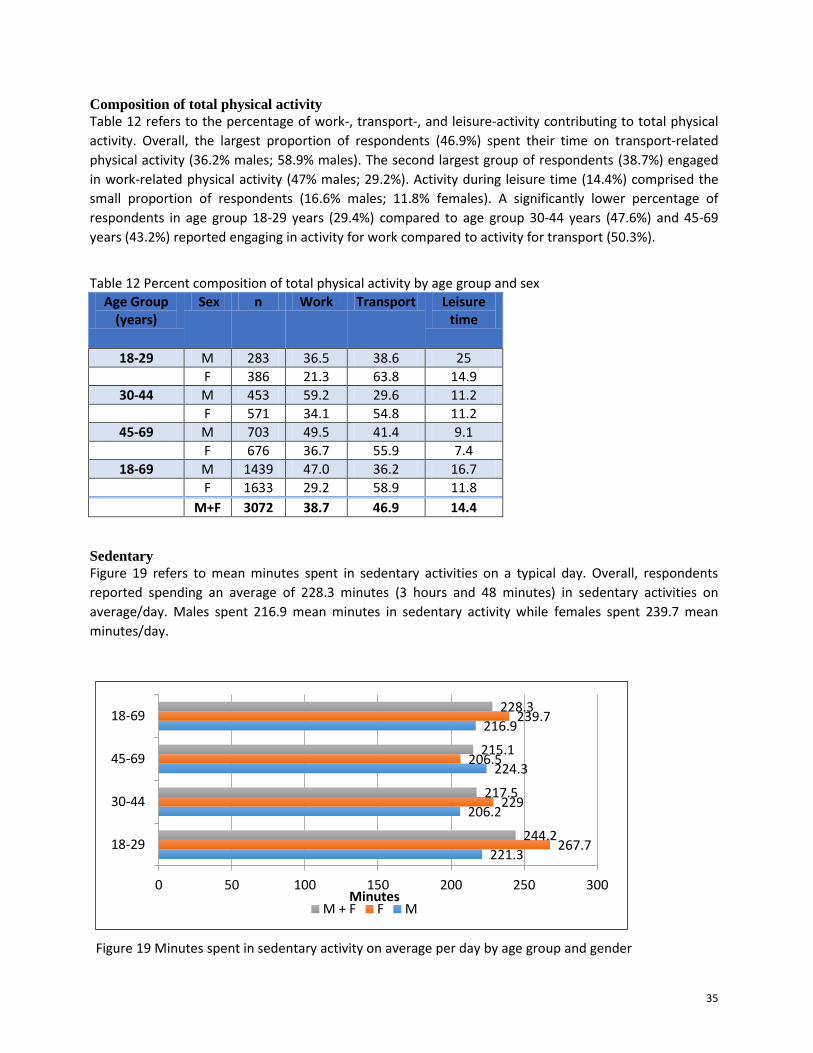
Sedentary
Figure 19 refers to mean minutes spent in sedentary activities on a typical day. Overall, respondents
reported spending an average of 228.3 minutes (3 hours and 48 minutes) in sedentary activities on
average/day. Males spent 216.9 mean minutes in sedentary activity while females spent 239.7 mean
minutes/day.
Figure 19 Minutes spent in sedentary activity on average per day by age group and gender
221.3
206.2
224.3
216.9
267.7
229
206.5
239.7
244.2
217.5
215.1
228.3
0 50 100 150 200 250 300
18-29
30-44
45-69
18-69
Minutes M + F F M
36
History of Raised Blood Pressure
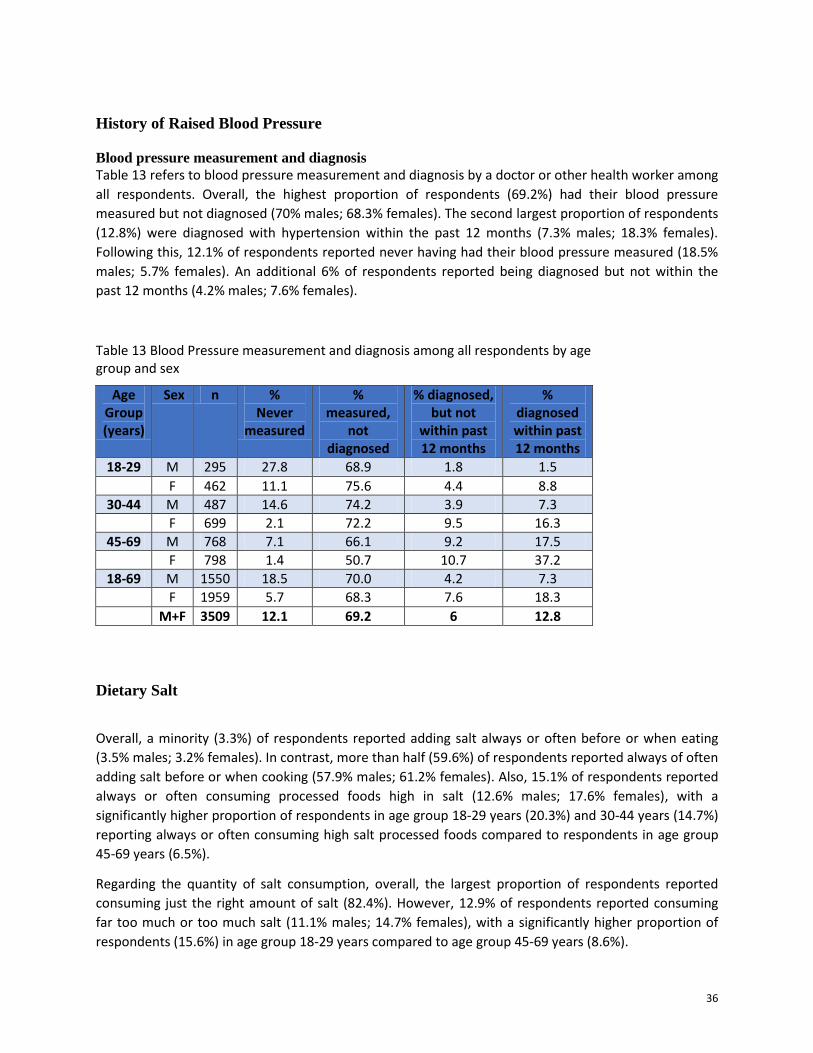
Blood pressure measurement and diagnosis
Table 13 refers to blood pressure measurement and diagnosis by a doctor or other health worker among
all respondents. Overall, the highest proportion of respondents (69.2%) had their blood pressure
measured but not diagnosed (70% males; 68.3% females). The second largest proportion of respondents
(12.8%) were diagnosed with hypertension within the past 12 months (7.3% males; 18.3% females).
Following this, 12.1% of respondents reported never having had their blood pressure measured (18.5%
males; 5.7% females). An additional 6% of respondents reported being diagnosed but not within the
past 12 months (4.2% males; 7.6% females).
Table 13 Blood Pressure measurement and diagnosis among all respondents by age group and sex
Age Group (years)
Sex n % Never
measured
% measured,
not diagnosed
% diagnosed, but not
within past 12 months
% diagnosed within past 12 months
18-29 M 295 27.8 68.9 1.8 1.5
F 462 11.1 75.6 4.4 8.8
30-44 M 487 14.6 74.2 3.9 7.3
F 699 2.1 72.2 9.5 16.3
45-69 M 768 7.1 66.1 9.2 17.5
F 798 1.4 50.7 10.7 37.2
18-69 M 1550 18.5 70.0 4.2 7.3
F 1959 5.7 68.3 7.6 18.3
M+F 3509 12.1 69.2 6 12.8
Dietary Salt
Overall, a minority (3.3%) of respondents reported adding salt always or often before or when eating
(3.5% males; 3.2% females). In contrast, more than half (59.6%) of respondents reported always of often
adding salt before or when cooking (57.9% males; 61.2% females). Also, 15.1% of respondents reported
always or often consuming processed foods high in salt (12.6% males; 17.6% females), with a
significantly higher proportion of respondents in age group 18-29 years (20.3%) and 30-44 years (14.7%)
reporting always or often consuming high salt processed foods compared to respondents in age group
45-69 years (6.5%).
Regarding the quantity of salt consumption, overall, the largest proportion of respondents reported
consuming just the right amount of salt (82.4%). However, 12.9% of respondents reported consuming
far too much or too much salt (11.1% males; 14.7% females), with a significantly higher proportion of
respondents (15.6%) in age group 18-29 years compared to age group 45-69 years (8.6%).
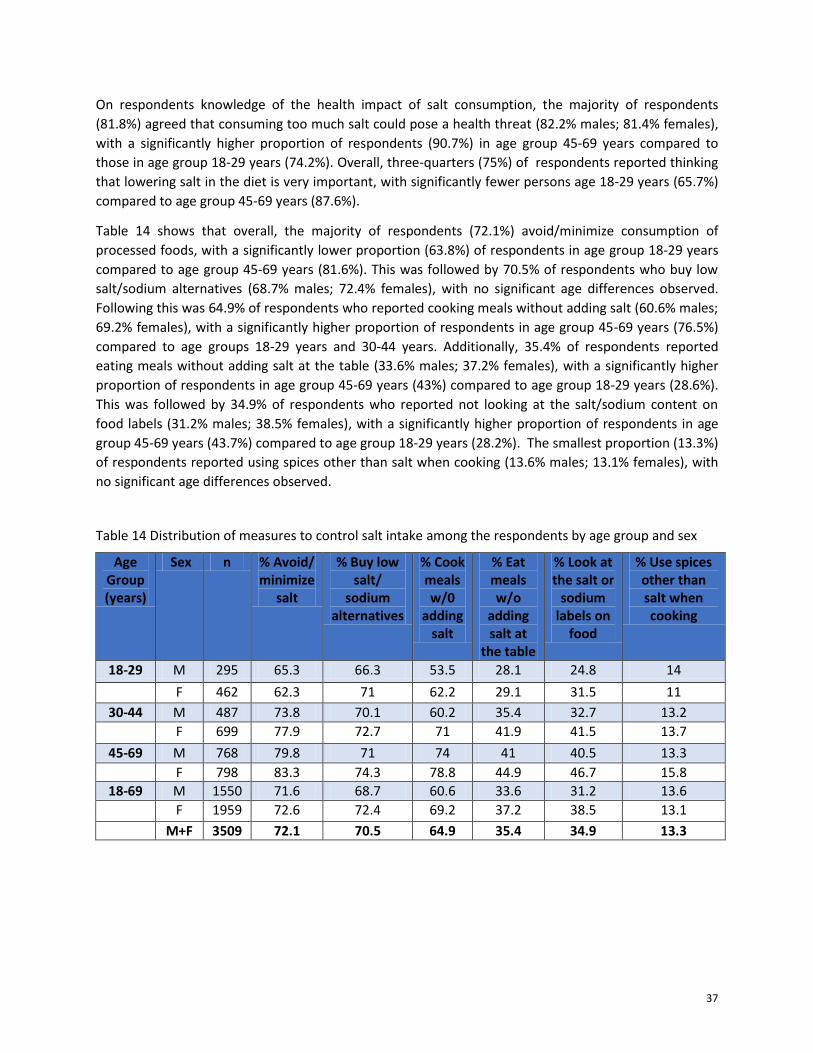
37
On respondents knowledge of the health impact of salt consumption, the majority of respondents
(81.8%) agreed that consuming too much salt could pose a health threat (82.2% males; 81.4% females),
with a significantly higher proportion of respondents (90.7%) in age group 45-69 years compared to
those in age group 18-29 years (74.2%). Overall, three-quarters (75%) of respondents reported thinking
that lowering salt in the diet is very important, with significantly fewer persons age 18-29 years (65.7%)
compared to age group 45-69 years (87.6%).
Table 14 shows that overall, the majority of respondents (72.1%) avoid/minimize consumption of
processed foods, with a significantly lower proportion (63.8%) of respondents in age group 18-29 years
compared to age group 45-69 years (81.6%). This was followed by 70.5% of respondents who buy low
salt/sodium alternatives (68.7% males; 72.4% females), with no significant age differences observed.
Following this was 64.9% of respondents who reported cooking meals without adding salt (60.6% males;
69.2% females), with a significantly higher proportion of respondents in age group 45-69 years (76.5%)
compared to age groups 18-29 years and 30-44 years. Additionally, 35.4% of respondents reported
eating meals without adding salt at the table (33.6% males; 37.2% females), with a significantly higher
proportion of respondents in age group 45-69 years (43%) compared to age group 18-29 years (28.6%).
This was followed by 34.9% of respondents who reported not looking at the salt/sodium content on
food labels (31.2% males; 38.5% females), with a significantly higher proportion of respondents in age
group 45-69 years (43.7%) compared to age group 18-29 years (28.2%). The smallest proportion (13.3%)
of respondents reported using spices other than salt when cooking (13.6% males; 13.1% females), with
no significant age differences observed.
Table 14 Distribution of measures to control salt intake among the respondents by age group and sex
Age Group (years)
Sex n % Avoid/ minimize
salt
% Buy low salt/
sodium alternatives
% Cook meals w/0
adding salt
% Eat meals w/o
adding salt at
the table
% Look at the salt or
sodium labels on
food
% Use spices other than salt when cooking
18-29 M 295 65.3 66.3 53.5 28.1 24.8 14
F 462 62.3 71 62.2 29.1 31.5 11
30-44 M 487 73.8 70.1 60.2 35.4 32.7 13.2
F 699 77.9 72.7 71 41.9 41.5 13.7
45-69 M 768 79.8 71 74 41 40.5 13.3
F 798 83.3 74.3 78.8 44.9 46.7 15.8
18-69 M 1550 71.6 68.7 60.6 33.6 31.2 13.6
F 1959 72.6 72.4 69.2 37.2 38.5 13.1
M+F 3509 72.1 70.5 64.9 35.4 34.9 13.3
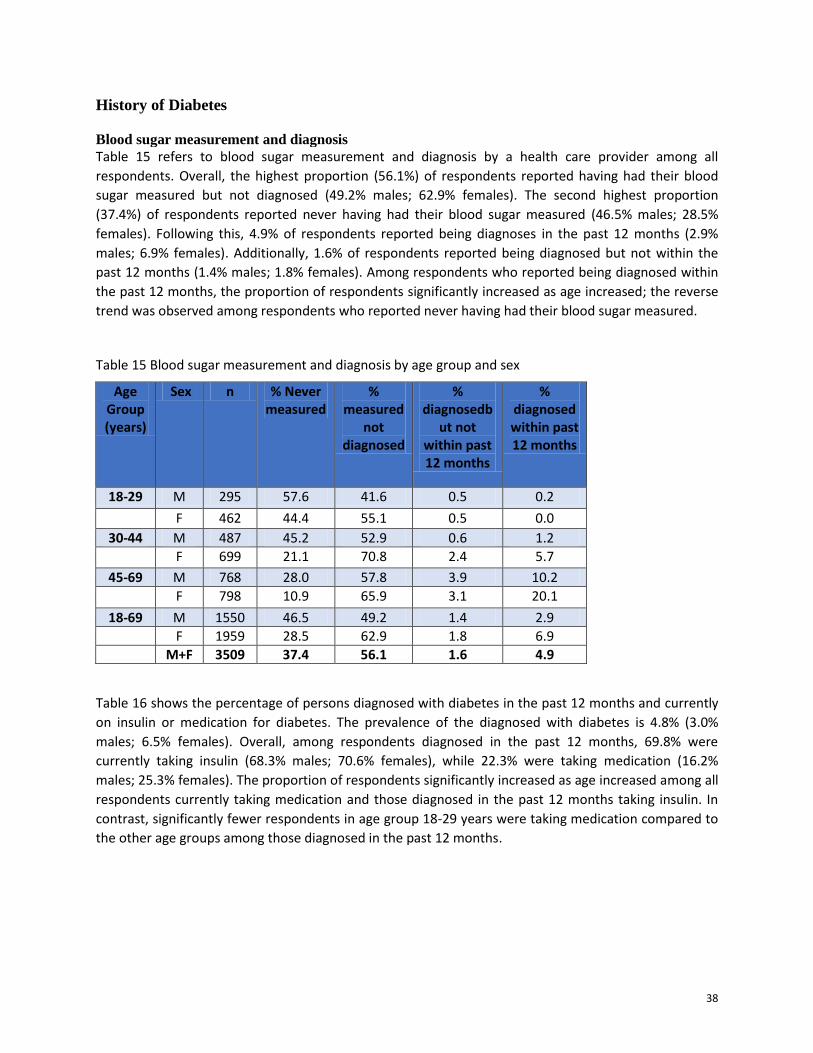
38
History of Diabetes
Blood sugar measurement and diagnosis
Table 15 refers to blood sugar measurement and diagnosis by a health care provider among all
respondents. Overall, the highest proportion (56.1%) of respondents reported having had their blood
sugar measured but not diagnosed (49.2% males; 62.9% females). The second highest proportion
(37.4%) of respondents reported never having had their blood sugar measured (46.5% males; 28.5%
females). Following this, 4.9% of respondents reported being diagnoses in the past 12 months (2.9%
males; 6.9% females). Additionally, 1.6% of respondents reported being diagnosed but not within the
past 12 months (1.4% males; 1.8% females). Among respondents who reported being diagnosed within
the past 12 months, the proportion of respondents significantly increased as age increased; the reverse
trend was observed among respondents who reported never having had their blood sugar measured.
Table 15 Blood sugar measurement and diagnosis by age group and sex
Age Group (years)
Sex n % Never measured
% measured
not diagnosed
% diagnosedb
ut not within past 12 months
% diagnosed within past 12 months
18-29 M 295 57.6 41.6 0.5 0.2
F 462 44.4 55.1 0.5 0.0
30-44 M 487 45.2 52.9 0.6 1.2
F 699 21.1 70.8 2.4 5.7
45-69 M 768 28.0 57.8 3.9 10.2
F 798 10.9 65.9 3.1 20.1
18-69 M 1550 46.5 49.2 1.4 2.9
F 1959 28.5 62.9 1.8 6.9
M+F 3509 37.4 56.1 1.6 4.9
Table 16 shows the percentage of persons diagnosed with diabetes in the past 12 months and currently
on insulin or medication for diabetes. The prevalence of the diagnosed with diabetes is 4.8% (3.0%
males; 6.5% females). Overall, among respondents diagnosed in the past 12 months, 69.8% were
currently taking insulin (68.3% males; 70.6% females), while 22.3% were taking medication (16.2%
males; 25.3% females). The proportion of respondents significantly increased as age increased among all
respondents currently taking medication and those diagnosed in the past 12 months taking insulin. In
contrast, significantly fewer respondents in age group 18-29 years were taking medication compared to
the other age groups among those diagnosed in the past 12 months.
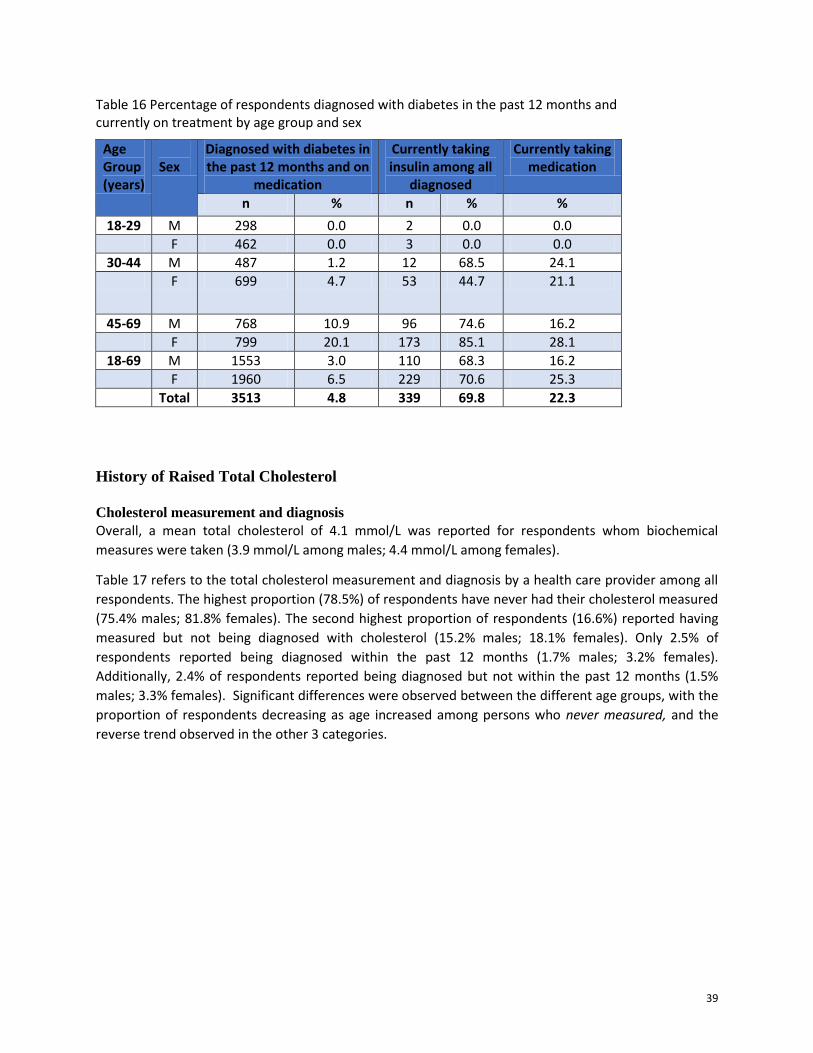
39
Table 16 Percentage of respondents diagnosed with diabetes in the past 12 months and currently on treatment by age group and sex
Age Group (years)
Sex
Diagnosed with diabetes in the past 12 months and on
medication
Currently taking insulin among all
diagnosed
Currently taking medication
n % n % %
18-29 M 298 0.0 2 0.0 0.0
F 462 0.0 3 0.0 0.0
30-44 M 487 1.2 12 68.5 24.1
F 699 4.7 53 44.7 21.1
45-69 M 768 10.9 96 74.6 16.2
F 799 20.1 173 85.1 28.1
18-69 M 1553 3.0 110 68.3 16.2
F 1960 6.5 229 70.6 25.3
Total 3513 4.8 339 69.8 22.3
History of Raised Total Cholesterol
Cholesterol measurement and diagnosis
Overall, a mean total cholesterol of 4.1 mmol/L was reported for respondents whom biochemical
measures were taken (3.9 mmol/L among males; 4.4 mmol/L among females).
Table 17 refers to the total cholesterol measurement and diagnosis by a health care provider among all
respondents. The highest proportion (78.5%) of respondents have never had their cholesterol measured
(75.4% males; 81.8% females). The second highest proportion of respondents (16.6%) reported having
measured but not being diagnosed with cholesterol (15.2% males; 18.1% females). Only 2.5% of
respondents reported being diagnosed within the past 12 months (1.7% males; 3.2% females).
Additionally, 2.4% of respondents reported being diagnosed but not within the past 12 months (1.5%
males; 3.3% females). Significant differences were observed between the different age groups, with the
proportion of respondents decreasing as age increased among persons who never measured, and the
reverse trend observed in the other 3 categories.
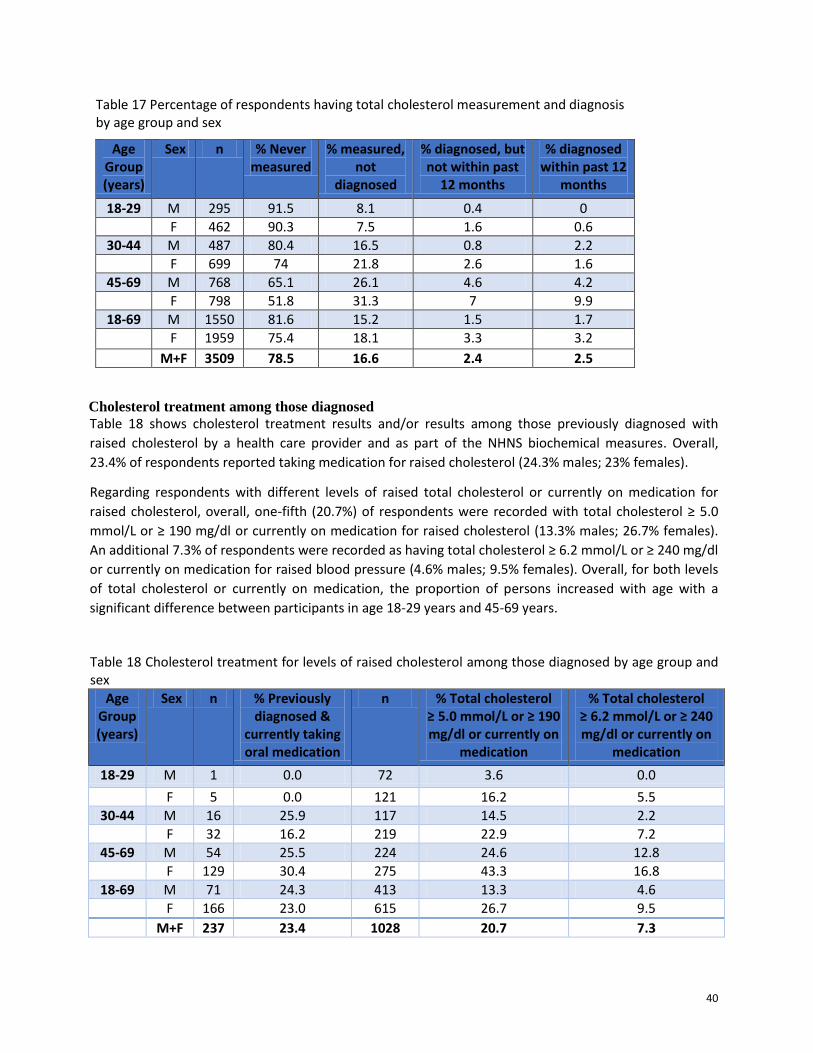
40
Table 17 Percentage of respondents having total cholesterol measurement and diagnosis by age group and sex
Age Group (years)
Sex n % Never measured
% measured, not
diagnosed
% diagnosed, but not within past
12 months
% diagnosed within past 12
months
18-29 M 295 91.5 8.1 0.4 0
F 462 90.3 7.5 1.6 0.6
30-44 M 487 80.4 16.5 0.8 2.2
F 699 74 21.8 2.6 1.6
45-69 M 768 65.1 26.1 4.6 4.2
F 798 51.8 31.3 7 9.9
18-69 M 1550 81.6 15.2 1.5 1.7
F 1959 75.4 18.1 3.3 3.2
M+F 3509 78.5 16.6 2.4 2.5
Cholesterol treatment among those diagnosed
Table 18 shows cholesterol treatment results and/or results among those previously diagnosed with
raised cholesterol by a health care provider and as part of the NHNS biochemical measures. Overall,
23.4% of respondents reported taking medication for raised cholesterol (24.3% males; 23% females).
Regarding respondents with different levels of raised total cholesterol or currently on medication for
raised cholesterol, overall, one-fifth (20.7%) of respondents were recorded with total cholesterol ≥ 5.0
mmol/L or ≥ 190 mg/dl or currently on medication for raised cholesterol (13.3% males; 26.7% females).
An additional 7.3% of respondents were recorded as having total cholesterol ≥ 6.2 mmol/L or ≥ 240 mg/dl
or currently on medication for raised blood pressure (4.6% males; 9.5% females). Overall, for both levels
of total cholesterol or currently on medication, the proportion of persons increased with age with a
significant difference between participants in age 18-29 years and 45-69 years.
Table 18 Cholesterol treatment for levels of raised cholesterol among those diagnosed by age group and sex
Age Group (years)
Sex n % Previously diagnosed &
currently taking oral medication
n % Total cholesterol ≥ 5.0 mmol/L or ≥ 190 mg/dl or currently on
medication
% Total cholesterol ≥ 6.2 mmol/L or ≥ 240 mg/dl or currently on
medication
18-29 M 1 0.0 72 3.6 0.0
F 5 0.0 121 16.2 5.5
30-44 M 16 25.9 117 14.5 2.2
F 32 16.2 219 22.9 7.2
45-69 M 54 25.5 224 24.6 12.8
F 129 30.4 275 43.3 16.8
18-69 M 71 24.3 413 13.3 4.6
F 166 23.0 615 26.7 9.5
M+F 237 23.4 1028 20.7 7.3
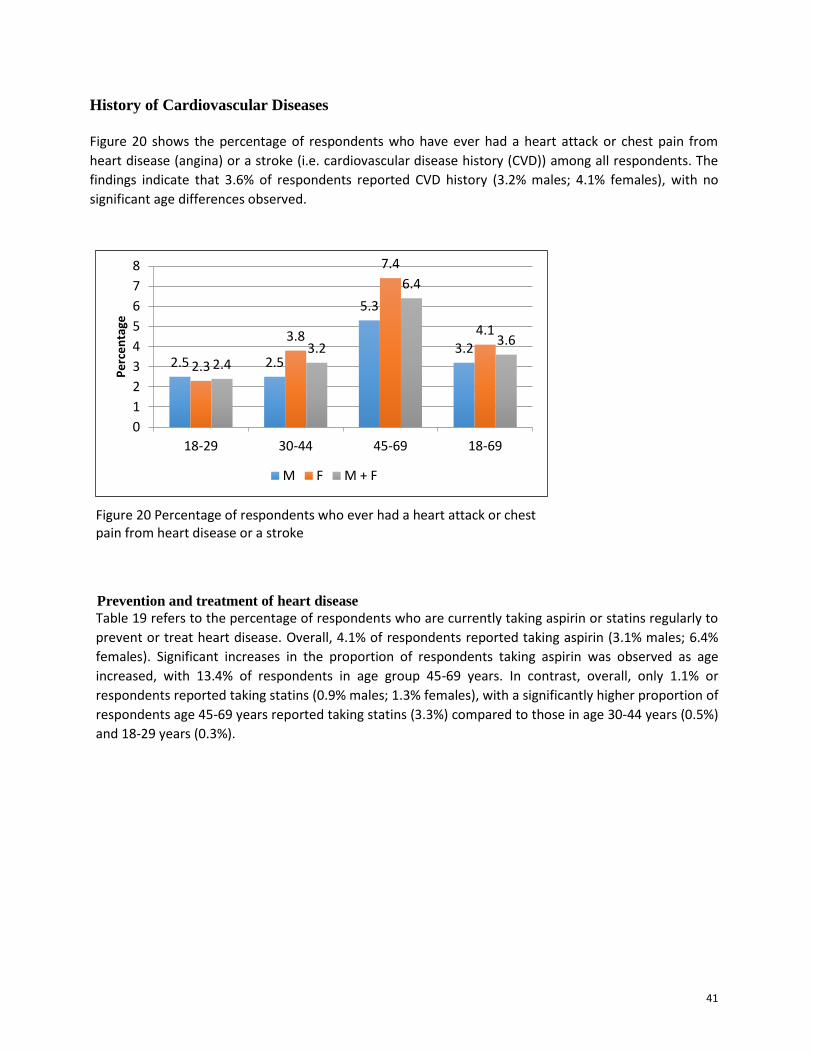
41
History of Cardiovascular Diseases
Figure 20 shows the percentage of respondents who have ever had a heart attack or chest pain from
heart disease (angina) or a stroke (i.e. cardiovascular disease history (CVD)) among all respondents. The
findings indicate that 3.6% of respondents reported CVD history (3.2% males; 4.1% females), with no
significant age differences observed.
Figure 20 Percentage of respondents who ever had a heart attack or chest pain from heart disease or a stroke
Prevention and treatment of heart disease
Table 19 refers to the percentage of respondents who are currently taking aspirin or statins regularly to
prevent or treat heart disease. Overall, 4.1% of respondents reported taking aspirin (3.1% males; 6.4%
females). Significant increases in the proportion of respondents taking aspirin was observed as age
increased, with 13.4% of respondents in age group 45-69 years. In contrast, overall, only 1.1% or
respondents reported taking statins (0.9% males; 1.3% females), with a significantly higher proportion of
respondents age 45-69 years reported taking statins (3.3%) compared to those in age 30-44 years (0.5%)
and 18-29 years (0.3%).
2.5 2.5
5.3
3.2 2.3
3.8
7.4
4.1
2.4 3.2
6.4
3.6
0
1
2
3
4
5
6
7
8
18-29 30-44 45-69 18-69
Pe
rce
nta
ge
M F M + F
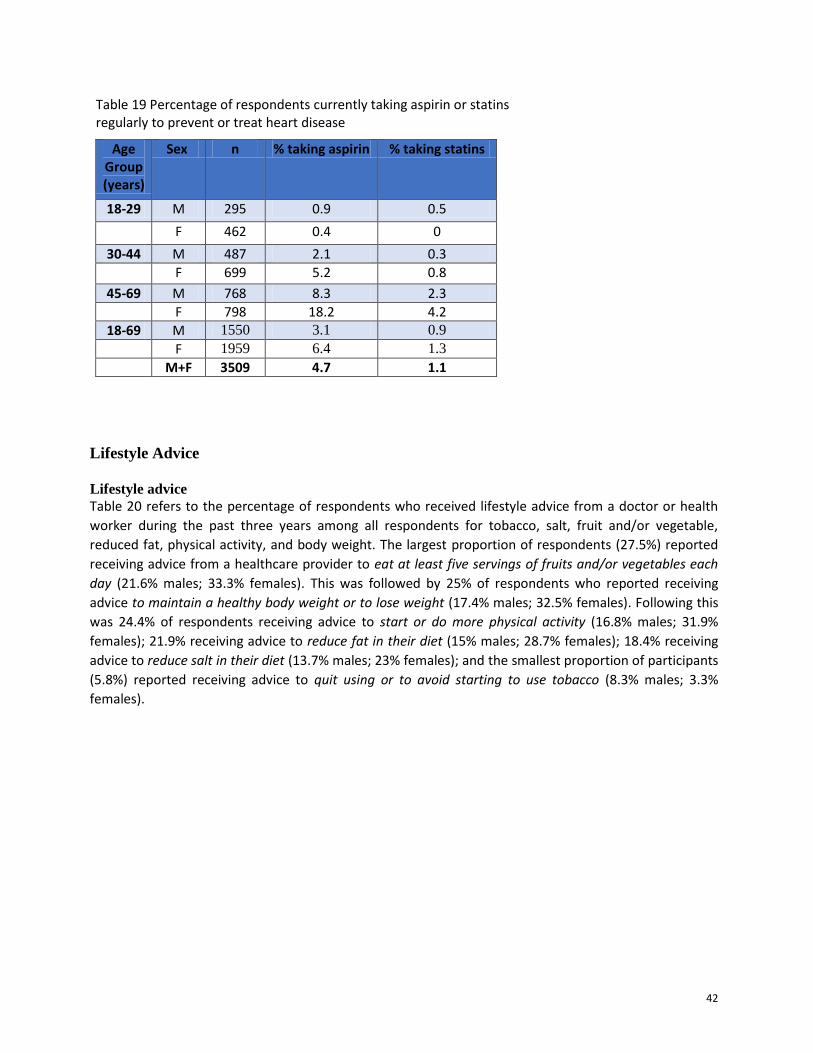
42
Table 19 Percentage of respondents currently taking aspirin or statins regularly to prevent or treat heart disease
Age Group (years)
Sex n % taking aspirin % taking statins
18-29 M 295 0.9 0.5
F 462 0.4 0
30-44 M 487 2.1 0.3
F 699 5.2 0.8
45-69 M 768 8.3 2.3
F 798 18.2 4.2
18-69 M 1550 3.1 0.9
F 1959 6.4 1.3
M+F 3509 4.7 1.1
Lifestyle Advice
Lifestyle advice
Table 20 refers to the percentage of respondents who received lifestyle advice from a doctor or health
worker during the past three years among all respondents for tobacco, salt, fruit and/or vegetable,
reduced fat, physical activity, and body weight. The largest proportion of respondents (27.5%) reported
receiving advice from a healthcare provider to eat at least five servings of fruits and/or vegetables each
day (21.6% males; 33.3% females). This was followed by 25% of respondents who reported receiving
advice to maintain a healthy body weight or to lose weight (17.4% males; 32.5% females). Following this
was 24.4% of respondents receiving advice to start or do more physical activity (16.8% males; 31.9%
females); 21.9% receiving advice to reduce fat in their diet (15% males; 28.7% females); 18.4% receiving
advice to reduce salt in their diet (13.7% males; 23% females); and the smallest proportion of participants
(5.8%) reported receiving advice to quit using or to avoid starting to use tobacco (8.3% males; 3.3%
females).
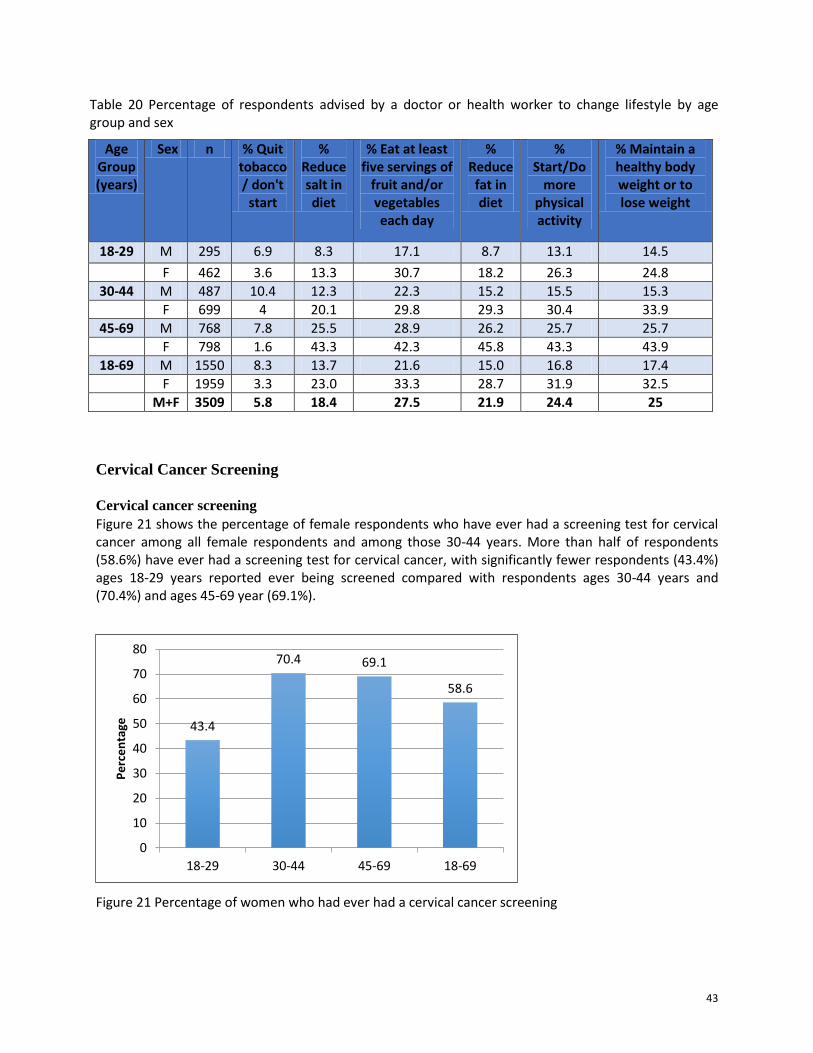
43
Table 20 Percentage of respondents advised by a doctor or health worker to change lifestyle by age group and sex
Age Group (years)
Sex n % Quit tobacco / don't
start
% Reduce salt in diet
% Eat at least five servings of
fruit and/or vegetables each day
% Reduce fat in diet
% Start/Do
more physical activity
% Maintain a healthy body weight or to lose weight
18-29 M 295 6.9 8.3 17.1 8.7 13.1 14.5
F 462 3.6 13.3 30.7 18.2 26.3 24.8
30-44 M 487 10.4 12.3 22.3 15.2 15.5 15.3
F 699 4 20.1 29.8 29.3 30.4 33.9
45-69 M 768 7.8 25.5 28.9 26.2 25.7 25.7
F 798 1.6 43.3 42.3 45.8 43.3 43.9
18-69 M 1550 8.3 13.7 21.6 15.0 16.8 17.4
F 1959 3.3 23.0 33.3 28.7 31.9 32.5
M+F 3509 5.8 18.4 27.5 21.9 24.4 25
Cervical Cancer Screening
Cervical cancer screening Figure 21 shows the percentage of female respondents who have ever had a screening test for cervical cancer among all female respondents and among those 30-44 years. More than half of respondents (58.6%) have ever had a screening test for cervical cancer, with significantly fewer respondents (43.4%) ages 18-29 years reported ever being screened compared with respondents ages 30-44 years and (70.4%) and ages 45-69 year (69.1%).
Figure 21 Percentage of women who had ever had a cervical cancer screening
43.4
70.4 69.1
58.6
0
10
20
30
40
50
60
70
80
18-29 30-44 45-69 18-69
Pe
rce
nta
ge
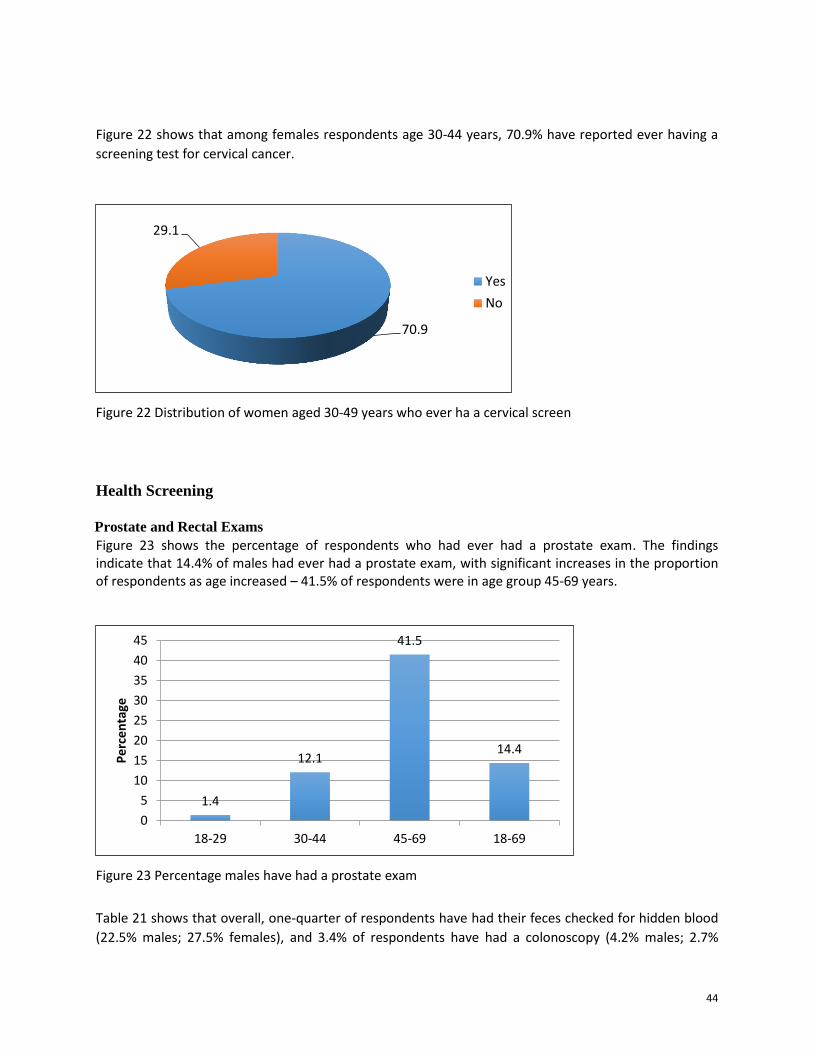
44
Figure 22 shows that among females respondents age 30-44 years, 70.9% have reported ever having a
screening test for cervical cancer.
Figure 22 Distribution of women aged 30-49 years who ever ha a cervical screen
Health Screening
Figure 23 shows the percentage of respondents who had ever had a prostate exam. The findings indicate that 14.4% of males had ever had a prostate exam, with significant increases in the proportion of respondents as age increased – 41.5% of respondents were in age group 45-69 years.
Figure 23 Percentage males have had a prostate exam
Table 21 shows that overall, one-quarter of respondents have had their feces checked for hidden blood
(22.5% males; 27.5% females), and 3.4% of respondents have had a colonoscopy (4.2% males; 2.7%
70.9
29.1
Yes
No
1.4
12.1
41.5
14.4
0
5
10
15
20
25
30
35
40
45
18-29 30-44 45-69 18-69
Pe
rce
nta
ge
Prostate and Rectal Exams
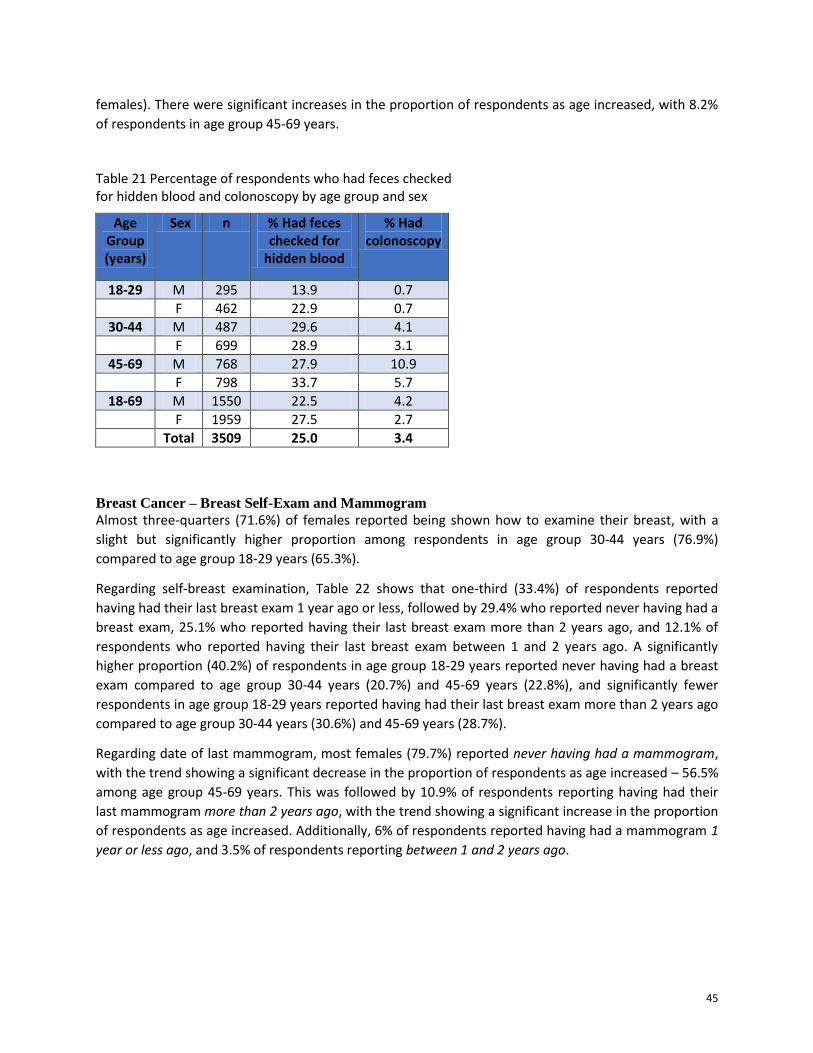
45
females). There were significant increases in the proportion of respondents as age increased, with 8.2%
of respondents in age group 45-69 years.
Table 21 Percentage of respondents who had feces checked for hidden blood and colonoscopy by age group and sex
Age Group (years)
Sex n % Had feces checked for
hidden blood
% Had colonoscopy
18-29 M 295 13.9 0.7
F 462 22.9 0.7
30-44 M 487 29.6 4.1
F 699 28.9 3.1
45-69 M 768 27.9 10.9
F 798 33.7 5.7
18-69 M 1550 22.5 4.2
F 1959 27.5 2.7
Total 3509 25.0 3.4
Breast Cancer – Breast Self-Exam and Mammogram
Almost three-quarters (71.6%) of females reported being shown how to examine their breast, with a
slight but significantly higher proportion among respondents in age group 30-44 years (76.9%)
compared to age group 18-29 years (65.3%).
Regarding self-breast examination, Table 22 shows that one-third (33.4%) of respondents reported
having had their last breast exam 1 year ago or less, followed by 29.4% who reported never having had a
breast exam, 25.1% who reported having their last breast exam more than 2 years ago, and 12.1% of
respondents who reported having their last breast exam between 1 and 2 years ago. A significantly
higher proportion (40.2%) of respondents in age group 18-29 years reported never having had a breast
exam compared to age group 30-44 years (20.7%) and 45-69 years (22.8%), and significantly fewer
respondents in age group 18-29 years reported having had their last breast exam more than 2 years ago
compared to age group 30-44 years (30.6%) and 45-69 years (28.7%).
Regarding date of last mammogram, most females (79.7%) reported never having had a mammogram,
with the trend showing a significant decrease in the proportion of respondents as age increased – 56.5%
among age group 45-69 years. This was followed by 10.9% of respondents reporting having had their
last mammogram more than 2 years ago, with the trend showing a significant increase in the proportion
of respondents as age increased. Additionally, 6% of respondents reported having had a mammogram 1
year or less ago, and 3.5% of respondents reporting between 1 and 2 years ago.
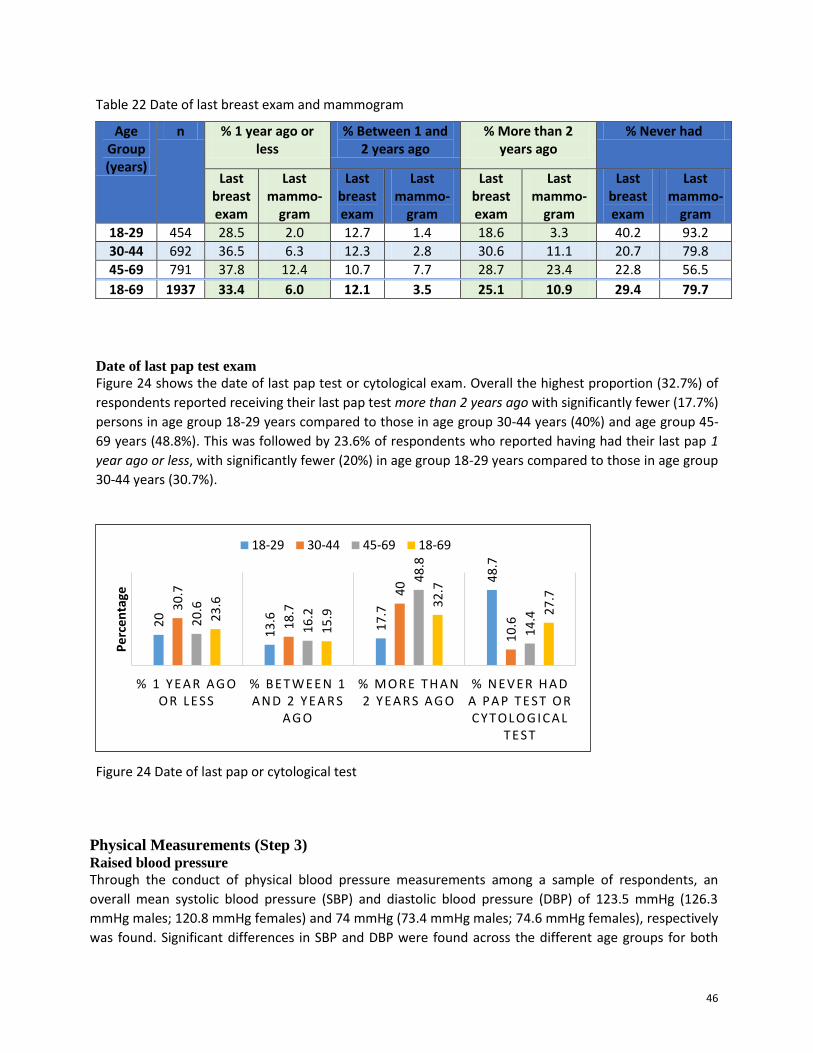
46
Table 22 Date of last breast exam and mammogram
Age Group (years)
n % 1 year ago or less
% Between 1 and 2 years ago
% More than 2 years ago
% Never had
Last breast exam
Last mammo-
gram
Last breast exam
Last mammo-
gram
Last breast exam
Last mammo-
gram
Last breast exam
Last mammo-
gram
18-29 454 28.5 2.0 12.7 1.4 18.6 3.3 40.2 93.2
30-44 692 36.5 6.3 12.3 2.8 30.6 11.1 20.7 79.8
45-69 791 37.8 12.4 10.7 7.7 28.7 23.4 22.8 56.5
18-69 1937 33.4 6.0 12.1 3.5 25.1 10.9 29.4 79.7
Date of last pap test exam
Figure 24 shows the date of last pap test or cytological exam. Overall the highest proportion (32.7%) of
respondents reported receiving their last pap test more than 2 years ago with significantly fewer (17.7%)
persons in age group 18-29 years compared to those in age group 30-44 years (40%) and age group 45-
69 years (48.8%). This was followed by 23.6% of respondents who reported having had their last pap 1
year ago or less, with significantly fewer (20%) in age group 18-29 years compared to those in age group
30-44 years (30.7%).
Figure 24 Date of last pap or cytological test
Physical Measurements (Step 3) Raised blood pressure
Through the conduct of physical blood pressure measurements among a sample of respondents, an
overall mean systolic blood pressure (SBP) and diastolic blood pressure (DBP) of 123.5 mmHg (126.3
mmHg males; 120.8 mmHg females) and 74 mmHg (73.4 mmHg males; 74.6 mmHg females), respectively
was found. Significant differences in SBP and DBP were found across the different age groups for both
20
13
.6
17
.7
48
.7
30
.7
18
.7
40
10
.6
20
.6
16
.2
48
.8
14
.4
23
.6
15
.9 3
2.7
27
.7
% 1 Y EAR AG O OR LESS
% B ET WEEN 1 AN D 2 Y EAR S
AG O
% MOR E T H AN 2 Y EAR S AG O
% N EV ER H AD A PAP T EST OR C Y T OLOG IC AL
T EST
Pe
rce
nta
ge
18-29 30-44 45-69 18-69
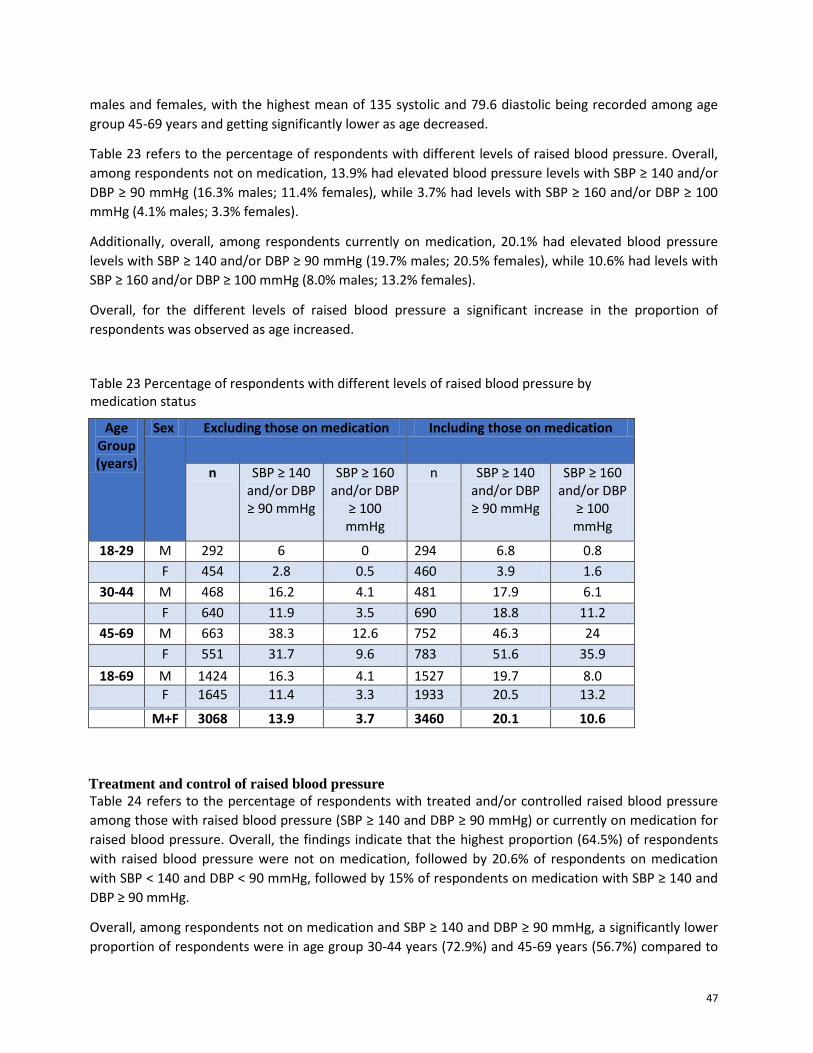
47
males and females, with the highest mean of 135 systolic and 79.6 diastolic being recorded among age
group 45-69 years and getting significantly lower as age decreased.
Table 23 refers to the percentage of respondents with different levels of raised blood pressure. Overall,
among respondents not on medication, 13.9% had elevated blood pressure levels with SBP ≥ 140 and/or
DBP ≥ 90 mmHg (16.3% males; 11.4% females), while 3.7% had levels with SBP ≥ 160 and/or DBP ≥ 100
mmHg (4.1% males; 3.3% females).
Additionally, overall, among respondents currently on medication, 20.1% had elevated blood pressure
levels with SBP ≥ 140 and/or DBP ≥ 90 mmHg (19.7% males; 20.5% females), while 10.6% had levels with
SBP ≥ 160 and/or DBP ≥ 100 mmHg (8.0% males; 13.2% females).
Overall, for the different levels of raised blood pressure a significant increase in the proportion of
respondents was observed as age increased.
Table 23 Percentage of respondents with different levels of raised blood pressure by medication status
Age Group (years)
Sex Excluding those on medication Including those on medication
n SBP ≥ 140 and/or DBP ≥ 90 mmHg
SBP ≥ 160 and/or DBP
≥ 100 mmHg
n SBP ≥ 140 and/or DBP ≥ 90 mmHg
SBP ≥ 160 and/or DBP
≥ 100 mmHg
18-29 M 292 6 0 294 6.8 0.8
F 454 2.8 0.5 460 3.9 1.6
30-44 M 468 16.2 4.1 481 17.9 6.1
F 640 11.9 3.5 690 18.8 11.2
45-69 M 663 38.3 12.6 752 46.3 24
F 551 31.7 9.6 783 51.6 35.9
18-69 M 1424 16.3 4.1 1527 19.7 8.0
F 1645 11.4 3.3 1933 20.5 13.2
M+F 3068 13.9 3.7 3460 20.1 10.6
Treatment and control of raised blood pressure
Table 24 refers to the percentage of respondents with treated and/or controlled raised blood pressure
among those with raised blood pressure (SBP ≥ 140 and DBP ≥ 90 mmHg) or currently on medication for
raised blood pressure. Overall, the findings indicate that the highest proportion (64.5%) of respondents
with raised blood pressure were not on medication, followed by 20.6% of respondents on medication
with SBP ˂ 140 and DBP ˂ 90 mmHg, followed by 15% of respondents on medication with SBP ≥ 140 and
DBP ≥ 90 mmHg.
Overall, among respondents not on medication and SBP ≥ 140 and DBP ≥ 90 mmHg, a significantly lower
proportion of respondents were in age group 30-44 years (72.9%) and 45-69 years (56.7%) compared to
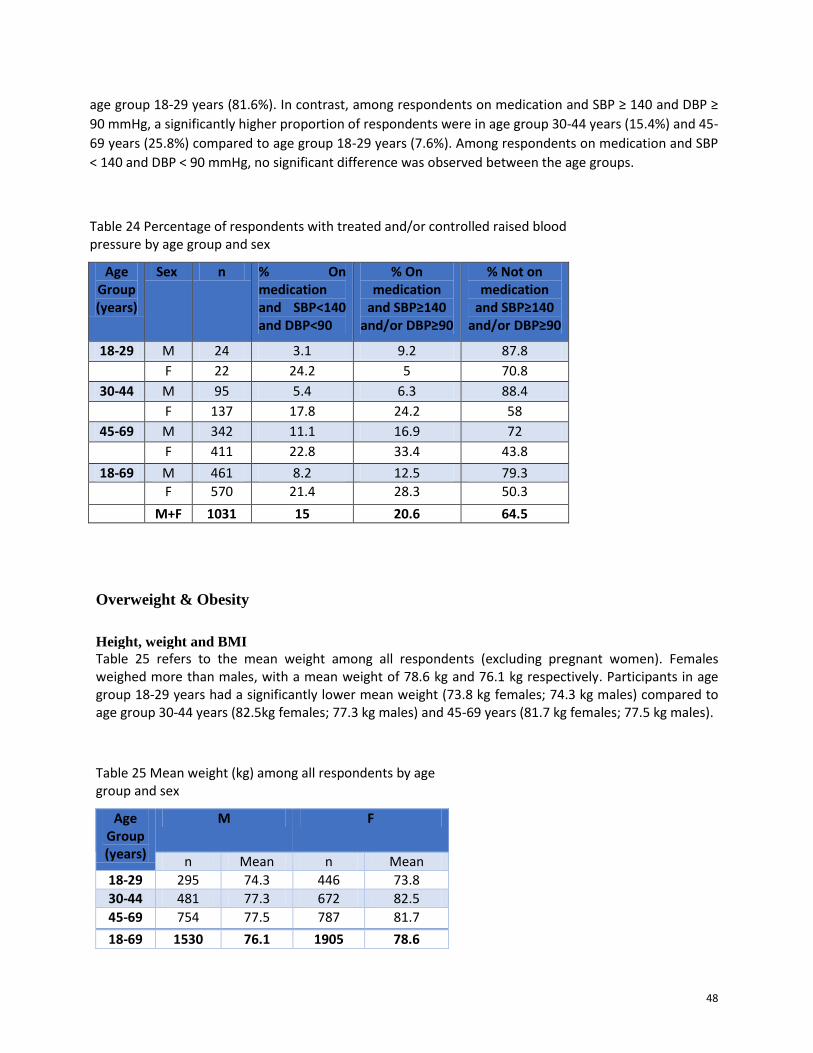
48
age group 18-29 years (81.6%). In contrast, among respondents on medication and SBP ≥ 140 and DBP ≥
90 mmHg, a significantly higher proportion of respondents were in age group 30-44 years (15.4%) and 45-
69 years (25.8%) compared to age group 18-29 years (7.6%). Among respondents on medication and SBP
˂ 140 and DBP ˂ 90 mmHg, no significant difference was observed between the age groups.
Table 24 Percentage of respondents with treated and/or controlled raised blood pressure by age group and sex
Age Group (years)
Sex n % On medication and SBP<140 and DBP<90
% On medication
and SBP≥140 and/or DBP≥90
% Not on medication
and SBP≥140 and/or DBP≥90
18-29 M 24 3.1 9.2 87.8
F 22 24.2 5 70.8
30-44 M 95 5.4 6.3 88.4
F 137 17.8 24.2 58
45-69 M 342 11.1 16.9 72
F 411 22.8 33.4 43.8
18-69 M 461 8.2 12.5 79.3
F 570 21.4 28.3 50.3
M+F 1031 15 20.6 64.5
Overweight & Obesity
Height, weight and BMI
Table 25 refers to the mean weight among all respondents (excluding pregnant women). Females weighed more than males, with a mean weight of 78.6 kg and 76.1 kg respectively. Participants in age group 18-29 years had a significantly lower mean weight (73.8 kg females; 74.3 kg males) compared to age group 30-44 years (82.5kg females; 77.3 kg males) and 45-69 years (81.7 kg females; 77.5 kg males).
Table 25 Mean weight (kg) among all respondents by age group and sex
Age Group (years)
M F
n Mean n Mean
18-29 295 74.3 446 73.8
30-44 481 77.3 672 82.5
45-69 754 77.5 787 81.7
18-69 1530 76.1 1905 78.6
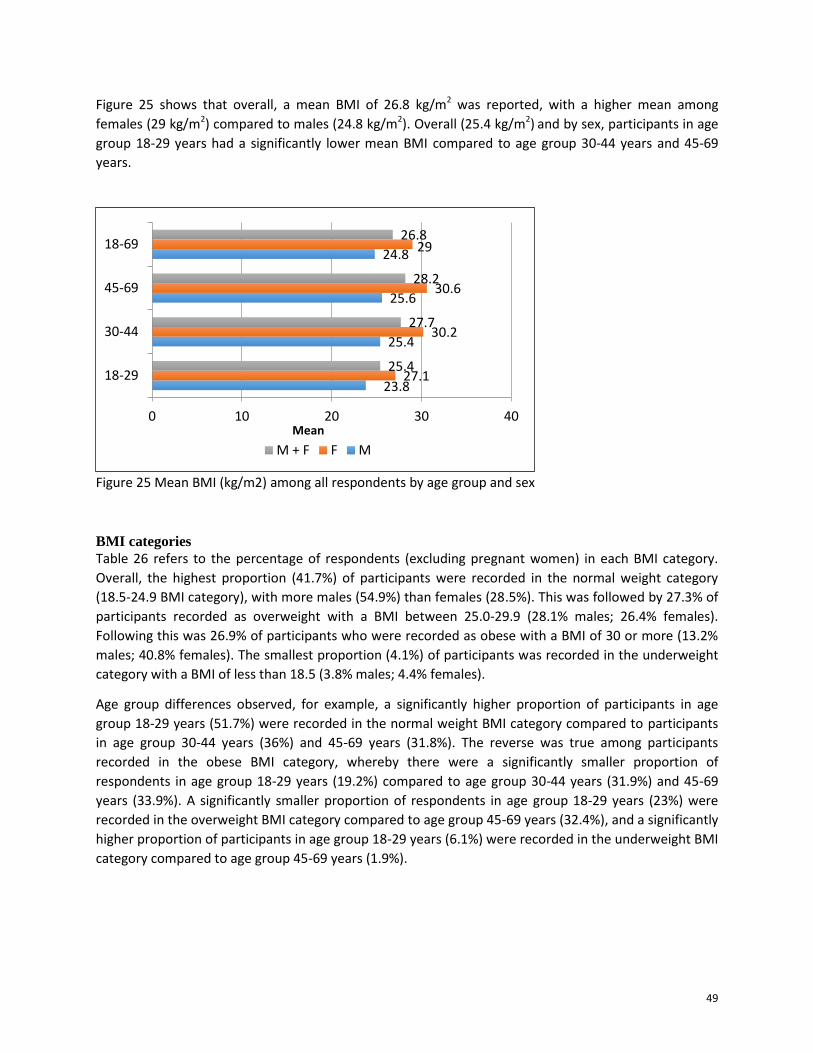
49
Figure 25 shows that overall, a mean BMI of 26.8 kg/m2 was reported, with a higher mean among
females (29 kg/m2) compared to males (24.8 kg/m2). Overall (25.4 kg/m2) and by sex, participants in age
group 18-29 years had a significantly lower mean BMI compared to age group 30-44 years and 45-69
years.
Figure 25 Mean BMI (kg/m2) among all respondents by age group and sex
BMI categories
Table 26 refers to the percentage of respondents (excluding pregnant women) in each BMI category.
Overall, the highest proportion (41.7%) of participants were recorded in the normal weight category
(18.5-24.9 BMI category), with more males (54.9%) than females (28.5%). This was followed by 27.3% of
participants recorded as overweight with a BMI between 25.0-29.9 (28.1% males; 26.4% females).
Following this was 26.9% of participants who were recorded as obese with a BMI of 30 or more (13.2%
males; 40.8% females). The smallest proportion (4.1%) of participants was recorded in the underweight
category with a BMI of less than 18.5 (3.8% males; 4.4% females).
Age group differences observed, for example, a significantly higher proportion of participants in age
group 18-29 years (51.7%) were recorded in the normal weight BMI category compared to participants
in age group 30-44 years (36%) and 45-69 years (31.8%). The reverse was true among participants
recorded in the obese BMI category, whereby there were a significantly smaller proportion of
respondents in age group 18-29 years (19.2%) compared to age group 30-44 years (31.9%) and 45-69
years (33.9%). A significantly smaller proportion of respondents in age group 18-29 years (23%) were
recorded in the overweight BMI category compared to age group 45-69 years (32.4%), and a significantly
higher proportion of participants in age group 18-29 years (6.1%) were recorded in the underweight BMI
category compared to age group 45-69 years (1.9%).
23.8
25.4
25.6
24.8
27.1
30.2
30.6
29
25.4
27.7
28.2
26.8
0 10 20 30 40
18-29
30-44
45-69
18-69
Mean
M + F F M
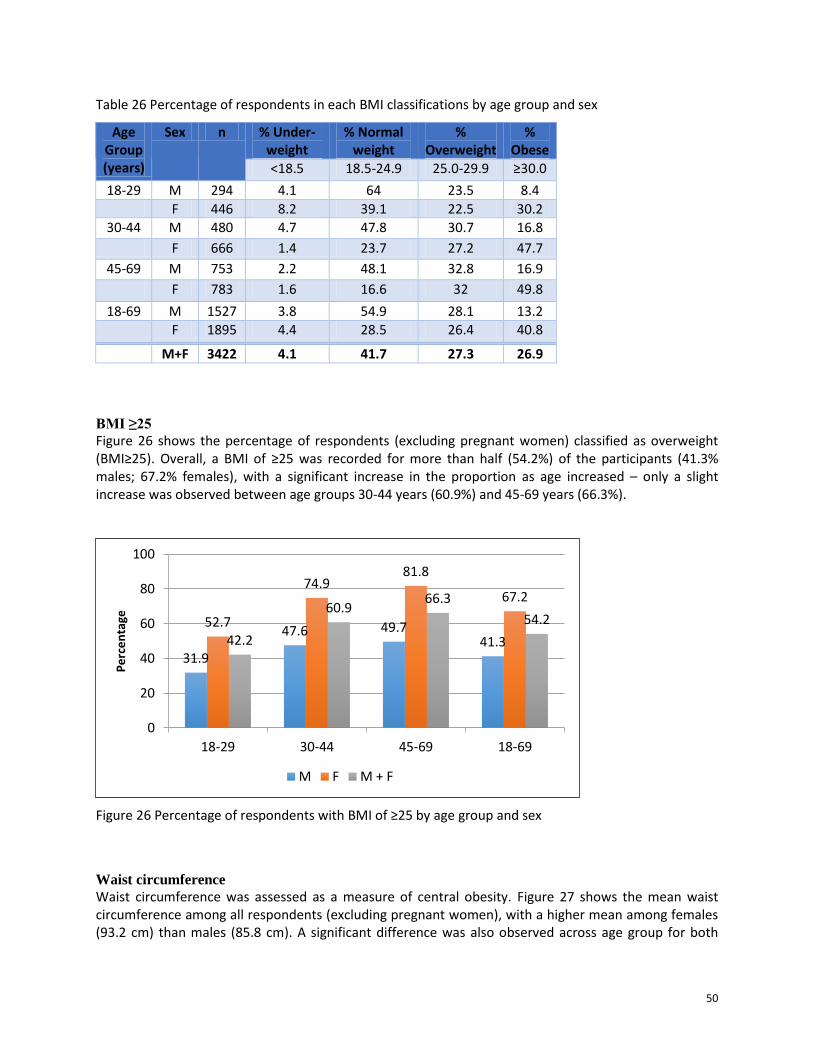
50
Table 26 Percentage of respondents in each BMI classifications by age group and sex
Age Group (years)
Sex n % Under-weight
% Normal weight
% Overweight
% Obese
<18.5 18.5-24.9 25.0-29.9 ≥30.0
18-29 M 294 4.1 64 23.5 8.4
F 446 8.2 39.1 22.5 30.2
30-44 M 480 4.7 47.8 30.7 16.8
F 666 1.4 23.7 27.2 47.7
45-69 M 753 2.2 48.1 32.8 16.9
F 783 1.6 16.6 32 49.8
18-69 M 1527 3.8 54.9 28.1 13.2
F 1895 4.4 28.5 26.4 40.8
M+F 3422 4.1 41.7 27.3 26.9
BMI ≥25
Figure 26 shows the percentage of respondents (excluding pregnant women) classified as overweight (BMI≥25). Overall, a BMI of ≥25 was recorded for more than half (54.2%) of the participants (41.3% males; 67.2% females), with a significant increase in the proportion as age increased – only a slight increase was observed between age groups 30-44 years (60.9%) and 45-69 years (66.3%).
Figure 26 Percentage of respondents with BMI of ≥25 by age group and sex
Waist circumference
Waist circumference was assessed as a measure of central obesity. Figure 27 shows the mean waist circumference among all respondents (excluding pregnant women), with a higher mean among females (93.2 cm) than males (85.8 cm). A significant difference was also observed across age group for both
31.9
47.6 49.7 41.3
52.7
74.9 81.8
67.2
42.2
60.9 66.3
54.2
0
20
40
60
80
100
18-29 30-44 45-69 18-69
Pe
rce
nta
ge
M F M + F
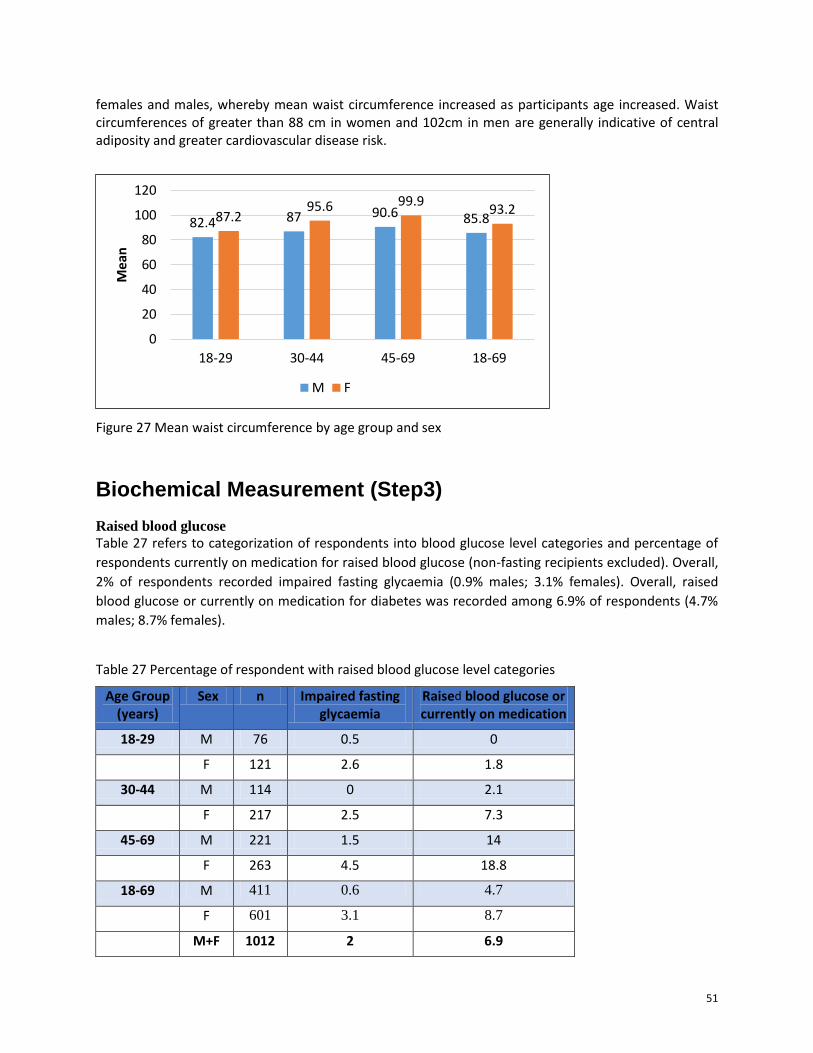
51
females and males, whereby mean waist circumference increased as participants age increased. Waist circumferences of greater than 88 cm in women and 102cm in men are generally indicative of central adiposity and greater cardiovascular disease risk.
Figure 27 Mean waist circumference by age group and sex
Biochemical Measurement (Step3)
Raised blood glucose
Table 27 refers to categorization of respondents into blood glucose level categories and percentage of
respondents currently on medication for raised blood glucose (non-fasting recipients excluded). Overall,
2% of respondents recorded impaired fasting glycaemia (0.9% males; 3.1% females). Overall, raised
blood glucose or currently on medication for diabetes was recorded among 6.9% of respondents (4.7%
males; 8.7% females).
Table 27 Percentage of respondent with raised blood glucose level categories
Age Group (years)
Sex n Impaired fasting glycaemia
Raised blood glucose or currently on medication
18-29 M 76 0.5 0
F 121 2.6 1.8
30-44 M 114 0 2.1
F 217 2.5 7.3
45-69 M 221 1.5 14
F 263 4.5 18.8
18-69 M 411 0.6 4.7
F 601 3.1 8.7
M+F 1012 2 6.9
82.4 87 90.6 85.8 87.2 95.6 99.9
93.2
0
20
40
60
80
100
120
18-29 30-44 45-69 18-69
Mea
n
M F
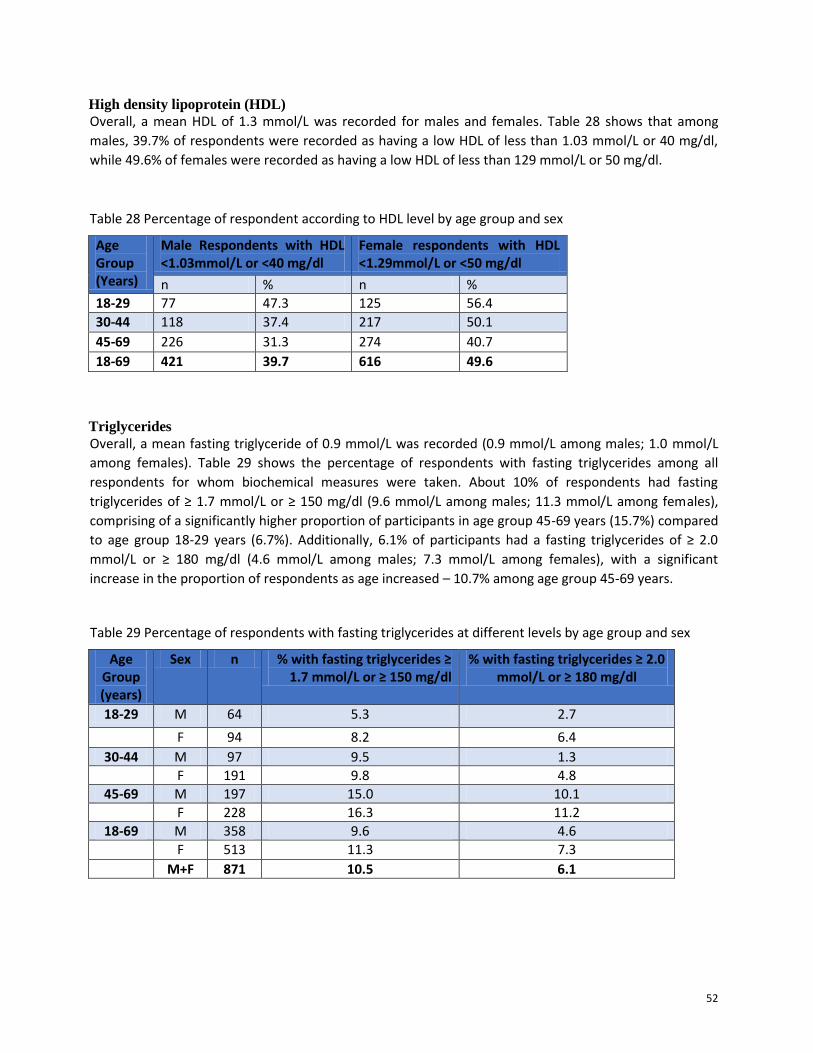
52
High density lipoprotein (HDL)
Overall, a mean HDL of 1.3 mmol/L was recorded for males and females. Table 28 shows that among
males, 39.7% of respondents were recorded as having a low HDL of less than 1.03 mmol/L or 40 mg/dl,
while 49.6% of females were recorded as having a low HDL of less than 129 mmol/L or 50 mg/dl.
Table 28 Percentage of respondent according to HDL level by age group and sex
Age Group (Years)
Male Respondents with HDL <1.03mmol/L or <40 mg/dl
Female respondents with HDL <1.29mmol/L or <50 mg/dl
n % n %
18-29 77 47.3 125 56.4
30-44 118 37.4 217 50.1
45-69 226 31.3 274 40.7
18-69 421 39.7 616 49.6
Triglycerides
Overall, a mean fasting triglyceride of 0.9 mmol/L was recorded (0.9 mmol/L among males; 1.0 mmol/L
among females). Table 29 shows the percentage of respondents with fasting triglycerides among all
respondents for whom biochemical measures were taken. About 10% of respondents had fasting
triglycerides of ≥ 1.7 mmol/L or ≥ 150 mg/dl (9.6 mmol/L among males; 11.3 mmol/L among females),
comprising of a significantly higher proportion of participants in age group 45-69 years (15.7%) compared
to age group 18-29 years (6.7%). Additionally, 6.1% of participants had a fasting triglycerides of ≥ 2.0
mmol/L or ≥ 180 mg/dl (4.6 mmol/L among males; 7.3 mmol/L among females), with a significant
increase in the proportion of respondents as age increased – 10.7% among age group 45-69 years.
Table 29 Percentage of respondents with fasting triglycerides at different levels by age group and sex
Age Group (years)
Sex n % with fasting triglycerides ≥ 1.7 mmol/L or ≥ 150 mg/dl
% with fasting triglycerides ≥ 2.0 mmol/L or ≥ 180 mg/dl
18-29 M 64 5.3 2.7
F 94 8.2 6.4
30-44 M 97 9.5 1.3
F 191 9.8 4.8
45-69 M 197 15.0 10.1
F 228 16.3 11.2
18-69 M 358 9.6 4.6
F 513 11.3 7.3
M+F 871 10.5 6.1
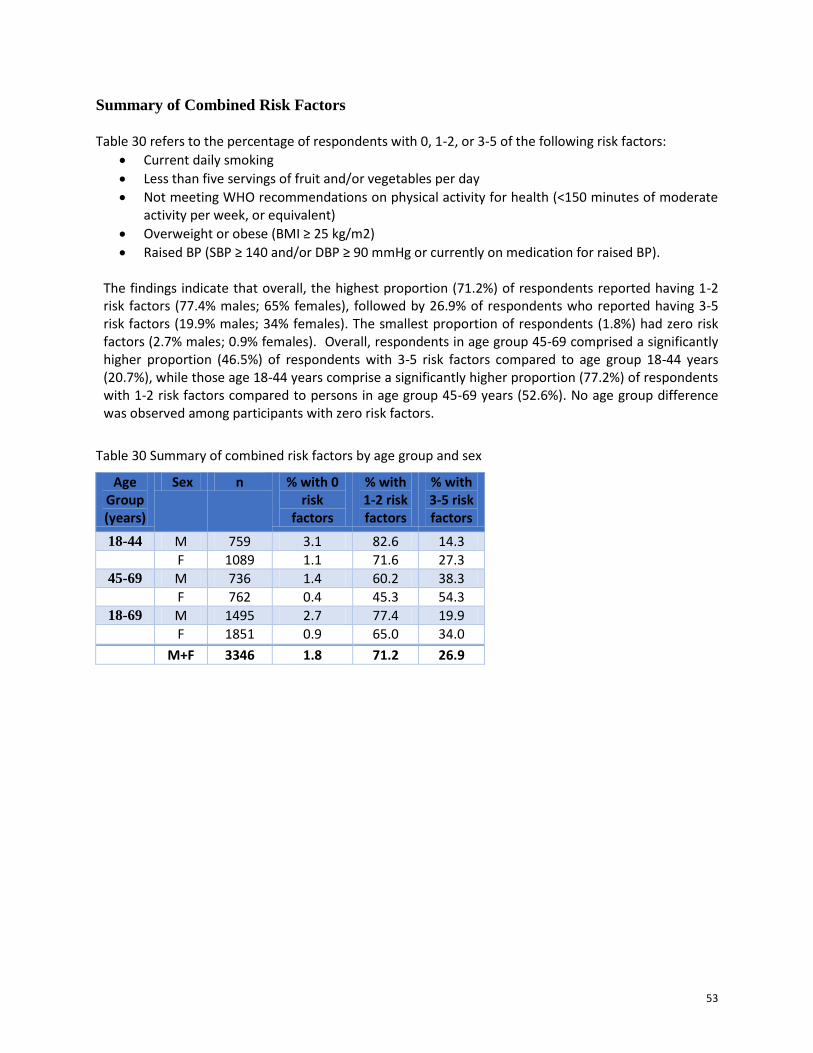
53
Summary of Combined Risk Factors
Table 30 refers to the percentage of respondents with 0, 1-2, or 3-5 of the following risk factors:
Current daily smoking
Less than five servings of fruit and/or vegetables per day
Not meeting WHO recommendations on physical activity for health (<150 minutes of moderate activity per week, or equivalent)
Overweight or obese (BMI ≥ 25 kg/m2)
Raised BP (SBP ≥ 140 and/or DBP ≥ 90 mmHg or currently on medication for raised BP). The findings indicate that overall, the highest proportion (71.2%) of respondents reported having 1-2 risk factors (77.4% males; 65% females), followed by 26.9% of respondents who reported having 3-5 risk factors (19.9% males; 34% females). The smallest proportion of respondents (1.8%) had zero risk factors (2.7% males; 0.9% females). Overall, respondents in age group 45-69 comprised a significantly higher proportion (46.5%) of respondents with 3-5 risk factors compared to age group 18-44 years (20.7%), while those age 18-44 years comprise a significantly higher proportion (77.2%) of respondents with 1-2 risk factors compared to persons in age group 45-69 years (52.6%). No age group difference was observed among participants with zero risk factors.
Table 30 Summary of combined risk factors by age group and sex
Age Group (years)
Sex n % with 0 risk
factors
% with 1-2 risk factors
% with 3-5 risk factors
18-44 M 759 3.1 82.6 14.3
F 1089 1.1 71.6 27.3
45-69 M 736 1.4 60.2 38.3
F 762 0.4 45.3 54.3
18-69 M 1495 2.7 77.4 19.9
F 1851 0.9 65.0 34.0
M+F 3346 1.8 71.2 26.9
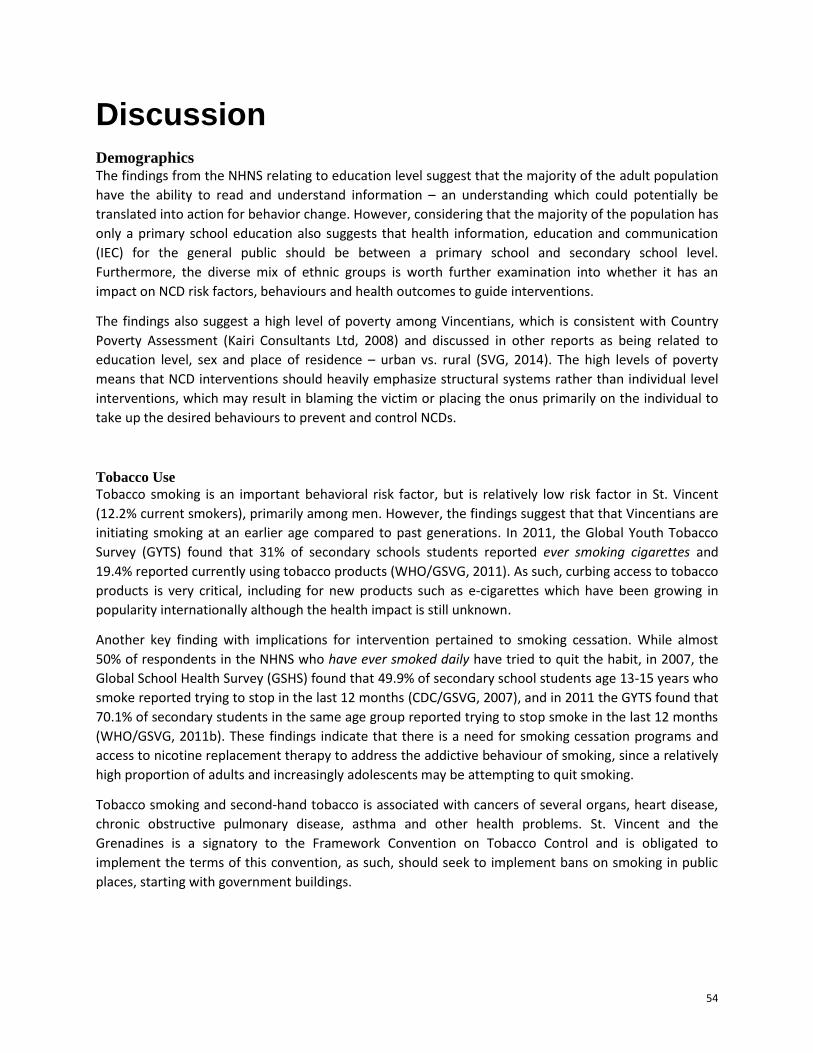
54
Discussion
Demographics The findings from the NHNS relating to education level suggest that the majority of the adult population
have the ability to read and understand information – an understanding which could potentially be
translated into action for behavior change. However, considering that the majority of the population has
only a primary school education also suggests that health information, education and communication
(IEC) for the general public should be between a primary school and secondary school level.
Furthermore, the diverse mix of ethnic groups is worth further examination into whether it has an
impact on NCD risk factors, behaviours and health outcomes to guide interventions.
The findings also suggest a high level of poverty among Vincentians, which is consistent with Country
Poverty Assessment (Kairi Consultants Ltd, 2008) and discussed in other reports as being related to
education level, sex and place of residence – urban vs. rural (SVG, 2014). The high levels of poverty
means that NCD interventions should heavily emphasize structural systems rather than individual level
interventions, which may result in blaming the victim or placing the onus primarily on the individual to
take up the desired behaviours to prevent and control NCDs.
Tobacco Use
Tobacco smoking is an important behavioral risk factor, but is relatively low risk factor in St. Vincent
(12.2% current smokers), primarily among men. However, the findings suggest that that Vincentians are
initiating smoking at an earlier age compared to past generations. In 2011, the Global Youth Tobacco
Survey (GYTS) found that 31% of secondary schools students reported ever smoking cigarettes and
19.4% reported currently using tobacco products (WHO/GSVG, 2011). As such, curbing access to tobacco
products is very critical, including for new products such as e-cigarettes which have been growing in
popularity internationally although the health impact is still unknown.
Another key finding with implications for intervention pertained to smoking cessation. While almost
50% of respondents in the NHNS who have ever smoked daily have tried to quit the habit, in 2007, the
Global School Health Survey (GSHS) found that 49.9% of secondary school students age 13-15 years who
smoke reported trying to stop in the last 12 months (CDC/GSVG, 2007), and in 2011 the GYTS found that
70.1% of secondary students in the same age group reported trying to stop smoke in the last 12 months
(WHO/GSVG, 2011b). These findings indicate that there is a need for smoking cessation programs and
access to nicotine replacement therapy to address the addictive behaviour of smoking, since a relatively
high proportion of adults and increasingly adolescents may be attempting to quit smoking.
Tobacco smoking and second-hand tobacco is associated with cancers of several organs, heart disease,
chronic obstructive pulmonary disease, asthma and other health problems. St. Vincent and the
Grenadines is a signatory to the Framework Convention on Tobacco Control and is obligated to
implement the terms of this convention, as such, should seek to implement bans on smoking in public
places, starting with government buildings.
55
Alcohol Consumption The findings indicate that alcohol consumption was relatively high (49% were current drinkers) in St.
Vincent and the Grenadines. Additionally, findings from the 2007 GSHS suggests a relatively high alcohol
consumption among secondary school students, as it found 51.4% of students reported having at least
one drink containing alcohol on one or more days during the past 30 days, while 40.5% usually have two
or more drinks per day when they drank (CDC/GSVG, 2007). While among adults more males consume
alcohol than females, similar proportion of adolescent males and females consume alcohol.
Although heavy episodic drinking (six or more drinks on one occasion) is relatively low (9%), 15% of men
engage in this type of drinking. Additionally, current drinkers consumed six or more drinks a mean
number of 3.6 times during a single occasion during the past 30 days, raising concern about binge
drinking among men and its related health and social problems. Findings indicating the majority (92% -
97.3%) of respondents engage in non-problematic drinking should be interpreted cautiously, as it is
likely that respondents may have provided more socially desirable response for behaviours viewed as
socially undesirable. It is noteworthy that among students in the GSHS, 17.1% reported getting in
trouble or missing school because of drinking, warranting the attention of Ministries ranging from health
and education to social development.
Alcohol consumption is a major risk factor for CNCDs, including mental health, alcohol dependence,
unintentional and intentional injuries, including those due to road traffic accidents and gender-based
violence, cirrhosis of the liver and various cancers. There is also a causal relationship between harmful
use of alcohol and incidence of infectious diseases such as, tuberculosis. Furthermore, alcohol
consumption by an expectant mother may cause fetal alcohol syndrome and pre-term birth
complications.
In 2012, it was estimated that 3.3 million deaths, or 5.9% of all deaths worldwide were attributable to
alcohol consumption. More than half of these deaths resulted from NCDs – chiefly cardiovascular
diseases and diabetes (33.4%), cancers (12.5%) and gastrointestinal diseases, including liver cirrhosis
(16.2%). Therefore it is important for the health sector to take a more proactive role in encouraging and
teaching skills for quitting alcohol consumption.
Overall, the findings suggest that interventions are needed to address alcohol consumption during adolescents and the life cycle, as there may be a link between consumption during these early years and in adulthood. Several countries and agencies have officially recommended drinking levels considered to be a low risk to adult men and women, however, these guidelines vary from country to country (ICAP, 2003). For example in the United Kingdom (UK) which is reported as having a higher level of alcohol consumption (10.4 litres of pure alcohol) among persons age 15 and over per GDP during 2008-2010 (WHO, 2014f) than SVG (6.3 litres of pure alcohol), the recommendation for men is 3-4 units3 per day, not to exceed 21 units per week, and for women the recommendation is 2-3 units per day not to exceed 14 units per week (ICAP, 2003).
3 One unit equals 10ml or 8g of pure alcohol. The number of units in a drink is based on the size of the drink as well
as its alcohol strength (NHS, 2015).
56
Fruit and Vegetable Consumption The findings indicated that low fruit and vegetable consumption is a major NCD risk factor among
Vincentians. Combined, Vincentians consume a mean of 1.7 servings of fruits and vegetables per day,
and only consume fruits and vegetables on average about 3 times per week. Overall, the 37.7% of
respondent did not consume any fruits and/or vegetables on average/day, while a mere 5.1% consumed
5 or more servings on average/day.
The cost of fruit and vegetable in St. Vincent and the Grenadines is considered expensive by consumers
and this may be one of the obstacles for higher consumption. However, fruit and vegetable cost and
consumption are affected by production levels and storage capacity, which are affected by natural and
man-made factors, such as Hurricanes and theft of agricultural produce. It is therefore urgent that policy
makers and planners implement measures that would facilitate the consumption of more fruits and
vegetables.
Fruits and vegetables are very important components of a healthy diet. A minimum of 5 servings of
fruits and vegetables per day is needed to provide the body with the fibre, vitamins and minerals
needed to control weight, protect against inflammation and chronic non-communicable diseases such as
diabetes, heart disease, and cancer.
Type of oil used most frequently The findings show that a significantly high proportion of respondents reported most frequently using
vegetable oil (73.8%), margarine (7.2%), butter (4.7%), and 11.9% use some other types of oil or fat for
meal preparation in households. While fats are essential for normal body function, some fats such as
polyunsaturated (e.g. canola oil, sunflower oil) and monounsaturated fats (e.g. coconut oil, olive oil) are
healthier than trans fats (e.g. hydrogenated oils, cookies) and saturated fats (e.g. butter, lard).
Therefore, most of the fat consumed should come from unsaturated sources, such as nuts, vegetable
oils, and fish (CDC, 2012). These findings suggest that Vincentians are mainly consuming the healthier
types of oils and fats. When used in place of saturated fats, polyunsaturated and monounsaturated fats
can help to improve blood cholesterol levels, thereby reducing risk for heart disease (CDC, 2012).
However, 5% of the population mainly uses saturated fats; however, a diet high in saturated fat has
been linked with elevated cholesterol levels and increased risk for heart disease (National Heart
Foundation of Australia, 2009). Additionally, almost 12% of the population reported using other types of
oil/fat for which we are uncertain whether they are the healthy or unhealthy type.
Physical Activity In this survey, total physical activity is determined by the intensity and duration of work-, transport- or
recreation/leisure-related activities undertaken. Notably, leisure or recreation-related activities
comprised the smallest proportion of physical activity, which might help to explain why overall, more
than half (60.5%) of respondents reported not engaging in vigorous physical activity. Overall, men
reported spending more time engaging in physical activity compared to women, however, considering
that more men than women are employed and engage in more laborious work, it is understandable why
men are more physically active. Interestingly, more women get their physical activity from transport-
related activity.
57
Across the various age groups, males and females alike were at risk for CNCD due to sedentary activity –
on average almost 4 hours daily was spent in sedentary activity. Adding to this concern among adults,
the GSHS also indicated that 38.9% of students reported engaging in sedentary activities for 3 or more
hours per day during a typical day. With the increasing availability of technologies such as television,
computer, video games, tablets, motor vehicles, etc. more of the population are likely to engage in
sedentary lifestyle. However, sedentary behaviour developed during childhood is likely to continue
during adulthood, unless for example, there is a work-related need to engage in physical activity or a
catalyst to promote behaviour change.
There is a need to promote physical activity in the general population, an especially urgent need among
women and the elderly. Insufficient physical activity is one of the 10 leading risk factors for global
mortality, causing some 3.2 million deaths each year (Lim et al., 2012). Adults who are insufficiently
physically active have a 20%−30% increased risk of all-cause mortality compared to those who do at
least 150 minutes of moderate-intensity physical activity per week, or equivalent, as recommended by
WHO (WHO, 2010). The WHO also promotes regular physical activity as a means of reducing the risk of
ischaemic heart disease, stroke, diabetes and breast and colon cancer. Furthermore, regular physical
activity is a key determinant of energy expenditure and is therefore fundamental to energy balance,
weight control and prevention of obesity (WHO, 2014a).
History of Raised Blood Pressure Although the mean systolic and diastolic blood pressure for men (126.3 mmHg and 73.4 mmHg) and
women (120.8 and 74.6) was within normal limits, a fair proportion of respondents had elevated blood
pressure and was not on medication (13.9% with SBP ≥140/DBP ≥90 mmHg; 3.4% with SBP
≥160/DBP≥100 mmHg). Although a smaller percentage, the latter group is concern since they may be
unaware of their high risk for high blood pressure. Also of great concerns are those with elevated blood
pressure who are on antihypertensive medication (20.1% with SBP ≥140/DBP ≥90 mmHg; 10.6% with
SBP ≥160/DBP≥100 mmHg). The final group that raises a concern comprise the 12.1% of respondents
who have never had their blood pressure measured and may be completely unaware of their risk. The
The prevalence of raised blood pressure (18.8%) is of great concern, and the NHNS findings raise
concerns about medication adherence – whether persons are not taking the medication prescribed,
whether there may be inadequate follow-up by health care providers, or both.
Raised blood pressure is one of the leading risk factors for global mortality and is estimated to have
caused 9.4 million deaths and 7% of disease burden – as measured in DALYs − in 2010 (Lim, 2012).
Raised blood pressure is a major cardiovascular risk factor. If left uncontrolled, hypertension causes
stroke, myocardial infarction, cardiac failure, dementia, renal failure and blindness, causing human
suffering and imposing severe financial and service burdens on health systems (WHO, 2013; WHO 2007).
History of Diabetes Although the mean fasting blood glucose of respondents were within normal levels (4.0 mmol/L), 2% of
respondents had impaired fasting glycaemia while 6.9% had raised blood glucose or currently on
medication. Among persons previously diagnosed, 69.8% are currently taking insulin while 22.3% are
taking medication. The prevalence of diabetes is 8.7%, while the prevalence of those currently on
58
medication for diabetes is 4.8%. The difference in prevalence between those diagnosed and those
currently on medication, in addition to those persons on medication whose blood glucose continues to
be elevated is a cause for concern about treatment and control. Similar to raised blood pressure, it
brings to the fore, considerations about medication adherence.
Considering that almost 40% of respondents reported never having measured their blood sugar levels, it
is conceivable that the prevalence in St. Vincent may be more than that identified in this survey.
Diabetes is a well-recognized cause of premature death and disability, increasing the risk of
cardiovascular disease, kidney failure, blindness and lower-limb amputation (Levitan, et al., 2004).
According to data from the Epidemiology unit in the Ministry of Health and Wellness, between 2008 and
2012, the number of amputations in St. Vincent and the Grenadines had almost doubled from 59 to 110;
this will put further economic strain on a struggling economy both in terms of caring for an increased
proportion of disabled persons and a reduction in the productive labour force.
Diabetes was directly responsible for 1.5 million deaths in 2012 and 89 million DALYs. The rise in
diabetes is largely driven by modifiable risk factors – particularly physical activity, overweight and
obesity (Finucane et al., 2011). Population ageing is also an important factor, as glucose intolerance
increases with age. Much of the diabetes burden can be prevented or delayed by behavioural changes
favouring a healthy diet and regular physical activity.
History of Raised Total Cholesterol The findings indicate that the mean total cholesterol (4.1 mmol/L) was within normal levels. A total of
28% of respondents had raised cholesterol of ≥5.0 mmol/L or ≥6.2 mmol/L or currently on medication.
Similar to persons on medication who continue to have raised blood pressure and blood glucose levels,
respondents on medication who continue to have raised cholesterol is a concern. These persons are at
an increased risk for heart disease and should be targeted, primarily through primary health care efforts,
for interventions to reduce their risk in a holistic manner.
The mean HDL levels reported in the survey are described as poor, which means that a significant
proportion of men and women are at a high risk of developing heart disease. Although mean fasting
triglyceride was within normal levels, a borderline high fasting triglyceride was recorded among 10.5%
of respondents, and high fast triglyceride was reported among 6.1%. The highest levels were reported
among age group 45-69 years. These triglycerides are often increased by sweets/sugar and alcohol
consumption, and helps to increase cardiovascular disease risk.
History of Cardiovascular Diseases A prevalence of 3.6% was found for respondents who reported ever having a heart attack or chest pain
from heart disease or a stroke (i.e. cardiovascular disease (CVD) history). Overall, 4.1% of respondents
were taking aspirin, mainly females, and 1.1% were taking statins. The Ministry of Health, Wellness and
the Environment in St. Vincent and the Grenadines are aware of the debates around the use of aspirin
and statins, especially among women, and as such there is a need for guidelines to clarify prescribing
patterns and to hold physicians accountable.
59
Of the 17.5 million deaths due to cardiovascular disease in 2012, an estimated 7.4 million were due to
heart attacks (ischaemic heart disease) and 6.7 million were due to strokes (WHO, 2014b). Currently,
over 80% of cardiovascular deaths occur in low- and middle-income countries. In 2012, heart disease
and stroke were among the top three causes of years of life lost due to premature mortality globally
(WHO, 2014c).
Lifestyle Advice The findings indicate that most respondents received advice from a healthcare provider to eat at least five servings of fruits and/or vegetables each day (27.5%), followed by advice to maintain a healthy body weight or to lose weight (25%), start or do more exercise (24.5%), reduce fat in their diet (21.9%), reduce salt in their diet (18.4%), and the smallest proportion (5.8%) reported receiving advice to quit using tobacco or to avoid starting to use tobacco. For all risk behaviours, except tobacco use, more females than males were advised to take-up healthy behaviours to reduce their risk of CNCDs. In light of the findings discussed in this report, there is scope for healthcare providers to provide advice on the risk factors to a larger segment of the population – some of these may be realized through primary health care reform. However, the country should develop the capacity to teach the skills necessary for behaviour change, as well as, develop the infrastructure to promote and/or support uptake of these behaviours. The issue of social desirability should also be considered in that more persons may have been advised by a healthcare provider, but did not report it as it may be viewed as socially undesirable to not follow the doctor’s advice. Also the stigma attached to having problems warranting the above health advice could result in under-reporting.
Dietary Salt Although respondents reported engaging in a range of behaviours to control their salt intake, more than
half of respondents reported always or often adding salt when cooking or when preparing food at home,
and 15.1% reported always or often consuming processed foods high in salt. Not surprising, the majority
of respondents (81.8%) agreed that consuming too much salt could pose a health threat, and 75%
reported thinking that lowering salt in the diet is very important. However, compared to persons in age
group 30-69 years, a smaller percentage of youth (age group 18-29 years) believed that lowering salt in
the diet is important, more of them believed that lowering salt in your diet is not at all important, and
fewer of them engaged in low-salt consumption practices. Therefore, it is important to encourage
practices to control salt intake, including among youth as a strategy to prevent the onset of NCDs
associated with excess dietary sodium consumption, such as hypertension and cardiovascular diseases
(Mozaffarian et al., 2014; WHO 2003, 2004, 2012b, 2013).
The main dietary source of sodium worldwide is salt. However, sodium can be found in other forms, and
the main source of dietary sodium consumption depends on the cultural context and dietary habits of
the population, but in many countries processed foods are the main source (WHO, 2014a). It has been
estimated that excess sodium intake was responsible for 1.7 million deaths from cardiovascular causes
globally in 2010 (Mozaffarian et al., 2014).
60
Health Screening for Cancers The survey assessed health screening practices related to cancers, which generally are the leading cause
of morbidity and mortality in St. Vincent and the Grenadines. The findings show that only 14.4% of
males had ever had a prostate exam, comprising of a significantly higher proportion (41.5%) of males in
age group 45-69 years. Considering that prostate cancer is the leading cancer causing morbidity and
mortality in SVG, the low rate of prostate examination is concerning. While prostate cancer
examinations can be unreliable, early screening can still detect large number of cases for effective
treatment.
The findings indicate that almost three-quarters (71.6%) of women reported being shown how to
examine their breast, and that about 70% of women have had a breast exam ranging from a one year or
less to more than two years ago. However, 29.4% of women reported never having a breast exam, with
a significant decrease in proportions as age increase (40.2% among age group 18-29 years). This is a
concern since breast exams are an important first step in early screening for breast cancer, while
mammograms are the best ways of finding breast cancer early. While the proportion of women who
have had a mammogram might appear low, it may be acceptable based on use as a follow-up procedure
for persons identified as having abnormal or questionable breast exams. Also the cost of having a
mammogram may be prohibitive resulting in its discriminate use.
Regarding cervical cancer screening, more than half (58.6%) of respondents have ever had a screening
test for cervical cancer, with significantly more respondents in age group 30-44 years and (70.4%) and
45-69 years (69.1%). Additionally, 72.2% of respondents had their last pap or cytological test between
one year or less and more than two years, while 27.7% never had a pap or cytological test. Considering
that the Ministry of Health, Wellness and the Environment has reported that cervical cancers are among
the main causes of morbidity and mortality in women it is important to ensure that barriers to early
screening and testing are removed. While pap or cytological tests are widely conducted in the public
sector, regular bottlenecks in testing slow down the timeframe for reporting results back to patients. As
a result, patients are often encouraged to utilize pap or cytological testing services in the private sector
at a higher cost than in the public sector, which is a hindrance to getting screened.
Overweight and Obesity To measure overweight and obesity in the population, BMI, weight and height and waist circumference
were measured. Overall, a mean BMI of 26.8 kg/m2 was found (24.8 kg/m2 for males; 29 kg/m2 for
females), which according to international standards suggest that on average the population of St.
Vincent and the Grenadines is overweight (BMI 25.0-29.9). More than half (54.2%) of respondents
recorded a BMI of ≥25 kg/m2, comprising of 27.3% classified as being overweight and 26.9% classified as
being obese (BMI ≥30). A BMI of ≥25 was recorded mostly among females (67.2%) than males (41.3%),
with a significant increase in the proportion of respondents as age increased.
BMI has been used as the universal standard or benchmark for measuring and determining obesity
among populations. Although it has been used to approximate the burden of obesity and the risks
aligned with this disease there is some debate about its use as a general tool to make comparisons
between populations and generalizations altogether. In particular, Blacks or persons of African descent
(Afro-Caribbean, Afro-American) generally register higher BMI scores and are more likely to be
categorized as overweight or obese based on the standardized BMI cut off points. The BMI measure
61
does not account for fat or muscle associated weight. For instance, some studies have found that blacks
have lower body fat and higher lean muscle mass than whites at the same BMI, and therefore, at the
same BMI, may be at lower risk of obesity-related diseases. Researchers concluded that the reliance on
the BMI scores as a universal indicator and comparative tool for determining and measuring obesity
between ethnic groups may not be appropriate as it “does not provide a consistent reflection of
adiposity and fat distribution across ethnic groups” (Rush et al, 2007). The research therefore urges
caution in the interpretation of link between BMI and obesity in St. Vincent and the Grenadines where
the majority of the population is of African descent.
Nonetheless, the link between obesity, poor health outcomes and all-cause mortality is well established.
Obesity increases the likelihood of diabetes, hypertension, coronary heart disease, stroke, certain
cancers, obstructive sleep apnea and osteoarthritis. It also negatively affects reproductive performance
(WHO, 2014). Overweight and obesity – i.e. BMI ≥25 kg/m2 and ≥30 kg/m2 respectively – were
estimated to account for 3.4 million deaths per year and 93.6 million DALYs in 2010 (Lim et al, 2012).
Summary of Risk Factor The risk factors for NCDs assessed in this study include: current daily smokers, consumption of less than
5 servings of fruits and vegetables per day, not meeting WHO recommendations on physical activity for
health, overweight or obesity and raised blood pressure. The survey revealed that 26.9% of the
population had three or more of the risk factors for chronic disease. Although the proportion of
respondents in age group 45-69 years was more than twice that of age group 18-44 years, the difference
between the two age groups are still cause for concern. This difference highlights the very real risk of
NCDs that the younger population faces, and also potentially a risk of developing chronic illness at an
earlier age compared to their predecessors.
Recommendations The non-communicable diseases discussed throughout this report account for 68% of death globally, of
which 82% of premature deaths occur in low- and middle-income countries. However, a significant
proportion of NCDs could be prevented by following the recommendations made at the global level via
WHO “Best Buy Intervention” (WHO, 2011c) and the regional level via the Caribbean Community
(CARICOM) heads of government multisectoral Port-of-Spain Summit Declaration “Uniting to Stop the
Epidemic of Chronic Noncommunicable Diseases,” 15 September 2007 (CARICOM, 2011). The following
specific recommendations for SVG were guided by these international and regional recommendations,
as well as feedback with stakeholders in a national consultation.
62
Policy directions The government should:
1. Develop a national NCD policy and action plan that positions NCD interventions at the highest
level of the national development agenda;
2. Establish and supports the necessary legal frameworks to guide the implementation of the
national NCD policy and plans;
3. Align national NCD strategies with international frameworks and conventions, such as the WHO
Framework of Convention on Tobacco Control (FCTC), for example, implement bans on smoking
in public places;
4. Create a legislative framework on the importation, sale and use of tobacco and alcohol products
in St. Vincent and the Grenadines, including marketing and sale to children and adolescents, as
well as the use of tobacco and products among this group. For example, place bans on
advertising and sale of alcohol and tobacco products during activities for children (under age 18
years);
5. Encourage collaborations between the Ministry of Health, Wellness and the Environment and
the Ministry of Finance to determine whether the recent increase in tobacco levies include the
range of tobacco products and are at an acceptable level to act as a deterrent to smoking,
especially among young persons and to discourage the introduction of new products on the
market, such as e-cigarettes;
6. Encourage collaborations between the Ministry of Agriculture and Ministry of Finance to reduce
costs related to the production, storage and retail of fruits and vegetables in St. Vincent and the
Grenadines;
7. Encourage regional actions to address the importation and availability of high-sodium content
processed food in the Caribbean region, which will include St. Vincent and the Grenadines;
8. Develop policy on the mandatory training and certification of cooks in the school feeding
program in the preparation of healthy food options and serving size for school-age children;
9. Develop strategies to increase physical activity in the general population, and address issues
such as lighted playing fields and designated community areas/roads that are restricted from
motorists for certain morning and evening hours to encourage physical activity; and
10. Develop guidelines on who should be screened for the most frequently occurring types of
cancers in St. Vincent and the Grenadines and their treatment options.
Advocacy and Dissemination of NHNS Findings The Ministry of Health, Wellness and the Environment should:

63
1. Value the findings of the NHNS and uses this report as a tool to strengthen a national NCD
control program with clear targets and focus;
2. Use the NHNS findings to develop targeted NCD interventions focused on risk factor reductions;
3. Take lead role in the coordination of a multi-sectoral plan to engage relevant stakeholders in the
fight against NCDs;
4. Collaborate with other government departments, development partners, donors and civil
society organizations to render support for a multi-sectoral action, and to build on existing inter-
agency programs, for example, health promoting schools and Health and Family Life Education
(HFLE) in school settings;
5. Collaborate with media organizations to develop a multi-media communication strategy aimed
at creating advocacy, awareness, education and behaviour change for NCD prevention and
control; and
6. Disseminate the findings at the community level, as part of awareness raising and health
promotion.
Actions for addressing risk factors for NCD Prevention That the government and stakeholders should address smoking and alcohol:
7. Develop smoking cessation programs targeting older populations and students as the findings
indicate that they may already be in a stage of readiness to quit;
8. Develop alcohol and tobacco prevention and intervention programs at the school and
community levels to address smoking and alcohol initiation, cessation and environmental
smoking;
9. Integrate alcohol and smoking content in the Health and Family Education (HFLE) curriculum;
and
10. Encourage retail outlets, bar and clubs, in the absence of policy or legislation, to discourage
indoor smoking, and selling alcohol and tobacco products to minors. For example they could
post signage which reads: No Smoking and Alcohol & Tobacco Products Will Not Be Sold to
Persons Under Age 18 Years.
The government and stakeholders should address healthy lifestyle related to diet and physical activity:
11. Promote high fruit and vegetable consumption starting at a young age;
12. Incorporate healthy food options in nutrient support programs and poverty reduction programs;
64
13. Interventions for healthy eating should be targeted at homes, families, schools and eating
establishments, including restaurants and roadside eateries and Barbeque vendors to help
educate them about healthy meal options, preparation and serving size;
14. Vigorously promote the National Dietary Food Guidelines of SVG, including use of the media to
provide demonstration of how to Vincentians can operationalize the guidelines in their daily
lives;
15. MoHW, Ministry of Agriculture, and Food and Nutrition Council should work together to create
stamps of approval endorsing healthy food options, making it easier for consumers to identify
the more nutritious foods in the supermarkets. For example, helping customers to distinguish
between healthy and unhealthy fats;
16. Promote physical activity using taken for granted avenues or activities, such as walking or
swimming individually or in groups on the beaches, hiking, etc.;
17. Promote physical activity in the general population, an especially urgent need among women
and the elderly, and strengthen physical education programs in schools from kindergarten to
tertiary level;
18. Promote collaborations between the Ministry of Sports and the Police Force to strengthen after
school and work physical activity programs in each community, at a minimum, parish-level
progams;
19. Lifestyle advice should go beyond the realm of the health facility and should be part of a larger
health promotion drive in range of setting from schools and communities to workplaces;
20. Continue to promote the message of lowering sodium/salt intake among the general
population, especially during meal preparation;
21. Vigorously promote the use of spices when cooking rather than salt as it helps to add flavour to
the meal with increased health benefits;
22. Develop interventions to address overweight, obesity and underweight starting in childhood and
throughout the life cycle; and
23. Continue to use effective labeling which warns about the dangers of tobacco products.
Actions for management of patients The Ministry of Health, Wellness and the Environment via its health services mechanism should:
24. Undertake a well-developed plan for NCD screening, early diagnosis and initiation of treatment
for diabetes, hypertension, high cholesterol, cardiovascular diseases, and the range of
65
commonly occurring cancers. Screening for one health concern can also be used as an
opportunity to encourage and/or screen for related problem, for example, presentation for a
pap test, should also be used to co-test for HPV among certain groups of women which are
known to cause a significant proportion of cervical cancers. NCD screening should include
collaborations between the private sector and NGO for workplace screening of diabetes and
hypertension;
25. Strengthen the health care system to effectively respond to NCD management through
provision of supplies, staffing, and medicines to sustain patient treatment and referrals, both at
hospital level and through an effective primary health care system. For example, it is critical to
address the bottlenecks with Pap or cytological testing;
26. Strengthen community-based care of individuals with diagnosed NCDs by supporting primary
care facilities to deliver a package of essential NCD interventions. This requires appropriately
trained health workers, essential technology and medicines made available at all levels of the
health care system;
27. Promote medication adherence among patients with NCDs;
28. Promote a holistic assessment and treatment plan, including lifestyle changes to address the
whole person on medication for raised blood pressure, blood sugar and/or cholesterol but
continue to have elevated levels. For example, modest weight reduction of as little as five
percent of body weight can reduce high blood pressure and should be encouraged; and
29. Prevent NCD-related disability and premature deaths due to NCDs by provision of quality patient
care to prevent complications.
Actions for NCD Surveillance The Ministry of Health, Wellness and the Environment should:
30. Establish and maintain a functional surveillance system to monitor essential NCD data in an
ongoing and systematic way as an essential component of the Health Information System, in
order to measure NCD disease burden and trends over time;
31. Establish the current baseline for NCDs mortality and morbidity in line with requirements to
report on the Caribbean regional goal to reduce NCD premature deaths;
32. Establish strong leadership to maintain a systematic approach to STEPS/NHNS data collection,
building on local capacity for implementing the NHNS survey in order to create an ongoing and
robust surveillance system;
33. Conduct NCD STEPS surveys at 5 to 7 year intervals supplemented by mini STEPS (i.e. surveys in
workplaces and/or with high risk groups) every 2 years to determine the impact of NCD
prevention and control measures; and

66
34. Participate in the comparison of NCD STEPS survey findings across all Caribbean islands that
have completed the NCD STEPS survey, and review inter-country interventions that are most
amenable to modification.
67
References 1. CARICOM. Declaration of Port-of-Spain: Uniting to stop the epidemic of chronic disease NCD.
Georgetown, 2011. http://www.caricom.org/jsp/communications/meetings_statements/declaration_port_of_spain_chronic_ncds.jsp
2. Center for Disease Control (CDC)/Government of St. Vincent and the Grenadines (GSVG). Global School Health Survey for St. Vincent and the Grenadines. 2007. http://www.who.int/chp/gshs/St_Vincent_and_the_Gren_2007_fact_sheet.pdf?ua=1
3. CDC. Dietary Fats. 2012. Available at: http://www.cdc.gov/nutrition/everyone/basics/fat/index.html
4. Finucane MM, Stevens GA, Cowan MJ, Danaei G, Lin JK, Paciorek CJ et al.; Global Burden of Metabolic Risk Factors of Chronic Diseases Collaborating Group (Body Mass Index). National, regional, and global trends in body-mass index since 1980: systematic analysis of health examination surveys and epidemiological studies with 960 country-years and 9.1 million participants. Lancet. 2011; 377:557−67. http://www.thelancet.com/journals/lancet/article/PIIS0140-6736(10)62037-5/abstract
5. GSVG. Food and Nutrition Security Plan of Action Policy for St. Vincent and the Grenadines 2008-2012, Draft #2. 2008
6. GSVG. Monitoring & Evaluation Health Sector Report. Health Information Unit, Ministry of Health, Wellness & the Environment. 2013.
7. International Center for Alcohol Policies (ICAP). ICAP Reports 14: International Drinking Guidelines. Washington, DC: ICAP, 2003. http://www.icap.org/LinkClick.aspx?fileticket=KtXj8PGibT8%3D&tabid=75
8. Kairi Consultants Ltd. 2007/2008 Country Poverty Assessment for St. Vincent and the Grenadines. 2008. http://www.cepal.org/portofspain/noticias/paginas/0/40340/4_CPA_SVG_CPA_-_FINAL_REPORT__Vol_1__Revised.pdf
9. Levitan B, Song Y, Ford ES, Liu S. Is nondiabetic hyperglycaemia a risk factor for cardiovascular disease? A meta-analysis of prospective studies. Arch Intern Med. 2004; 164:2147−55. http://nutrigen.ph.ucla.edu/files/view/pubs/04hyperglycemia-chd.pdf
10. Lim SS, Vos T, Flaxman AD, Danaei G, Shibuya K, Adair-Rohani H et al. A comparative risk assessment of burden of disease and injury attributable to 67 risk factors and risk factor clusters in 21 regions, 1990– 2010: a systematic analysis for the Global Burden of Disease Study 2010. Lancet. 2012; 380 (9859):2224−60. http://www.thelancet.com/journals/lancet/article/PIIS0140-6736(12)61766-8/abstract .
11. Mozaffarian D, Fahimi S, Singh GM, Micha R, Khatibzadeh S, Engell RE, Lim S et al.; Global Burden of Diseases Nutrition and Chronic Diseases Expert Group. Global sodium consumption and death from cardiovascular causes. New England Journal of Medicine. 2014; 371(7):624−34. http://www.ncbi.nlm.nih.gov/pubmed/25119608
12. National Heart Foundation of Australia. Trans Fat. 2009. Available at: http://www.heartfoundation.org.au/SiteCollectionDocuments/Dietary-fats-transfat.pdf
13. Oberg M, Jaakkola MS, Woodward A, Peruga A, PrüssUstün A. Worldwide burden of disease from exposure to second-hand smoke: a retrospective analysis of data from 192 countries. Lancet. 2011; 377(9760):139−46. http://www.who.int/quantifying_ehimpacts/publications/smoking.pdf
68
14. Rush EC, Goedecke JH, Jennings C, Micklesfield L, Dugas L, Lambert. BMI, fat and muscle differences in urban women of five ethnicities from two countries. International Journal of Obesity (Lond). 2007; Aug; 31(8):1232-9. http://www.nature.com/ijo/journal/v31/n8/full/0803576a.html
15. World Health Organization (WHO). Diet, nutrition and the prevention of chronic diseases. Report of a Joint WHO/FAO Expert Consultation. Geneva: World Health Organization; 2003 (WHO Technical Report Series, No. 916). http://whqlibdoc.who.int/trs/who_trs_916.pdf
16. WHO. Resolution WHA 57.17. Global strategy on diet, physical activity and health. In: Fifty-seventh World Health Assembly, Geneva, 17−22 May 2004. (WHA57/2004/ REC/1); http://apps.who.int/gb/ebwha/pdf_files/WHA57/A57_R17-en.pdf
17. WHO. Prevention of cardiovascular disease: guidelines for assessment and management of cardiovascular risk. 2007. http://www.who.int/cardiovascular_diseases/guidelines/Full%20text.pdf
18. WHO. Global recommendations on physical activity for health. 2010. http://whqlibdoc.who.int/publications/2010/9789241599979_eng.pdf
19. WHO. Global status report on noncommunicable diseases 2010. 2011a http://www.who.int/nmh/publications/ncd_report2010/en/
20. WHO/GSVG. Global Youth Tobacco Survey for St. Vincent and the Grenadines. 2011b. http://www.paho.org/hq/index.php?option=com_docman&task=doc_view&gid=24894&Itemid
21. WHO. From Burden to “Best Buys”: Reducing the Economic Impact of Non-Communicable Diseases in Low- and Middle-Income Countries. 2011c. http://www3.weforum.org/docs/WEF_WHO_HE_ReducingNonCommunicableDiseases_2011.pdf
22. WHO. WHO global report. Mortality attributable to tobacco. Geneva: World Health Organization; 2012 http://www.who.int/tobacco/publications/surveillance/rep_mortality_attributable/en/
23. WHO. Guideline: Sodium intake for adults and children. 2012b. http://www.who.int/nutrition/publications/guidelines/sodium_intake/en/
24. WHO. A global brief on hypertension. Silent killer, global public health crisis. 2013 http://apps.who.int/iris/bitstream/10665/79059/1/WHO_DCO_WHD_2013.2_eng.pdf
25. WHO. Global Status Report on Noncommunicable Diseases 2014a. Geneva, WHO, 2014a http://www.who.int/nmh/publications/ncd-status-report-2014/en/
26. WHO Global Health Estimates: Deaths by Cause, Age, Sex and Country, 2000-2012. Geneva, WHO, 2014b
27. World health statistics 2014c. Geneva: World Health Organization; 2014c http://apps.who.int/iris/bitstream/10665/112738/1/9789240692671_eng.pdf
28. WHO. Global status report on alcohol and health 2014. Geneva, WHO, 2014d http://www.who.int/substance_abuse/publications/global_alcohol_report/en/
29. WHO. Global Alcohol Status Report Profile of Saint Vincent and the Grenadines 2014. Geneva, WHO, 2014e http://www.who.int/substance_abuse/publications/global_alcohol_report/profiles/vct.pdf WHO. Global Alcohol Status Report Profile of the United Kingdom of Great Britain and Northern Ireland. Geneva, WHO, 2014f. http://www.who.int/substance_abuse/publications/global_alcohol_report/profiles/gbr.pdf?ua=1

69
Annex 1: STEPS Questionnaire
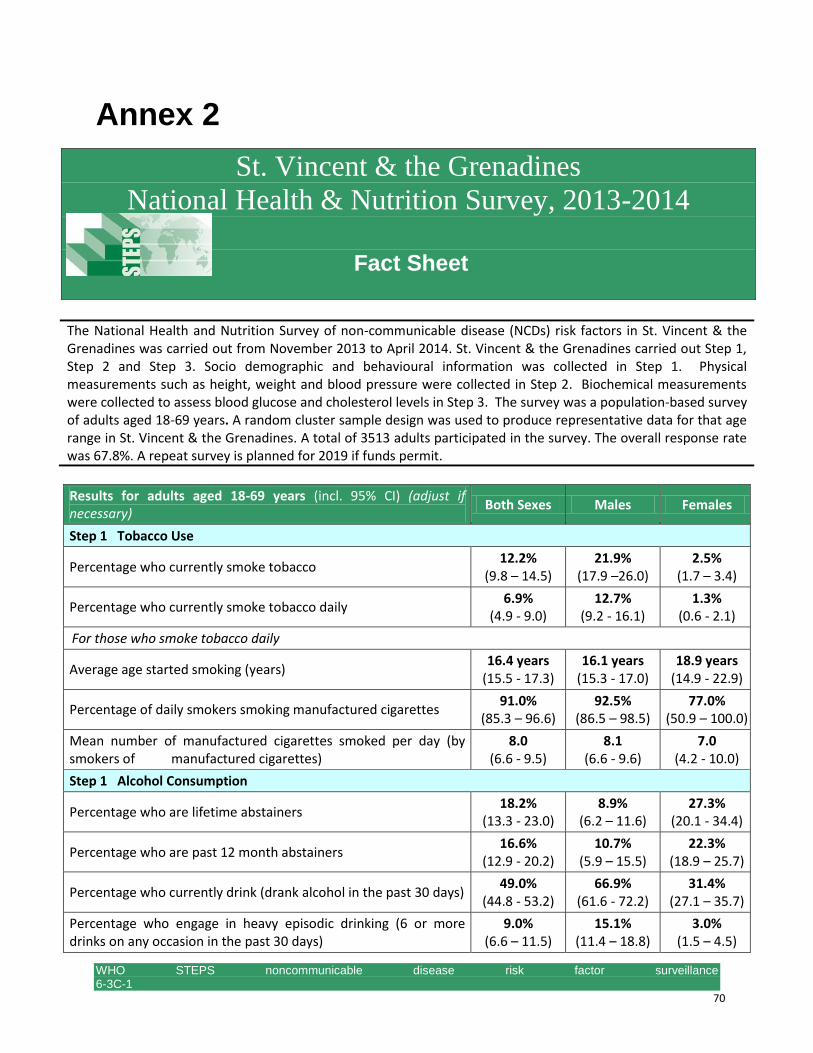
WHO STEPS noncommunicable disease risk factor surveillance 6-3C-1 www.who.int/chp/steps 70
Annex 2
St. Vincent & the Grenadines
National Health & Nutrition Survey, 2013-2014
Fact Sheet
The National Health and Nutrition Survey of non-communicable disease (NCDs) risk factors in St. Vincent & the Grenadines was carried out from November 2013 to April 2014. St. Vincent & the Grenadines carried out Step 1, Step 2 and Step 3. Socio demographic and behavioural information was collected in Step 1. Physical measurements such as height, weight and blood pressure were collected in Step 2. Biochemical measurements were collected to assess blood glucose and cholesterol levels in Step 3. The survey was a population-based survey of adults aged 18-69 years. A random cluster sample design was used to produce representative data for that age range in St. Vincent & the Grenadines. A total of 3513 adults participated in the survey. The overall response rate was 67.8%. A repeat survey is planned for 2019 if funds permit.
Results for adults aged 18-69 years (incl. 95% CI) (adjust if necessary)
Both Sexes Males Females
Step 1 Tobacco Use
Percentage who currently smoke tobacco 12.2%
(9.8 – 14.5) 21.9%
(17.9 –26.0) 2.5%
(1.7 – 3.4)
Percentage who currently smoke tobacco daily 6.9%
(4.9 - 9.0) 12.7%
(9.2 - 16.1) 1.3%
(0.6 - 2.1)
For those who smoke tobacco daily
Average age started smoking (years) 16.4 years
(15.5 - 17.3) 16.1 years
(15.3 - 17.0) 18.9 years
(14.9 - 22.9)
Percentage of daily smokers smoking manufactured cigarettes 91.0%
(85.3 – 96.6) 92.5%
(86.5 – 98.5) 77.0%
(50.9 – 100.0)
Mean number of manufactured cigarettes smoked per day (by smokers of manufactured cigarettes)
8.0 (6.6 - 9.5)
8.1 (6.6 - 9.6)
7.0 (4.2 - 10.0)
Step 1 Alcohol Consumption
Percentage who are lifetime abstainers 18.2%
(13.3 - 23.0) 8.9%
(6.2 – 11.6) 27.3%
(20.1 - 34.4)
Percentage who are past 12 month abstainers 16.6%
(12.9 - 20.2) 10.7%
(5.9 – 15.5) 22.3%
(18.9 – 25.7)
Percentage who currently drink (drank alcohol in the past 30 days) 49.0%
(44.8 - 53.2) 66.9%
(61.6 - 72.2) 31.4%
(27.1 – 35.7)
Percentage who engage in heavy episodic drinking (6 or more drinks on any occasion in the past 30 days)
9.0% (6.6 – 11.5)
15.1% (11.4 – 18.8)
3.0% (1.5 – 4.5)
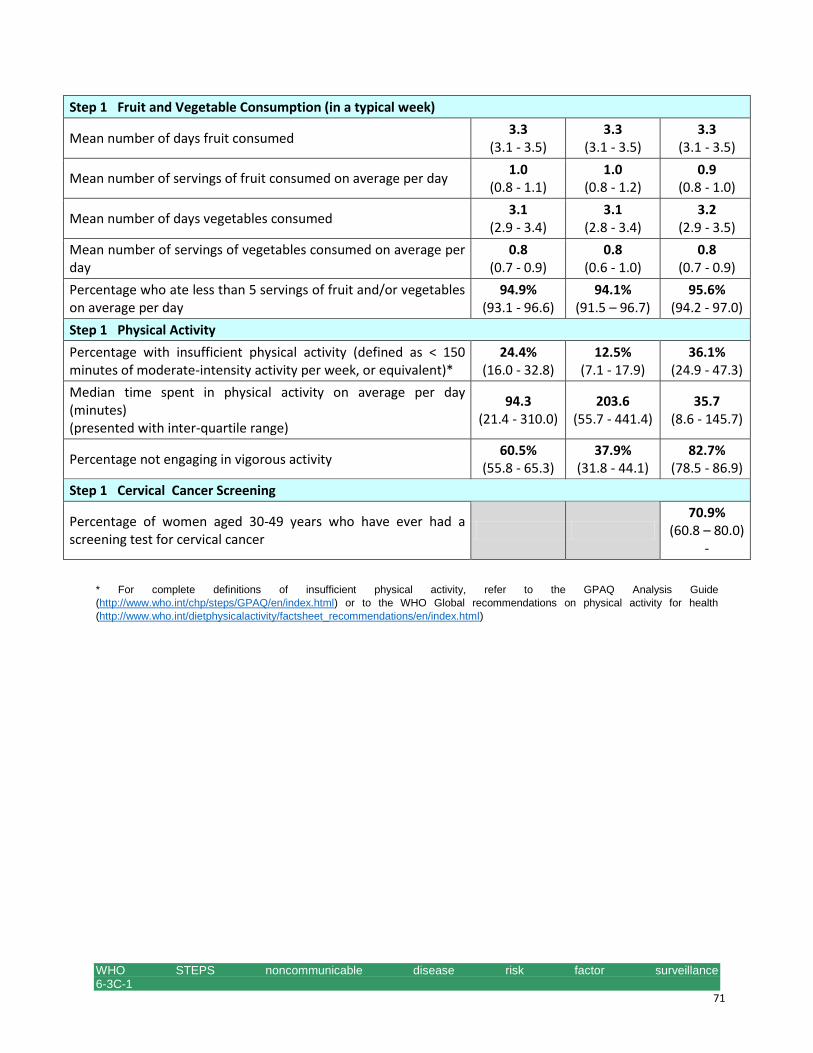
WHO STEPS noncommunicable disease risk factor surveillance 6-3C-1 www.who.int/chp/steps 71
Step 1 Fruit and Vegetable Consumption (in a typical week)
Mean number of days fruit consumed 3.3
(3.1 - 3.5) 3.3
(3.1 - 3.5) 3.3
(3.1 - 3.5)
Mean number of servings of fruit consumed on average per day 1.0
(0.8 - 1.1) 1.0
(0.8 - 1.2) 0.9
(0.8 - 1.0)
Mean number of days vegetables consumed 3.1
(2.9 - 3.4) 3.1
(2.8 - 3.4) 3.2
(2.9 - 3.5)
Mean number of servings of vegetables consumed on average per day
0.8 (0.7 - 0.9)
0.8 (0.6 - 1.0)
0.8 (0.7 - 0.9)
Percentage who ate less than 5 servings of fruit and/or vegetables on average per day
94.9% (93.1 - 96.6)
94.1% (91.5 – 96.7)
95.6% (94.2 - 97.0)
Step 1 Physical Activity
Percentage with insufficient physical activity (defined as < 150 minutes of moderate-intensity activity per week, or equivalent)*
24.4% (16.0 - 32.8)
12.5% (7.1 - 17.9)
36.1% (24.9 - 47.3)
Median time spent in physical activity on average per day (minutes) (presented with inter-quartile range)
94.3 (21.4 - 310.0)
203.6 (55.7 - 441.4)
35.7 (8.6 - 145.7)
Percentage not engaging in vigorous activity 60.5%
(55.8 - 65.3) 37.9%
(31.8 - 44.1) 82.7%
(78.5 - 86.9)
Step 1 Cervical Cancer Screening
Percentage of women aged 30-49 years who have ever had a screening test for cervical cancer
70.9%
(60.8 – 80.0) -
* For complete definitions of insufficient physical activity, refer to the GPAQ Analysis Guide
(http://www.who.int/chp/steps/GPAQ/en/index.html) or to the WHO Global recommendations on physical activity for health
(http://www.who.int/dietphysicalactivity/factsheet_recommendations/en/index.html)
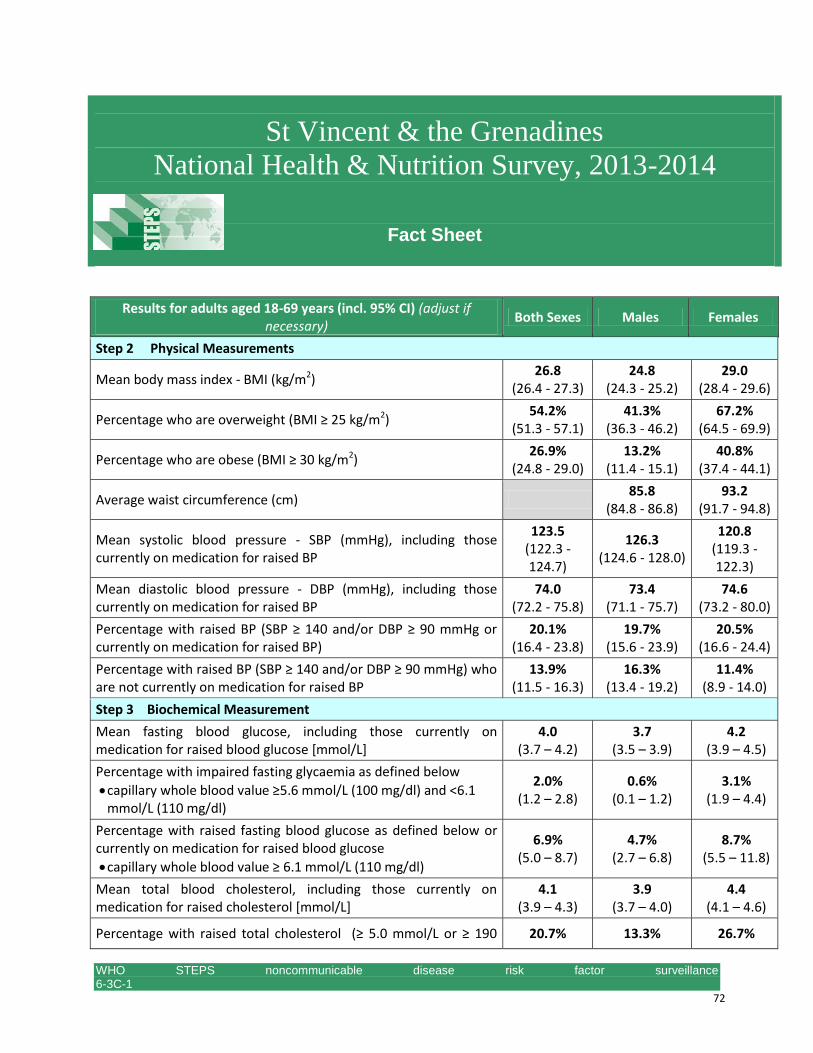
WHO STEPS noncommunicable disease risk factor surveillance 6-3C-1 www.who.int/chp/steps 72
St Vincent & the Grenadines
National Health & Nutrition Survey, 2013-2014
Fact Sheet
Results for adults aged 18-69 years (incl. 95% CI) (adjust if necessary)
Both Sexes Males Females
Step 2 Physical Measurements
Mean body mass index - BMI (kg/m2) 26.8
(26.4 - 27.3) 24.8
(24.3 - 25.2) 29.0
(28.4 - 29.6)
Percentage who are overweight (BMI ≥ 25 kg/m2) 54.2%
(51.3 - 57.1) 41.3%
(36.3 - 46.2) 67.2%
(64.5 - 69.9)
Percentage who are obese (BMI ≥ 30 kg/m2) 26.9%
(24.8 - 29.0) 13.2%
(11.4 - 15.1) 40.8%
(37.4 - 44.1)
Average waist circumference (cm) 85.8
(84.8 - 86.8) 93.2
(91.7 - 94.8)
Mean systolic blood pressure - SBP (mmHg), including those currently on medication for raised BP
123.5 (122.3 - 124.7)
126.3 (124.6 - 128.0)
120.8 (119.3 - 122.3)
Mean diastolic blood pressure - DBP (mmHg), including those currently on medication for raised BP
74.0 (72.2 - 75.8)
73.4 (71.1 - 75.7)
74.6 (73.2 - 80.0)
Percentage with raised BP (SBP ≥ 140 and/or DBP ≥ 90 mmHg or currently on medication for raised BP)
20.1% (16.4 - 23.8)
19.7% (15.6 - 23.9)
20.5% (16.6 - 24.4)
Percentage with raised BP (SBP ≥ 140 and/or DBP ≥ 90 mmHg) who are not currently on medication for raised BP
13.9% (11.5 - 16.3)
16.3% (13.4 - 19.2)
11.4% (8.9 - 14.0)
Step 3 Biochemical Measurement
Mean fasting blood glucose, including those currently on medication for raised blood glucose [mmol/L]
4.0 (3.7 – 4.2)
3.7 (3.5 – 3.9)
4.2 (3.9 – 4.5)
Percentage with impaired fasting glycaemia as defined below
capillary whole blood value ≥5.6 mmol/L (100 mg/dl) and <6.1 mmol/L (110 mg/dl)
2.0% (1.2 – 2.8)
0.6% (0.1 – 1.2)
3.1% (1.9 – 4.4)
Percentage with raised fasting blood glucose as defined below or currently on medication for raised blood glucose
capillary whole blood value ≥ 6.1 mmol/L (110 mg/dl)
6.9% (5.0 – 8.7)
4.7% (2.7 – 6.8)
8.7% (5.5 – 11.8)
Mean total blood cholesterol, including those currently on medication for raised cholesterol [mmol/L]
4.1 (3.9 – 4.3)
3.9 (3.7 – 4.0)
4.4 (4.1 – 4.6)
Percentage with raised total cholesterol (≥ 5.0 mmol/L or ≥ 190 20.7% 13.3% 26.7%
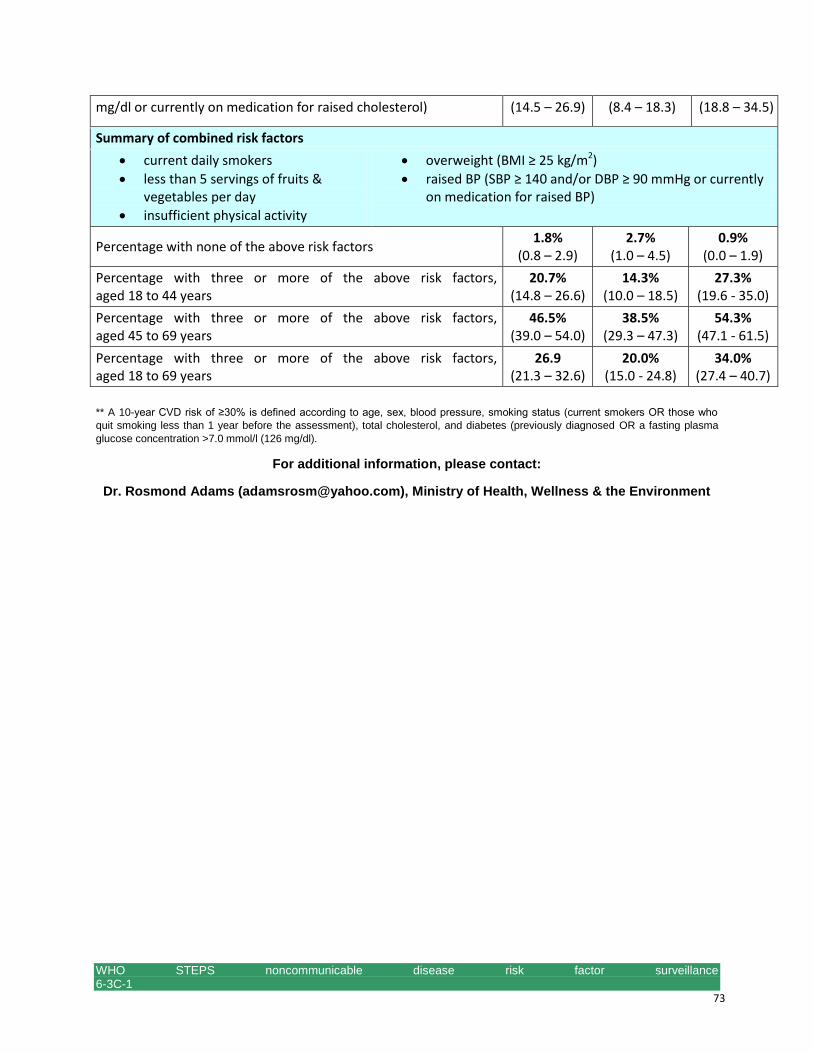
WHO STEPS noncommunicable disease risk factor surveillance 6-3C-1 www.who.int/chp/steps 73
mg/dl or currently on medication for raised cholesterol) (14.5 – 26.9) (8.4 – 18.3) (18.8 – 34.5)
Summary of combined risk factors
current daily smokers
less than 5 servings of fruits & vegetables per day
insufficient physical activity
overweight (BMI ≥ 25 kg/m2)
raised BP (SBP ≥ 140 and/or DBP ≥ 90 mmHg or currently on medication for raised BP)
Percentage with none of the above risk factors 1.8%
(0.8 – 2.9) 2.7%
(1.0 – 4.5) 0.9%
(0.0 – 1.9)
Percentage with three or more of the above risk factors, aged 18 to 44 years
20.7% (14.8 – 26.6)
14.3% (10.0 – 18.5)
27.3% (19.6 - 35.0)
Percentage with three or more of the above risk factors, aged 45 to 69 years
46.5% (39.0 – 54.0)
38.5% (29.3 – 47.3)
54.3% (47.1 - 61.5)
Percentage with three or more of the above risk factors, aged 18 to 69 years
26.9 (21.3 – 32.6)
20.0% (15.0 - 24.8)
34.0% (27.4 – 40.7)
** A 10-year CVD risk of ≥30% is defined according to age, sex, blood pressure, smoking status (current smokers OR those who
quit smoking less than 1 year before the assessment), total cholesterol, and diabetes (previously diagnosed OR a fasting plasma
glucose concentration >7.0 mmol/l (126 mg/dl).
For additional information, please contact:
Dr. Rosmond Adams ([email protected]), Ministry of Health, Wellness & the Environment