Embed Size (px)
Citation preview

Natural Aggregates of the Conterminous United States
By William H. Langer
The geologic occurrence of potential sources of crushed stone and sand and gravel for use as natural aggregate and a summary of the natural aggregate industry
U.S. GEOLOGICAL SURVEY BULLETIN 1594

DEPARTMENT OF THE INTERIOR DONALD PAUL HODEL, Secretary
U.S. GEOLOGICAL SURVEY Dallas L. Peck, Director
First Printing, 1988 Second Printing, 1993
UNITED STATES GOVERNMENT PRINTING OFFICE, WASHINGTON: 1988
For sale by the Branch of Distribution Books and Open-File Reports Section U.S. Geological SurveyFederal CenterBox 25425 Denver, CO 80225
Library of Congress Cataloging in Publication Data
Langer, William H. Natural aggregates of the conterminous United States.
(U.S. Geological Survey bulletin ; 1594) Bibliography: p. Supt. of Docs. No.: I 19.3:1594
1. Aggregates (Building materials)—United States. I. Title. II. Series. QE75.B9 no. 1594 [TN939] 557.3 s [553.6] 85-14858
CONTENTS
Abstract 1 Introduction 1 Purpose and scope 1
Acknowledgements 2 Aggregate types and definitions 2 Map preparation 3 Potential sources of sand and gravel 4
Major regions covered with glacial materials 4Major regions of large alluvial valleys 5Coastal Plain province 5Regions of the Midwest covered primarily with soft sedimentary rocks 6Regions of bedrock and residual soils resulting from the weathering of bedrock in place 7Marine sand and gravel 7Areas where sand and gravel aggregate generally is lacking 8
Potential bedrock sources of crushed stone 8 Sedimentary rocks 8 Igneous rocks 11 Metamorphic rocks 11
Properties of natural aggregates 12 Marginal aggregates and substitutes for natural aggregates 15
Marginal aggregates 15 Substitutes 15
Natural aggregate industry 15 Exploration 15 Mining and processing techniques 16 Uses of natural aggregate 17 Production 18 Forecasting 19 Pricing structure 19 Preemption of natural aggregate resources
Conclusion 21 Sources of data 22
General references 22 State listings 23
References cited 27State geological surveys 29State highway and transportation agencies 31
PLATES
20
1. Map showing major potential source areas of sand and gravel aggregate by geographic regions 2. Map showing potential source areas of crushed stone aggregate and predominant bedrock types in these areas
FIGURES
1. Diagram showing distribution of three particle-size groups for stratified deposits and till 5 2. Generalized block diagram showing area and vertical changes in textures of glacial deposits 6 3. Map showing areas of extinct glacial lakes in the conterminous United States 7 4. Map of lithologic provinces of the conterminous United States 10 5. Diagram showing classification of igneous rocks shown on plate 2 11 6. Photograph of aggregate-processing facility 16 7. Photograph of mined area reclaimed as lake and recreation area 17

8. Generalized cross section of coarse aggregate use typical in interstate highways in the United States 189. Graph of natural aggregate production for construction purposes, 1955-1980 2010. Graph of the rate of preemption of potential sand and gravel areas, Anne Arundel County, MD 22
TABLES
1. General classification of rocks commonly encountered 92. Average coefficients of expansion for some common rocks of differing compositions 143. Uses for natural aggregate in percent, 1980 184. Estimate of usage rates of natural aggregates 19 5. Average annual cost of sand and gravel aggregate and crushed stone aggregate in the United States,
1955-80 206. Cost of sand and gravel and crushed stone in various urban areas of the United States, April 1982 21

Natural Aggregates of the Conterminous United States
By William H. Langer
Abstract
Crushed stone and sand and gravel are the two main sources of natural aggregates. These materials are commonly used construction materials and frequently can be interchanged with one another. They are widely used throughout the United States, with every State except two producing crushed stone. Together they amount to about half the mining volume in the United States. Approximately 96 percent of sand and gravel and 77 percent of the crushed stone produced in the United States are used in the construction industry.
Natural aggregates are widely distributed throughout the United States in a variety of geologic environments. Sand and gravel deposits commonly are the results of the weathering of bedrock and subsequent transportation and deposition of the material by water or ice (glaciers). As such, they commonly occur as river or stream deposits or in glaciated areas as glaciofluvial and other deposits. Crushed stone aggregates are derived from a wide variety of parent bedrock materials. Limestone and other carbonates account for approximately three quarters of the rocks used for crushed stone, with granite and other igneous rocks making up the bulk of the remainder. Limestone deposits are widespread throughout the Central and Eastern United States and are scattered in the West. Granites are widely distributed in the Eastern and Western United States, with few exposures in the Midwest. Igneous rocks (excluding granites) are largely concentrated in the Western United States and in a few isolated localities in the East.
Even though natural aggregates are widely distributed throughout the United States, they are not universally available for consumptive use. Some areas are devoid of sand and gravel, and potential sources of crushed stone may be covered with sufficient unconsolidated material to make surface mining impractical. In some areas many aggregates do not meet the physical property requirements for certain uses, or they may contain mineral constituents that react adversely when used as concrete aggregate.
In areas where suitable natural aggregate is not available or accessible, it may become necessary to improve the quality of existing aggregate, to import aggregate from outside the area, or to substitute artificial aggregate for natural aggregate. In most cases, all of
these alternatives add substantially to the cost of the final product. Even though an area may be blessed with an abundance of aggregate suitable for the intended purpose, existing land uses, zoning, or regulations may preclude commercial exploitation of the aggregate.
This report also discusses the aggregate industry in general terms, including exploration, mining, and processing, as well as aggregate production rates. Proper long-range planning based on an understanding of the aggregate industry can help assure adequate supplies of aggregate.
INTRODUCTION
Purpose and Scope
This report provides an overview of the availability of natural aggregates and the aggregate industry. The maps show the relative abundance of natural aggregates and the major areas where aggregate is likely to occur. They can be used for national or regional planning projects or to compare local with regional conditions. Due to the small map scale and the general nature of the maps, they are not to be used for prospecting or for site investigations. The report is also designed to assist local users in understanding the production and use of natural aggregates in order to minimize the problems associated with its production.
Crushed stone and sand and gravel are the two main sources of natural aggregates. These materials are widely distributed throughout the United States; however, they are not universally available for consumptive use. Sand and gravel does not occur in some areas, and some areas may be covered with sufficient material to make mining of stone impractical. In some areas, many aggregates do not meet the toughness, strength, durability, or other physical-property requirements for certain uses, or they contain mineral constituents that react adversely when used as concrete aggregate.
1
Together, crushed stone and sand and gravel amount to approximately half the mining volume in the United States. Crushed stone and sand and gravel are among the top nonfuel mineral commodities in annual U.S. production with a combined value during 1981 of more than $5.4 billion. This by far exceeds iron ore ($3.0 billion), copper ($2 billion), or the precious metals such as gold, silver, and platinum group metals ($983 million) (production figures from U.S. Bureau of Mines, 1982). However, the average citizen is not aware of his dependency on aggregate. The noise, traffic, dust, and unsightly appearance associated with mining operations make them unattractive neighbors. To prevent mining from encroaching upon residential developments, zoning or regulations are commonly enacted. Therefore, even if an area has an adequate supply of natural aggregates, regulations, as well as existing land use, may preclude its commercial exploitation.
The U.S. Bureau of Mines predicts an annual demand of nearly 2.5 billion short tons of natural aggregate by the year 2000. Because aggregate will continue to be in demand, provisions for uninterrupted economic supplies must be made. Proper long-range planning and zoning techniques based on an understanding of the aggregate industry can help assure adequate supplies of aggregate, while simultaneously protecting the public from the unwanted effects of mining operations.
Acknowledgments
The author wishes to acknowledge the helpful cooperation of Donna L. Belval, U.S. Geological Survey, who, in addition to coauthoring plate 1 of this report, provided valuable assistance in collecting and interpreting data for this report and plate 2. Special thanks are also given to the National Sand and Gravel Association, in particular Richard C. Meininger, Director of the Engineering Branch, and the National Crushed Stone Association, in particular Frederick A. Renninger, Senior Vice President, for their review and comments on the manuscript and plates. The author also acknowledges the helpful review and comments on the plates from the many State highway department and State geological survey staffs. And finally the author acknowledges the efforts of coworkers in the U.S. Geological Survey, in particular Jerry C. Stephens, former Chief, Earth Sciences Assistance Office.
AGGREGATE TYPES AND DEFINITIONS
Some terms associated with aggregates have different meanings to different users. In addition, some
terms have different meanings in different geographic locations. Commonly these terms have descriptive characteristics that are dependent on local conditions and as such serve an important function. The terms used in this report that relate to the aggregate industry generally conform to industry usage and to definitions accepted by the American Society for Testing and Materials.
Aggregate.—The term “aggregate” has a number of definitions depending primarily on the use of the material. The American Society for Testing and Materials (ASTM) defines aggregate in a number of ways. The definition given in ASTM Designation C 125-79a, Standard Definitions of Forms Relating to Concrete and Concrete Aggregate, is “a granular material such as sand, gravel, crushed stone, or iron blast-furnace slag, used with a cementing medium to form hydraulic-cement concrete or mortar.” The definition given in ASTM Designation D 8-79a, Standard Definitions of Terms Relating to Materials for Roads and Pavements, is “a granular material of mineral composition such as sand, gravel, shell, slag, or crushed stone, used with a cementing medium to form mortars or concrete, or alone as in base courses, railroad ballasts, and so forth.” Aggregate therefore encompasses a wide variety of naturally occurring and manmade materials of a wide range of sizes and physical properties.
More common definitions of the term “aggregate” seldom restrict it to use with a binder to form a conglomerated mass. Woods (1948, p. 1) defined the mineral aggregate as “an aggregation of sand, gravel, crushed stone, slag, or other material of mineral composition, used in combination with a binding medium to form bituminous and portland cement concrete, macadam, mastic, mortar, plaster, etc., or alone as in railroad ballast, filter beds, and various manufacturing processes such as fluxing, etc.” Woods left out reference to the term “inert material” since some aggregates, when bound into concrete by cement, are highly reactive. Woods’ definition has been referred to and used by McLaughlin and others (1960). It is used in this report and is consistent with most of the references used in the preparation of this report.
Natural aggregate.—McLaughlin and others (1960, p. 16-4) defined natural aggregate as “materials composed of rock fragments which are used in their natural state except for such operations as crushing, washing, and sizing.” This definition adequately describes the use of the term “natural aggregate” in this report with the exception that natural aggregate contains approximately 25 percent or more coarse fragments (those fragments retained on the No. 4 (4.75-mm) sieve).
Rocks*.—Any hard, consolidated materials derived from the earth and usually of relatively small size.
Bedrock*.—A general term for the rock, usually solid, that underlies soil or other unconsolidated, superficial material.
2

Gravel.—Granular material predominantly retained on the No. 4 (4.75-mm) sieve that results from natural disintegration and abrasion of rock or processing of weakly bound conglomerates.
Crushed gravel**.—The product resulting from the artificial crushing of gravel or small cobblestones with substantially all fragments having at least one face resulting from fracture.
Crushed stone**.—The product resulting from the artificial crushing of rock, boulders, or large cobblestones, substantially all faces of which have resulted from the crushing operation.
Sand.—Granular material passing the 3/8-inch (9.5-mm) sieve, almost entirely passing the No. 4 (4.75-mm) sieve, and predominantly retained on the No. 200 (75-µm) sieve that results from natural disintegration and abrasion of rock or processing of completely friable sandstone.
Coarse aggregate**.—Aggregate predominantly retained on the No. 4 (4.75-mm) sieve (composed mainly of gravel-size particles).
Fine aggregate**.—Aggregate passing the 3/8-inch (9.5-mm) sieve, almost entirely passing the No. 4 (4.75-mm) sieve, and predominantly of sand-size particles).
Sand and gravel aggregate.—A mixture (aggregation) of sand and gravel in which gravel makes up approximately 25 percent or more of the mixture.
Artificial aggregates.—Byproduct aggregates such as blast-furnace slag and cinders or manufactured aggregates such as lightweight aggregates including expanded clay or shale, processed diatomaceous earth, processed volcanic glasses, and expanded slag (McLaughlin and others, 1960).
*The definitions marked by single asterisks have been taken, or paraphrased from, the American Geological Institute Glossary of Geology (Bates and Jackson, 1980).
**The definitions marked by double asterisks have been taken, or paraphrased from, American Society for Testing and Materials (1980), ASTM Designation C 125-79a, Standard Definitions of Terms Relating to Concrete and Concrete Aggregates.
MAP PREPARATION
Plate 1 is a map of the conterminous United States showing the major potential sources of sand and gravel aggregate. The map is subdivided into regions based on various natural processes that affected the formation of these deposits.
Plate 2 shows the distribution of selected types of bedrock normally considered for use as crushed stone.
The maps have been prepared at a scale of 1:5,000,000, or 1 inch equals approximately 79 miles. At
this scale, the distribution of natural aggregates cannot be shown in detail. Instead, these maps are intended to be an overview; they show the relative abundance of natural aggregates and the distribution of major areas where natural aggregate is likely to occur. These maps are not to be used for prospecting or for site investigations. For more detailed information, the reader should see the references cited or should contact State geological surveys or State highway departments at the addresses shown in a section at the end of the report.
Drafts of plates 1 and 2 were sent to the directors of each of the State highway departments and State geological surveys of the conterminous United States for their comments and review. More than 80 percent of the agencies responded. These maps reflect the State reviews wherever possible. The comments of the State agencies are greatly appreciated; however, their comments do not necessarily represent an endorsement of this report. Furthermore, the State agencies that responded to the review request did not officially approve the maps, and they have no official responsibility for the data shown on the maps or discussed in the report. This responsibility rests solely with the author. State agencies that responded to the review request are listed in the section “Sources of Data.”
The information used to produce plate 1 was obtained, in general, on a state-by-state basis. Some regional and national maps were used when little or no information was available for a State or to resolve conflicts between data sources.
Each State has published some information concerning the availability of sand and gravel within the State; that information has been produced in many forms. Some States give written descriptions of where sand and gravel are most available; other States have produced maps that delineate areas likely to contain sand and gravel deposits; still others have maps that divide the entire State into regions and show the likelihood of finding sand and gravel throughout the State. Plate 1 combines all of this information onto one map showing the distribution of potential sand and gravel deposits on a national basis.
The actual compilation of the map involved transferring the information from the State publications to a 1:5,000,000-scale base map. When written descriptions were given of where sand and gravel could most likely be found, the approximate areas were plotted on the base map. State map publications that specify the areas where sand and gravel deposits are likely to occur were reduced and plotted on the base map. The publications that divided States into regions based on availability of aggregate were used as guides to the distribution of aggregate, but they were not directly used in preparation of the map since they did not provide enough detail.
As the source-map information was drafted onto the base map, two obvious problems surfaced: first, there were conflicts at the borderlines between States as to the boundaries of the sand and gravel units; second, some States were shown in greater detail than others because of map scale or mapping techniques. To solve discrepancies
3
at borders, national maps or regional maps were used as a supplemental sources of data. These included the Geologic Map of the United States (King and Beikman, 1974), the Surficial Geologic Map of the United States (Hunt, 1977), and the Glacial Map of the United States East of the Rocky Mountains (National Research Council, 1959).
Because some State maps had more detail than others, changes were made to provide for equal overall accuracy of the national map, rather than for extensive detail in only a few States. This was accomplished by compiling all maps at the 1:5,000,000 scale, then smoothing some contacts, enlarging some units to emphasize their existence, and deleting some units.
Plate 2 was produced largely from national or regional scale maps. Thus, many of the problems of differing scale, detail, and interpretations between States were avoided.
Information on the distribution of igneous and metamorphic rocks was obtained from the Geologic Map of the United States (King and Beikman, 1974). In reducing the map to the 1:5,000,000 scale, some of the smaller units had to be combined, enlarged, or deleted. Decisions were made based on an attempt to reflect the general distribution of rock types in an area.
The distribution of limestone and dolomite was obtained from Davies and others 91977), Ericksen and Cox (1968), French (1967), and Hubbard and Ericksen (1973). Because of differing scales and mapping techniques, adjustments to mapped units, commonly to conform to the King and Beikman map, were necessary.
POTENTIAL SOURCES OF SAND AND GRAVEL
Sand and gravel deposits are the result of the erosion of bedrock and the subsequent transport, abrasion, and deposition of the particles by ice, water, gravity, and wind. The principal geologic agents that affect the distribution of deposits of aggregate are ice and water. Gravity has a minor influence on the formation of sand and gravel deposits through downslope movement of materials. (See “Regions of Bedrock and Residual Soils Resulting from the Weathering of Bedrock in Place.”) Windblown deposits are generally confined to fine-grained materials and are therefore of little importance as natural aggregates except possibly as blending sands.
For the purposes of this report, in plate 1, the conterminous United States has been divided into five geographic regions. The origin and occurrence of sand and gravel deposits throughout a region reflects, in general, the geologic history and physiography of that region. Therefore, the mode of distribution of sand and gravel is similar within a region and fairly distinct from that of the other regions.
Within each of these geographic regions, major areas of sand and gravel have been delineated. Note, however, in regions III and IV, areas mapped as sand and gravel may actually be sand with only small local sand and gravel deposits.
Major Regions Covered with Glacial Materials (Plate 1, Region 1)
Glacial materials are the products of either continental or alpine glaciation, and in the United States, they are restricted to northern latitudes or high altitudes. Glacial materials are strongly influenced by the type of bedrock over which the glacier passed. They occur as two principal types of deposits: true glacial deposits and glaciofluvial deposits. In geologic terms, true glacial deposits are classified as till. This is material deposited directly by the ice, either at the base of the overriding ice (lodgement till) or as the ice melts (ablation till). Both types of till are poorly sorted mixtures of clay-size to boulder-size particles. Lodgement till commonly is very dense due to the presence of fine material and due to compaction from the weight of the overriding ice. Ablation till commonly is sandier and less dense. During the melting (ablation) process, much of the fine material is washed out of the ablation till, and in some cases, it is clean enough to be used as a source of natural aggregate.
As a glacier recedes by melting, meltwater flows from on top of, within, and under the ice. Glaciofluvial deposits consist of glacial material that has been transported and redeposited by this meltwater. As the material is transported, it is subjected to the abrasion and sorting action streams. Angular fragments are rounded, and weak materials are broken into smaller size particles. Fine materials are carried away and deposited in quiet waters (glaciolacustrine deposits), whereas the coarser sands and gravels are deposited in and along thee stream channels. Because of this abrading and sorting process, coarse-grained glaciofluvial deposits generally yield satisfactory deposits of natural aggregate, although the presence of impurities may require washing. Figure 1 shows generalized grain size for typical glacial and glaciofluvial deposits.
Glaciofluvial deposits occur in a wide variety of topographic situations. Streams flowing within or on top of the ice may deposit the materials as sinuous ridges called eskers or ice channel fillings, respectively. Where the materials are deposited as conical mounds or terraces adjacent to the ice, they are called kames and kame terraces, respectively. Eskers, ice channel fillings, kames, and kame terraces all tend to contain a high percentage of coarse material. The materials that get carried farther away from the ice before they are deposited commonly are called outwash. They tend to have fewer very coarse particles and also tend to be better sorted.
The processes involved with glacial erosion and
4
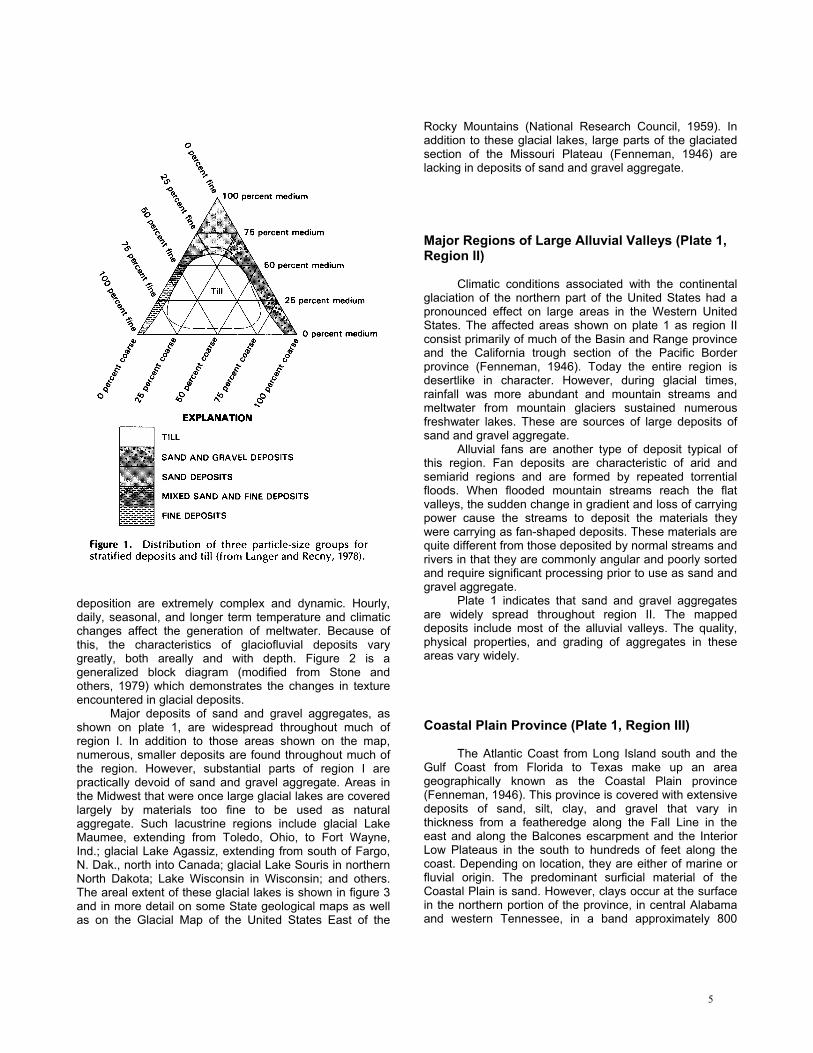
deposition are extremely complex and dynamic. Hourly, daily, seasonal, and longer term temperature and climatic changes affect the generation of meltwater. Because of this, the characteristics of glaciofluvial deposits vary greatly, both areally and with depth. Figure 2 is a generalized block diagram (modified from Stone and others, 1979) which demonstrates the changes in texture encountered in glacial deposits.
Major deposits of sand and gravel aggregates, as shown on plate 1, are widespread throughout much of region I. In addition to those areas shown on the map, numerous, smaller deposits are found throughout much of the region. However, substantial parts of region I are practically devoid of sand and gravel aggregate. Areas in the Midwest that were once large glacial lakes are covered largely by materials too fine to be used as natural aggregate. Such lacustrine regions include glacial Lake Maumee, extending from Toledo, Ohio, to Fort Wayne, Ind.; glacial Lake Agassiz, extending from south of Fargo, N. Dak., north into Canada; glacial Lake Souris in northern North Dakota; Lake Wisconsin in Wisconsin; and others. The areal extent of these glacial lakes is shown in figure 3 and in more detail on some State geological maps as well as on the Glacial Map of the United States East of the
Rocky Mountains (National Research Council, 1959). In addition to these glacial lakes, large parts of the glaciated section of the Missouri Plateau (Fenneman, 1946) are lacking in deposits of sand and gravel aggregate.
Major Regions of Large Alluvial Valleys (Plate 1,Region II)
Climatic conditions associated with the continental glaciation of the northern part of the United States had a pronounced effect on large areas in the Western United States. The affected areas shown on plate 1 as region II consist primarily of much of the Basin and Range province and the California trough section of the Pacific Border province (Fenneman, 1946). Today the entire region is desertlike in character. However, during glacial times, rainfall was more abundant and mountain streams and meltwater from mountain glaciers sustained numerous freshwater lakes. These are sources of large deposits of sand and gravel aggregate.
Alluvial fans are another type of deposit typical of this region. Fan deposits are characteristic of arid and semiarid regions and are formed by repeated torrential floods. When flooded mountain streams reach the flat valleys, the sudden change in gradient and loss of carrying power cause the streams to deposit the materials they were carrying as fan-shaped deposits. These materials are quite different from those deposited by normal streams and rivers in that they are commonly angular and poorly sorted and require significant processing prior to use as sand and gravel aggregate.
Plate 1 indicates that sand and gravel aggregates are widely spread throughout region II. The mapped deposits include most of the alluvial valleys. The quality, physical properties, and grading of aggregates in these areas vary widely.
Coastal Plain Province (Plate 1, Region III)
The Atlantic Coast from Long Island south and the Gulf Coast from Florida to Texas make up an area geographically known as the Coastal Plain province (Fenneman, 1946). This province is covered with extensive deposits of sand, silt, clay, and gravel that vary in thickness from a featheredge along the Fall Line in the east and along the Balcones escarpment and the Interior Low Plateaus in the south to hundreds of feet along the coast. Depending on location, they are either of marine or fluvial origin. The predominant surficial material of the Coastal Plain is sand. However, clays occur at the surface in the northern portion of the province, in central Alabama and western Tennessee, in a band approximately 800
5

miles long paralleling the boundary of the Coastal Plain in central Texas, along much of the Gulf Coast in Texas, and in the Mississippi embayment and its tributaries (Woods and Lovell, 1960).
Near the inner edge of the Coastal Plain are deposits of sands and gravels. Present-day streams cutting through these deposits transport gravels downstream as much as 50 miles. These terrace and fluvial gravels are the primary sources of natural aggregate in the Coastal Plain, although small, isolated deposits of beach and terrace gravels are scattered throughout the area. The quality of the gravels varies in accordance with the types of rock from which they originated. The gravels associated with the Piedmont tend to be siliceous, whereas those occurring in contact with the limestones of the Interior Low Plateaus are calcareous (Woods and Lovell, 1960). Sand and gravel occur in parts of the Mississippi embayment as isolated terraces, the largest of which is Crowleys Ridge in southeastern Missouri and northeastern Arkansas. Sand and gravel also occur at depth under the alluvial clays of the Mississippi River. These sands and gravels are buried by clays ranging in thickness from 5 feet in the northern part of the embayment near Cairo, Ill., to more than 100 feet near New Orleans (Fisk, 1944).
As shown on plate 1, occurrences of sand and gravel are relatively restricted in region III. In contrast to regions I and II, much of region III mapped as sand and gravel may include only small deposits.
Regions of the Midwest Covered Primarily with Soft Sedimentary Rocks (Plate 1, Region IV)
Large portions of the Midwestern United States are covered with soft (semiconsolidated) sedimentary rocks. This area includes most of the High Plains, the unglaciated Missouri Plateau, the Wyoming Basin, and the Uinta Basin (Fenneman, 1946). By far the largest section is that made up of the combination of the High Plains and the unglaciated Missouri Plateau. This area extends from the southern limit of the continental ice sheet south almost to the Rio Grande. In the northern sections the region is approximately 400 miles wide. From Oklahoma south it is generally less than 200 miles wide.
Soft (semiconsolidated) sedimentary rocks crop out throughout most of the region. Surface exposures range from silt to sand and gravel, with sand being most abundant, and clay occurs only in a few areas. Sand covers large areas of north-central Nebraska (Nebraska Sand Hills); an area in northwestern Kansas, northeastern Colorado, and southwestern Nebraska; and the area along the Texas-New Mexico border. Gravels occur haphazardly throughout the region, usually in small deposits (Woods and Lovell, 1960). The principal sources of gravel are terraces on mountain flanks and channel and terrace deposits of major rivers and streams. Gravels become progressively more scarce along the rivers and streams downstream from the mountains.
6
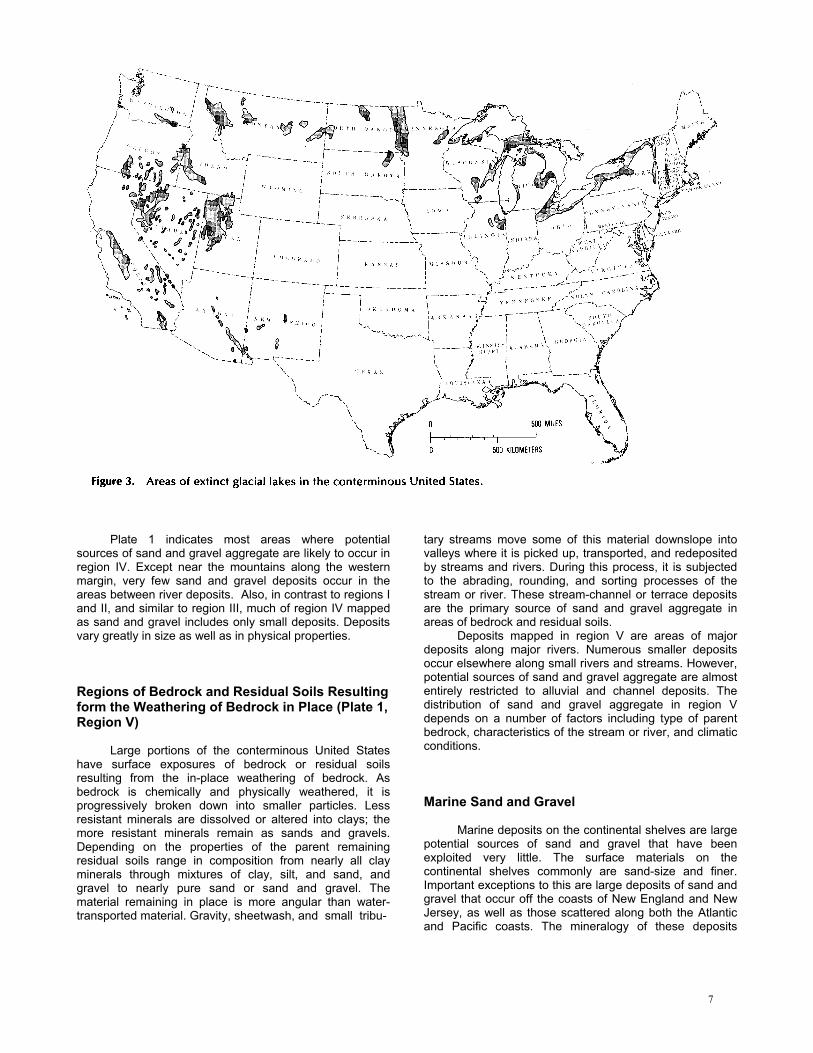
Plate 1 indicates most areas where potential sources of sand and gravel aggregate are likely to occur in region IV. Except near the mountains along the western margin, very few sand and gravel deposits occur in the areas between river deposits. Also, in contrast to regions I and II, and similar to region III, much of region IV mapped as sand and gravel includes only small deposits. Deposits vary greatly in size as well as in physical properties.
Regions of Bedrock and Residual Soils Resultingform the Weathering of Bedrock in Place (Plate 1,Region V)
Large portions of the conterminous United States have surface exposures of bedrock or residual soils resulting from the in-place weathering of bedrock. As bedrock is chemically and physically weathered, it is progressively broken down into smaller particles. Less resistant minerals are dissolved or altered into clays; the more resistant minerals remain as sands and gravels. Depending on the properties of the parent remaining residual soils range in composition from nearly all clay minerals through mixtures of clay, silt, and sand, and gravel to nearly pure sand or sand and gravel. The material remaining in place is more angular than water-transported material. Gravity, sheetwash, and small tribu
tary streams move some of this material downslope into valleys where it is picked up, transported, and redeposited by streams and rivers. During this process, it is subjected to the abrading, rounding, and sorting processes of the stream or river. These stream-channel or terrace deposits are the primary source of sand and gravel aggregate in areas of bedrock and residual soils.
Deposits mapped in region V are areas of major deposits along major rivers. Numerous smaller deposits occur elsewhere along small rivers and streams. However, potential sources of sand and gravel aggregate are almost entirely restricted to alluvial and channel deposits. The distribution of sand and gravel aggregate in region V depends on a number of factors including type of parent bedrock, characteristics of the stream or river, and climatic conditions.
Marine Sand and Gravel
Marine deposits on the continental shelves are large potential sources of sand and gravel that have been exploited very little. The surface materials on the continental shelves commonly are sand-size and finer. Important exceptions to this are large deposits of sand and gravel that occur off the coasts of New England and New Jersey, as well as those scattered along both the Atlantic and Pacific coasts. The mineralogy of these deposits
7
varies depending on the source of the material, and they may contain impurities of shells and salts. In addition, they are more difficult to prospect for and to mine than onshore deposits. However, as onshore deposits become more scarce in certain regions, offshore deposits may become economically feasible.
Areas Where Sand and Gravel Aggregate Generally Is Lacking
Plate 1 and the preceding text indicate a number of areas in the conterminous United States where sand and gravel aggregate generally is lacking.
In the High Plains, coarse aggregate is largely restricted to river channels and terraces. However, much of this alluvium lacks coarse fractions. Large areas of glaciolacustrine deposits in Michigan and the Dakotas lack significant deposits of sand and gravel. The seaward sections of the Coastal Plain are primarily sand and lack significant deposits of gravel. Much of the Mississippi alluvial plain is covered with fine alluvium and lacks significant deposits of sand and gravel.
Residual areas (region V) are difficult to characterize as far as sand and gravel are concerned. Deposits are restricted to alluvium and are dependent on the characteristics of the river and the parent bedrock type. Some types of bedrock produce suitable coarse fragments; others do not.
In addition to these areas, Witczak (1972) has identified other areas where sand and gravel aggregates are generally lacking, including the Salton Trough (Fenneman, 1946) in southern California, which is an area primarily of fine-grained alluvial and lacustrine deposits, and the Mississippi loessial upland (Witczak, 1972), which is covered with extensive deposits of windblown silts and lacks significant deposits of sand and gravel.
POTENTIAL BEDROCK SOURCES OF CRUSHED STONE
Bedrock deposits are classified on the basis of their origins into three main groups: sedimentary, igneous, and metamorphic. The complex origins and detailed distributions of bedrock are beyond the scope of this report. However, table 1 shows, in abbreviated form, classifications of the three main categories of bedrock. Plate 2 shows, in a generalized format, the distribution of bedrock commonly used for crushed stone. In many areas of this map, bedrock is covered with overburden too thick to make surface quarrying economical. This is particularly true in the glaciated parts of the country. In some of these
areas, crushed stone aggregate is currently being mined using underground mining techniques.
Sedimentary Rocks
Sedimentary rocks are rocks resulting from the consolidation of loose sediment. The principal types of sedimentary rocks are those that have been chemically or biochemically deposited and those that have been mechanically deposited (clastic rocks). Sedimentary rocks range from heavy to light, strong to weak, hard to soft, and dense to porous. Their suitability for use as crushed stone varies accordingly.
Chemically or biochemically deposited sedimentary rocks consist primarily of limestones, dolomites, chert, flint evaporates, and organics. Of these rocks, evaporates and organics are seldom, if ever, used as aggregate and will not be discussed in this report.
Limestone and dolomite are rocks composed essentially of carbonates; limestone is primarily calcium carbonate (CaCO3), and dolomite is primarily calcium-magnesium carbonate (CaMg(CO3)2). Both limestone and dolomite are commonly called limestone by the aggregate industry.
Most limestones are lithified mixtures of sediments and lime mud. The sediments that form limestones and dolomites are the remains of organisms that extract carbonates from the water. They can be the shells of clams or snails, the skeletons of corals, or the ooze precipitated by bacteria. Dolomites form in some places where seawater evaporates or indirectly where magnesium partially replaces calcium in limestones.
Limestones and dolomites, when hard and dense, commonly make good sources of crushed stone. Of the total production of crushed stone in 1981, 74 percent was limestone (U.S. Bureau of Mines, 1982). However, limestones may be friable, soft, and absorptive when they contain significant amounts of clay.
Plate 2 shows that limestone and dolomite are widespread throughout the conterminous United States, and nearly every State has formations adequate to supply some aggregate for construction. Limestones and dolomites are most extensive in the mid-continent, especially in Kentucky, Tennessee, Missouri, and States adjacent to the Great Lakes. Rocks in parts of the Appalachians and the Rocky Mountains are folded and faulted, and the limestones and dolomites tend to crop out in linear bands paralleling the regional structures. As such, they are restricted in area (Hubbard and Ericksen, 1973).
Silicates that form chert and flint are precipitated from water by organisms such as sponges, radiolarians, and diatoms. Cherts are used as crushed stone; however, some types of chert may cause adverse reactions when used as concrete aggregate (See “Physical Properties of Aggregate”).
8

Clastic sedimentary rocks are classified according to Of the clastic sedimentary rocks, sandstone, when the grain size of individual particles. Rocks that consist hard and dense, is commonly the only type that is predominantly of pebbles and larger size fragments are considered for use as crushed stone and is a major source called conglomerates, rocks that consist predominantly of of aggregate in some areas. Even so, it makes up only sand-size particles are called sandstones, and rocks three percent of the total U.S. production of crushed stone consisting predominantly of silt- or clay-size particles are (U.S. Bureau of Mines, 1982). Furthermore, sandstones called siltstones and shales, respectively. frequently are friable or excessively porous due to
9
imperfect cementation of the constituent grains. They may also contain clay that renders the rock friable, soft, and absorptive. Siltstones and shales are generally poor aggregates, although they are used in some areas where other better quality aggregate is not available. They generally assume flat shapes when crushed, and they are soft, light, weak, and absorptive. Siltstones and shale may be fired to make lightweight aggregate. Conglomerates generally make aggregates because they are weak and frequently break down when handled (Water and Power Resources Service, 1981).
Sandstone differs from sand in that it is coherent instead of loose. The coherency is due to cementation
resulting from precipitation of carbonates or silicates in water circulating through the sediments. The individual grains of sandstones commonly are quartz, although other impurities may be present in significant amounts. The color of sandstones commonly is due to the cementing agent or to impurities. Red colors are attributed to hematite cements, brown colors to limonite cements. White sandstones commonly are cemented with silica and are frequently referred to as quartzites. Pink colors in sandstones commonly are caused by feldspar impurities in the rock.
Sedimentary rocks commonly occur in layers and may occur as any combination of conglomerates, sand-
10

stones, siltstones, shales, and carbonates or silicates. The thickness of the layers affects the density and hardness of the rocks as well as the ease of mining the desirable rock types and, consequently, the suitability of the rocks for use as crushed stone.
The only sedimentary rocks shown in plate 2 are carbonate rocks. Other sedimentary rocks such as conglomerates, sandstones, and siltstones are not shown on plate 2 because of their limited use on a national scale. However, n some localities, the use of these materials can make them an important resource.
Limestone and dolomite were plotted in plate 2 under one category, carbonate bedrock, because for most uses of crushed carbonate rocks, differences among properties of rock from specific individual sources are more important than whether the rock is classified as a limestone or a dolomite.
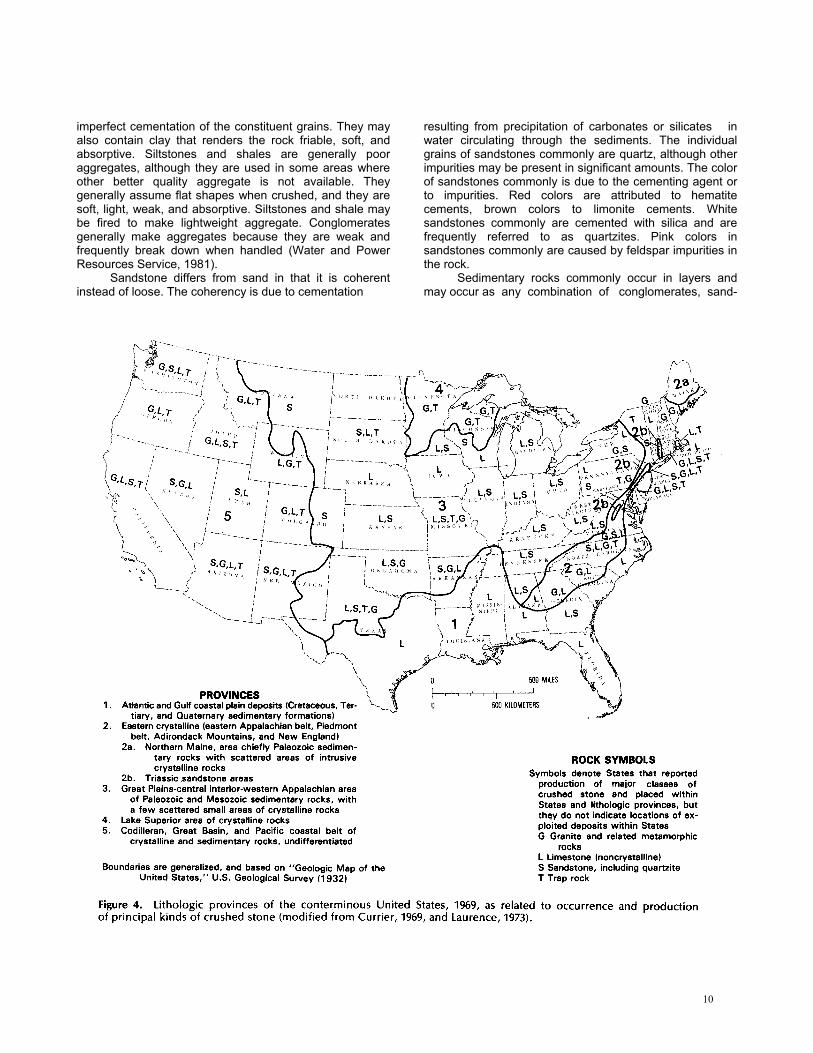
Figure 4 (modified from Currier, 1960, and Laurence, 1973) divides the conterminous United States into five lithologic provinces and indicates the types of crushed stone produced in each State. Sedimentary rocks cover province 3 (Great Plains, central interior, and western Appalachian area); much of province 5 (Cordilleran, Great Basin, and Pacific Coast belt); and parts of province 2b (Triassic basins within the eastern Crystalline section). Sedimentary rocks also occur in province 1 (Atlantic and Gulf Coastal Plain); however, few consolidated formations in these areas yield suitable crushed stone.
Igneous Rocks
Igneous rocks that solidify from molten or partly molten material are commonly classified by origin and mineralogy.
Intrusive rocks are igneous rocks that formed within the Earth. They are generally coarse grained, due to the
slow cooling associated with being deeply buried, and include the general rock types of granite, diorite, and gabbro. Volcanic rocks (extrusive rocks) are igneous rocks that have been ejected onto the Earth’s surface. They have been quickly cooled and therefore are fine grained. These include the general rock types of rhyolite, andesite, and basalt (trap rock).
Intrusive and volcanic rocks are further subdivided on the basis of mineralogy. Light-colored igneous rocks generally are high in silica and commonly are referred to as acidic or felsic rocks. These include the general rock types of granite, diorite, rhyolite, and andesite. Dark-colored igneous rocks generally are low in silica and are referred to as basic or mafic rocks. These include the general rock types of gabbro, diabase, and basalt, and they commonly are called trap rock. Ultramafic rocks, dark-colored composed almost entirely of mafic minerals, include the general rock types of serpentinite and dunite. Figure 5 demonstrates the relationships among origin, texture, and mineralogy of igneous rocks that are shown on plate 2.
Igneous rocks commonly are hard, tough, and dense; they make excellent sources of crushed stone. However, there are exceptions: tuffs and certain lavas are very porous due to the inclusion of gases, and some acidic rocks react when used as aggregate in concrete. About 12 percent of the crushed stone produced in 1981 was granite; about 8 percent was trap rock (U.S. Bureau of Mines, 1982).
The occurrences of igneous rocks and related metamorphic rocks are combined on figure 4 and are shown by the letter G. Igneous rocks are most common through province 5 of figure 4 (Cordilleran, Great Basin, and Pacific Coast belt) and province 2b (Triassic sandstone of the eastern Crystalline section).
Metamorphic Rocks
Metamorphic rocks are derived from preexisting rocks through mineralogical, chemical, and structural changes. They are rocks that have been changed by heat and pressure and generally include slates, schists, gneisses, marbles, and quartzites. The physical characteristics of metamorphic rocks vary widely. Marbles (metamorphosed carbonates) and quartzites (metamorphosed quartz sandstones) are generally massive, dense, hard, and strong; and they generally are suitable sources of crushed stone. Schists and slates commonly are laminated and tend to assume slabby shapes when crushed. They often contain micaceous minerals and often lack the desired strength characteristics of crushed stone. However, some schists are suitable for use as crushed stone. Gneisses are usually massive, dense, hard, and strong; some gneisses may have the undesirable characteristics of schists.
11

In figure 4, metamorphic rocks (which are included in the rocks depicted by the letter G) are common throughout province 2 (eastern Appalachian belt, Piedmont belt, Adirondacks, and New England) and province 4 (Lake Superior area), and are scattered through province 5 (Cordilleran, Great Basin, and Pacific Coast belt).
PROPERTIES OF NATURAL AGGREGATES
The properties of natural aggregates vary greatly depending on the source of the material. The properties that one looks for depend primarily on the uses to which the aggregates will be put. In order to insure that aggregates will perform adequately under particular uses, their properties commonly are compared to predetermined specifications. The most generally used national guidelines for specifications and testing procedures for natural aggregates are those described by the American Society for Testing and Materials (ASTM) and the American Association of State Highway and Transportation Officials (AASHTO). Some large construction agencies also develop their own specifications and tests. It must be pointed out, however, that national specifications must be broad, and that, at best, they are general guidelines. Local specifications must reflect specific sues, local aggregates, and local climatic conditions. For example, physical properties that may be innocuous in one area may be problems in another.
The largest single use of natural aggregates is in construction-related activities: 96 percent of the sand and gravel produced in the United States in 1981 was used in construction; 77 percent of crushed stone was used in construction. Of the construction uses, ore than 57 percent of the sand and gravel was used as aggregate in portlandcement concrete or bituminous mixes. Nearly 25 percent of the crushed stone was used as aggregate for concrete or bituminous mixes.
Because of the use of natural aggregate in portlandcement concrete or bit mixes is generally more specific than for other construction-related uses, these specifications will be discussed. First, however, it is necessary to have a general understanding of what these products are and how they behave.
Portland-cement concrete is composed of sand, gravel, crushed stone, or other aggregates held together by a hardened paste of cement and water. When properly proportioned and thoroughly mixed, the materials make a plastic mass which can be cast or molded into a predetermined size and shape. In order for the concrete to set and cure, chemical reactions (hydration) must take place between water and compounds in the cement. When concrete sets, it becomes rigid and unworkable. Upon further hydration of the cement by the water, concrete becomes as hard and as strong as stone.
Bituminous mixes are composed of crushed stone, sand, gravel, or other aggregates held together by a flexible paste of bitumen. All, or nearly all, bituminous mixes are used for highway pavements and bases. The strength of the mixture comes from the intergranular contact between individual particles of the aggregate. The bitumen provides waterproofing and binds the aggregate particles in position; it is markedly different from the cement paste in concrete in that it can deform when loaded and rebound with the removal of the load (Goetz and Wood, 1960). Therefore, bituminous pavement is considered to be flexible, whereas concrete pavement is not.
Ideally, aggregate is an inert filler in concrete or bituminous mixes. However, owing to economic factors, the use of aggregate is usually limited to local deposits, which may or may not be completely inert. Therefore, adjustments in specifications of the aggregates and subsequently in the mixes of the final product must often be made. Generally speaking, factors that bear on the suitability of an aggregate to be used for concrete or bituminous mixes are gradation of grain sizes, particle shape, the presence or absence of contaminants, physical soundness, hardness and strength, skid resistance (only for pavement), chemical properties, volume-change characteristics, and specific gravity.
Gradation.—The grain-size distribution of particles in an aggregate as determined by mechanical sieving or screening is called gradation. Generally speaking, concrete aggregates should be well graded throughout the sand-and-gravel range of grain sizes, although gap grading (aggregates with particular grain sizes missing) can be used and may be necessary for some products. In most cases, grading in aggregates can be improved by processing to meet specifications.
Grading of concrete aggregate is most important in its effect on concrete proportions such as mixing-water requirements, cement content, and water-cement ratio, an in the subsequent handling characteristics and cost. Grading of sand has little or no material effect on the compressive strength of properly proportioned concrete, but it is important that the sand be uniform in character from batch to batch. In extremes, grading can affect the workability and finishing quality of concrete. In addition, either very fine or very coarse sand or coarse aggregate having either large deficiencies or excesses of any size fraction may be undesirable (Water and Power Resources Service, 1981).
The top size (maximum size) of the coarse fractions of concrete aggregate has an important effect on the water and cement requirements, with the necessary mixing-water content (and cement for lower strength concrete) decreasing as the maximum aggregate size increases. These reductions are possible because the coarser aggregate has less surface area and fewer surface voids, thus requiring less cement to make the concrete workable.
12

For high strength concrete, coarse aggregate with a maximum size in the ½-inch range may work best.
The grading of aggregates for bituminous mixes may be different from that of concrete aggregates. The grading commonly varies greatly, depending on the pavement design. Specific grading requirements are beyond the scope of this report.
Maximum particle size of aggregates for bituminous mixes may also differ greatly from that of concrete aggregate. It has been observed that using particles larger than 1 inch in graded mixtures often results in mixtures that are unworkable and that have surface voids which may lead to raveling (Goetz and Wood, 1960).
Particle shape.—Allowable grading limits of aggregates depend somewhat on particle shape and surface characteristics. In portland-cement-concrete aggregate, a sand composed of smooth, well-rounded surfaces normally can be more coarsely graded than a sand with sharp, angular edges and rough surfaces, due to the freedom of movement of the aggregate in fresh concrete. Round, smooth sands require less mixing water in concrete and thus produce better strength at the same cement content because a lower water-cement ratio can be used. Angular sands, in addition to requiring more mixing water, may not be workable enough for applications such as pumping of concrete.
Particle shape also affects the workability of concrete aggregate. Flat or angular particles, such as those obtained through crushing, have a detrimental effect on workability. In general, the presence of about 25 percent or less of lat or elongate particles in any size range has no important effect on workability; a higher percentage generally requires a greater percentage of sand in the mixture, which requires more water and cement (Water and Power Resources Service, 1981).
Because intergranular contact provides the strength in bituminous mixes, angular particles are generally desirable for these mixes. However, excess flat or elongate particles may be harmful. Therefore, as with concrete aggregate, aggregate for bituminous mixes should be reasonably free of flat or elongate particles. Smooth surfaces on aggregates may be easy to coat with bitumen, but they offer little assistance in holding the aggregate in place. ASTM specifications call for a specified minimum amount of particles with fractured faces to be used in bituminous mixes (Goetz and Wood, 1960).
Contaminants.—The presence of excessive amounts of contaminants, including silt, clay, mica, and organic materials, may (1) cause decreased strength and durability, (2) affect the quality of the bond between the cement and the aggregate, (3) cause an unsightly appearance, and (4) inhibit the hydration of the cement. These contaminants commonly can be reduced to acceptable levels during processing.
Physical soundness.—Physical soundness is usually considered to be the ability of an aggregate to resist
weathering, particularly freezing-thawing and wetting-drying cycles. Generally aggregates that contain weak, cleavable, absorptive, or swelling particles are not suitably sound. Examples are shales, clayey rocks, some very coarse crystalline rocks, and porous cherts (Neville, 1973). Specifications for soundness are similar for aggregates to be used in concrete or bituminous mixes.
The most important physical property of rock particles affecting weathering resistance (particularly freezing-thawing) is the size, abundance, and continuity of pores and channels (McLaughlin and others, 1960). These provide conduits for the passage of water, which in turn accelerate the weathering process.
Hardness and strength.—Hardness and strength characteristics of aggregates determine their ability to resist mechanical breakdown. These properties are generally controlled by the individual mineral constituents of rock particles, the strength with which these minerals are locked or cemented together, and the frequency of fractures. Particles consisting of minerals with a low degree of hardness are considered to be soft; those which are easily broken down, due to weak bonding or cementation or to fracturing, are considered to be weak (McLaughlin and others, 1960). Soft or weak particles are deleterious in aggregates because they break down during handling, thus affecting the grading of the aggregates, and because they perform poorly in use.
Mechanical breakdown of aggregates due to the action of mixers, mechanical equipment, and (or) traffic, or breakdown due to weathering is referred to as aggregate degradation. Mechanical breakdown can occur due to compressive failure of grains at points of contact, as well as to abrasive action of grains on each other. Mechanical breakdown is generally of greater significance in bituminous pavements than in concrete pavements.
Skid resistance.—Aggregates that are to be used in concrete or bituminous mixes for surface courses in highway construction should possess high polishing resistance. In general, the hardness of the minerals in an aggregate controls the polishing resistance of the aggregate. This polishing, in turn, determines the skid resistance of pavements. Although skidding can be a problem for both concrete and bituminous pavements, the significant factors may be different. Coarse-aggregate hardness is more important in bituminous pavements than in concrete pavements because there is greater exposure of individual pieces of coarse aggregate in the pavement generally is controlled by the fine aggregate portion of the mixture because the coarse aggregate will not be exposed at the surface until significant wear has taken place (Witczak, 1972; Renninger and Nichols, 1977).
Chemical properties.—Chemical properties of aggregate are important in the manufacture of concrete or bituminous mixes. Ideally, the aggregate is an inert filler and should not change chemically in place. However, some aggregates contain minerals that chemically react
13

with or otherwise affect the concrete or bituminous mixes. In concrete, these chemical processes are reactions between the aggregate and cement, solution of soluble materials, or oxidation of constituents. In bituminous mixes, chemical factors may influence the oxidation of the asphalt or the stripping of the bituminous film from aggregates.
Chemical reactions between aggregate and cement are of two basic types: alkali-silica reaction and alkali-carbonate reaction. Alkali-silica reaction may occur when rocks containing glassy, high-silica minerals are used as concrete aggregate. These include volcanic rocks having noncrystalline silica content, such as rhyolites and rhyolitic tuffs, dacites and dacite tuffs, and andesite, and other rocks including reactive types of cherts (opaline or chalcedony), flints, and siliceous limestones. The alkalis in the cement react with certain silica in the aggregate forming a gel around the aggregate. This gel has an increased volume and causes deterioration of the concrete (Lerch, 1955; Neville, 1973). The problem can generally be controlled by limiting the alkali content of the cement.
Alkali-carbonate reaction (also known as dedolomitization) occurs when dolomite limestones are used as concrete aggregate. The reaction is similar to the alkali-silica reaction although no visible gel is formed. Rocks potentially susceptible to alkali-carbonate reaction are dolomitic limestones in which the dolomite constitutes 40-60 percent of the total carbonate fraction of the rock, in which there is a 10-20 percent clay fraction, and in which a texture of small dolomite crystals is scattered throughout a matrix of extremely fine grained calcite and clay (Hadley, 1961).
Aggregates that are high in silica content may present a different problem when used in bituminous mixes. The bituminous film may be stripped or separated from the aggregate through the action of water. These materials are called hydrophilic (water-loving). Rock types having low silica contents generally tend to hold bituminous coatings somewhat better in the presence of water, and they are called hydrophobic (water-hating). The ability of aggregates to avoid stripping can be improved by means of chemical additives (Goetz and Wood, 1960).
Solution of soluble materials is seldom a serious problem in aggregates. However, occasional units of rock or sand and gravel contain sufficient quantities of water-soluble substances (such as gypsum), occurring as coatings or seam fillings, to cause difficulties when used as concrete aggregate (McLaughlin and others, 1960).
Oxidation commonly occurs in aggregates that contain sulfide minerals. This oxidation produces stains and loss of strength in concrete. In addition, oxidation may generate soluble sulfate compounds that react with the cement matrix causing volume increases and associated popouts or cracking (Water and Power Resources Service, 1981).
Volume changes.—Volume changes are generally of concern for aggregates to be used in concrete. Volume changes that result from wetting and drying occur in three basic ways. First, particles containing expandable clay minerals such as montmorillonite expand significantly when wet and contract when dry. Second, particles of high compressibility, such as certain weak sandstones, may fail to resist shrinkage of concrete. Third, using aggregates with poor shapes or surface textures can increase water usage and thus cause greater shrinkage as drying takes place (McLaughlin and others, 1960).
Volume changes may also be due to the thermal properties of aggregates, primarily the thermal coefficient of expansion. Average coefficients of expansion (in millionths per degree Fahrenheit) for some common rock types found in aggregates are shown in table 2.
Thermal expansion is important in concrete highway pavements, because sufficient space at the joints must be allowed for lengthening and shortening of slabs, and in other types of concrete construction. Damaging internal stresses may occur when aggregates used for structures such as thermal-generating facilities have substantially different thermal coefficients than the cement paste. Instances of cracking and spalling have been attributed to differences in thermal coefficients of expansion; however, even when such failure is theoretically possible, proof is infrequent and doubtful (Water and Power Resources Service, 1981).
Specific gravity.—Specific gravity of aggregate is of significance when design or structural considerations require that concrete have a maximum or minimum weight. It may also be a useful general indicator of the suitability of an aggregate. Very low specific gravity frequently indicates aggregate that is porous, weak, or absorptive; high specific gravity generally indicates quality aggregate. These, of course, are only indicators, and they must be substantiated by other tests and examination of the service record of the aggregate in similar construction.
14

MARGINAL AGGREGATES AND SUBSTITUTES FOR NATURAL AGGREGATES
Marginal Aggregates
Marginal aggregates (“borderline” aggregates of Dolar-Mantuani) are aggregates that “have deficiencies which do not make them clearly unacceptable but which leave some uncertainty about their possible adverse effect on either the concrete strength or its durability or both” (Dolar-Mantuani, 1976). When possible, specifications may be adjusted to make marginal aggregates acceptable. If not, a number of other alternatives exist. These include the following: 91) adding a suitable aggregate to the mix to achieve an acceptable overall quality, (2) removing deleterious minerals from the aggregate by various processing techniques, (3) making adjustments during processing (recrushing to change particle shape), and (4) making adjustments in the cement mixtures or bituminous mixes.
Substitutes
In areas where even marginal aggregates are not available economically, it may be necessary to use substitutes for natural aggregates in order to avoid large transportation costs. Slag, a waste product of iron and steel production, has been used as a substitute for natural aggregates. In iron-and-steel-producing areas, slag provides an excellent source of aggregate. Approximately 25 million tons were used as road base, fill, and concrete and bituminous aggregate during 1981 (U.S. Bureau of Mines, 1982).
Lightweight aggregate can be manufactured from clay and shale by expanding them through firing (McNarl, 1975) and from some types of mineral, industrial, and municipal waste materials (Aleshin and Bortz, 1976). Lightweight aggregate may actually be preferred in some types of construction.
Other substitutes for crushed stone and sand and gravel aggregates and examples of where they have been used include caliche used in Arizona, Texas, and New Mexico; limonite used in Texas; “clinker” (clay fired by underground coal fires) used in Wyoming, Montana, and North Dakota; and shells used in coastal states.
In all cases, the use of substitutes may require modifications to design specifications.
NATURAL AGGREGATE INDUSTRY
Exploration
In general, exploration techniques for commercial sand and gravel and crushed stone sources are quite
similar. The techniques described here apply to both; differences are pointed out if they are significant.
Even before field investigations begin, preliminary target areas of exploration for natural aggregates are commonly determined by the needs of the producer. General criteria that determine a target area of economic interest include proximity to market and certain socioeconomic considerations.
Because natural aggregate is a high-bulk, low-cost commodity, the transportation cost to the market is a significant factor in the final cost of the aggregate. Therefore, in an urban area, minimizing shipping distances is beneficial. The maximum shipping distance defines a crude target area. Obviously, in areas where aggregate is in short supply, the target area increases in size.
Socioeconomic considerations also influence the initial target area. These considerations include relative property values, zoning restrictions, and other restrictions on mining. If a governmental jurisdiction has a policy of refusing mining permits, exploring in that area is futile. Similarly, mining may be encouraged in some areas, which then might be considered favorable target areas.
Preliminary field evaluation commonly is conducted by a geologist or an engineer with geologic experience. Geologic and topographic maps, geologic and engineering reports, and aerial photographs all aid in identifying areas for field investigations or, conversely, in ruling out areas that are unlikely to contain suitable materials. State geologic surveys and highway departments and the U.S. Geological Survey can provide much of this information.
Field reconnaissance to locate aggregate deposits involves standard geologic investigative techniques. These include field studies of natural exposures such as stream cuts, cliff areas, and other natural outcroppings, and artificial exposures such as highway and railroad cuts and abandoned or active pits and quarries. These studies commonly involve visual observations and the use of hand-sampling techniques such as shallow shovel holes and portable powered-auger or coring equipment.
One of the most important aspects of field reconnaissance is the determination of rough estimates of the areal extent and volumes of aggregates. In order for a commercial operation to amortize costs, there should be sufficient reserves for about 15-20 years or more of production. Field observations should also include information concerning mineralogy, texture, thickness of overburden, water availability, and road access to the area.
Detailed exploration depends on the specific uses of the aggregate. Bulk samples are collected for laboratory analysis. Near-surface samples of sand and gravel can be collected using power equipment such as bulldozers, loaders, or back hoes. Collection of bulk samples of bedrock probably requires drilling and blasting. Deeper samples can be collected using truck-mounted power augers or drill rigs. In addition, seismic refraction may be used to determine the depth to bedrock, and electrical resistivity, to determine gross textural changes.
15
Mining and Processing Techniques
Sand and gravel aggregate is commonly mined in open pits or, if mined from rivers, streams, or other wet environments, by dredging. Open-pit mining and processing consist of four major stages: site preparation, mining, processing, and reclamation. The first step in site preparation involves clearing of trees and other vegetation; stripping, transporting, and storing topsoil; and removal of other overburden. The next step involves the construction of fences, buffer zones, roadways, and sediment traps, and the construction or installation of permanent or portable processing equipment.
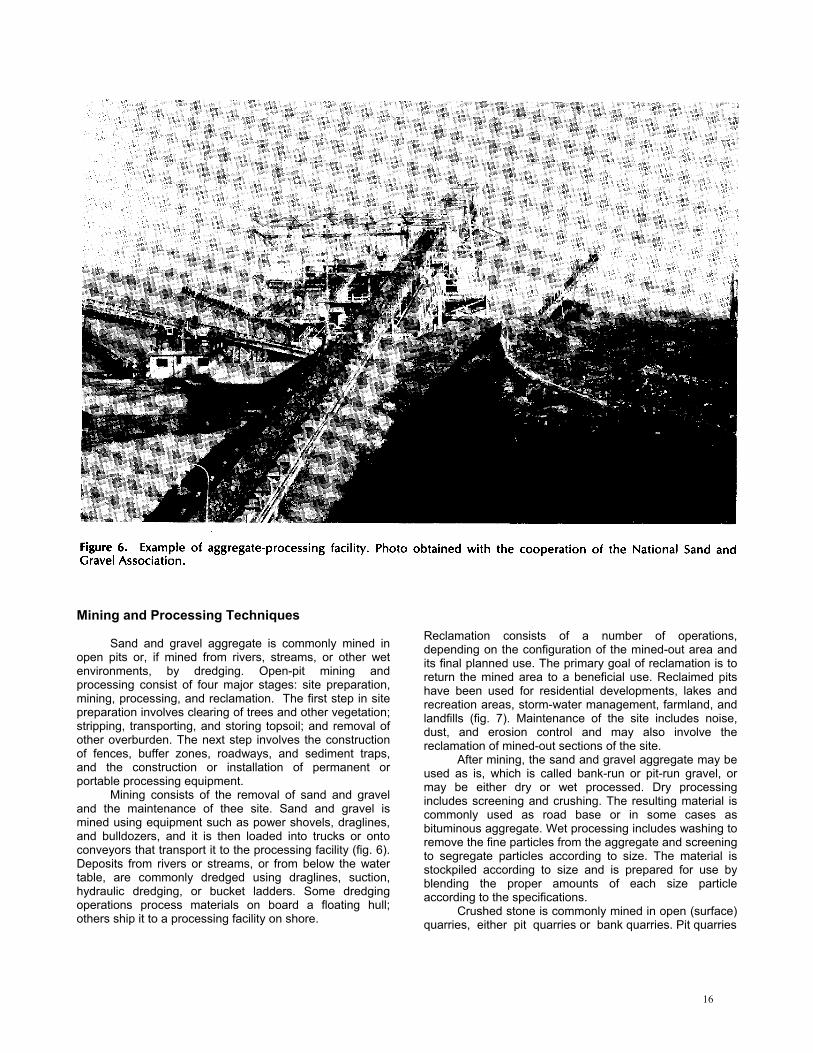
Mining consists of the removal of sand and gravel and the maintenance of thee site. Sand and gravel is mined using equipment such as power shovels, draglines, and bulldozers, and it is then loaded into trucks or onto conveyors that transport it to the processing facility (fig. 6). Deposits from rivers or streams, or from below the water table, are commonly dredged using draglines, suction, hydraulic dredging, or bucket ladders. Some dredging operations process materials on board a floating hull; others ship it to a processing facility on shore.
Reclamation consists of a number of operations, depending on the configuration of the mined-out area and its final planned use. The primary goal of reclamation is to return the mined area to a beneficial use. Reclaimed pits have been used for residential developments, lakes and recreation areas, storm-water management, farmland, and landfills (fig. 7). Maintenance of the site includes noise, dust, and erosion control and may also involve the reclamation of mined-out sections of the site.
After mining, the sand and gravel aggregate may be used as is, which is called bank-run or pit-run gravel, or may be either dry or wet processed. Dry processing includes screening and crushing. The resulting material is commonly used as road base or in some cases as bituminous aggregate. Wet processing includes washing to remove the fine particles from the aggregate and screening to segregate particles according to size. The material is stockpiled according to size and is prepared for use by blending the proper amounts of each size particle according to the specifications.
Crushed stone is commonly mined in open (surface) quarries, either pit quarries or bank quarries. Pit quarries
16

are found where the relief is generally low, and operators must excavate downward to obtain the rock. Bank quarries are found in areas of greater relief where operators can excavate laterally and where the rock can be blasted down to the level of the quarry. As of 1977, 95 percent of the crushed stone produced in the United States was produced from surface mines (Reed, 1978), although interest in the underground mining of crushed stone is growing.
The procedures for mining crushed stone are similar to the four stages of sand and gravel mining. The site must first be cleared of trees and other vegetation. Overburden must next be removed. In some areas this may include removal and processing of sand and gravel. Where the overburden is unsuited for aggregate, it is commonly stockpiled and (or) used as fill. The mining operation starts with drilling the rock using rotary, percussion, or churn drills. The rock is then blasted with dynamite, ammonium nitrate/fuel oil mixtures (AN/FO), or other explosives. Secondary breakage is commonly done with drop hammers. Next, the material is crushed and processed much like sand and gravel aggregate; the difference is that more crushing is generally required.
Each time aggregate is handled or processed, additional cost is added to the final product. Because aggregate has a very low cost margin, the processing techniques demand efficiency.
Uses of Natural Aggregate
Sand and gravel and crushed stone are nationally used commodities which are important elements in many industries in the United States. Sand and gravel (or sand alone) can be used for industrial purposes such as in foundry operations; in glass manufacturing, as an abrasive; and in filtration beds of water treatment facilities. Crushed stone is used as a source of calcium for fertilizers, as a metallurgic fluxstone, and as the major resource in the production of cement and lime. It may also be used in filtration systems and in the manufacture of glass.
Sand and gravel and crushed stone, however, are used most often in construction. During 1980, 96 percent of the sand and gravel consumed and 77 percent of the crushed stone consumed were used as aggregate by the
17
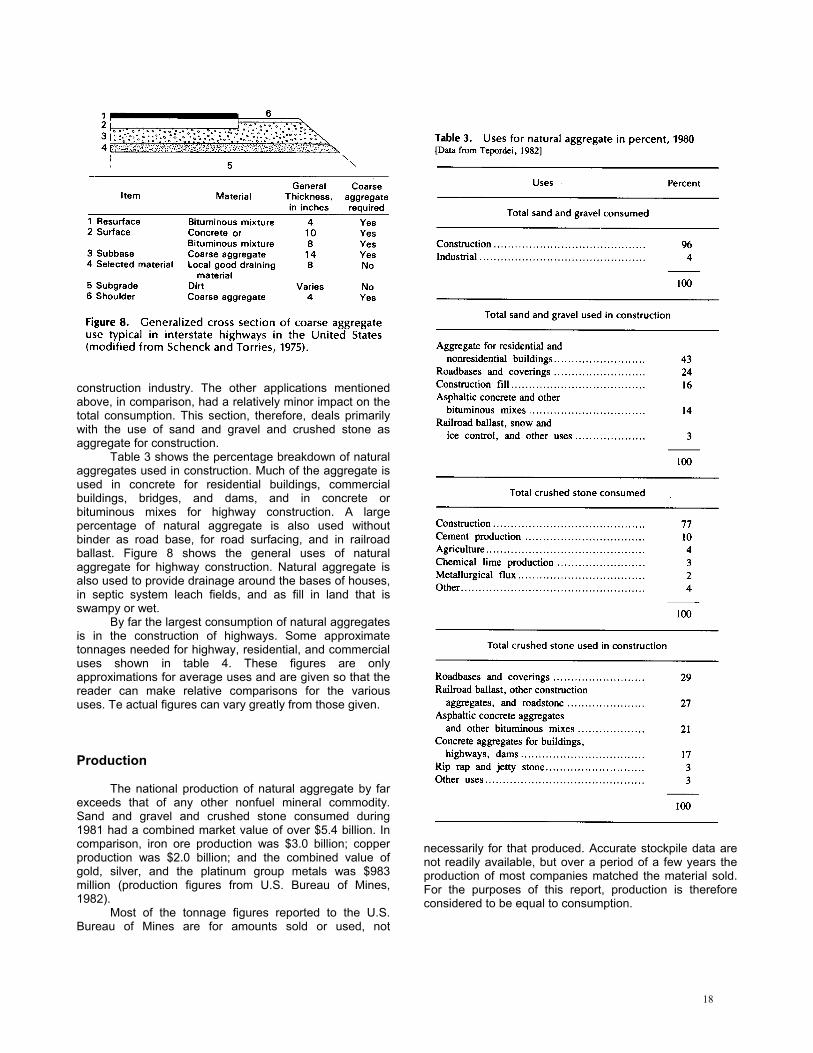
construction industry. The other applications mentioned above, in comparison, had a relatively minor impact on the total consumption. This section, therefore, deals primarily with the use of sand and gravel and crushed stone as aggregate for construction.
Table 3 shows the percentage breakdown of natural aggregates used in construction. Much of the aggregate is used in concrete for residential buildings, commercial buildings, bridges, and dams, and in concrete or bituminous mixes for highway construction. A large percentage of natural aggregate is also used without binder as road base, for road surfacing, and in railroad ballast. Figure 8 shows the general uses of natural aggregate for highway construction. Natural aggregate is also used to provide drainage around the bases of houses, in septic system leach fields, and as fill in land that is swampy or wet.
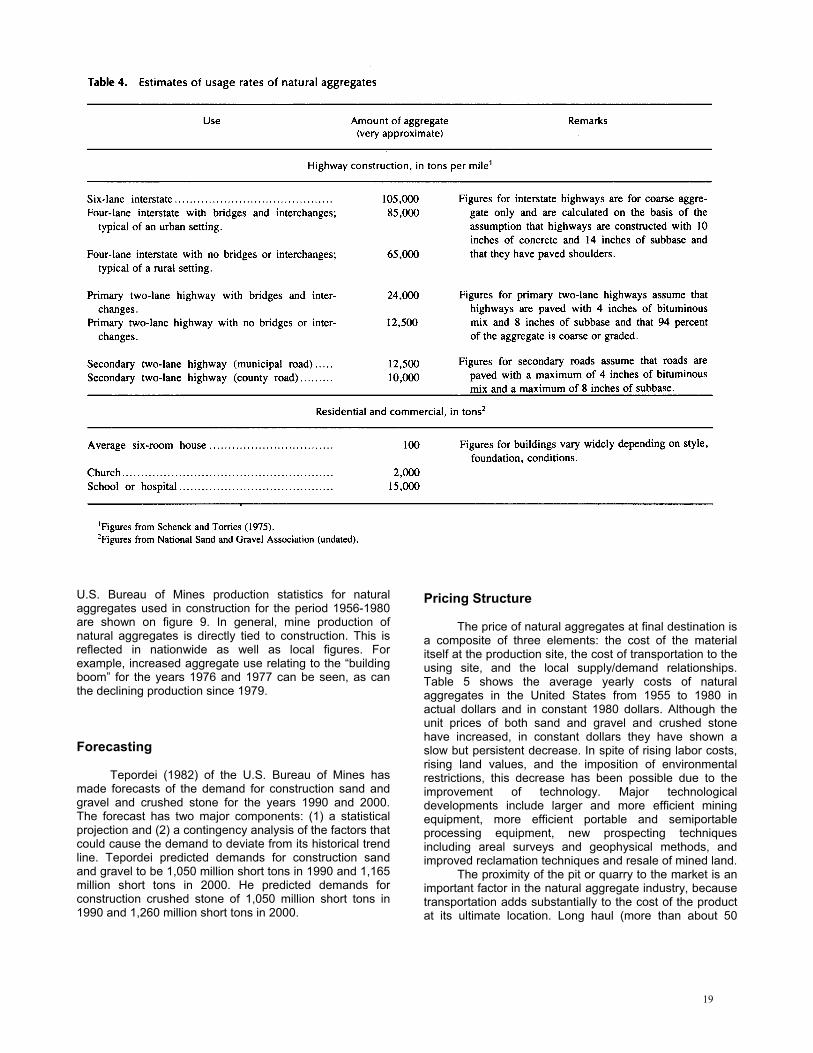
By far the largest consumption of natural aggregates is in the construction of highways. Some approximate tonnages needed for highway, residential, and commercial uses shown in table 4. These figures are only approximations for average uses and are given so that the reader can make relative comparisons for the various uses. Te actual figures can vary greatly from those given.
Production
The national production of natural aggregate by far exceeds that of any other nonfuel mineral commodity. Sand and gravel and crushed stone consumed during 1981 had a combined market value of over $5.4 billion. In comparison, iron ore production was $3.0 billion; copper production was $2.0 billion; and the combined value of gold, silver, and the platinum group metals was $983 million (production figures from U.S. Bureau of Mines, 1982).
Most of the tonnage figures reported to the U.S. Bureau of Mines are for amounts sold or used, not
necessarily for that produced. Accurate stockpile data are not readily available, but over a period of a few years the production of most companies matched the material sold. For the purposes of this report, production is therefore considered to be equal to consumption.
18
U.S. Bureau of Mines production statistics for natural aggregates used in construction for the period 1956-1980 are shown on figure 9. In general, mine production of natural aggregates is directly tied to construction. This is reflected in nationwide as well as local figures. For example, increased aggregate use relating to the “building boom” for the years 1976 and 1977 can be seen, as can the declining production since 1979.
Forecasting
Tepordei (1982) of the U.S. Bureau of Mines has made forecasts of the demand for construction sand and gravel and crushed stone for the years 1990 and 2000. The forecast has two major components: (1) a statistical projection and (2) a contingency analysis of the factors that could cause the demand to deviate from its historical trend line. Tepordei predicted demands for construction sand and gravel to be 1,050 million short tons in 1990 and 1,165 million short tons in 2000. He predicted demands for construction crushed stone of 1,050 million short tons in 1990 and 1,260 million short tons in 2000.
Pricing Structure
The price of natural aggregates at final destination is a composite of three elements: the cost of the material itself at the production site, the cost of transportation to the using site, and the local supply/demand relationships. Table 5 shows the average yearly costs of natural aggregates in the United States from 1955 to 1980 in actual dollars and in constant 1980 dollars. Although the unit prices of both sand and gravel and crushed stone have increased, in constant dollars they have shown a slow but persistent decrease. In spite of rising labor costs, rising land values, and the imposition of environmental restrictions, this decrease has been possible due to the improvement of technology. Major technological developments include larger and more efficient mining equipment, more efficient portable and semiportable processing equipment, new prospecting techniques including areal surveys and geophysical methods, and improved reclamation techniques and resale of mined land.
The proximity of the pit or quarry to the market is an important factor in the natural aggregate industry, because transportation adds substantially to the cost of the product at its ultimate location. Long haul (more than about 50
19

miles) generally is by ship, barge, or rail; short haul (less than about 50 miles) by truck. Barge costs for transportation of aggregate may be one or two cents per ton per mile; rail is slightly more expensive. Rates for shipping natural aggregate by truck are approximately 35 cents per ton per mile for the first mile and 7 cents per ton per mile thereafter. Locally costs may be substantially higher. A general rule of thumb is that when aggregates are moved more than 25 miles by truck, the cost of transportation equals or exceeds the f.o.b. quarry price of the product (National Academy of Sciences, 1980).
The cost to extract the aggregate, transportation costs, and local market conditions determine the final cost of aggregate to the consumer. These costs vary widely across the country. Table 6 shows the final costs of aggregate at selected cities in the United States. These are average costs reported by Engineering News Record (1982); lower costs could probably be negotiated for large contract operations.
Preemption of Natural Aggregate Resources
The previous section points out that transportation adds significantly to the cost of aggregate, because it is a high-bulk, low-value commodity. Therefore, economic reasons require that the site and processing facilities be located near population centers.
However, the average citizen is not aware of his dependency on aggregate, because he purchases little, if any, aggregate himself. The noise, traffic, dust, and unsightly appearance associated with mining operations make them unattractive neighbors. As a result, the average citizen does not recognize aggregate mining as a necessary land use and sees no reason why it should be located near his community.
As an urban area expands, the growth itself may cut off the market. This commonly happens in the following sequence. As an area begins to grow, it creates a market for construction materials. The aggregate industry expands and opens new facilities near the market area, as dictated by the resource availability. Urban growth spreads into the rural areas and gradually encroaches on the aggregate
20

mines to the point where homes may actually surround the mining operations. Expansion of the existing operation becomes nearly impossible. In addition, local residents may complain of the operation. Continued pressure might result in ordinances restricting operating conditions and truck routes.
In addition to restricting operations, urban growth often creates land-use conflicts that result in prohibition of the development of potential sources of aggregate. When houses or other structures are built over aggregate resources, the resulting value of the land will probably preclude the development of the aggregate at the location. This occurs frequently in the case of sand and gravel deposits, because these deposits commonly are located in relatively flat, well-drained areas that are easily developed sites. In addition, zoning regulations and other ordinances may restrict mining in areas of aggregate resources.
The effects of restricting aggregate development by land use or zoning will be demonstrated by a study being conducted by Karen Kuff of the Maryland Geological Survey. This study is being undertaken to determine the rates of preemption of lands for potential mineral development in Anne Arundel County, Maryland. Maps
showing restrictive zoning, mined lands, and incompatible land use are overlaid on a map showing areas of potential aggregate resources. Areas of available aggregate are then computed. Preliminary figures from this study are shown on a graph (fig. 10). As can be seen, potential aggregate is being preempted at a fairly constant and rapid rate (Kuff, written commun., 1982).
CONCLUSION
Natural aggregates are widely distributed throughout the United States and occur in a variety of geologic environments; however, they are not universally available. Some areas lack quality aggregate or may be covered with sufficient overburden to make surface mining impractical. Economic factors require that pits or quarries be located near population centers. However, residential communities commonly desire that mining operations be conducted far from their boundaries. Thus, competing land-use plans, zoning requirements, and various regulations frequently prohibit aggregate extraction. Furthermore, the average
21

citizen commonly does not support regulations favoring mining because he does not recognize his dependence upon natural aggregates. He personally buys little, if any, aggregate himself and does not recognize aggregate mining as a necessary land use, even though there is a constant community need for the commodity.
Because aggregate will continue to be in demand, provisions for uninterrupted economical supplies must be made. Proper long-range planning and zoning techniques can help assure adequate supplies of aggregate, while they simultaneously protect the public from the unwanted effects of mining operations. Any such plans should incorporate a multiple land-use program including (1) protection and conservation of natural resources, (2) plans for development of resources in relation to market needs and environmental considerations, and (3) a useful and acceptable end-use for worked-out areas (Carter, 1975). These planning procedures are beyond the scope of this report; however, American Planning Association Report No. 347, “Sand and Gravel Resources: Protection, Regulation, and Reclamation” (Werth, 1980), describes a number of techniques currently in practice.
SOURCES OF DATA
General References
The references consulted in preparing the data for most of the nation are listed below and will not be repeated under each individual State listing.
Davies, W. E., Simpson, J. H., Ohlmacher, G. C., Kirk, W. S., and Newton, E. G., 1977, Map showing engineering aspects of karst in the United States: U.S. Geological Survey Open-File Report 76-623, scale 1:7,500,000.
French, A. E., 1967, Mineral raw materials for construction [map]: U.S. Geological Survey National Atlas, p. 182-183, scale 1:7,500,000.
Hubbard, H. A., and Ericksen, G. E., 1973, Limestone and dolomite, in Brobst, D. A., and Pratt, W. P., eds., United States mineral resources: U.S. Geological Survey Professional Paper 820, p. 357-364.
Hunt, C. B., 1977, Surficial geology of the United States [map]: U.S. Geological Survey Open-File Report 77-232, scale 1:7,500,000.
King, P. B., and Beikman, H. M., 1974, Geologic map of the United States: U.S. Geological Survey, scale 1:2,500,000.
Regional references were consulted in delineating the limits of region I or the distribution of glacial deposits on plate 1; these are listed below and will not be repeated under each individual State listing.
Crandell, D. R., 1965, The glacial history of western Washington and Oregon, in Wright, H. E., Jr., and Frey, D. G., eds., The Quaternary of the United States: Princeton, NJ, Princeton University Press, p. 341-345.
National Research Council, compiled and edited by a committee of the Division of Earth Sciences, 1959, Glacial map of the United States east of the Rocky Mountains: Geological Society of America, scale 1:7,500,000.
Richmond, G. M., 1965, Glaciation of the Rocky Mountains, in Wright, H. E., Jr., and Frey, D. G., eds., The Quaternary of the United States: Princeton, NJ, Princeton University Press, p. 217-230.
Richmond, G. M., Fryxell, Roald, Neff, G. E., and Weis, P. L., 1965, The Cordilleran Ice Sheet of the northern Rocky Mountains and related Quaternary history of the Columbia Plateau, in Wright, H. E., Jr., and Frey, D. G., eds., The Quaternary of the United States: Princeton, NJ, Princeton University Press, p. 231-242.
Wahrhatfig, Clyde, and Birman J. H., 1965, The Quaternary of the Pacific Mountain systems in California, in Wright, H. E., Jr., and Frey, D. G., eds., The Quaternary of the United States: Princeton, NJ, Princeton University Press, p. 299-340.
The references that were consulted in delineating the offshore sand and gravel deposits on plate 1 are listed below and will not be repeated under each individual State listing.
Hollister, C. D., 1973, Atlantic continental shelf and slope of the United States—Texture of surface sediments
22
from New Jersey to southern Florida: U.S. Geological Survey Professional Paper 529-M, p. M1-M23.
Moore, G. W., and Luken, M. D., 1979, Offshore sand and gravel resources of the Pacific Northwest: Oregon Geology, Oregon Department of Geology and Mineral Industries, v. 41, no. 9, p. 143-151.
Schlee, John, and Pratt, R. M., 1970, Atlantic continental shelf and slope of the United States—Gravels of the northeastern part: U.S. Geological Survey Professional Paper 529-H, p. H1-H39.
Venkataranthnam, Kolla, and McManus, D. A., 1973, Origin and distribution of sands and gravels on the northern continental shelf of Washington: Journal of Sedimentary Petrology, v. 43, no. 3, p. 799-811.
Welday, E. E., and Williams, J. W., 1975, Offshore geology of California [map]: State of California Department of Conservation, scale 1:500,000.
State Listings
This section lists by State the sources of data used in compiling plates 1 and 2. In addition, plates 1 and 2 were sent to the State geological surveys and highway departments for their review and comments. The comments of the State agencies are greatly appreciated; however, their comments do not necessarily represent and endorsement of these maps. Furthermore the responding State agencies neither officially approved the maps nor do they have any official responsibility for the data shown on the maps or discussed in the report.
Alabama (3)
Murphy, T. D., 1960, Distribution of silica resources in eastern United States: U. S. Geological Survey Bulletin 1072-L, p. 657-665.
Szabo, M. W., 1967, Sand and gravel in Alabama—A summary report: Geological Survey of Alabama, Division of Economic Geology, 41 p.
Arizona (3)
Baker, Simon, and McCleneghan, T. J., eds., 1966, An Arizona economic and historic atlas: Tucson, University of Arizona, and the Phoenix Valley National Bank, 40 p.
Keith, S. B., 1969, Sand and gravel, in Mineral and water resources in Arizona: U.S. Geological Survey, Arizona Bureau of Mines, and U.S. Bureau of Reclamation, p. 424-441.
Arkansas (2)
Branner, G. C., 1942, Mineral resources of Arkansas: Arkansas Geological Survey Bulletin 6, 101 p.
Fisk, H. N., 1944, Geological investigation of the alluvial valley of the lower Mississippi River: Vicksburg, Miss., Vicksburg Mississippi River Commission, 78 p.
Haley, B. R., 1976, Geologic map of Arkansas: U.S. Geological Survey, scale 1:500,000.
California (3)
Goldman, H. B., 1966, Sand and gravel, in Mineral and water resources of California: U.S. Geological Survey, California Division of Mines and Geology, and U.S. Bureau of Mines, p. 361-369.
-----------1968, Sand and gravel in California—An inventory of deposits: California Division of Mines and Geology Bulletin 180, pts. A, 38 p.; B, 58 p.; and C, 56 p.
Jennings, C. W., assisted by Strand, R. G., and Rogers, T. H., 1977, Geological map of California: California Division of Mines and Geology, scale 1:750,000.
Colorado (2)
Schwochow, S. D., Shroba, R. R., and Wicklein, D. C., 1974, Sand, gravel, and quarry aggregate resources, Colorado Front Range counties: Geological Survey of Colorado Special Publication 5-A, 43 p., map scale 1:250,000.
Tweto, Ogden, 1979, Geologic map of Colorado: Geological Survey of Colorado, scale 1:500,000.
Connecticut
Only those sources listed under general references.
Delaware (1)
U.S. Geological Survey, 1964, Map showing surficial geology and extent of glaciation in the Delaware River basin and New Jersey: U.S. Geological Survey Professional Paper 381, plate 7, scale 1:500,000.
Florida (3)
Cook, C. W., 1945, Geologic map of Florida: Florida Geological Survey and U.S. Geological Survey, approximate scale 1:1,000,000.
Murphy, T. D., 1960, Distribution of silica resources in eastern United States: U.S. Geological Survey Bulletin 1072-L, p. 657-665.
Scott, T. M., Hoenstine, R. W., Knapp, M. S., Lane, Ed, Ogden G. M., Jr., Deuerling, Richard, and Neel, H. E., 1980, The sand and gravel resources of Florida: Florida Bureau of Geology Report of Investigations 90, 41 p.
23
Schmidt, Walter, Hoenstine, R. W., Knapp, M. S., Lane, Ed, Ogden, G. M., Jr., and Scott, T. M., 1979, The limestone, dolomite and coquina resources of Florida: Florida Bureau of Geology Report of Investigations 88, 54 p.
Vernon, R. O., and Puri, H. S., 1965, Florida geology: U.S. Geological Survey and Florida Board of Conservation Map Series 18, scale 1:2,000,000.
Georgia (3)
Ericksen, G. E., and Cox, D. P., 1968, Limestone and dolomite, in Mineral Resources of the Appalachian region: U.S. Geological Survey Professional Paper 580, p. 163-167.
Maxwell, C. H., Frendzel, D. J., and Stansfield, R. G., 1968, Sand and gravel, in Mineral Resources of the Appalachian region: U.S. Geological Survey Professional Paper 580, p. 254-261.
Teas, L. P., 1921, Preliminary report on the sand and gravel deposits of Georgia: Georgia Geological Survey Bulletin 37, 392 p.
Idaho
Only those sources listed under general references.
Illinois (3)
Illinois State Geological Survey, undated (received 1976), Sand and gravel resources of Illinois [map]: scale 1:1,000,000.
Lineback, J. A., 1979, Quaternary deposits of Illinois [map]: Illinois State Geological Survey, scale 1:500,000.
Indiana (3)
Indiana Geological Survey, 1979, Map of Indiana showing unconsolidated deposits: Indiana Geological Survey Miscellaneous Map 26, no scale.
Wayne, W. J., 1960, Map of Indiana showing glacial deposits: Indiana Geological Survey Report of Progress 17, plate 1, scale 1:1,000,000.
Iowa (3)
Iowa Geological Survey, 1969, Bedrock of Iowa [map]: no scale.
-----------1976, Quaternary terrain and materials in Iowa [map]: no scale.
Kansas (3)
Kulstad, R. O., and Nixon, E. K., 1951, Kansas pits and quarries: State Geological Survey of Kansas Bulletin 90, pt. 1, 12 p.
State Geological Survey of Kansas, 1964, Geologic map of Kansas: University of Kansas and State Geological Survey of Kansas, scale 1:500,000.
Kentucky (3)
Ericksen, G. E., and Cox, D. P., 1968, Limestone and dolomite, in Mineral Resources of the Appalachian region: U.S. Geological Survey Professional Paper 580, p. 163-167.
Johnson, J. H., Stapleton, J. M., and McGrain, Preston, compilers, 1962, Mineral resources and mineral industries of Kentucky [map]: Kentucky Department of Commerce and Kentucky Geological Survey, scale 1:500,000.
Maxwell, C. H., Frendzel, D. J., and Stansfield, R. G., 1968, Sand and gravel, in Mineral Resources of the Appalachian region: U.S. Geological Survey Professional Paper 580, p. 254-261.
McGrain, Preston, 1983, Geology of construction materials in Kentucky, in Ault, C. H., and Woodard, G. S., eds., Proceedings of the 18th forum on geology of industrial materials: Bloomington, Indiana, Geological Survey Department of Natural Resources Occasional Paper 37, p. 127-142.
-----------1982, Overview of sand and gravel resources of Kentucky: Kentucky Geological Survey Series XI, Report of Investigations 1, 19 p.
Louisiana (3)
Fisk, H. N., 1944, Geological investigation of the alluvial valley of the lower Mississippi River: Vicksburg, Miss., Vicksburg Mississippi River Commission, 78 p.
Woodward, T. P., and Gueno, A. J., Jr., 1941, Generalized map of Louisiana showing regions of gravel exposures, in The sand and gravel deposits of Louisiana: Louisiana Geological Survey Bulletin 19, 429 p.
Maine (3)
Only those sources listed under general references.
Maryland (3)
Ericksen, G. E., and Cox, D. P., 1968, Limestone and dolomite, in Mineral Resources of the Appalachian region: U.S. Geological Survey Professional Paper 580, p. 163-167.
24

Thompson, Derek, Murphy, C. E., Wiedel, J. W., Porter, F. W., III, Roswell, C. A., and Harper, R. A., 1977, Atlas of Maryland: College Park, MD, University of Maryland, 116 p.
Massachusetts (2)
Only those sources listed under general references.
Michigan (3)
Michigan Geological Survey, 1969, Limestone resources of Michigan [map]: no scale.
Minnesota (3)
Schwartz, G. M., and Prokopovich, N., adapted from F Leverett, 1966, Map of mineral resources of Minnesota (inset showing main areas of sand and gravel): University of Minnesota, Minnesota Geological Survey, scale 1:1,000,000, inset has no scale.
Mississippi (3)
Bicker, A. R., Jr., 1970, Economic minerals of Mississippi: Mississippi Geological, Economic, and Topographic Survey Bulletin 112, 80 p.
Cross, R. D., ed., 1974, Sand, gravel, iron, and aluminum [map], in Atlas of Mississippi: Jackson, Miss., University Press of Mississippi, 187 p.
Missouri (3)
Fisk, H. N., 1944, Geological investigation of the alluvial valley of the lower Mississippi River: Vicksburg, Miss., Vicksburg Mississippi River Commission, 78 p.
Howe, W. B., 1980, Generalized geologic map of Missouri: Geology and Land Survey, Missouri Department of Natural Resources, no scale.
Martin, J. A., 1967, Sand and gravel, in Mineral and water resources of Missouri: U.S. Geological Survey and Missouri Division of Geological Survey and Water Resources, p. 196-203.
Missouri Geological Survey, 1979, Geologic map of Missouri: scale 1:500,000.
Wharton, H. M., Martin, J. A., Rueff, A. W., Robertson, C. E., Wells, J. S., and Kisvarsanyi, E. B., 1969, Missouri minerals—Resources, production, and forecasts: Missouri Geological Survey and Water Resources Special Publication 1, 303 p.
Montana (3)
Larrabee, D. M., and Shride, A. F., compilers, 1946a, Preliminary map showing sand and gravel deposits of Montana: U.S. Geological Survey Missouri Basin Studies 6, scale 1:500,000.
Ross, C. P., Andrews, D. A., and Witkind, I. J., compilers, 1955, Geologic map of Montana: U.S. Geological Survey, scale 1:500,000.
Nebraska (2)
Weeks, R. A., and Larrabee, D. M., compilers, 1948, Preliminary map showing sand and gravel deposits in Nebraska: U.S. Geological Survey Missouri Basin Studies 7, scale 1:750,000.
Nevada (2)
Olson, R. H., 1964, Sand and gravel, in Mineral and water resources of Nevada: U.S. Geological Survey and Nevada Bureau of Mines, p. 240-243.
Tagg, K. M., and others, compilers, 1964, Geologic map of Nevada, in Mineral and water resources of Nevada: U.S. Geological Survey and Nevada Bureau of Mines, facing p. 12, scale 1:2,500,000.
New Hampshire (1)
Only those sources listed under general references.
New Jersey (3)
U.S. Geological Survey, 1964, Map showing surficial geology and extent of glaciation in the Delaware River basin and New Jersey: U.S. Geological Survey Professional Paper 381, plate 7, scale 1:500,000.
New Mexico (3)
Austin, G. S., Kottlowski, F. E., and Siermers, W. T., 1982, Industrial minerals of New Mexico in 1981, in Austin, G. S., ed., Industrial rocks and minerals of the southwest: New Mexico Bureau of Mines and Mineral Resources Circular 182, p. 9-16.
Carter, W. D., 1965, Sand and gravel, in Mineral and water resources of New Mexico: U.S. Geological Survey, New Mexico Bureau of Mines and Mineral Resources and New Mexico Oil Conservation Committee, p. 353-358.
25
New Mexico State Highway Department, 1972, Geology and aggregate resources, District 2: New Mexico State Highway Department and U.S. Department of Transportation, 120 p.
New York (3)
Only those sources listed under general references.
North Carolina (2)
Murphy, T. D., 1960, Distribution of silica resources in eastern United States: U.S. Geological Survey Bulletin 1072-L, p. 657-665.
North Dakota (3)
Bluemle, J. P., 1977, Geologic map of North Dakota: North Dakota Geological Survey Miscellaneous Series Map 19, scale 1:1,000,000.
Ohio (2)
Goldthwait, R. P., White, G. W., and Forsyth, J. L., 1967, Glacial map of Ohio: U.S. Geological Survey Miscellaneous Investigations Series Map I-316, scale 1:500,000.
Oklahoma (3)
Branson, C. C., and Johnson, K. K., 1972, Generalized geological map of Oklahoma, in Geology and earth resources of Oklahoma: Oklahoma Geological Survey, 8 p., scale 1:2,000,000.
Oregon (3)
Peck, D. L., 1961, Geologic map of Oregon west of the 121st meridian: U.S. Geological Survey Miscellaneous Investigations Series Map I-325, scale 1:500,000.
Schlicker, H. G., 1969, Sand and gravel, in Mineral and water resources of Oregon: U.S. Geological Survey, Oregon Department of Geology and Mineral Industries, U.S. Bureau of Reclamation, Bonneville Power Administration, and U.S. Bureau of Mines, p. 233-235.
Walker, G. W., 1977, Geologic map of Oregon east of the 121st meridian: U.S. Geological Survey Miscellaneous Investigations Series Map I-902, scale 1:500,000.
Pennsylvania (3)
Maxwell, C. H., Frendzel, D. J., and Stansfield, R. G., 1968, Sand and gravel, in Mineral Resources of the Appalachian region: U.S. Geological Survey Professional Paper 580, p. 254-261.
Rhode Island (2)
Only those sources listed under general resources.
South Carolina (3)
Buie, B. F., 1949, Industrial minerals and rocks, in Shiver, H. E., Buie, B. F., and Eldredge, I. F., South Carolina raw materials: Columbia, SC, University of South Carolina Press, p. 85-219.
Murphy, T. D., 1960, Distribution of silica resources in eastern United States: U.S. Geological Survey Bulletin 1072-L, p. 657-665.
Smith, L. L., 1961, Economic mineral localities in South Carolina [map]: Columbia, SC, University of South Carolina Press, scale 1:780,000.
South Dakota (2)
Bruce, R. L., 1964, Sand and gravel, in Mineral and water resources of South Dakota: U.S. Geological Survey and South Dakota State Geological Survey, p. 93-96.
Tennessee
Ericksen, G. E., and Cox, D. P., 1968, Limestone and dolomite, in Mineral Resources of the Appalachian region: U.S. Geological Survey Professional Paper 580, p. 163-167.
Fisk, H. N., 1944, Geological investigation of the alluvial valley of the lower Mississippi River: Vicksburg, Miss., Vicksburg Mississippi River Commission, 78 p.
Hardeman, W. D., and Miller, R. A., 1959, Mineral resources and mineral industries of Tennessee [map]: Tennessee Department of Conservation and Commerce, Division of Geology, scale 1:500,000.
Tennessee Valley Authority, 1970, Mineral resources of the Tennessee Valley region [map]: scale 1:640,000.
Texas (3)
Garner, L. E., St. Clair, A. E., and Evans, T. J., compilers, 1979, Mineral resources of Texas [map]: University of Texas at Austin, Bureau of Economic Geology, scale 1:1,000,000.
26

Kier, R. S., Garner, L. E., and Brown, L. F., Jr., 1977, Land resources of Texas [map]: University of Texas at Austin, Bureau of Economic Geology, scale 1:500,000.
Utah (3)
Hintze, L. F., 1975, Geological highway map of Utah: Brigham Young University, Department of Geology, scale 1:1,000,000.
Van Horn, Richard, 1964, Sand and gravel, in Mineral and water resources of Utah: U.S. Geological Survey, Utah Geological and Mineralogical Survey, and Utah Water Power Board, p. 215-218.
Vermont (3)
Vermont Geological Survey, 1961, Centennial geologic map of Vermont: scale 1:250,000.
-----------1970, Surficial geologic map of Vermont: scale 1:250,000.
Virginia (3)
Ericksen, G. E., and Cox, D. P., 1968, Limestone and dolomite, in Mineral Resources of the Appalachian region: U.S. Geological Survey Professional Paper 580, p. 163-167.
LeVan, D. C., and Harris, W. B., 1971, Mineral resources of Virginia [map]: Virginia Department of Conservation and Economic Development and Division of Mineral Resources, scale 1:500,000.
Washington (1)
Huntting, M. T., Bennett, W. A. G., Livingston, V. E., and Moen, W. S., compilers, 1961, Geologic map of Washington: Washington Department of Conservation and Division of Mines and Geology, scale 1:500,000.
Valentine, G. M., revised by Huntting, M. T., 1961, Map showing principal areas of sand and gravel, in Inventory of Washington minerals: Washington Division of Mines and Geology Bulletin 37, pt. 1, v. 2, plate 34, scale approximately 1:2,125,000.
West Virginia (3)
Cardwell, D. H., Erwin, R. B., and Woodward, H. P., compilers, 1968, Geologic map of West Virginia: West Virginia Geological and Economic Survey, scale 1:250,000.
Ericksen, G. E., and Cox, D. P., 1968, Limestone and dolomite, in Mineral Resources of the Appalachian region: U.S. Geological Survey Professional Paper 580, p. 163-167.
Maxwell, C. H., Frendzel, D. J., and Stansfield, R. G., 1968, Sand and gravel, in Mineral Resources of the Appalachian region: U.S. Geological Survey Professional Paper 580, p. 254-261.
Wisconsin (3)
Dutton, C. E., 1976, Introduction, in Mineral and water resources of Wisconsin: U.S. Geological Survey, p. 1-8.
Friz, T. O., 1975, Wisconsin glacial deposits (from Thwaites, 1956), in Mineral resources, mining, and land use planning in Wisconsin: Wisconsin Geological and Natural History Survey, 61 p.
Hadley, D. W., 1976, Crushed stone, in Mineral and water resources of Wisconsin: U.S. Geological Survey, p. 74-79.
Wisconsin Geologic and Natural History Survey, 1971, Geologic map of Wisconsin: University of Wisconsin, no scale.
Wyoming (3)
Eckel, E. B., 1959, A reconnaissance map of the sand and gravel deposits in Wyoming: U.S. Geological Survey Open-File Report, scale 1:500,000.
Larrabee, D. M., and Shride, A. F., compilers, 1946b, Preliminary map showing sand and gravel deposits of Wyoming: U.S. Geological Survey Missouri Basin Studies 5, scale 1:500,000.
Love, J. D., Weitz, J. L., and Hose, R. K., 1955, Geologic map of Wyoming: U.S. Geological Survey, scale 1:500,000.
________________________(1) The state geological survey responded to the request. (2) The highway department responded to the request. (3) The state geological survey and highway departmentboth responded to the request.
References Cited
Aleshin, E., and Bortz, S. A., 1976, Aggregates manufactured from waste materials, in American Society for Testing and Materials, Living with marginal aggregates: American Society for Testing Materials Special Technical Publication 597, p. 85-96.
27
American Society for Testing and Materials, 1980, Annual book of ASTM standards, pt. 14, Concrete and mineral aggregates: Philadelphia, PA, 878 p.
Bates, R. L., and Jackson, J. A., eds., 1980, Glossary of geology: Falls Church, VA, American Geological Institute, 749 p.
Carter, W. L., 1975, The paradox of quarrying in the northeastern megalopolis: Environmental Geology, v. 1, p. 67-68.
Currier, L. W., 1960, Geologic appraisal of dimension-stone deposits: U.S. Geological Survey Bulletin 1109, 78 p.
Davies, W. E., Simpson, J. H., Ohlmacher, G. C., Kirk, W. S., and Newton, E. G., 1977, Map showing engineering aspects of karst in the United States: U.S. Geological Survey Open-File Report 76-623, scale 1:7,500,000.
Dolar-Mantuani, L., 1976, Working with borderline aggregates, in American Society for Testing and Materials Special Technical Publication 597, p 2-10.
Engineering News Record, 1982, Monthly market quotations: April 8, 1982, v. 208, no. 14, p. 40-41.
Ericksen, G. E., and Cox, D. P., 1968, Limestone and dolomite, in Mineral resources of the Appalachian region: U.S. Geological Survey Professional Paper 580, p. 163-167.
Evans, J. R., 1978, Sand and gravel: U.S. Bureau of Mines Commodity Profile MPC-23, 22 p.
Fenneman, N. M., 1946, Physical divisions of the United States: U.S. Geological Survey Map, scale 1:7,000,000.
Fisk, H. N., 1944, Geological investigation of the alluvial valley of the lower Mississippi River; Vicksburg, Miss., Vicksburg Mississippi River Commission, 78 p.
French, A. E., 1967, Mineral raw materials for construction [map]: U.S. Geological Survey National Atlas, p. 182-183, scale 1:7,500,000.
Goetz, W. H., and Wood, L. E., 1960, Bituminous materials and mixtures, section 18, n Woods, K. B., Berry, D. S., and Goetz, W. H., eds., Highway engineering handbook: New York, NY, McGraw-Hill Book Company, Inc., p. 18-1 to 18-99.
Hadley, D. W., 1961, Alkali reactivity of carbonate rocks: Skokie, Ill., Portland Cement Association, Resource Department Bulletin 139, 14 p.
Hubbard, H. A., and Ericksen, G. E., 1973, Limestone and dolomite, in Brobst, D. A., and Pratt, W. P., eds., United States mineral resources: U.S. Geological Survey Professional Paper 20, p. 357-364.
Hunt, C. B., 1977, Surficial geology of the United States: U.S. Geological Survey Open-File Report 77-232, scale 1:7,500,000.
King, P. B., and Beikman, H. M., 1974, Geologic map of the United States: U.S. Geological Survey, scale 1:2,500,000.
Langer, W. H., and Recny, C. J., 1978, Map showing unconsolidated materials, Keene Quadrangle, New Hampshire-Vermont: U.S. Geological Survey
Miscellaneous Field Investigations Map MF-1012, scale 1:24,000.
Laurence, R. A., 1973, Construction stone, in Brobst, D. A., and Pratt, W. P., eds., United States mineral resources: U.S. Geological Survey Professional Paper 820, p. 157-162.
Lerch, William, 1955, Chemical reaction of concrete aggregate: American Society for Testing and Materials Special Technical Publication 169, p. 334-345.
McLaughlin, J. P., Woods, K. B., Mielenz, R. C., and Rockwood, N. C., 1960, Distribution, production, and engineering characteristics of aggregates, section 16, in Woods, K. B., Berry, D. S., and Goetz, W. H., eds., Highway engineering handbook: New York, NY, McGraw-Hill Book Company, Inc., p. 16-1 to 16-53.
McNarl, H. N., 1975, Lightweight aggregates, in Lefond, S., J., ed., Industrial minerals and rocks: New York, NY, American Institute of Mining, Metallurgical, and Petroleum Engineers, Inc., p. 85-96.
National Research Council, compiled and edited by a committee of the Division of Earth Sciences, 1959, Glacial map of the United States east of the Rocky Mountains: Geological Society of America, scale 1:1,750,000.
National Research Council, committee on Surface Mining and Reclamation, 1980, Sand and gravel mining, and quarrying and blasting for crushed stone and other construction minerals, appendix I, in Surface mining of non-coal minerals: Washington, D.C., national Academy of Sciences, 91 p.
National Sand and Gravel Association, undated, Factual information on the sand and gravel industry [information brochure]: Silver Spring, MD, 4 p.
Neville, A. M., 1973, Properties of concrete: New York, NY, John Wiley and Sons, 686 p.
Reed, A. H., 1978, Stone: U.S. Bureau of Mines Mineral Commodity Profile MPC-17, 19 p.
Renninger, F. A., and Nichols, F. P., Jr., 1977, Aggregates and pavement skid resistance: Geological Society of America Engineering Case Histories 11, p. 25-29.
Schenck, G. H. K., and Torries, T. F., 1975, Construction materials; aggregates-crushed stone, in Lefond, S. J., ed., Industrial minerals and rocks: New York, NY, American Institute of Mining, Metallurgical, and Petroleum Engineers, Inc., p. 66-84.
Stone, J. R., London, E. H., and Langer, W. H., 1979, Map showing textures of unconsolidated materials, Connecticut Valley urban area, central New England: U.S. Geological Survey Miscellaneous Investigations Series Map I-1074-B, scale 1:125,000.
Tepordei, V. V., 1983, Sand and gravel and crushed stone in the Midwest, in Ault, C. H., and Woodard, G. S., eds., Proceedings of the 18th forum on geology of industrial minerals: Bloomington, Indiana, Geological Survey Department of Natural Resources Occasional Paper 37, p. 173-181.
U.S. Bureau of Mines, 1982, Mineral commodity summaries: 183 p.
28

Water and Power Resources Service, 1981, Concrete manual: 627 p.
Welday, E. E., and Williams, J. W., 1975, Offshore geology of California [map]: State of California Department of Conservation, scale 1:500,000.
Werth, J. T., 1980, Sand and gravel resources— Protection, regulation, and reclamation: American Planning Association Report 347, 33 p.
Witczak, M. W., 1972, Relationships between physiographic units and highway design factors: Highway Research Board National Cooperative Highway Research Program Report 132, 170 p.
Woods, K. B., 1948, Introduction to symposium, in Symposium on Mineral Aggregates, Fifty-First Annual Meeting, American Society for Testing Materials, Detroit, MI, June 21-25, 1948: American Society for Testing Materials Special Publication 83, p. 1-3.
Woods, K. B., and Lovell, C. W., Jr., 1960, Distribution of soils in North America, section 9, in Woods, K. B., Berry, D. S., and Goetz, W. H., eds., Highway engineering handbook: New York, NY, McGraw-Hill Book Company, Inc., p. 9-1 to 9-63.
State Geological Surveys
Geological Survey of Alabama P.O. Drawer O University Station Tuscaloosa, AL 35486
Arizona Bureau of Geology and Mineral Technology845 North Park Avenue Tucson, AZ 85719
Arkansas Geological Commission Vardelle Parham Geology Center 3815 West Roosevelt Rd. Little Rock, AK 72204
California Division of Mines and GeologyDepartment of Conservation1416 Ninth St. Room 1341 Sacramento, CA 95814
Colorado Geological Survey1313 Sherman St. Room 715 Denver, CO 80203
Connecticut Geological SurveyDepartment of Environmental Protection Natural Resources Center State Office Bldg. 165 Capitol Ave. Hartford, CT 06115
Delaware Geological SurveyUniversity of Delaware 101 Penny HallNewark, DE 19711
Florida Bureau of Geology 903 West Tennessee St. Tallahassee, FL 32304
Georgia Geological SurveyRoom 400 Environmental Protection Division Department of Natural Resources 19 Martin Luther King Dr., SW, Atlanta, GA 30334
Idaho Bureau of Mines and Geology Moscow, ID 83843
Illinois State Geological SurveyNatural Resources Bldg. 615 East Peabody Dr. Champaign, IL 61820
Indiana Geological SurveyDepartment of Natural Resources 611 North Walnut Grove Bloomington, IN 47405
Iowa Geological Survey123 North Capitol Iowa City, IA 52242
Kansas Geological Survey1930 Avenue A, Campus West University of Kansas Lawrence, KS 66044
Kentucky Geological SurveyUniversity of Kentucky311 Breckinridge Hall Lexington, KY 40506
Louisiana Geological SurveyDepartment of Natural Resources Box G, University Station Baton Rouge, LA 70893
Maine Geological SurveyRay Bldg. Hospital St. Augusta, ME 04333
Maryland Geological SurveyMerryman Hall Johns Hopkins UniversityBaltimore, MD 21218
29

Massachusetts Geological SurveyDepartment of Environmental Quality EngineeringDivision of Waterways 1-11 Winter St., 7th Floor Boston, MA 02114
Geological Survey DivisionMichigan Department of Natural Resources Steven T. Mason Bldg. P.O. Box 30028 Lansing, MI 48909
Minnesota Geological Survey1633 Eustis St. St. Paul, MN 55108
Mississippi Geological, Economic, and Topographical SurveyP.O. Box 5348 Jackson, MS 39216
Missouri Division of Geology and Land SurveyDepartment of Natural Resources P.O. Box 250 Rolla, MO 65401
Montana Bureau of Mines and GeologyMontana College of Mineral Science and TechnologyButte, MT 59701
Conservation and Survey Division University of NebraskaLincoln, NE 68588
Nevada Bureau of Mines and Geology University of NevadaReno, NV 89557
New Hampshire Geological SurveyDepartment of Resources and Economic Development 117 James HallUniversity of New HampshireDurham, NH 03824
New Jersey Bureau of Geology and TopographyP.O. Box 1390 Trenton, NJ 08625
New Mexico Bureau of Mines and Mineral Resources Campus Station Socorro, NM 87801
New York State Geological SurveyMuseum and Science ServiceNew York State Education Department Empire State Plaza Albany, NY 12234
North Carolina Geological SurveyDivision of Land Resources Department of Natural Resources and CommunityDevelopment P.O. Box 27687 Raleigh, NC 27611
North Dakota Geological SurveyUniversity Station Grand Forks, ND 58201
Ohio Division of Geological SurveyFountain Square, Bldg. 6 Columbus, OH 43224
Oklahoma Geological SurveyUniversity of Oklahoma 830 Van Vleet Oval Room 163 Norman, OK 73019
Oregon Department of Geology and Mineral Industries 1069 State Office Bldg. 1400 SW Fifth Ave. Portland, OR 97201
Pennsylvania Bureau of Topographic and Geologic SurveyDepartment of Environmental Resources P.O. Box 2357 Harrisburg, PA 17120
Rhode Island Geological SurveyGeology Department Green Hall University of Rhode IslandKingston, RI 02881
South Carolina Geological SurveyHarbison Forest Rd. Columbia, SC 29210
South Dakota Geological SurveyScience CenterUniversity of South Dakota Vermillion, SD 57069
Tennessee Division of GeologyDepartment of ConservationG-5 State Office Bldg. Nashville, TN 37219
Texas Bureau of Economic Geology University of Texas at Austin University Station, Box X Austin, TX 78712
Utah Geological and Mineral Survey606 Black Hawk WaySalt Lake City, UT 84108
30
Vermont Geological SurveyAgency of Environmental ConservationMontpelier, VT 05602
Virginia Division of Mineral Resources P.O. Box 3667 Charlottesville, VA 22903
Washington Division of Geology and Earth Resources Department of Natural Resources Olympia, WA 98504
West Virginia Geological and Economic SurveyMont Chateau Research Center P.O. Box 879 Morgantown, WV 26505
Wisconsin Geological and Natural History SurveyUniversity of Wisconsin1815 University Ave. Madison, WI 53706
Geological Survey of Wyoming P.O. Box 3008 University Station Laramie, WY 82071
State Highway and Transportation Agencies
Alabama Highway Department State Highway Bldg. 11 South Union St. Montgomery, AL 36130
Arizona Highway Division Arizona Department of Transportation 206 South 17th Ave. Phoenix, AZ 85007
Arkansas State Highway and Transportation Department P.O. Box 2261 Little Rock, AR 72203
California Division of Highways P.O. Box 1499 Sacramento, CA 95807
Colorado Department of Highways 4201 East Arkansas Ave. Denver, CO 80222
Connecticut Department of Transportation P.O. Drawer A Wethersfield, CT 06109
Delaware Division of Highways P.O. Box 778 Dover, DE 19901
Florida Department of Transportation Haydon Burns Bldg. 605 Suwannee St. Tallahassee, FL 32301
Georgia Department of TransportationNo. 2 Capitol Square Atlanta, GA 30334
Idaho Division of Highways P.O. Box 7129 Boise, ID 83707
Illinois Division of Highways Department of Transportation2300 South Dirksen Parkway Springfield, IL 62764
Indiana Department of Highways State Office Bldg., Room 1101 100 North Senate Ave. Indianapolis, IN 46204
Iowa Highway Division 826 Lincoln WayAmes, IA 50010
Kansas Department of Transportation State Office Bldg. Topeka, KS 66612
Kentucky Department of TransportationState Office Bldg. High and Clinton Streets Frankfort, KY 40601
Louisiana Office of Highways Department of Transportation and Development P.O. Box 44245, Capitol Station Baton Rouge, LA 70804
Maine Department of Transportation Transportation Bldg. Augusta, ME 04333
Maryland State Highway Administration P.O. Box 717 Baltimore, MD 21203
Massachusetts Department of Public Works 100 Nashua St. Boston, MA 02114
31

Michigan Department of Transportation425 West OttawaP.O. Box 30050 Lansing, MI 48909
Minnesota Department of Transportation State Transportation Bldg., Room 413 St. Paul, MN 55155
Mississippi State Highway Department P.O. Box 1850 Jackson, MS 39205
Missouri Highway and Transportation Department State Highway Bldg. Jefferson City, MO 65101
Montana Department of Highways 2701 Prospect Ave. Helena, MT 59620
Nebraska Department of Roads P.O. Box 94759 Statehouse Station Lincoln, NE 68509
Nevada Department of Transportation Administrative Bldg., Room 201 1263 South Stewart St. Carson City, NV 89712
New Hampshire Department of Public Works and HighwaysJohn O. Morton Bldg. 85 Loudon Rd.Concord, NH 03301
New Jersey Department of Transportation 1035 Parkway Ave. Trenton, NJ 08625
New Mexico State Highway Department P.O. Box 1149 Santa Fe, NM 87501
New York State Department of Transportation 1220 Washington Ave. State Campus, Bldg. 5 Albany, NY 12232
North Carolina Division of Highways P.O. Box 25201 Raleigh, NC 27611
North Dakota Highway Department State Highway Bldg. Capitol GroundsBismarck, ND 58505
Ohio Department of Transportation 25 South Front St. Columbus, OH 43215
Oklahoma Department of Transportation 200 NE 21st St. Oklahoma City, OK 73105
Oregon State Highway Division State Highway Bldg., Room 140 Salem, OR 97310
Pennsylvania Department of Transportation1220 Transportation and Safety Bldg. Commonwealth and Forester St. Harrisburg, PA 17120
Rhode Island Department of TransportationState Office Bldg. Providence, RI 02903
South Carolina Department of Highways and Public TransportationP.O. Box 191 Columbia, SC 29202
South Dakota Department of TransportationTransportation Bldg. East Broadway Pierre, SD 57501
Tennessee Bureau of Highways Tennessee Department of Transportation Suite 700, James K. Polk Bldg. Nashville, TN 37219
Texas State Department of Highways and Public TransportationTexas Highway Bldg. 11th and Brazos St. Austin, TX 78701
Utah Department of Transportation 4501 South 2700 West Salt Lake City, UT 84119
Vermont Agency of Transportation 133 State St. Montpelier, VT 05602
Virginia Department of Highways and Transportation1221 East Broad St. Richmond, VA 23219
Washington State Department of Transportation Highway Administration Bldg.Maple Park Dr. Olympia, WA 98504
32

West Virginia Department of Highways 1900 Washington St., East Charleston, WV 25305
Wisconsin Division of Highways and Transportation Facilities Department of Transportation4802 Sheboygan Ave. Madison, WI 53702
Wyoming Highway Department State Highway Office Bldg. Cheyenne, WY 82001
33