Embed Size (px)
Citation preview
STATE OF ALASKA
DEPARTMENT OF NATURAL RESOURCES
DIVISION OF GEOLOGICAL AND GEOPHYSICAL SURVEYS
Bill Sheffield, Governor
Esther C. Wunnicke, Commissioner
Pedro Denton, Director
June 1986
This report is a preliminary publication of DGGS. The author is solely responsible for its content and will appreciate candid comments on the accuracy of the data as well as suggestions to improve the report.
Report of Investigations 86-3 A GEOTECHNICAL CROSS SECTION OF
DOWNTOWN ANCHORAGE: AN ASSESSMENT USING THE ELECTRIC-CONE-
PENETRATION TEST BY
Randall G. Updike and Catherine A. Ulery
STATE OF ALASKA Department of Natural Resources
DIVISION OF GEOLOGICAL & GEOPHYSICAL SURVEYS
According to Alaska Statute 41, the Alaska Division of Geological and Geophysical Surveys is charged with conducting 'geological and geophysical surveys to determine the potential of Alaskan land for production of metals, minerals, fuels, and geothermal resources; the locations and supplies of ground water and construction materials; the potential geologic hazards to buildings, roads, bridges, and other installations and structures; and shall conduct such other surveys and investigations as will advance knowledge of the geology of Alaska.'
In addition, the Division of Geological and Geophysical Surveys shall collect, record, evaluate, and distribute data on the quantity, quality, and location of underground, surface, and coastal water of the state; publish or have published data on the water of the state and require that the results and findings of surveys of water quality, quantity, and location be filed; require that water-well contractors file basic water and aquifer data, including but not limited to well location, estimated elevation, well- driller's logs, pumping tests, flow measurements, and water-quality determinations; accept and spend funds for the purposes of this section, AS 41.08.017 and 41.08.035, and enter into agreements with individuals, public or private agencies, communities, private industry, and state and federal agencies; collect, record, evaluate, archive, and distribute data on seismic events and engineering geology of the state; and identify and inform public officials and industry about potential. seismic hazards that might affect development in the state.
Administrative functions are performed under the direction of the Director, who maintains his office in Anchorage. DGGS offices are located at:
.794 University Ave. .3601 C St. (8th £1.) (Basement) P.O. Box 7028 Fairbanks, 99709 Anchorage, 99510 (907) 474-7147 (907) 561-2020
.400 Willoughby Center .Fish Hatchery Road (3rd fl.) P.O. Box 772116 Juneau, 99801 Eagle River, 99577 (907) 465-3400 (907) 688-3555
This report is for sale by DGGS for $4. DGGS publications may be in- spected at the following locations. Mail orders should be addressed to the Fairbanks office.
-794 University Ave. ,3601 C St. (10th fl.) (Basement) P.O. Box 7005 Fairbanks, 99709 Anchorage, 99510
,400 Willoughby Center .P.O. Box 7438 (4th £1.) State Office Bldg. Juneau, 99801 Ketchikan, 99901
CONTENTS
Page
Introduction ............................................................ 1 .............................................................. Scope 1 Rationale .......................................................... 1 Location of study area ............................................. 1 Geologic history of the study area ................................. 1 Previous investigations ............................................ 4
Testing procedure ....................................................... 6 Equipment and method ............................................... 7 Data reduction and interpretation .................................. 8
Testing results ......................................................... 8 Calibration and correlation ........................................... 16 Conclusions ............................................................. 23 ......................................................... Acknowledgments 24 References cited ........................................................ 24 Appendix: Tabulated data derived from digitization
of rectified CPT profiles ....................................... 27
FIGURES
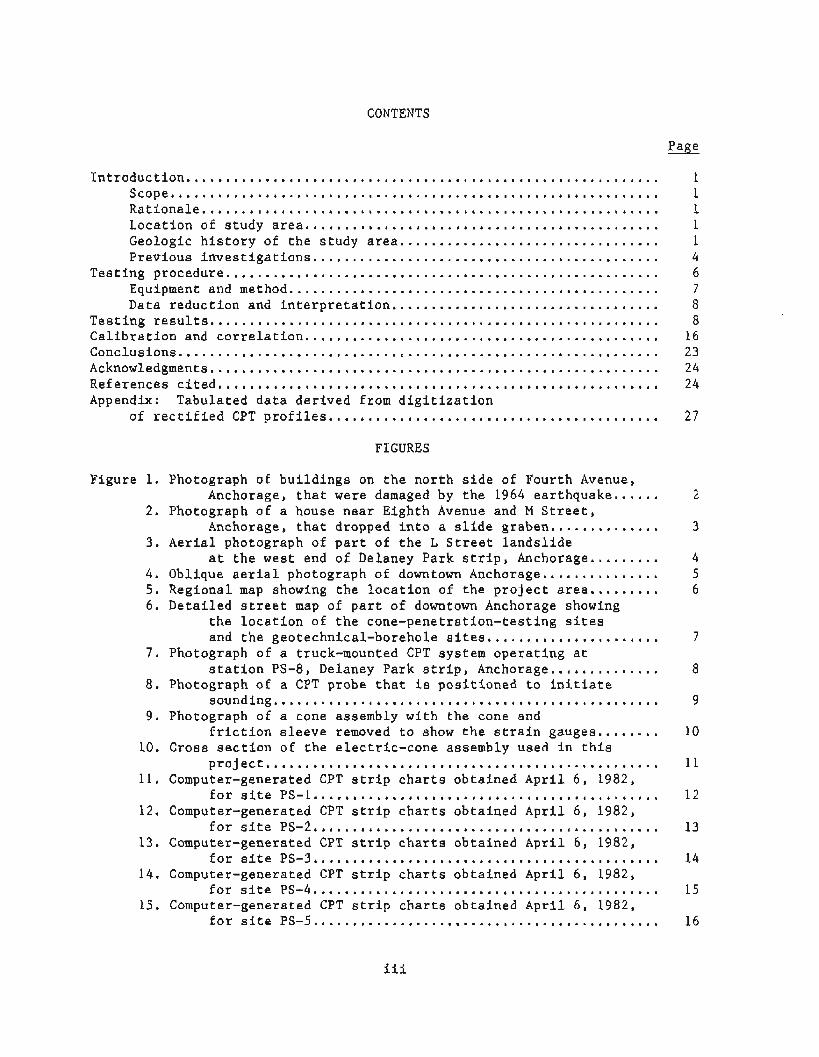
Figure 1 . Photograph of buildings on the north side of Fourth Avenue. Anchorage. that were damaged by the 1964 earthquake ...... 2
Photograph of a house near Eighth Avenue and M Street. Anchorage. that dropped into a slide graben .............. -I 'Z
Aerial photograph of part of the L Street landslide at the west end of Delaney Park strip. Anchorage ......... 4 . Oblique aerial photograph of downtown Anchorage .............. 5
Regional map showing the location of the project area ......... 6 Detailed street map of part of downtown Anchorage showing
the location of the cone-penetration-testing sites and the geotechnical-borehole sites ...................... 7
Photograph of a truck-mounted CPT system operating at station PS-8. Delaney Park strip. Anchorage .............. 8
Photograph of a CPT probe that is positioned to initiate sounding ................................................. 9
Photograph of a cone assembly with the cone and friction sleeve removed to show the strain gauges ........ 10
Cross section of the electric-cone assembly used in this project .................................................. 11
Computer-generated CPT strip charts obtained April 6. 1982. ............................................ for site PS-1 12 Computer-generated CPT strip charts obtained April 6. 1982.
for site PS-2 ............................................ 13 Computer-generated CPT strip charts obtained April 6. 1982. ............................................ for site PS-3 14 Computer-generated CPT strip charts obtained April 6. 1982. ............................................ for site PS-4 15 Computer-generated CPT strip charts obtained April 6. 1982.
for site PS-5 ............................................ 16
Page
1 6 . Computer-generated CPT strip charts obtained April 7 , 1 9 8 2 , for site PS-6.. .......................................... 17
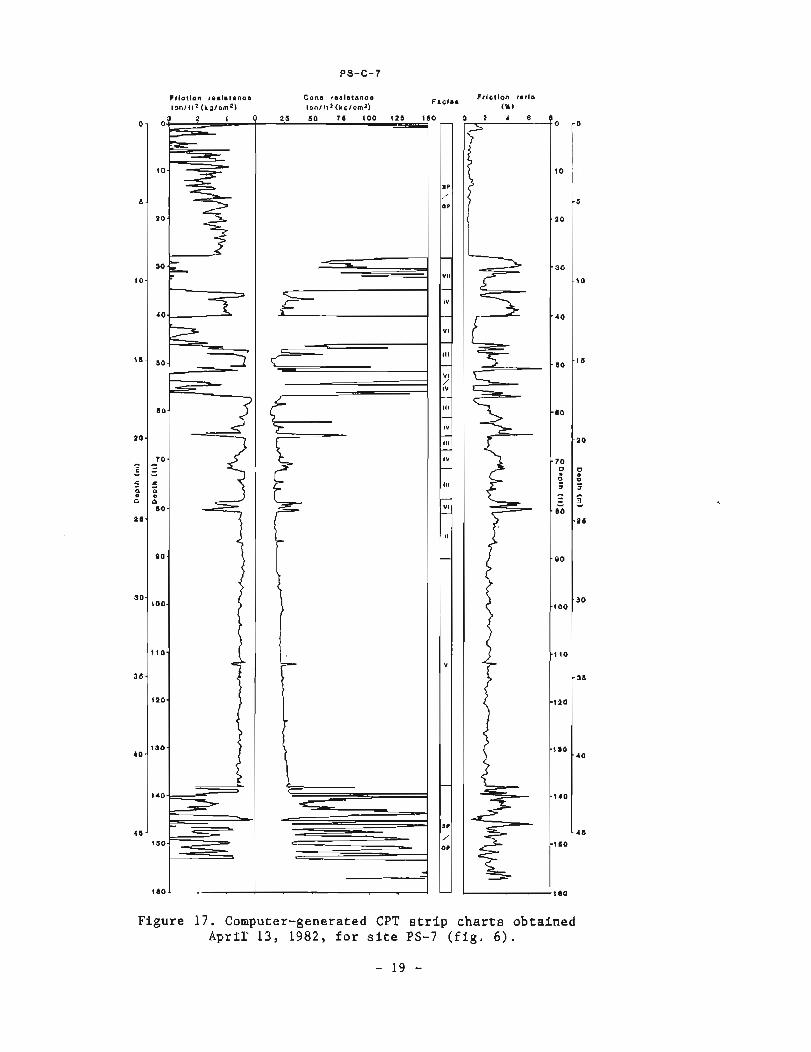
1 7 , Computer-generated CPT strip charts obtained April 1 3 , 1 9 8 2 , for site P S - 7 . . . . . . . . . . . . . . . . . . . . . . . . . . . . . . . . . . . . . . . . . 1 9
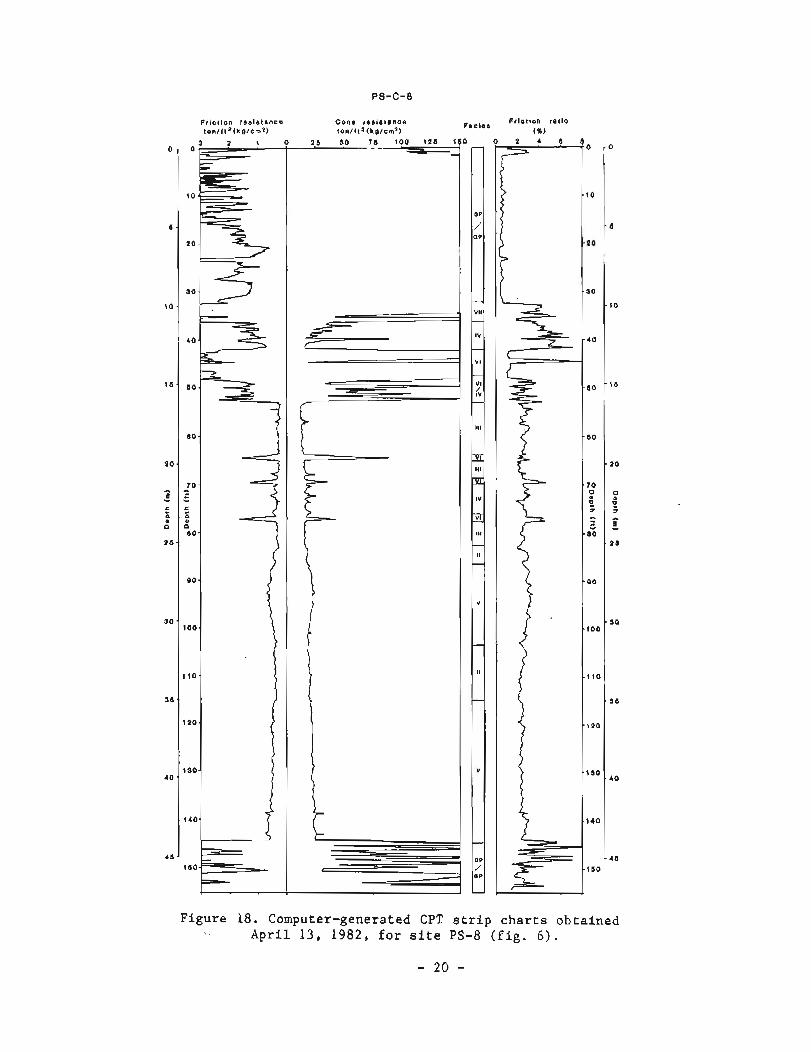
18. Computer-generated CPT strip charts obtained April 13, 1 9 8 2 , for site P S - 8 . . . . . . . . . . . . . . . . . . . . . . . . . . . . . . . . . . . . . . . . . . . . 20
19. Graph of friction ratio vs. cone resistance derived from CPT data showing soil-behavior domains for facies of the Bootlegger Cove Formation.................. 21
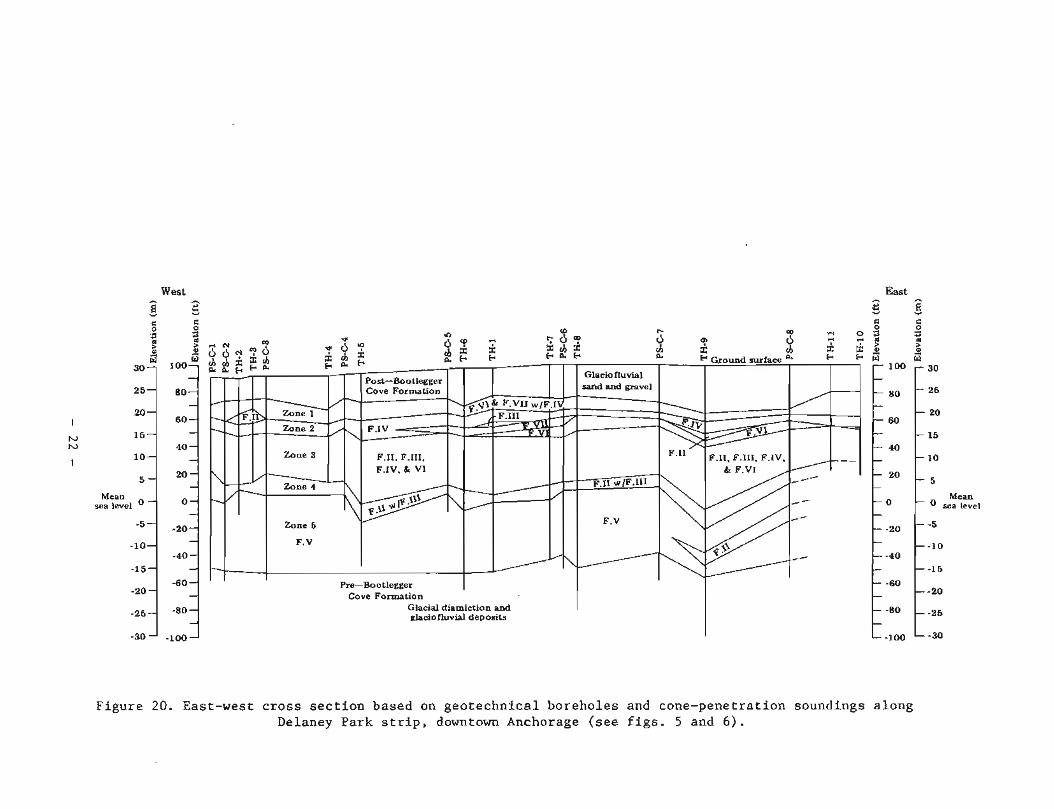
20. East-west cross section based on geotechnical boreholes and cone-penetration soundings along Delaney Park strip, downtown Anchorage.. .............................. 22
A GEOTECHNICAL CROSS SECTION OF DOWNTOWN ANCHORAGE: AN ASSESSMENT USING THE ELECTRIC-CONE-PENETRATION TEST
BY Randall G. Updike and Catherine A. Ulery 1
INTRODUCTION
Scope
The Fourth Avenue and L Street landslides in downtown Anchorage were among the most catastrophic ground failures that resulted from the 1964 Prince William Sound Earthquake (figs. 1, 2, and 3). This project assesses the engineering soils responsible for those landslides based on state-of- the-art in-situ testing using the electric-cone-penetration test (CPT) correlated with nearby geotechnical boreholes.
Rat ionale
Intense construction has occurred in downtown Anchorage since the 1964 earthquake (fig. 4). Some of the multiple-occupancy residences and high-rise commercial buildings were constructed in areas that sustained ground failure in 1964. Construction continues on soils believed to be identical to those that failed during previous earthquakes. Very little technical research has been conducted on these soils or their mechanics of failure since the post- earthquake investigations of Shannon and Wilson, Inc. (1964), Hansen (1965), and Kerr and Drew (1965). Because of economic pressures, these areas will continue to be sites of additional high-rise construction. To benefit future planning and development, the latest geotechnical techniques should be used to assess the current in-situ conditions of these soils and to document their distribution.
Location of Study Area
Eight testing sites were selected along the Delaney Park strip in down- town Anchorage along an east-west survey line from E Street to P Street (figs. 5 and 6). The line lies between and parallel to West Ninth and West 10th Avenues. The Delaney Park strip forms the current southern boundary of most urban high-rise-building development in downtown Anchorage. The project area is within sec. 18, T. 13 N., R. 3 W. and sec. 13, T. 13 N., R. 4 W., Anchorage A-8 NW. Quadrangle.
Geologic History of the Study Area
The generalized geology of Anchorage, including the study area, was mapped by Miller and Dobrovolny (1959), Karlstrom (1964), and Schmoll and Dobrovolny (1972). Recently subsurface geotechnical data was used to make a detailed geologic map of southwest Anchorage (Ulery and Updike, 1983; Updike and Ulery, 1986). These reports show that the Bootlegger Cove Formation, which underlies the study area, was deposited in an ice-marginal glacio-
'DGGS, P.O. Box 772116, Eagle River, Alaska 99577.
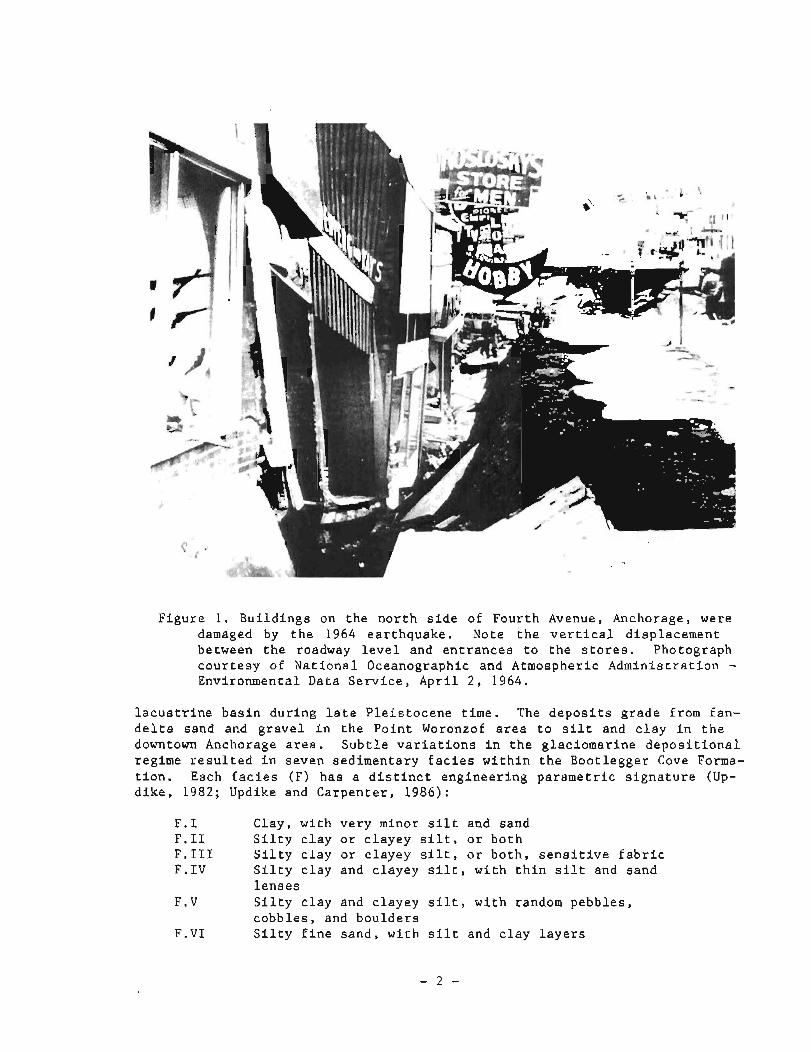
Figure 1. Buildings on the north side of Fourth Avenue, Anchorage, were damaged by the 1964 earthquake. Note the vertical displacement between the roadway level and entrances to the stores. Photograph courtesy of National Oceanographic and Atmospheric Administration - Environmental Data Service, April 2, 1964.
lacustrine basin during late Pleistocene time. The deposits grade from fan- delta sand and gravel in the Point Woronzof area to silt and clay in the downtown Anchorage area. Subtle variations in the glaciomarine depositional regime resulted in seven sedimentary facies within the Bootlegger Cove Forma- tion. Each facies (F) has a distinct engineering parametric signature (Up- dike, 1982; Updike and Carpenter, 1986):
F.1 Clay, with very minor silt and sand F. I1 Silty clay or clayey silt, or both F. I11 Silty clay or clayey silt, or both, sensitive fabric F. IV Silty clay and clayey silt, with thin silt and sand
lenses F.V Silty clay and clayey silt, with random pebbles,
cobbles, and boulders F.VI Silty fine sand, with silt and clay layers
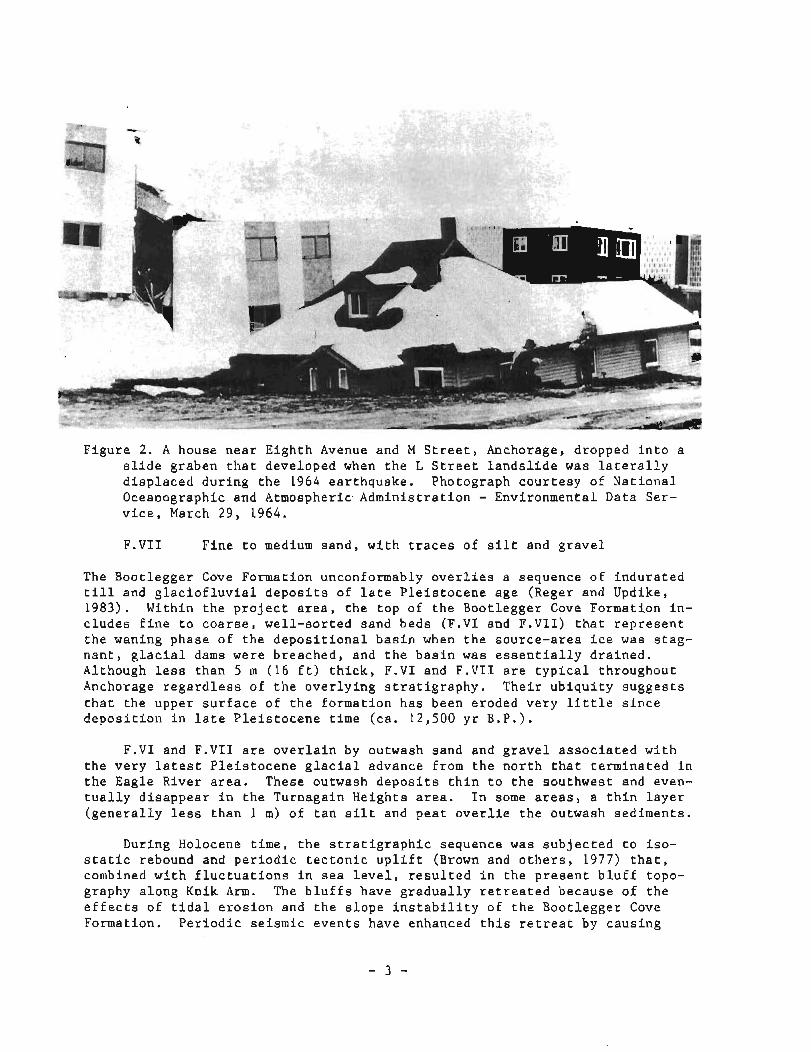
Figure 2. A house near Eighth Avenue and M Street, Anchorage, dropped into a slide graben that developed when the L Street landslide was laterally displaced during the 1964 earthquake. Photograph courtesy of National Oceanographic and Atmospheric. Administration - Environmental Data Ser- vice, March 29, 1964.
F.VII Fine to medium sand, with traces of silt and gravel
The Bootlegger Cove Formation unconformably overlies a sequence of indurated till and glaciofluvial deposits of late Pleistocene age (Reger and Updike, 1983). Within the project area, the top of the Bootlegger Cove Formation in- cludes fine to coarse, well-sorted sand beds (F.VI and F.VI1) that represent the waning phase of the depositional basin when the source-area ice was stag- nant, glacial dams were breached, and the basin was essentially drained. Although less than 5 m (16 ft) thick, F.VI and F.VII are typical throughout Anchorage regardless of the overlying stratigraphy. Their ubiquity suggests that the upper surface of the formation has been eroded very little since deposition in late Pleistocene time (ca. 12,500 yr B.P.).
F.VI and F.VII are overlain by outwash sand and gravel associated with the very latest Pleistocene glacial advance from the north that terminated in the Eagle River area. These outwash deposits thin to the southwest and even- tually disappear in the Turnagain Heights area. In some areas, a thin layer (generally less than 1 m) of tan silt and peat overlie the outwash sediments.
During Holocene time, the stratigraphic sequence was subjected to iso- static rebound and periodic tectonic uplift (Brown and others, 1977) that, combined with fluctuations in sea level, resulted in the present bluff topo- graphy along Knik Arm. The bluffs have gradually retreated because of the effects of tidal erosion and the slope instability of the Bootlegger Cove Formation. Periodic seismic events have enhanced this retreat by causing
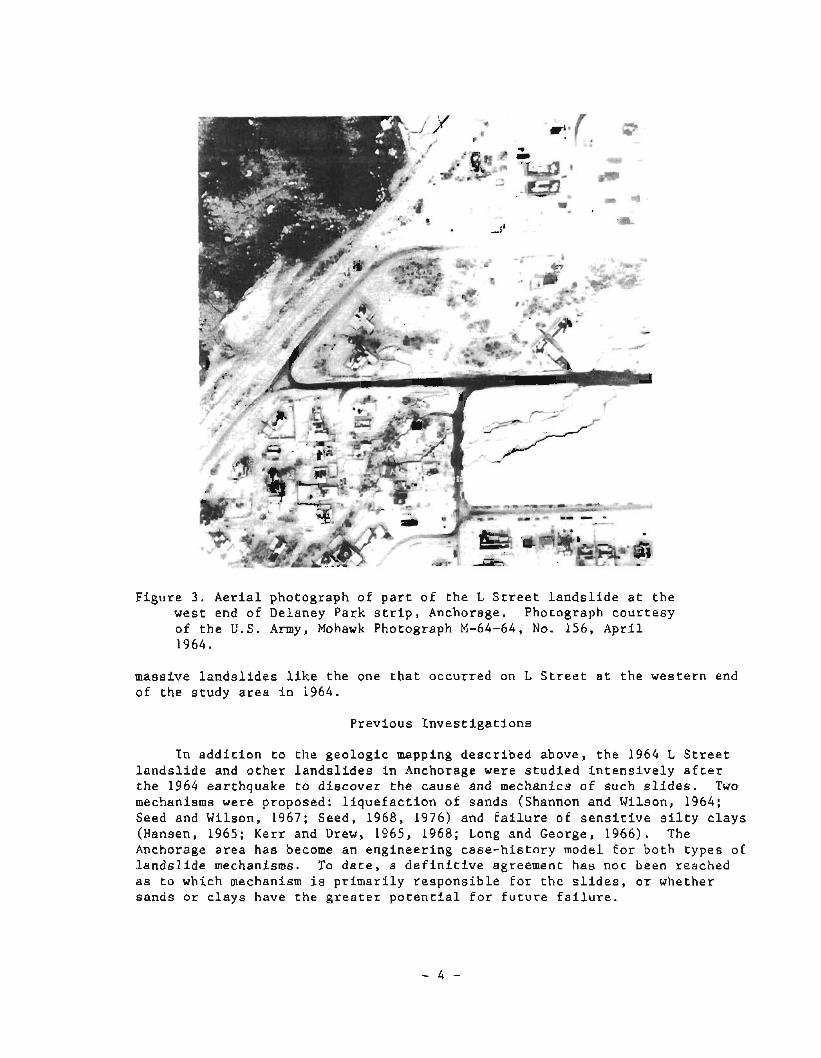
Figure 3. Aerial photograph of part of the L Street landslide at the west end of Delaney Park strip, Anchorage. Photograph courtesy of the U.S. Army, Mohawk Photograph M-64-64, No. 156, April 1964.
massive landslides like the one that occurred on L Street at the western end of the study area in 1964.
Previous Investigations
In addition to the geologic mapping described above, the 1964 L Street landslide and other landslides in Anchorage were studied intensively after the 1964 earthquake to discover the cause and mechanics of such slides. Two mechanisms were proposed: liquefaction of sands (Shannon and Wilson, 1964; Seed and Wilson, 1967; Seed, 1968, 1976) and failure of sensitive silty clays (Hansen, 1965; Kerr and Drew, 1965, 1968; Long and George, 1966). The Anchorage area has become an engineering case-history model for both types of landslide mechanisms. To date, a definitive agreement has not been reached as to which mechanism is primarily responsible for the slides, or whether sands or clays have the greater potential for future failure.
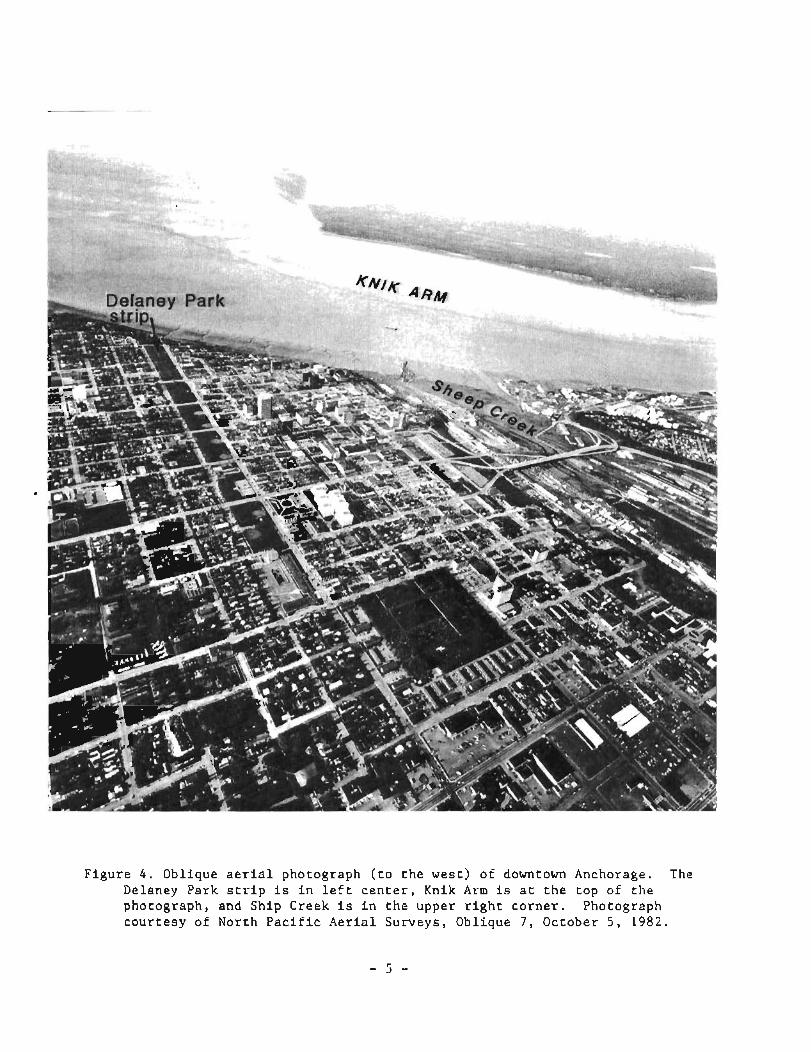
F i g u r e 4 . Oblique a e r i a l photograph ( t o t h e wes t ) o f downtown Anchorage. The Delaney Park s t r i p i s i n l e f t c e n t e r , Knik A r m i s a t t h e t o p of t h e photograph, and Sh ip Creek i s i n t h e upper r i g h t c o r n e r . Photograph c o u r t e s y of North P a c i f i c A e r i a l Surveys, Oblique 7 , October 5 , 1982.
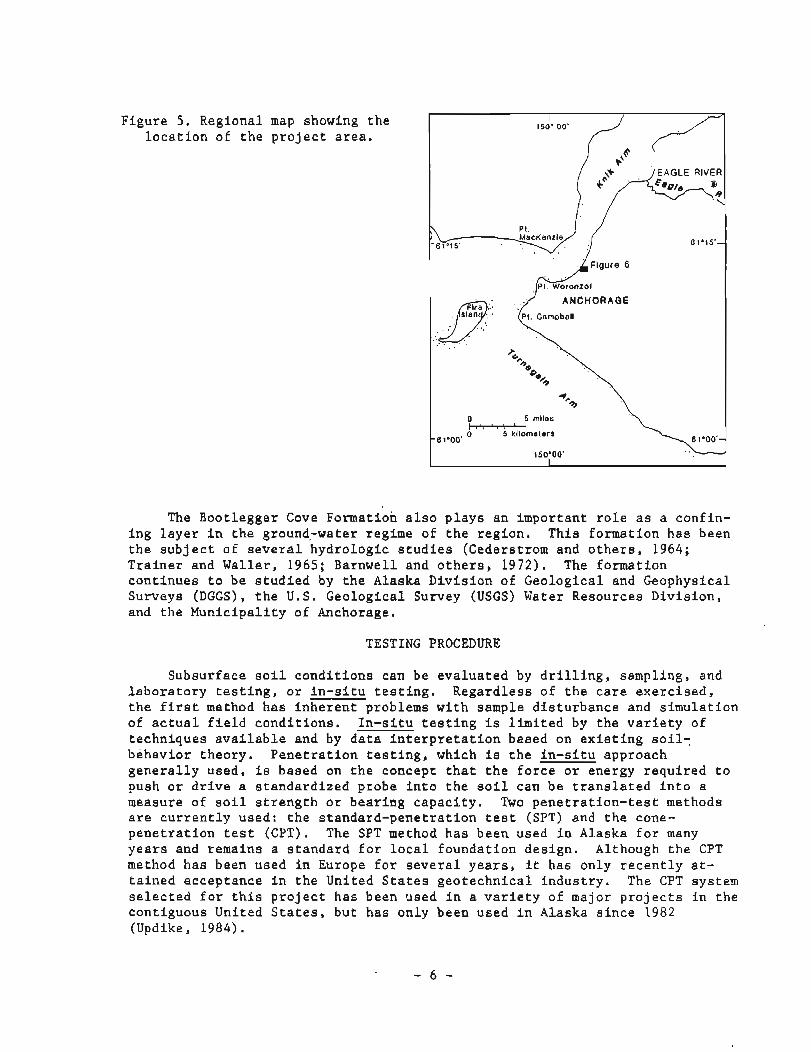
Figure 5. Regional map showing the location of the project area.
EAGLE RIVER
)h./ -61'15' 61'15 -
J7 ANCHORAGE
0 5 rntles
-metekilometers -61°00' O
1 50°00'
The Bootlegger Cove ~ormati'on also plays an important role as a confin- ing layer in the ground-water regime of the region. This formation has been the subject of several hydrologic studies (Cederstrom and others, 1964; Trainer and Waller, 1965; Barnwell and others, 1972). The formation continues to be studied by the Alaska Division of Geological and Geophysical Surveys (DGGS), the U.S. Geological Survey (USGS) Water Resources Division, and the Municipality of Anchorage.
TESTING PROCEDURE
Subsurface soil conditions can be evaluated by drilling, sampling, and laboratory testing, or in-situ testing. Regardless of the care exercised, the first method has inherent problems with sample disturbance and simulation of actual field conditions. In-situ testing is limited by the variety of techniques available and by data interpretation based on existing soil- behavior theory. Penetration testing, which is the in-situ approach generally used, is based on the concept that the force or energy required to push or drive a standardized probe into the soil can be translated into a measure of soil strength or bearing capacity. Two penetration-test methods are currently used: the standard-penetration test (SPT) and the cone- penetration test (CPT). The SPT method has been used in Alaska for many years and remains a standard for local foundation design. Although the CPT method has been used in Europe for several years, it has only recently at- tained acceptance in the United States geotechnical industry. The CPT system selected for this project has been used in a variety of major projects in the contiguous United States, but has only been used in Alaska since 1982 (Updike, 1984).
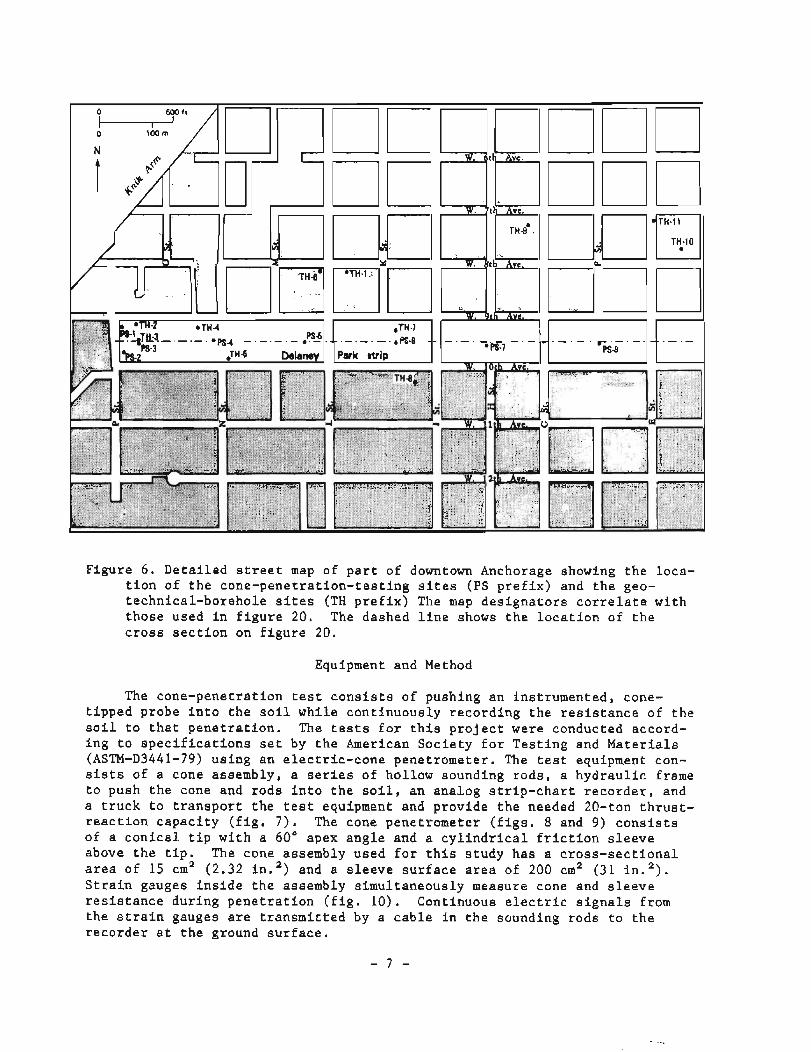
Figure 6. Detailed street map of part of downtown Anchorage showing the loca- tion of the cone-penetration-testing sites (PS prefix) and the geo- technical-borehole sites (TH prefix) The map designators correlate with those used in figure 20. The dashed line shows the location of the cross section on figure 20.
Equipment and Method
The cone-penetration test consists of pushing an instrumented, cone- tipped probe into the soil while continuously recording the resistance of the soil to that penetration. The tests for this project were conducted accord- ing to specifications set by the American Society for Testing and Materials (ASTM-D3441-79) using an electric-cone penetrometer. The test equipment con- sists of a cone assembly, a series of hollow sounding rods, a hydraulic frame to push the cone and rods into the soil, an analog strip-chart recorder, and a truck to transport the test equipment and provide the needed 20-ton thrust- reaction capacity (fig. 7). The cone penetrometer (figs. 8 and 9) consists of a conical tip with a 60' apex angle and a cylindrical friction sleeve above the tip. The cone assembly used for this study has a cross-sectional area of 15 cm2 (2.32 in. ') and a sleeve surface area of 200 cm2 (31 in. '). Strain gauges inside the assembly simultaneously measure cone and sleeve resistance during penetration (fig. 10). Continuous electric signals from the strain gauges are transmitted by a cable in the sounding rods to the recorder at the ground surface.
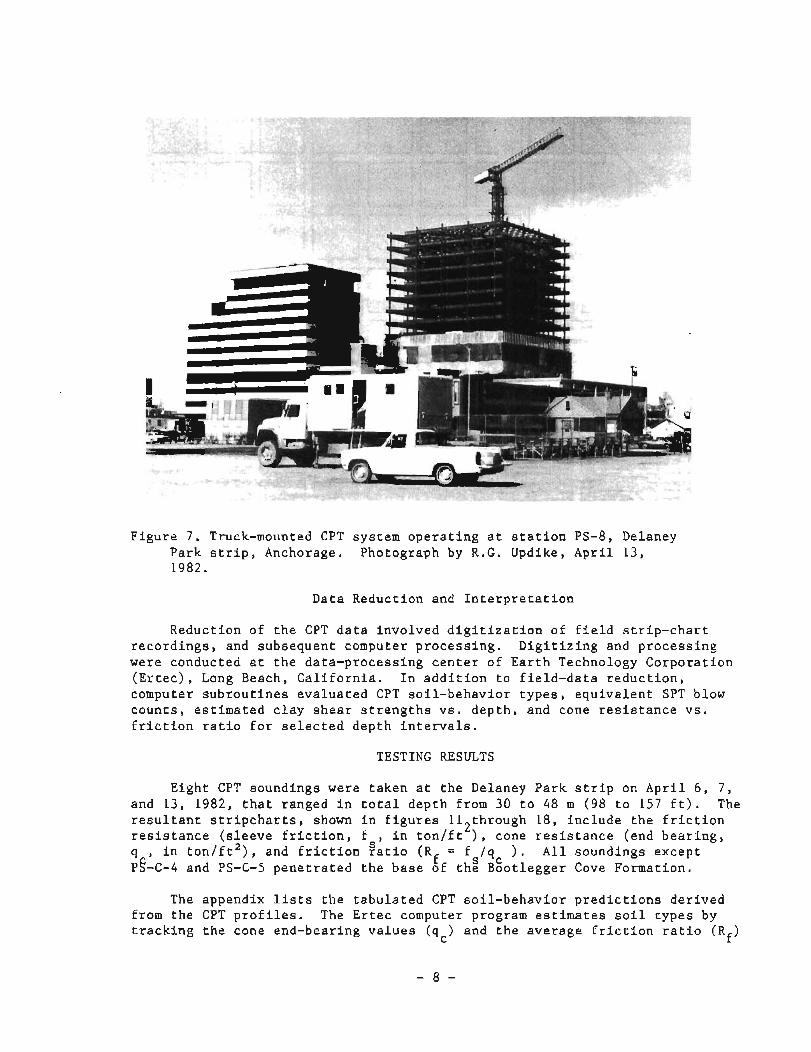
Figure 7. Truck-mounted CPT system operating at station PS-8, Delaney Park strip, Anchorage. Photograph by R.G. Updike, April 13, 1982.
Data Reduction and Interpretation
Reduction of the CPT data involved digitization of field strip-chart recordings, and subsequent computer processing. Digitizing and processing were conducted at the data-processing center of Earth Technology Corporation (Ertec), Long Beach, California. In addition to field-data reduction, computer subroutines evaluated CPT soil-behavior types, equivalent SPT blow counts, estimated clay shear strengths vs. depth, and cone resistance vs. friction ratio for selected depth intervals.
TESTING RESULTS
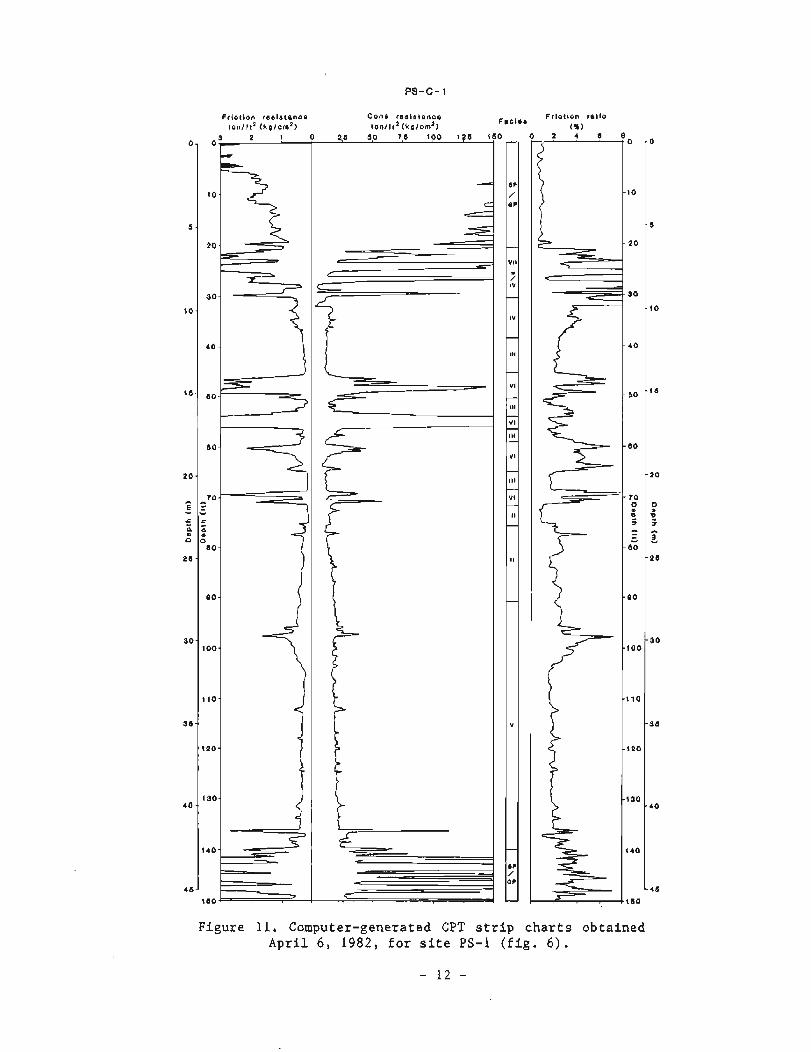
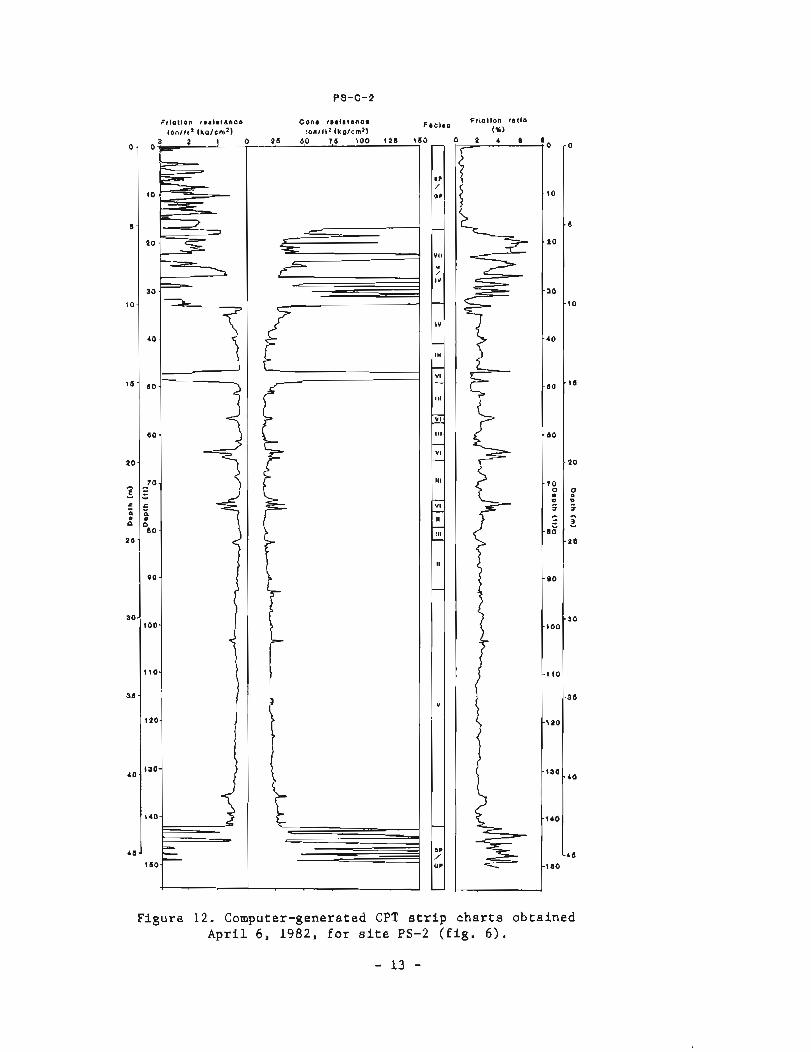
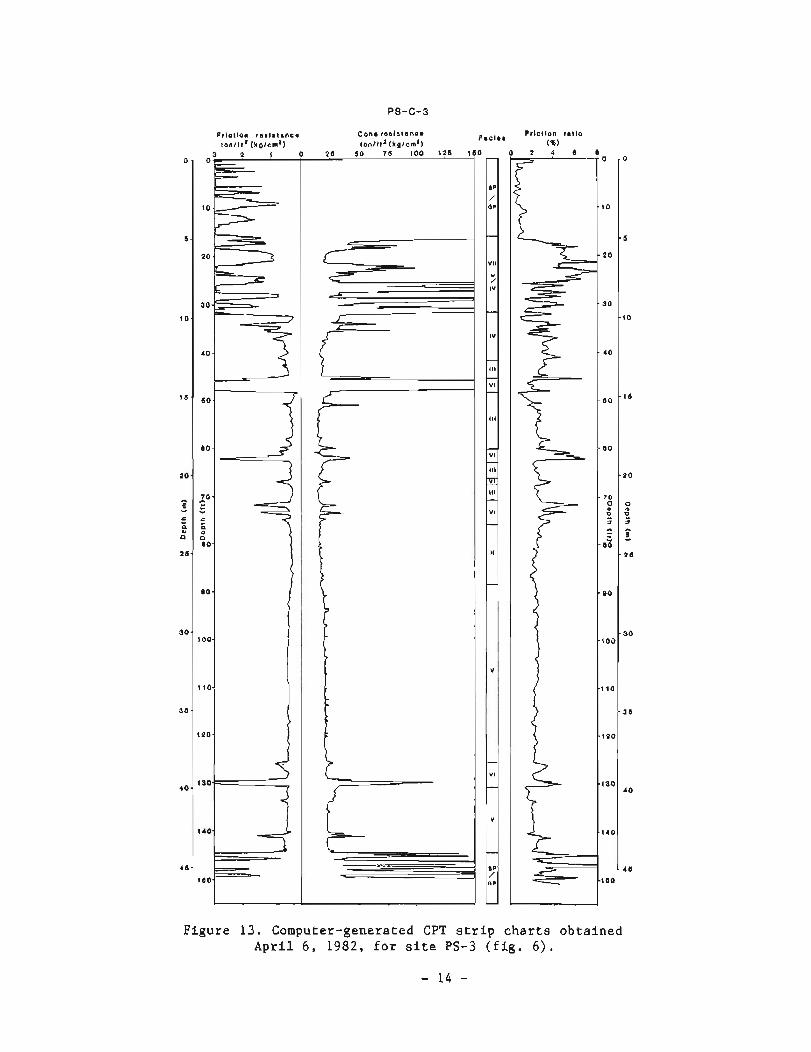
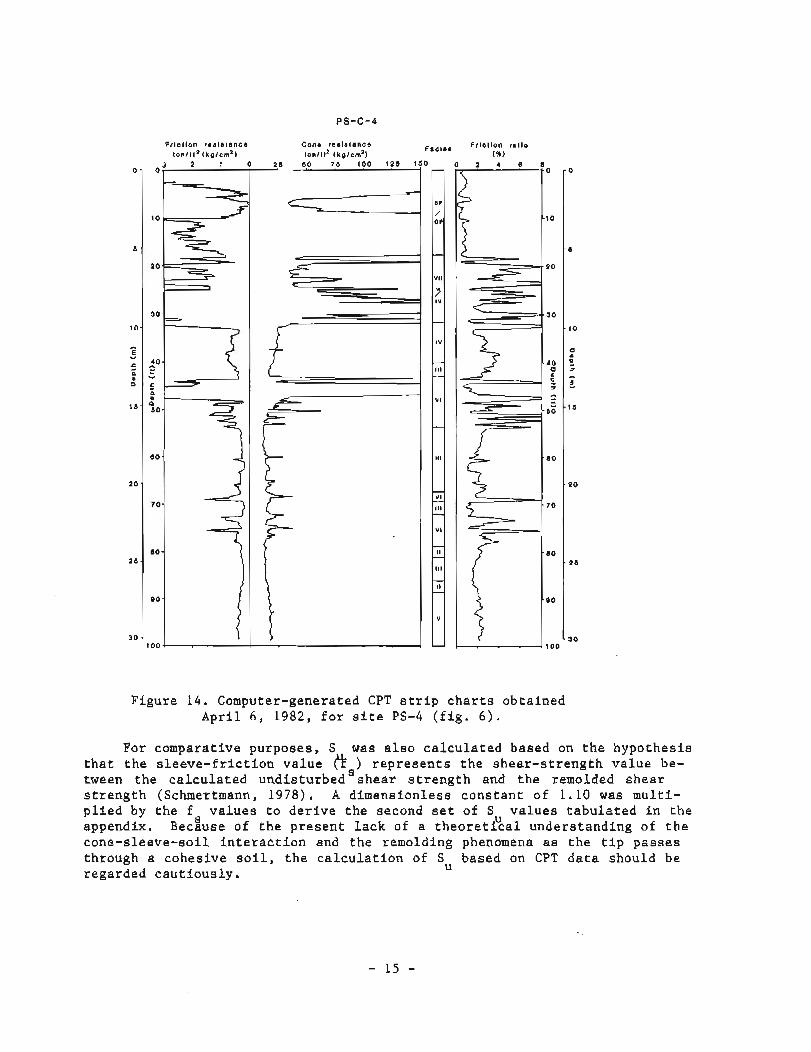
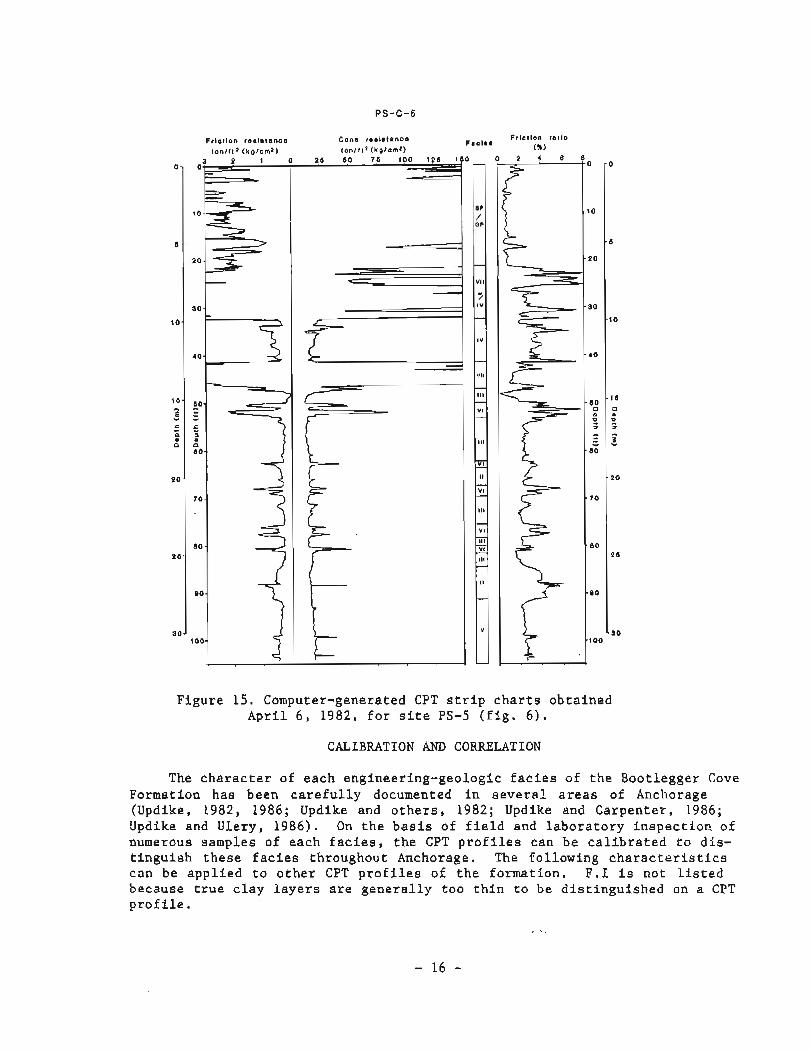
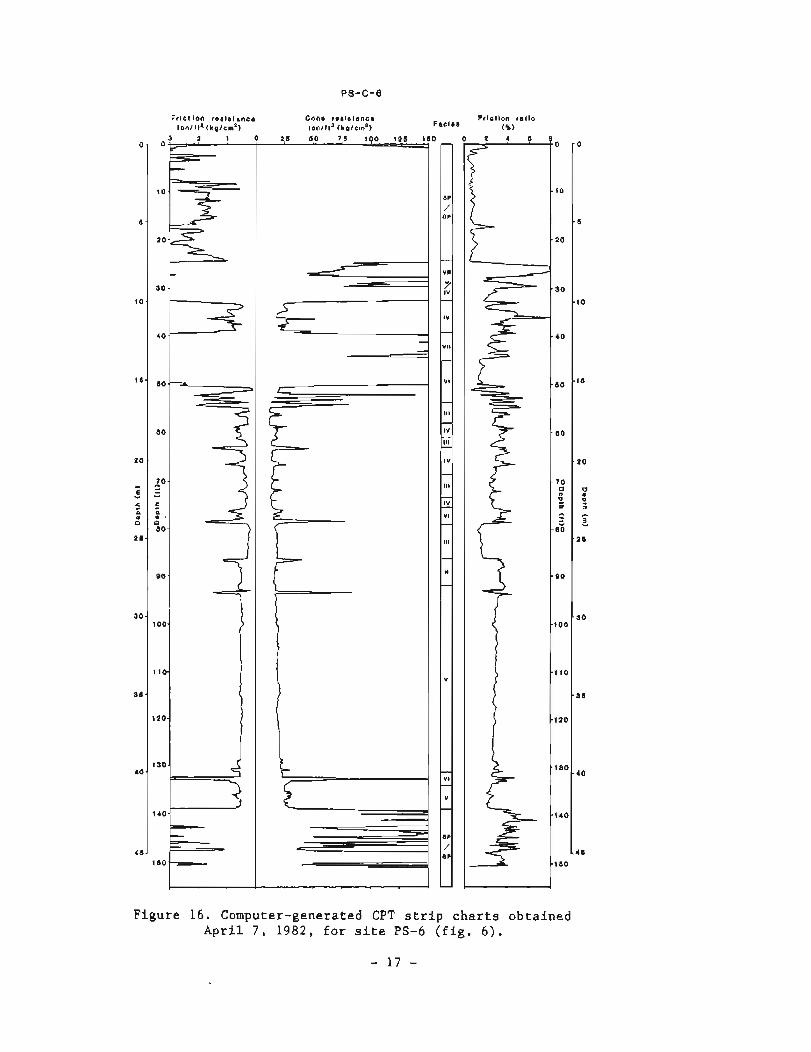
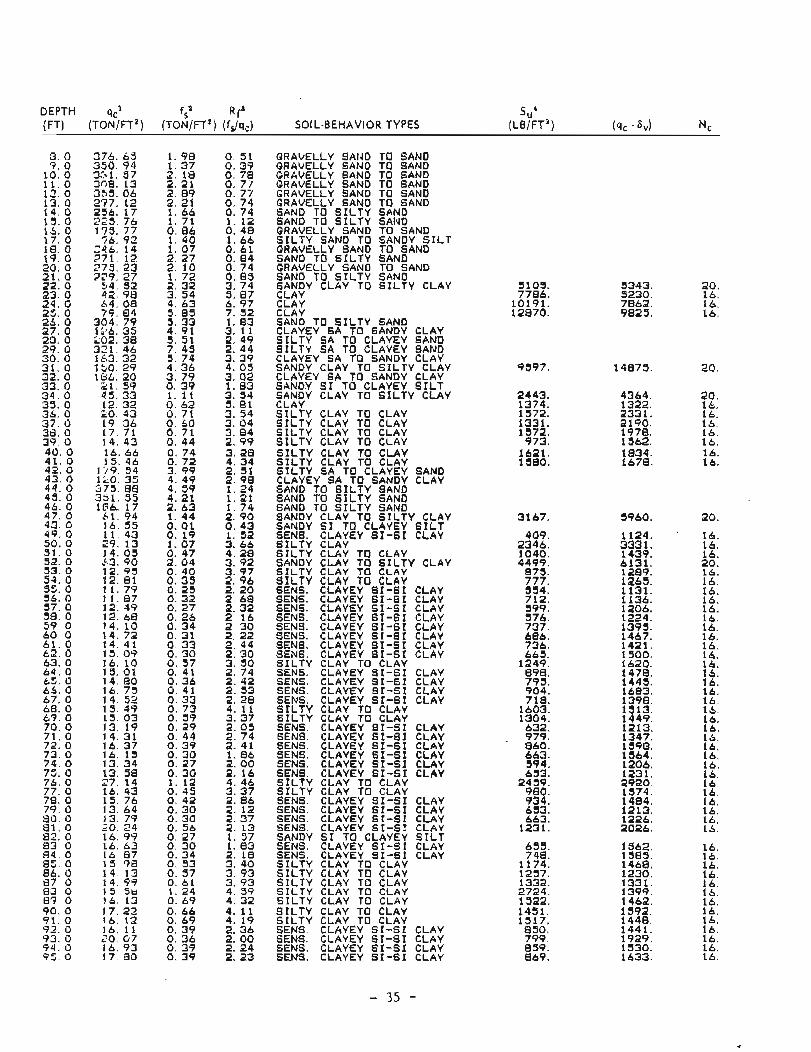
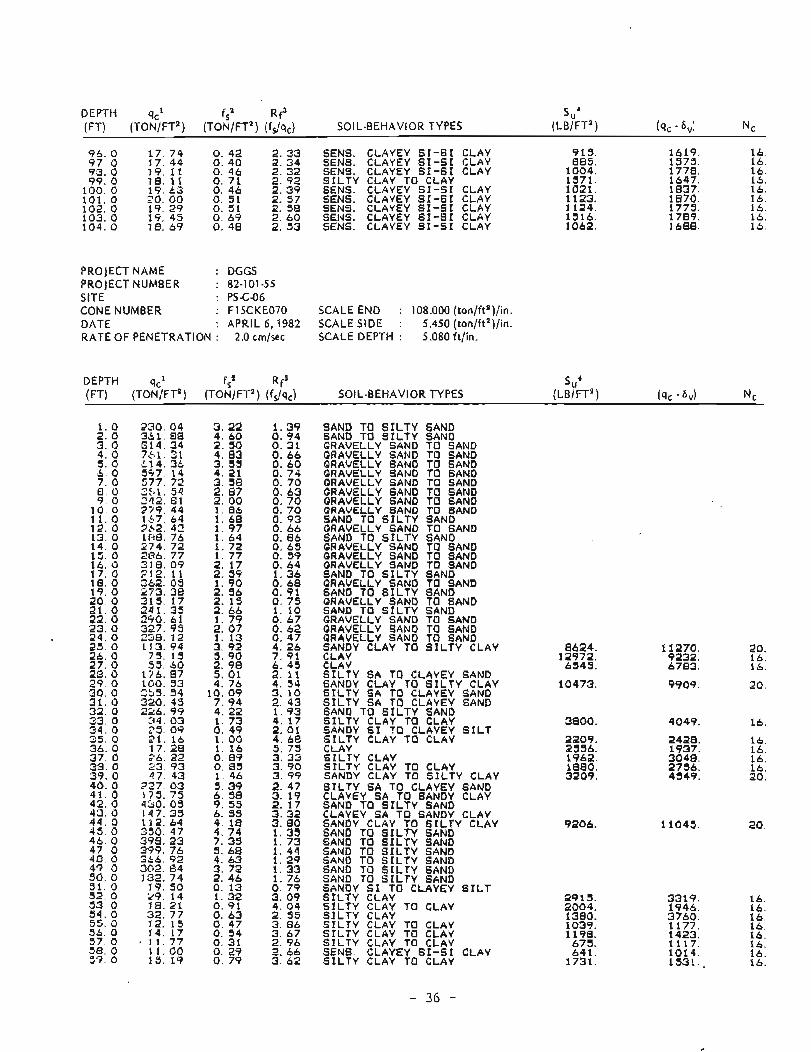
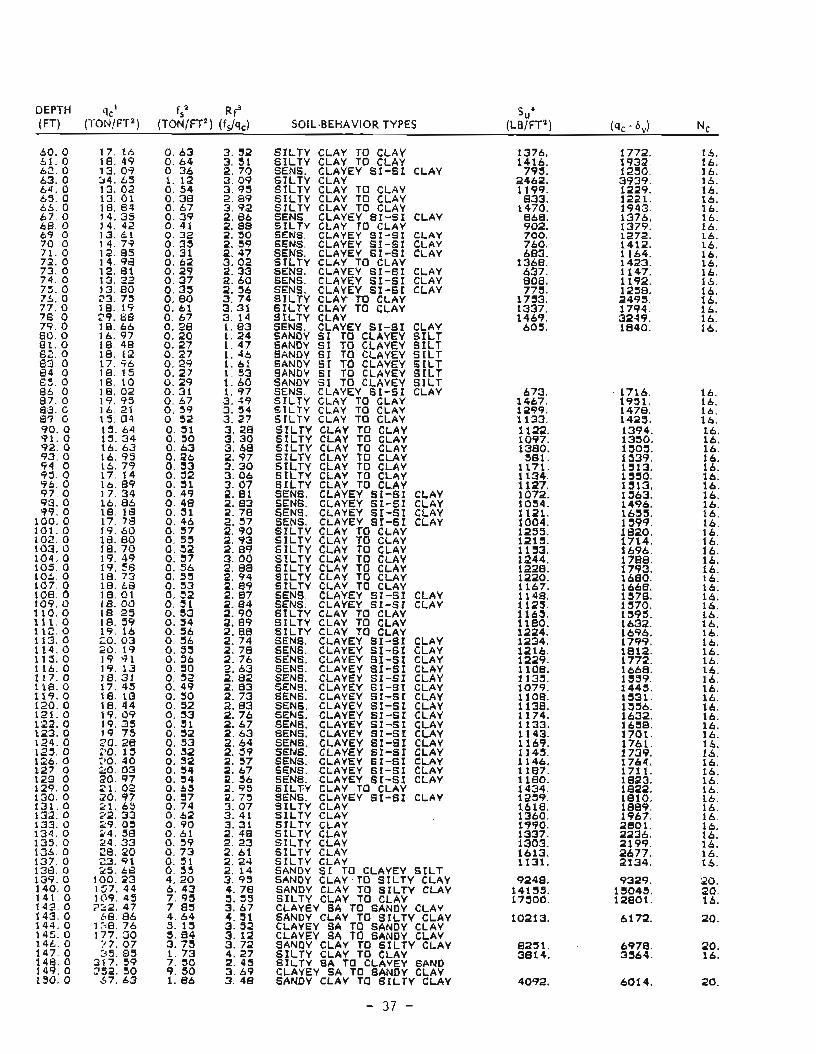
Eight CPT soundings were taken at the Delaney Park strip on April 6, 7, and 13, 1982, that ranged in total depth from 30 to 48 m (98 to 157 ft). The resultant stripcharts, shown in figures 112through 18, include the friction resistance (sleeve friction, fs, in tonlft ), cone resistance (end bearing, q , in ton/ft2), and friction ratio (Rf = fs/qc ). All soundings except ~5-C-4 and PS-C-5 penetrated the base of the Bootlegger Cove Formation.
The appendix lists the tabulated CPT soil-behavior predictions derived from the CPT profiles. The Ertec computer program estimates soil types by tracking the cone end-bearing values (q ) and the average friction ratio (Rf)
C
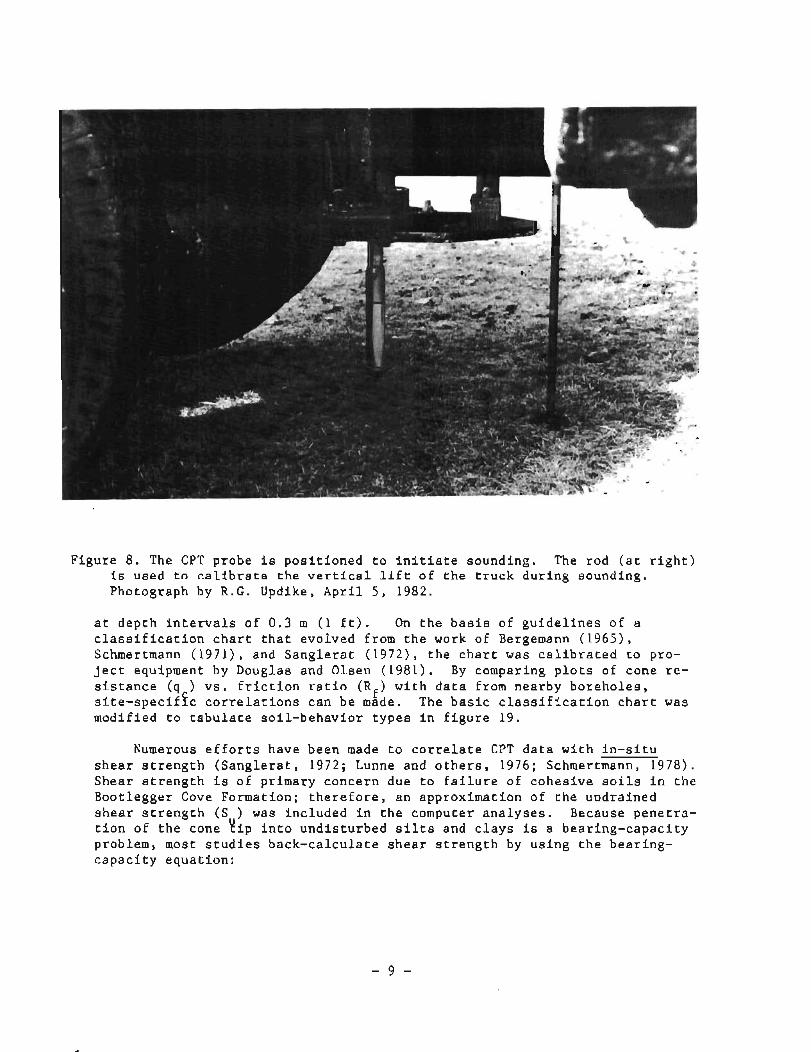
Figure 8. The CPT probe is positioned to initiate sounding. The rod (at right) is used to calibrate the vertical lift of the truck during sounding. Photograph by R.G. Updike, April 5, 1982.
at depth intervals of 0.3 m (1 ft). On the basis of guidelines of a classification chart that evolved from the work of Bergemann (1965), Schmertmann (1971), and Sanglerat (1972), the chart was calibrated to pro- ject equipment by Douglas and Olsen (1981). By comparing plots of cone re- sistance (q ) vs. friction ratio (Rf) with data from nearby boreholes, site-speciftc correlations can be made. The basic classification chart was modified to tabulate soil-behavior types in figure 19.
Numerous efforts have been made to correlate CPT data with in-situ shear strength (Sanglerat, 1972; Lunne and others, 1976; Schmertmann, 1978). Shear strength is of primary concern due to failure of cohesive soils in the Bootlegger Cove Formation; therefore, an approximation of the undrained shear strength (S ) was included in the computer analyses. Because penetra- tion of the cone tip into undisturbed silts and clays is a bearing-capacity problem, most studies back-calculate shear strength by using the bearing- capacity equation:
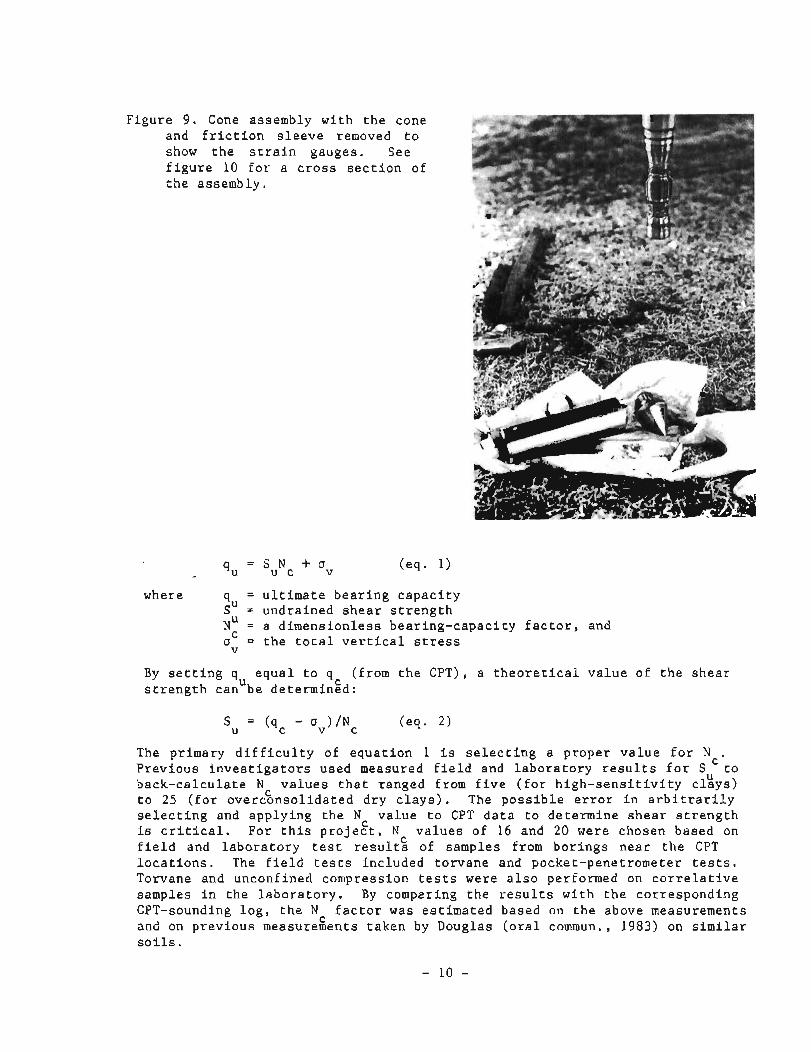
Figure 9. Cone ass and friction show the str figure 10 for the assembly.
embly with the cone sleeve removed to ain gauges. See a cross section of
where = ultimate bearing capacity :u - undrained shear strength N~ = a dimensionless bearing-capaci ty factor, and oC = the total vertical stress v
By setting q equal to q (from the CPT), a theoretical value of the shear strength canUbe determingd:
The primary difficulty of equation 1 is selecting a proper value for N . Previous investigators used measured field and laboratory results for suC to back-calculate N values that ranged from five (for high-sensitivity clays) to 25 (for overc%nsolidated dry clays). The possible error in arbitrarily selecting and applying the Nc value to CPT data to determine shear strength is critical. For this project, N values of 16 and 20 were chosen based on field and laboratory test results of samples from borings near the CPT locations. The field tests included torvane and pocket-penetrometer tests. Torvane and unconfined compression tests were also performed on correlative samples in the laboratory. By comparing the results with the corresponding CPT-sounding log, the N factor was estimated based on the above measurements and on previous measuregents taken by Douglas (oral commun., 1983) on similar soils.
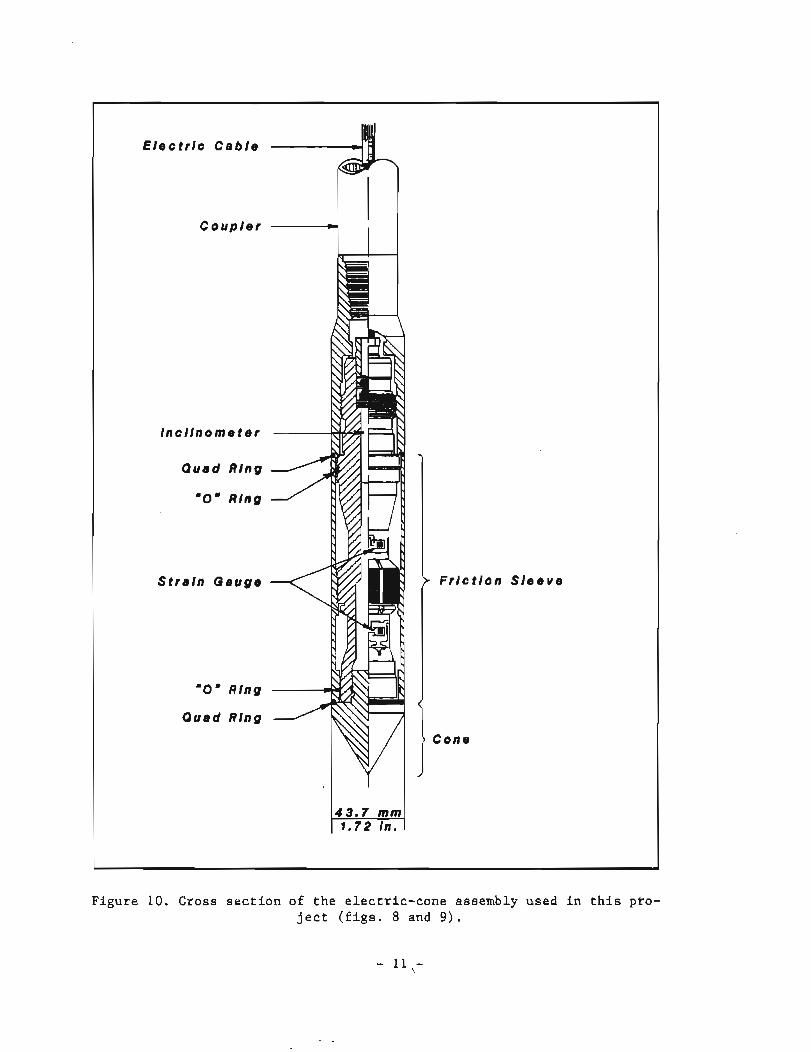
Figure 10. Cross section of the electric-cone assembly used in this pro- ject (figs. 8 and 9).
- 11 -
E l e c t r i c C a b l e
C o u p l e r
l n c l l n o m e t e r
> Q u a d Rlng
'Om Rlng
S t r a i n G a u g e
' 0 " Rlng <
Q u a d Ring
J
) F r l c t l o n S l e e v e
C o n e
F r l c t l o n r e e l s t a n c e t o n l t t 2 ( k g l c m 2 )
0
C o n e r e s i s t a n c e ton1i t2 ( k g l c m 2 )
2 5 5 0 7 6 1 0 0 1 2 6 1
F r i o t l o n rat lo (96)
Figure 11. Computer-generated CPT strip charts obtained April 6, 1982, for site PS-1 (fig. 6).
- 12 -
Friction resistance Cone reslatance FaCleo ~ r l c t l o n ratio tonl f r2 (kplcrn2) tonl l t2 (kglcm2) (%)
Figure 12. Computer-generated CPT strip charts obtained April 6, 1982 , for site PS-2 (fig. 6).
PS-C-3
Friction realstance Cone resistance Facies Friction ratio t o n l l t 2 (kglcm2) tonl l t2 (kg/cm2) (%)
0 - 0 0
10 10
6 -
20 2 0
30 30
10-
40 40
60 60
e 0
20-
70 - - 7 0 E = - w P 2 0- = D m - 0 n =
80 85 26-
90 90
30 - (00 100
110 110
36-
1 20 120
40- I3O 130
140 140
46-
160 160
-0
6
-1 0
- I 6
-20
P S = - 3 w
- 26
- 30
-36
- 40
- 46
Figure 13. Computer-generated CPT strip charts obtained April 6, 1982, for site PS-3 (fig. 6).
- 14 -
Frlct lon realstance Cone realstance t o n l f t 2 (kglcm2) tonl l t2 (kg/em2)
Faclec
o , 0 3 ? ! 0 I 2.6 1 n 6 0 76 100 126 160
I Frlct lon ratlo (961
Figure 14. Computer-generated CPT strip charts obtained April 6, 1982, for site PS-4 (fig. 6).
For comparative purposes, S was also calculated based on the hypothesis that the sleeve-friction value (Y ) represents the shear-strength value be- tween the calculated undisturbedSshear strength and the remolded shear strength (Schmertmann, 1978). A dimensionless constant of 1.10 was multi- plied by the fs values to derive the second set of SU values tabulated in the appendix. Because of the present lack of a theoretical understanding of the cone-sleeve-soil interaction and the remolding phenomena as the tip pssses through a cohesive soil, the calculation of S based on CPT data should be regarded cautiously. u
Frlctlon rat lo (%)
Figure 15. Computer-generated CPT strip charts obtained April 6, 1982, for site PS-5 (fig. 6).
CALIBRATION AND CORRELATION
The character of each engineering-geologic facies of the Bootlegger Cove Formation has been carefully documented in several areas of Anchorage (Updike, 1982, 1986; Updike and others, 1982; Updike and Carpenter, 1986; Updike and Ulery, 1986). On the basis of field and laboratory inspection of numerous samples of each facies, the CPT profiles can be calibrated to dis- tinguish these facies throughout Anchorage. The following characteristics can be applied to other CPT profiles of the formation. F.1 is not listed because true clay layers are generally too thin to be distinguished on a CPT profile .
Frlct Ion reslatance Cone reelstance Facles
Fr lct lon rat lo tonl l t2(kplcrn2) tonl f t2 (kglcm2) (%)
-0
6
-10
0 -
6 -
10-
16-
20 -
- E " 5 n m 0
28 -
30 -
35-
40 -
46d
3 2 1 0 25 60 76 100 126 160 0 2 4 6 8
Figure 16. Computer-generated CPT strip charts obtained April 7 , 1982, for site PS-6 (fig. 6).
- 1 7 -
J.0
-10
- 20
- 30
40
60
80
70 :: - - I a m 0 80
90
100
110
120
130
140
160
0
Z 10
- 40
-80
.20
- 70 B P I! I! = 3 - - = 3
-8; "
.25
- 90
- 30 -1 00
-1 10
-36
-1 20
-40
-140
- 46 -160
20
30 - /
/ -
F. I1 P r o f i l e r e l a t i v e l y smooth wi th minor sp ikes due t o sandy-s i l t l a v e r s .
R; = 2 t o 4 percent
F. 111 P r o f i l e very smooth wi th a v e r t i c a l s lope. < 15 t o n / f t 2 :: <
0.4 t o n / f t 2
Rf < 2 percent
F. I V P r o f i l e very e r r a t i c wi th numerous sp ikes ; o f t e n s lopes toward the ' 0 ' l i n e wi th inc reas ing depth. = 15 t o 35 t o n / f t 2
:C = 1 t o 2 t o n / f t 2 s
Rf = 3 t o 7 percent
P r o f i l e e r r a t i c , bu t o f t e n bell-shaped; sp ikes due t o sand and s tones .
R; = 3 t o 7 percent
F.VI P r o f i l e shows abrupt sp ikes on t h r e e curves. = 25 t o 50 t o n / f t 2
:i > 1 t o n / f t 2
Rf > 4 percent
F.VII P r o f i l e shows abrupt sp ike on q minor sp ike on f trough on R,
c s ' > 160 t o n / i t 2 :: <
2 t o n / f t 2 R < 1 percent f
Other geologic u n i t s found by CPT soundings a t Delaney Park s t r i p a l s o produce d i s t i n c t i v e p r o f i l e s . The s t r a t i f i e d sand-and-gravel g l a c i a l outwash depos i t s y i e l d e r r a t i c , bu t c o n s i s t e n t l y high qc and f s p r o f i l e s , and the r e s u l t a n t Rf p r o f i l e was genera l ly l e s s than 1 percent . The upper meter of s o i l was f rozen during the soundings and produced sp ikes t h a t were of f the s c a l e f o r q and f wi th a r e s u l t a n t R near zero. Sediments below t h e Boot- legger coveC~ormat?on were a l s o gene ra f ly of f t he s c a l e f o r q and f - numer-
s ' ous ' t roughs ' i n d i c a t e s i l t in t e rbeds . F r i c t i o n r a t i o s f o r tfiese deep s o i l s u sua l ly exceed 2 percent .
Eleven geotechnica l boreholes previously d r i l l e d by p r i v a t e i ndus t ry i n o r near t he Delaney Park s t r i p were s e l e c t e d f o r s t r a t i g r a p h i c c o r r e l a t i o n . The CPT soundings were c a l i b r a t e d according t o t h e f a c i e s c r i t e r i a discussed above. The c ros s s ec t ion s e l e c t e d ( f i g . 6 ) passes through a l l of the CPT s i t e s (except PS-1 and PS-2) and is near t he chosen boreholes . The borehole logs were c a l i b r a t e d using the previously e s t ab l i shed engineering-geologic- f a c i e s c r i t e r i a of Updike and Carpenter (1986). The r e s u l t a n t s t r a t i g r a p h i c c ros s s e c t i o n ( f i g . 20) shows an e x c e l l e n t match between major u n i t s .
Friction resistance Cone resistance FaC,es ~ r i c l i o n ratio ton l l t2 (kg/cmz) tonIf t2 (kglcrn2) ($1
- -2 & -
2 0 - - 2 0
7 0 - E = Y "
5 f a n PI PI 0 0
8 0 2 5 -
8 0
30 - 1 0 0
110
- 3 6 1.1 -1 2 0
1
130 4 0 - -1 3 0 - 4 0
140
4 6 - 1 5 0
180
Figure 1 7 . Computer-generated CPT s t r i p c h a r t s o b t a i n e d A p r i r 13, 1982, f o r s i t e PS-7 ( f i g . 6 ) .
- 19 -
26 5 0 7 6 100 128 -
- - -
< L - -
0 150
6 -
1 0 -
1 6 -
-
SP
/ OP
-
V I I
- I V
- V I
- 111
-
0 2 4 6
1 0 - - -
20-
- -
40-
50 -
f o
- 1 0
- 20
- 3 0
- 4 0
- 5 0
- 0
6
- 1 0
- I 6
Frlct lon reslatance t o n l f t 2 ( k g l c m 2 )
0
t o
2 0
3 0
40
Cone r e a l a l a n c e t o n l f t 2 ( k g / c m 2 )
Fsclea Frlctlon ratlo
(%)
Figure 18. Computer-generated CPT strip charts obtained . .. April 13, 1982, for site PS-8 (fig. 6).
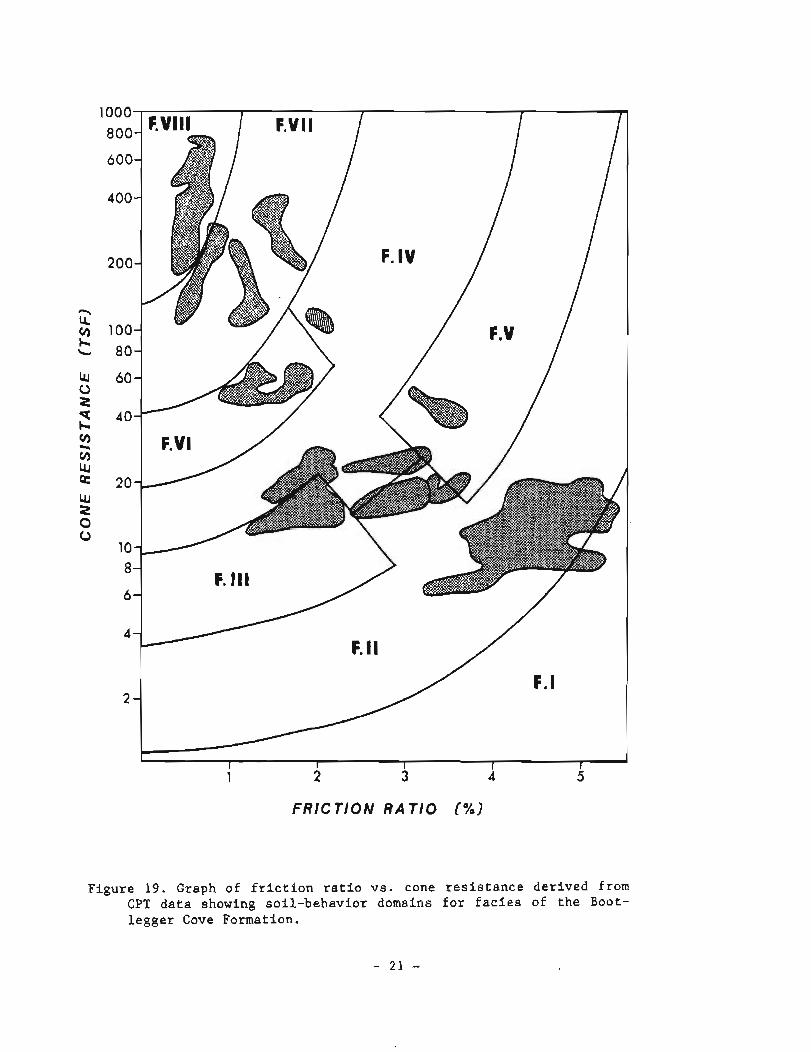
FRICTION R A T I 0 ( % I
Figure 19. Graph of f r i c t i o n r a t i o v s . cone r e s i s t a n c e d e r i v e d from CPT d a t a showing s o i l - b e h a v i o r domains f o r f a c i e s of t h e Boot- l e g g e r Cove Formation.
West
2 - C - ". v
East A - E 3 -
5 .d C
5 3
30 - 25-
20 - 15-
10-
5-
Mean sea level -
-5 - -10-
-15-
-20 -
-25 -
-30 -
Figure 20. East-west cross section based on geotechnical boreholes and cone-penetration soundings along Delaney Park strip, downtown Anchorage (see figs. 5 and 6).
E E: .- -0
.- C s >
Li 3 - 100 - - 80 - - 60 - - 40 -
-20 -
- 0 -
- -20 - - -40 - - -60 - - -80 - - -100
- 30 - 25
- 20
- 15
- 10
- 5
Mean - O sea level
- -5 - -10
- -15 - -20 --25
-930
Three main stratigraphic units are recorded on the profiles: 1) very late Pleistocene (post-Bootlegger Cove Formation) glacial outwash sand and gravel deposits; 2) late Pleistocene Bootlegger Cove Formation; and 3) late Pleistocene (pre-Bootlegger Cove Formation) diamicton and glaciofluvial de- posits. The uppermost unit varies from 6 to 11 m (20 to 35 ft) thick; the top 0.60 to 0.76 m (2 to 2.5 ft) is seasonally frozen. The Bootlegger Cove Formation is consistently about 38 m (125 ft) thick over a horizontal dis- tance of approximately 1,212 m (4,000 ft). The unit below the Bootlegger Cove Formation is far more overconsolidated than the soils above so that pen- etration was very difficult, and resistance quickly exceeded the equipment's 20-ton capacity. Borehole logs indicate that this unit is several meters thick and varies from overconsolidated clayey silt to sandy gravel. The abrupt transition in qc and f values at the contact between th,e Bootlegger Cove Formation and these oldef sediments supports the interpretation that the contact marks a substantial time hiatus. The high end-bearing values below the contact also indicate either substantially higher lithostatic loads in pre-Bootlegger time or a long time interval in which these older sediments were exposed to desiccation and weathering. The latter explanation would most adequately be explained by an episode of tidewater glaciation that preceded deposition of the Bootlegger Cove Formation.
In the Bootlegger Cove Formation, all facies are distinguishable except for F.1, which is generally only identifiable in laboratory samples. A typi- cal sequence of facies zones predominates throughout the series of holes and CPT soundings (fig. 20): (from top to bottom) zone 1) sands of F.VI and F.VII with minor F.IV; zone 2) a sequence of F.IV that intertongues with F.VI and F.VII to the east; zone 3) a uniform, thick sequence of interbedded F. 11, F.111, and F. IVY with thin, but distinct intercalated layers of F.VI less than 1 m (3.3 ft) thick; zone 4) a continuous layer of F. I1 with dis- continuous F.111 layers; and zone 5) an overconsolidated layer of F.V that marks the formation's base (fig. 20). The sensitive F.111 generally occurs at elevations between -2 to +10 m (-5 to +35 ft) from mean sea level. This sequence of zones is remarkably consistent along the cross section.
CONCLUSIONS
Although the logs recorded by the CPT system correlate very well with the geotechnical-borehole logs, they result from continuous soundings and yield a more detailed characterization of the soil than can be attained from a discontinuous sampling technique. The CPT approach is most effective in a testing program complemented by conservative drilling, sampling, and labora- tory testing.
The correlation of borehole logs and CPT profiles in the Delaney Park strip provides a three-dimensional stratigraphic picture consistent with the previously proposed model of a quiet-water depositional basin near ablating ice margins. The early phase of this system included the accumulation of F.V ice-rafted debris. The succeeding time interval of probably hundreds or thousands of years, represented by F.11 and F.111, was a period of shallow marine deposition. The climax of basin deposition consisted of more varied textures of interbedded clays, silts, and sands (F.11, F.111, F,IV, and F.VI) in a restricted basin where fresh water from nearby glaciers could affect
sedimentation rates and energy. The top of the formation is marked by a bed of silty fine sand (F.VI) to medium sand (F.VI1) that represents the final withdrawal of sedimentary basin waters, after which the glaciolacustrine- glaciomarine cohesive sediments were covered by emergent tidal-flat sands.
The L Street landslide resulted from failure within a 9-m-thick zone (30 ft) directly above modern sea level. F.111 occurs within this zone throughout the study area and is of primary importance in analyzing local seismic-slope stability. Therefore, geotechnical testing for design work in downtown Anchorage should evaluate soils to a depth of at least 45 m (150 ft). These studies should also measure strength degradation of the silty clay under cyclic-loading conditions from depths below 23 m (75 ft). Although F.11 and F.111 have similar undisturbed shear-strength values, dynamic loading produces significantly different strain behavior between the two facies (Updike and others, 1982). Unless sampling and testing are carefully performed, these differences may be overlooked. Because of the horizontal strata, facies variation can confidently be projected through a particular site, although some fluctuation in elevation should be anticipated.
The L Street landslide is particularly interesting because several me- ters of horizontal displacement occurred with very little vertical displace- ment except in the 'graben' that developed at the back of the sliding block. Studies by Updike (1983, 1984) and Updike and Carpenter (1986) state that the F.VI and F.VII units have low liquefaction susceptibility, even during major earthquakes. Updike and Clscarson (1984) found that F.111 typically has an open boxwork fabric very similar to the sensitive clay fabrics cited in engi- neering literature (for example, Mitchell, 1976). Failure along beds of F.111 in the L Street area under long-duration cyclic stress would result in horizontal displacement on the developed glide plane. The significantly higher strength of the overlying soils would allow displacement of the slide block with only minor distress or vertical displacement.
ACKNOWLEDGMENTS
This project was supported by funds provided by a cooperative agreement between DGGS and the U.S. Geological Survey under the U.S. Geological Survey Earthquake Hazards Reduction Program. Personnel of Earth Technology Corpo- ration were essential to the success of this investigation and include Bruce Douglas, Brenda Meyer, George Edmonds, and Richard Renaud. T.L. Youd (U.S. Geological Survey) helped define the scope of the project. S.E. Rawlinson (DGGS) reviewed the manuscript.
REFERENCES CITED
Barnwell, W.W., George, R.S., Dearborn, L.L., Weeks, J.B., and Zenone, Chester, 1972, Water for Anchorage, an atlas of the water resources of the Anchorage area, Alaska: City of Anchorage and the Greater Anchorage Area Borough, 77 p.
Bergemann, H.K., 1965, The friction jacket cone as an aid in determining the soil profile: International Conference on Soil Mechanics and Foundation Engineering, Proceedings, 6th, v. 1, p. 17-20.
Brown, L.D., Reilinger, R.E., Holdahl, S.R., and Balzaks, E.I., 1977, Postseismic crustal uplift near Anchorage, Alaska: Journal of Geophysical Research, v. 82, p. 3369-3378.
Cederstrom, D.J., Trainer, F.W., and Waller, R.M., 1964, Geology and ground-water resources of the Anchorage Area, Alaska: U.S. Geological Survey Water Supply Paper 1773, 108 p.
Douglas, B.J., and Olsen, R.S., 1981, Soil classification using the electric cone penetrometer: St. Louis, Missouri, American Society of Civil Engineers Special Technical Publication, 1981, 19 p.
Hansen, W.R., 1965, Effects of the earthquake of March 27, 1964, at Anchorage, Alaska: U.S. Geological Survey Professional Paper 542-A, p. A1-A68.
Karlstrom, T.N.V., 1964, Quaternary geology of the Kenai Lowland and glacial history of the Cook Inlet Region, Alaska: U.S. Geological Survey Professional Paper 443, 69 p.
Kerr, P.R., and Drew, I.M., 1965, Quick clay movements, Anchorage, Alaska: Springfield, Virginia, National Technical Information Service, Document AD630-111, 133 p.
1968, Quick-clay slides in the U.S.A.: Engineering Geology International Journal, v. 2, p. 215-238.
Long, Erwin, and George, Warren, 1966, Buttress design earthquake-induced slides: Conference on Stability and Performance of Slopes and Embankments, Berkeley, California, Soil Mechanics and Foundations Division, American Society of Civil Engineers, p. 657-671.
Lunne, T., Eide, O., and de Ruiter, J., 1976, Correlations between cone resistance and vane shear strength in some Scandanavian soft to medium stiff clays: Canadian Geotechnical Journal, no. 13, p . 430-441.
Miller, R.D., and Dobrovolny, Ernest, 1959, Surficial geology of Anchorage and vicinity, Alaska: U.S. Geological Survey Bulletin 1093, 128 p.
Mitchell, J.K., 1976, Fundamentals of soil behavior: New York, John Wiley and Sons, 422 p.
Reger, R.D., and Updike, R.G., 1983, Upper Cook Inlet region and the Matanuska Valley, in P&w&, T.L., and Reger, R.D., eds., Guidebook to permafrost and ~uaternar~ geology along the Richardson and Glenn Highway between Fairbanks and Anchorage, Alaska: Fairbanks, Alaska Division of Geological and Geophysical Surveys Guidebook 1, p. 185-263, scale 1:250,000.
Sanglerat, G., 1972, The penetrometer and soil exploration: New York, Elsevier, 488 p.
Schmertmann, J.H., 1971, Discussion of the standard penetration test: Pan American Conference on Soil Mechanics and Foundation Engineering, 4th, San Juan, Puerto Rico, June 1971, Proceedings, v. 3, p. 90-98.
1978, Guidelines for cone penetration test, performance, and design: U.S. Department of Transportation, Federal Highway Administra- tion Report FHWA-TS-78-209, 145 p.
Schmoll, H.R., and Dobrovolny, Ernest, 1972, Generalized geologic map of Anchorage and vicinity, Alaska: U.S. Geological Survey Map I-787-A, scale 1:24,000.
Seed, H.B., 1968, Landslides during earthquakes due to soil liquefaction: Journal of Soil Mechanics and Foundations Division, American Society of Civil Engineers, v. 94, p. 1053-1122.
1976, Evaluation of soil liquefaction effects on level ground during earthquakes: Philadelphia, American Society of Civil Engineers Special Session on Liquefaction Problems in Geotechnical Engineering, p. 1-104.
Seed, H.B., and Wilson, S.D., 1967, The Turnagain Heights landslide, Anchorage, Alaska: Journal of the Soil Mechanics and Foundations Division, American Society of Civil Engineers, v. 93, p. 325-353.
Shannon and Wilson, Inc., 1964, Report on Anchorage area soil studies, Alaska, to the U.S. Army Engineer District, Anchorage, Alaska: Seattle, Shannon and Wilson, Inc., 109 p.
Trainer, F.W., and Waller, R.M., 1965, Subsurface stratigraphy of glacial drift at Anchorage, Alaska, in Geological Survey Research 1965: U.S. Geological Survey prof essionai-paper 525-D, p. D167-D174.
Ulery, C.A., and Updike, R.G., 1983, Subsurface structure of the cohesive facies of the Bootlegger Cove Formation in southwest Anchorage, Alaska: Fairbanks, Alaska Division of Geological and Geophysical Surveys Professional Report 84, 5 p, scale 1:15,840, 3 sheets.
Updike, R.G., 1982, Engineering geologic facies of the Bootlegger Cove Formation, Anchorage, Alaska [abs.]: Geological Society of America, Abstracts with Programs, v. 14, no. 7, p. 636.
1983, Seismic liquefaction potential in the Anchorage area, south-central Alaska [abs.]: Symposium on the Engineering Geology of Liquefiable Deposits in the Western U.S., Geological Society of America, Cordilleran and Rocky Mountain Section, Abstracts with Programs, v. 15, no. 5, p. 374.
1984, The Turnagain Heights landslide---an assessment using the electric-cone-penetration test: Fairbanks, Alaska Division of Geological - and ~ e o ~ h ~ s i c a l Surveys Report of Investigations 84-13, 48 p.
1986, Engineering geologic maps of the Government Hill area, Anchorage, Alaska: U.S. Geological Survey Miscellaneous Investigations Series Map 1-1610, scale 1:4,800.
Updike, R.G., and Carpenter, B.A., 1986, Engineering geology of the Government Hill area, Anchorage, Alaska: U.S. Geological Survey Bulletin 1588 [in press].
Updike, R.G., Cole, S.A.9 and Ulery, C.A.3 1982, Shear moduli and damping ratios for the Bootlegger Cove Formation as determined by resonant-column testing, in Short notes on Alaskan geology - 1981: Fairbanks, Alaska ~ivision of Geological and Geophysical Surveys Geologic Report 73, p. 7-12.
Updike, R.G., and Oscarson, Robert, 1984, The dynamic behavior of sensitive clays as indicated by microfabric studies [abs.]: Geological Society of America, Cordilleran Section, Abstracts with Programs, v. 16, no. 5, p. 338.
Updike, R.G., and Ulery, C.A., 1986, Engineering geology of southwest Anchorage, Alaska: Fairbanks, Alaska Division of Geological and Geophysical Surveys Professional Report 89 [in press].
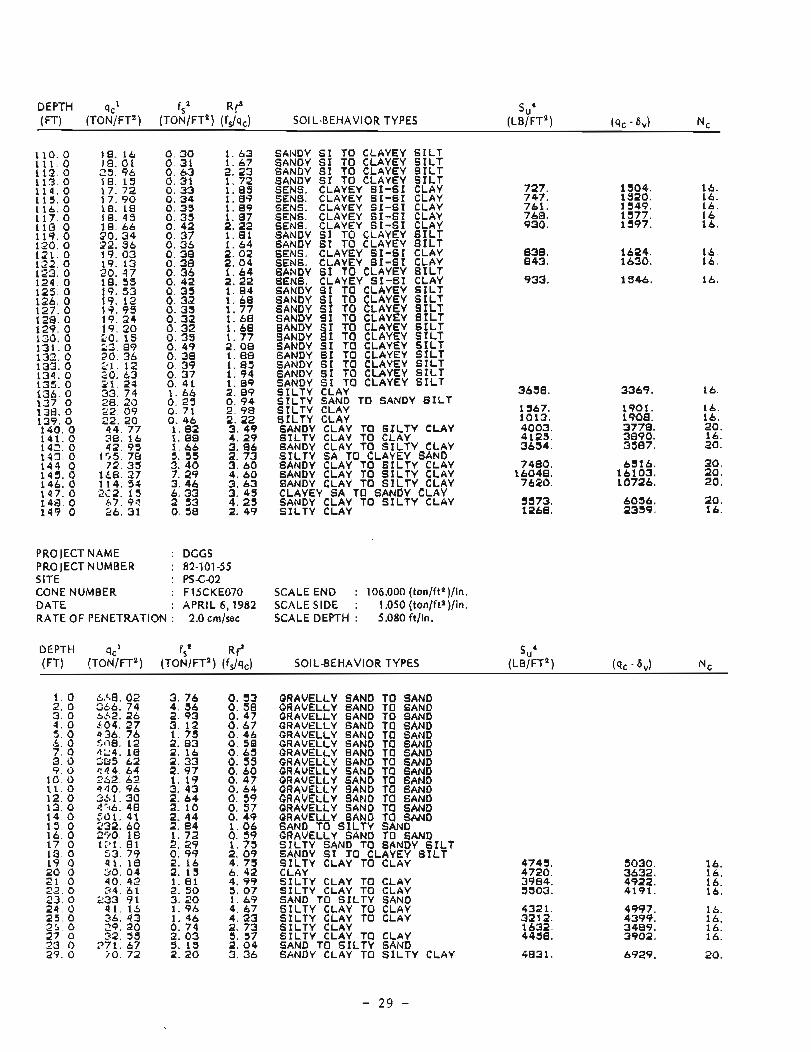
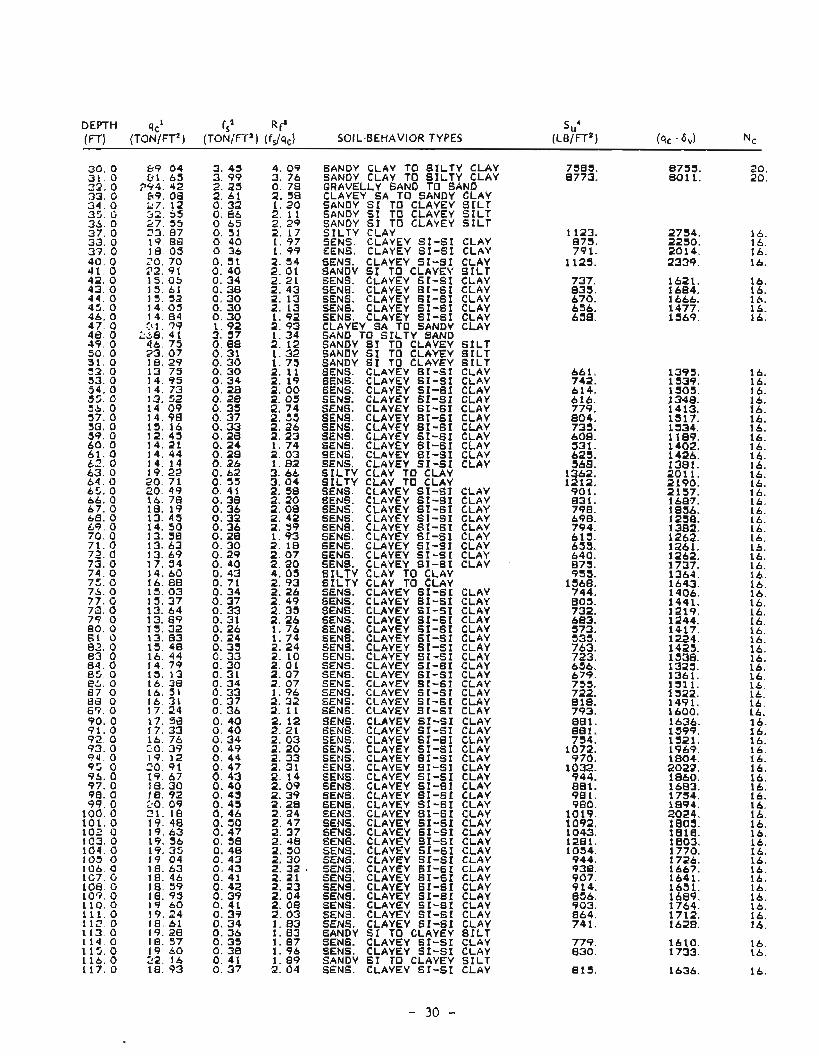
APPENDIX
Tabulated d a t a d e r i v e d from d i g i t i z a t i o n of t h e r e c t i f i e d CPT p r o f i l e s shown i n f i g u r e s 11 through 18. So i l -behav ior t y p e s a r e based on computer t r a c k i n g of f r i c t i o n r a t i o ( R f ) VS. cone r e s i s t a n c e (qc) ( f i g . 19) . Undrained s h e a r s t r e n g t h s (Su) were computer c a l c u l a t e d u s i n g t h e i n d i c a t e d e m p i r i c a l e q u a t i o n s ( s e e t e x t f o r d i s c u s s i o n ) .
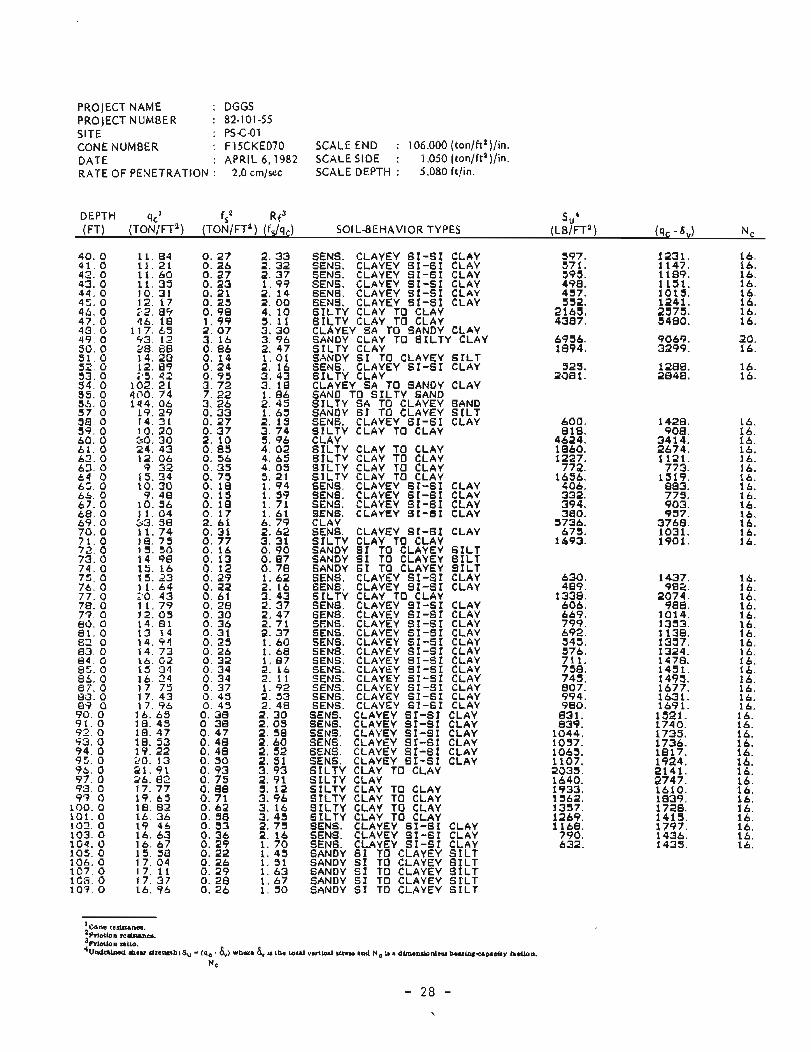
PROjECT NAME : DGGS PROJECT NUMBER : 82-101-55 SITE : PSC-01 CONE NUMBER : F15CKE070 SCALE END : 106.000 (ton/ft2)/in. DATE : APRIL 6, 1982 SCALE SIDE : 1.050 (ton/ft2)/in. RATE OF PENETRATION : 2.0 cmlsec SCALE DEPTH : 5.080 ft/in.
DEPTH qcl f ," Rf3 su4 (FT) (TON/FTZ) (TON/FTZ) (f Jqc) SO1 L-BEHAVIOR TYPES (LB/FT2) (4c - 6,) Nc
SENS. CLAYEY S I - S I SENS. CLAYEY S I - S I SENS. CLAYEY S I - G I GENS. CLAYEY S I - S I SENS. CLAYEY S I - S I SENS. CLAYEY S I - S I S I L T Y CLAY TO CLAY S I L T Y CLAY TO CLAY CLAYEY SA TO SANDY SANDY CLAY TO S I L T ) S I L T Y CLAY SANDY S I TO CLAYEY SENS. CLAYEY S I - S I S I L T Y CLAY CLAYEY SA TO SANDY SAND TO S I L T Y SAND S I L T Y SA TO CLAYEY SANDY S I TO CLAYEY SENS. CLAYEY S I - S I S I L T Y CLAV TO CLAY CLAY S I L T Y CLAY TO CLAY S I L T Y CLAY TO CLAY S I L T Y CLAY TO CLAY S I L T Y CLAY TO CLAY SENS. CLAYEY S I - S I SENS. CLAYEY S I - S I SENS. CLAYEY S I - 6 1 SENS. CLAYEY S I - 6 1 CLAY SENS. S I L T Y SANDY SANDY SANDY SENS. SENS. S I L T Y SENS. SENS. SENS. SENS. SENS. SENS. SENS. SENS. SENS. SENS. SENS. SENS.
SENS. SENS. SENS. SENS. SENS. SENS. S I L T Y S I L T Y S I L T Y S I L T Y S I L T Y S I L T Y SENS. SENS. SENS. SANDY SANDY SANDY SANDY SANDY
CLAYEY S I - S I CLAV TO CLAY S I TO CLAYEY S I TO CLAYEY S I TO CLAYEY CLAYEY S I - S I CLAYEY S I - S I CLAY TO CLAY CLAYEY S I - S I CLAYEY S I - S I CLAYEY S I - S I CLAYEY S I - S I CLAYEY S I - S I CLAYEY S I - S I CLAYEY S I - S I CLAYEY S I - S I CLAYEY SI -ST CLAYEY S I - S I CLAYEY S I - S I CLAYEY S I - S I CLAYEY S I - S I CLAYEY S I - S I CLAYEY S I - S I CLAYEY S I - S I CLAYEY S I - S I CLAYEY S I - S I CLAY TO CLAV CLAY CLAY TO CLAY CLAY TO CLAY CLAY TO CLAY CLAY TO CLAY CLAYEY S I - S I CLAYEY S I - S I CLAYEY S I - S I S I TO CLAYEY S I TO CLAYEY S I TO CLAYEY S I TO CLAYEY S I TO CLAYEY
CLAY CLAV CLAY CLAY CLAY CLAY
CLAY ' CLAY
S I L T CLAY
CLAY
SAND S I L T CLAY
CLAY CLAY CLAY CLAY
CLAY
S I L T S I L T S I L T CLAY CLAY
CLAY CLAY CLAY CLAY CLAY CLAY CLAY CLAY CLAY CLAY CLAY CLAY
CLAY CLAY CLAY CLAY CLAY CLAY
CLAY CLAY CLAY S I L T S I L T S I L T S I L T S I L T
:cone redstance. Friction realatance.
p r i c t ~ o n ratio. Undnhed sheu strength; 9, - (qc . &,) where &, ia the t o w ver t ld stress and Nc ia a dimendonless bauing-capaclty faction.
DEPTH qcl fs2 Rf3 (FT) (TON/FTz) (TON/FTZ) (f$qc) SO1 L-BEHAVIOR TYPES (LB/FT2) (qc - 6,)
SU4 Nc
S I L T S I L T S I L T S I L T CLAY CLAY CLAY CLAY CLAY S I L T S I L T CLAY CLAY S I L T CLAY S I L T S I L T S I L T S I L T S I L T S I L T S I L T S I L T S I L T S I L T S I L T
Y S I L T
SILTY CLAY SANDY CLAY TO S ILTY CLAY S ILTY CLAY TO CLAY SANDY CLAY TO S ILTY CLAY S I L T Y SA TO CLAYEY SAND SANDY CLAY TO S ILTY CLAY SANDY CLAY TO S ILTY CLAY SANDY CLAY TO S I L T Y CLAY CLAYEY SA TO SANDY CLAY SANDY CLAY TO S ILTY CLAY S I L T Y CLAY
PROJECT NAME : DGGS PROJECT NUMBER : 82-101-55 SITE : PSC-02 CONE NUMBER : FlSCKE070 SCALE END : 106.000 (ton/ftz)/in. DATE : APRIL 6,1982 SCALE SIDE : 1.050 (ton/ft2)/in. RATE OF PENETRATION : 2.0 cm/sec SCALE DEPTH : 5.080 ft/in.
DEPTH qcl f? Rf3 5u4 (FT) (TON/FT2) (TON/FT2) (f Jq,) SOIL-BEHAVIOR TYPES (LB/FT~) (qc - 6") N~
GRAVELLY SAND GRAVELLY SAND GRAVELLY SAND GRAVELLY SAND GRAVELLY SANO GRAVELLY SANO GRAVELLY SAND GRAVELLY SAND GRAVELLY SAND GRAVELLY SAND GRAVELLY SAND GRAVEL-LY SAPID GRAVELLY SANO GRAVELLY SAND SAND TO S ILTY GRAVELLY SAND S ILTY SAND TO SANDY S I TO CL S ILTY CLAY TO CLAY S ILTY CLAY TO S ILTY CLAY TO SAND TO S ILTY S ILTY CLAY TO S ILTY CLAY TO S ILTY CLAY S ILTY CLAY TO SAND TO S ILTY SANDY CLAY TO
TO SAND TO SAND TO SAND TO SAND TO SAND TO SAND TO SAND TO SAND TO SAND TO SAND TO SAND TO SAND TO SAND TO SAND SAND TO SAND SANDY S I L T .AYEY S I L T CLAY
CLAY SAND S ILTY CLAY
DEPTH qcl f ~ 2 Rf3 SOIL-BEHAVIOR TYPES
su4 (FT) (TON/FT~) (TON/FT~) ( f j qc ) (LB/FT") (qc - 6 , ) Nc
DEPTH qcl f2 Rf3 Su4 (FT) (TONIFT* ) (TONIFTZ) (fdqc) SOIL-BEHAVIOR TYPES (LBIFT~) (qc - 6,) N~
PROJECT NAME : DGGS PROJECT NUMBER : 82-101-55 SITE : PSC-03 CONE NUMBER : F15CKE070 SCALE END : 106.000 (ton/ftl)/in. DATE : APRIL 6,1982 SCALE SIDE : 1.050 (ton/ftz)/in. RATE OF PENETRATION : 2.0 cm/sec SCALE DEPTH : 5.080 ft/in.
DEPTH qcl f ~ Z RfS Su4 (FT) (TON/FTZ) (TON/FTZ ) (fJqc) SO1 L-BEHAVIOR TYPES (LBIFTZ) (4c - 6,) Nc
DEPTH qc' f2 Rf3 Su4 (FT) (TON/FT2 (TON/FT2) (fJqc) SOIL-BEHAVIOR TYPES (LBIFT*) (qc - 6,) NC
is. ae 19. 55 19. 58 91. 58 20. 12 19.95 19. 52 19. 43 20.23 19. 96 20. 12 20. 5 8 12. 33 20.43 20.95 LO. 13 19. 63 19. 86 19. 88 20. 96 20. 90 21. 14
SILTY SILTY SILTY SENS. SENS. SANDY SAND 1 SAND 1 SANDY SANDY SENS. SANDY SENS. SENS. SENS. SENS. SENS. SENS. SILTY SENS. SILTY SILTY SILTY SENS. SENS. SENS. SENS. SILTY SENS. SENS. SENS. SILTY SILTY SILTY SENS. SILTY SENS. SENS. SENS. SENS. SENS. SENS. SENS. SENS. SENS. SENB. SEr.I.5. SENS. SENS. SENE.;. SENS. SENS. SENS. SENS. SENS. SENS. SENS. SILTY SENS. SENS. SENS. SENS. SENS. SENS. SENS. SENS. SENS. SILTY SENS. SENS. SENS. SENS. SENS. SENS. SENS. SENS. SILTY SANDY SENB. SENS. SENS. SENS. SENS. SENS. SENS. SENS.
CLAY TO CLAY CLAY TO CLAY CLAY TO CLAY CLAYEY S I - S I CLAYEY S I - S I CLAY TO SILT) '0 SILTY SAND 'U SILTY SAIdD S I TO CLAYEY S I TO CLAYEY CLAYEY S I - S I S I TO CLAYEY CLAYEY S I - S I CLAYEY S I - S I CLAYEY S I - S I CLAYEY S I - S I CLAYEY ST-SI CLAYEY S I - S I CLAY TO CLAY CLAYEY S I - S I CLAY TO CLAY CLAY TO CLAY CLAY TO CLAY CLAYEY S I -S f CLAYEY S I - S I CLAYEY S I - S I CLAYEY S f - S I CLAY TO CLAY CLAYEY S I - S I CLAYEY S I - S I CLAYEY S I - S I CLAY TO CLAY CLAY TO CLAY CLAY TO CLAY CLAYEY S I - S I CLAY TO CLAY CLAYEY S I - S I CLAYEY S I - S I CLAYEY S I - S I CLAYEY S I - S I CLAYEY S I - S I CLAYEY S I - S I CLAYEY S I - S I CLAYEY S I -S f CLAYEY S I - S I CLAYEY S I - S I CLAYEY S I - S I CLAYEY S I - S I CLAYEY S I - S I CLAYEY S I - S I CLAYEY S I - S I CLAYEY S I - S I CLAYEY S I - S I CLAYEY S I - S I CLAYEY S I - S I CLAYEY S I - S I CLAYEY SI-S1 CLAY CLAYEY 81-S1 CLAYEY S I - S I CLAYEY S I - S I CLAYEY S I - S I CLAYEY S I - S I CLAYEY S I - S I CLAYEY S I - S I CLAYEY 31 -S I CLAYEY S I - S I CLAY CLAYEY ST-SI CLAYEY S I - S I CLAYEY S I - S I CLAYEY GI -S I CLAYEY S I - S I CLAYEY S I - S I CLAYEY S I - S I CLAYEY S I - S I CLAY S I TO CLAYEY CLAYEY 61-Sf CLAYEY S I - S I CLAYEY S I -51 CLAYEY S I - S I CLAYEY S I - S I CLAYEY S I - S I CLAYEY S I - S I CLAYEY S I - S I
CLAY CLAY
f CLAY
S I L T S I L T CLAY S I L T CLAY CLAY CLAY CLAY CLAY CLAY
CLAY
CLAY CLAY CLAY CLAY
CLAY CLAY CLAY
CLAY
CLAY CLAY CLAY CLAY CLAY CLAY CLAY CLAY CLAY CLAY CLAY CLAY CLAY CLAY CLAY CLAY CLAY CLAY CLAY CLAY CLAY
CLAY CLAY CLAY CLAY CLAY CLAY CLAY CLAY CLAY
CLAY CLAY CLAY CLAY CLAY CLAY CLAY CLAY
S I L T CLAY CLAY CLAY CLAY CLAY CLAY CLAY CLAY
DEPTH qcl f sZ Rf3 su4 (FT) (TON/FT~) (TON/FT~) (f$qc) SO1 L-BEHAVIOR TYPES (LB/FTZ) (9c - 6,) N~
CLAY CLAY TO CLAY CLAYEY S I - S I CLAY CLAY TO S I L T \ S I TO CLAYEY S I TO CLAYEY S I TO CLAYEY CLAY S I TO CLAYEY 8 1 TO CLAYEY CLAY CLAY
CLAY
f CLAY S I L T S I L T S I L T
S I L T S I L T
CLAY S I TO CLAYEY S I L T CLAY CLAY CLAY CLAY CLAY TO S I L T Y CLAY ' SA TO SANDY CLAY
CLAY TO S I L T Y CLAY CLAY TO CLAY SA TO CLAYEY SAND
PROJECT NAME : DGGS PROJECT NUMBER : 82-101-55 SITE : PSG-04 CONE NUMBER : F15CKE070 SCALE END : 106.000 (ton/ft2)/in. DATE : APRIL 6,1982 SCALE SIDE : 1.050 (ton/ft2)/in. RATE OF PENETRATION : 2.0 crn/sec SCALE DEPTH : 5.080 ft/in.
DEPTH qcl fsZ Rf3 su4 (FT) (TON/FTa) (TON/FTa) (f Jqc) SOIL-BEHAVIOR TYPES (LB/FTZ) (9c - 8,) Nc
1. 0 a. 0 3. 0 4 . 0 9. 0 6. 0 7. 0 3. 0 9. 0
10. 0 1 1 . 0 12. 0 13. 0 14. 0 15. C) 15. 0 17. 0 13. 0 13. 0 20, 0 21. 0 22. 0 23. 0 2 4 . 0 25. 0 as. 0 27. 0 23. 0 27. 0 30. 0 31. 0 32. 0 23. 0 44 .'O 33. 0 36. 0 37. 0 38. 0 39. 0
Rf/6. 99 403. 32 235. 10 179. 11 132. 35 49. 69 34 .01 J O . 51
178 . 91 3 1 1 . 40 309. 06 275. 22 Z)9. 71 2n4. B? 271. 09 254. 19 109. 29
67. 43 1119. 63 41. 75 34. 24 37. 41 71. B 2 36. 50 LA. 15 t 9 . 53 1Y9. 01 176. 15 371. 73
A7. 2 9 255. 35 43. 59 24. 30 24. 70 24. 45 33. 79 22. ;L! 21 .00 11. 40
TO SAND SAND SAND TO SAND SAND SANDY S I L T SANDY S I L T SAND TO SAND TO SAND TO SAND TO SAND SAND TO SAND TO SAND G AND TO SAND SANDY S I L T SAND
ELTY CLAY TO CLAY S I L T Y CLAY S I L T Y CLAY TO CLAY S I L T Y CLAY TO CLAY SANDY CLAY TO S I L T Y CLAY CLAY S I L T Y SA TO S I L T Y SA TO SAND TO S I L T CLAY S I L T Y SA TO CLAY S I L T Y CLAY SANDY S I TO S I L T Y CLAY S I L T Y CLAY S I L T Y CLAY S I L T Y CLAY 7 S I L T Y CLAY
CLAYEY CLAYEY
'Y SAND
CLAYEY
CLAYEY
'0 CLAY
SAND SAND
SAND
S I L T
DEPTH qcl f,2 Rf3 SU4 (FT) (TON/FT2) (TON/FTa) ( f Jqc) SOIL-BEHAVIOR TYPES (LB/FT2) (4c - 6,) NC
S I L T Y CLAY TO CLAY SENS. CLAYEY S I - S I CLAY SENS. CLAYEY S I - S I CLAY S I L T Y SAND TO SANDY S I L T CLAY SAND TO S I L T Y SAND SAND TO S I L T Y SAND CLAY S I L T Y CLAY S I L T Y CLAY TO CLAY SANDY S I TO CLAYEY S I L T CLAY
CLAY T O CLAY CLAYEY S I - S I CLAYEY S I - S I CLAYEY S I - S I CLAYEY S I - S I CLAYEY S I - 6 1 CLAYEY S I - S I S I TO CLAYEY CLAYEY S I - S I S I TO CLAYEY CLAYEY S I - S I CLAYEY S I - S I CLAYEY S I - S I CLAYEY S I - 5 1 CLAYEY S I - S I S I TO CLAYEY
S I TO CLAYEY CLAYEY S I - S I S I TO CLAYEY CLAY TO CLAY CLAYEY S I - S I CLAY TO CLAY CLAYEY 6 1 - S I CLAYEY S I - S I CLAY TO CLAY CLAYEY S I - S I CLAYEY S I - S I CLAYEY S I - S I CLAYEY S I - S I CLAYEY S I - S I CLAYEY S I - S I CLAYEY S I - S I CLAYEY S I - S I CLAYEY S i - S I CLAYEY S I - S I CLAYEY S I - S I CLAYEY S I - S I CLAYEY S I - S I CLAYEY S I - S I CLAYEY S I - S I CLAYEY S I - S I CLAYEY S I - S I CLAYEY S I - S I CLAYEY S I - S I CLAYEY S I - S I
CLAY CLAY CLAY CLAY CLAY CLAY S I L T CLAY S I L T CLAY CLAY CLAY CLAY CLAY S I L T
S I L T CLAY S I L T
CLAY
CLAY CLAY
CLAY CLAY CLAY CLAY CLAY CLAY CLAY CLAY CLAY CLAY CLAY CLAY CLAY CLAY CLAY CLAY CLAY CLAY CLAY CLAY
16. 16. 16.
16.
16. 16. 16.
16. 16. 16. 16. 16. 15. 16. 16. 16.
16.
16. 16. 16. 16. 16.
16.
16.
16. lb. 16. 16. 16. 16. 16. lb. 16. 16. 16. 16. 16. 16. 16. 16. 16, 16. 16. 16. 16. 16. 16. 16. 16. 16.
PROJECT NAME : DGGS PROJECT NUMBER : 82-101-55 SITE : PSC-05 CONE NUMBER : F15CKE070 SCALE END : 106.000 (ton/ft2)/in. DATE : APRIL 6, 1982 SCALE SIDE : 1.050 (ton/ft2)/in. RATE OF PENETRATION : 2.0 crn/sec SCALE DEPTH : 5.080 ftl in.
DEPTH qcl f: Rf3 su4 (FT) (TON/FT2) (TON/FTZ) (fJqc) SO1 L-BEHAVIOR TYPES (LB/FT2) (qc - 6,) N c
1. 0 1 4 1. 74 2. 66 2. 10 S I L T Y S A TO CLAYEY SAND 2 . 0 245.22 4 . 2 3 1 . 6 9 S A N D T O S I L T Y S A N D 3 . 0 133.72 1.10 1.06 S A N D T O S I L T Y S A N D 4. 0 '53. 46 4. 99 0. 7 8 GRAVELLY SAND TO SAND 5 . 0 590. 12 5. 38 0. 7 2 GRAVELLY SAND TO SAND 6 . 0 5H4. 14 8. 41 1. 02 GRAVELLY SAtdD TO SAND 7 . 0 455. 57 3. 61 0. 61 GRAVELLY BAND TO SAND
DEPTH qcl f ~ 2 Rf3 Su4 (FT) (TON/FT~) (TON/FT~) (fjq,) SO1 L-BEHAVIOR TYPES (LBIFT*) (9, - 6,) Nc
GRAVELLY SAND GRAVELLY SAND GRAVELLY SAND GRAVELLY SAND GRAVELLY SAND GRAVELLY SAND SAND TO S ILTY SAND TO S ILTY GRAVELLY SAND S ILTY SAND TO GRAVELLY SAND SAND TO S ILTY GRAVELLY SAND SAND TO S ILTY SANDY CLAY TO CLAY CLAY
TO SAND TO SAND TO SAND TO SAND TO SAND TO SAND SAND SAND TO SAND SANDY S I L T TO SAND SAND TO SAND SAND S ILTY CLAY
CLAY S ILTY CLAY TO CLAY SILTY CLAY TO CLAY S ILTY CLAY TO CLAY S ILTY CLAY TO CLAY
SAND CLAY
' CLAY S I L T CLAY
' CLAY
CLAY CLAY CLAY CLAY CLAY CLAY CLAY CLAY
CLAY CLAY CLAY CLAY
CLAY CLAY CLAY CLAY CLAY CLAY
CLAY CLAY CLAY CLAY S I L T CLAY CLAY
S ILTY CLAY TO CLAY S I L T Y CLAY TO CLAY SENS. CLAYEY S I - S I CLAY SENS. CLAYEY S I - S I CLAY SENS. CLAYEY S I - S I CLAY SENS. CLAYEY S I - S I CLAY
1124. ' 16. 333 1. 16. 1439. 16. 6131. 20. 1289. lb. 1265. 16. 1131. 16. 1136. 16. 1206. 16. 1224. 16. 1395. 1 I . 1467. 16. 1421. 16. 1500. 16. 1620. 16. 1478. 14. 1445. 16. 1683. 16. 1398. 16. 1913. 16. 1449. 16. 1213. 16. 1347. 16. 1590. 16. 1364. 16. 1206. 16. 1231. 16. 2920. 16. 1374. 1'5. 1484. 16. 1213. 16. 1226. 16. 2026. 16.
DEPTH qcl fs2 Rf3 Su4 ( FT) (TON/FTZ) (TON/FTZ) ( f Jqc) SOIL-BEHAVIOR TYPES (LB/FTz) (4c - 6,)
SENS. SENS. SENS SILTY SENS. SEN5. SENS. SEtdS. SENS.
CLAYEY S I - S I CLAYEY S I - S I CLAYEY S I - S I CLAY TO CLAY CLAYEY S I - S I CLAYEY S I - S I CLAYEY S I - 5 1 CLAYEY S I - S I CLAYEY S I - S I
CLAY CLAY CLAY
CLAY CLAY CLAY CLAY CLAY
PROJECT NAME : DGGS PROJECT NUMBER : 82-101-55 SITE : PSC-06 CONE NUMBER : F15CKE070 SCALE END : 108.000 (ton/ft2)/in. DATE : APRIL 6,1982 SCALE SIDE : 5.450 (ton/ft2)/in. RATE OF PENETRATION : 2.0 cmlsec SCALE DEPTH : 5.080 ft/in.
DEPTH q,' fsz Rf3 su4 (FT) (TON/FTZ) (TON/FTZ) (fs/qc) SO1 L-BEHAVIOR TYPES (LB/FT2) (qc - 6v)
SAND TO S I L T Y SAND TO S ILTY GRAVELLY SAND GRAVELLY SAND GRAVELLY SAND GRAVELLY SAND GRAVELLY SAND GRAVELLY SANO GRAVELLY SAND GRAVELLY SAND SAND TO S I L T Y GRAVELLY SAND SAND TO S ILTY GRAVELLY SAND GRAVELLY SAND GRAVELLY SAND SAND TO S I L T Y GRAVELLY SAND SAND TO S ILTY GRAVELLY SAND SAND TO S I L T Y GRAVELLY SANO GRAVELLY SAND GRAVELLY SAND SANDY CLAY TO CLAY
SAND SAND TO SAND TO SAND TO SAND TO SAND TO SAND TO SAND TO SAND TO SAND SAND TO SAND SAND TO SAND TO SAND TO SAND SAND TO SAND SAND TO SAND SAND TO SAND TO SAND TO SAND S ILTY CL
CLAY S ILTY SANDY S ILTY S ILTY SAND S ILTY SANDY SILTY C L A Y
SA TO CLAYEY SAND CLAY TO S I L T Y CLAY SA TO CLAYEY SAND SA TO CLAYEY SAND '0 SILTY SAND CLAY TO CLAY 6 1 TO CLAYEY S I L T CLAY TO CLAY
S ~ L T Y CLAY S ILTY CLAY TO CLAY SANDY CLAY TO S ILTY CLAY
DEPTH qcl f2 R f 3 (FT) (TON/FT2) (TON/FT2) (fdq,) SO1 L-BEHAVIOR TYPES (LB/FT2)
su4 (qc - 6,)
60. 0 tl. 0 62. 0 63. 0 6 4 . 0 15. 0 66. 0 67. 0 &a. 0 ti9 0 70. 0 71. 0 71. 0 73. 0 74. 0 79.. 0 75 . 0 77. 0 76. 0 79. 0 80. 0 81. 0 82. 0 83. 0 84 0 E5. 0 86 0 87 0 03 G 89 G 90. 0 91. 0 92. 0 93. 0 44. 0 95. 0 95. 0 97. a 93. 0 99. 0 100.0 101. 0 102. 0 103.0 104.0 105. 0 10.5.0 107.0 108. 0 109. 0 110.0 I l l . 0 112.0 113. 0 114. 0 119. 0 116. 0 117.0 118.0 119. 0 120.0 121.0 122.0 123. 0 124.0 1.23. 0 126.0 127. 0 123. 0 129. 0 130. 0 131.0 132. 0 133. 0 134. 0 133. 0 136. 0 137. 0 138. 0 139. 0 140. 0 141. 0 141. 0 143. 0 144. 0 145.0 141. 0 147. 0 148. 0 149. 0 130. 0
17. 16 18. 49 13. 09 54. 65 13. 02 13. 01 18. 64 14. 35 14. 42 13. Ll 14. 74 12. 85 14.9a 12. 81 13. 22 13. 00 23. 75 18. 19 29. E0 18. 66 16. 97 19. 48 18.12 17. 96 10.15 18.10 18. 02 19. 95 16. 21 15. 04 15. 64 15. 34 16. La3 16. 95 16. 79 17. 14 16. 69 17. 34 16. 86 18. 18 17. 78 19, b0 18. 80 18. 70 19. 49 19. ?a 18. 13 18. 1-8 18. 01 18. QO 18. 25 18. 39 19. 16 20.03 20. 19 19. 5'1 19. 13 18. 31 17. 45 18. 10 18. 44 19. 09 19. 35 19. 75 20. 26 2'0. 19 5,O. 40 LO. 03 go. 97 f l . 02 20.97 dl. 65 12.33 29. 03 24. 58 24. 33 28. 20 23. 5'1 25. 68 100. 23 157. 44 109. 45 P 3 2 . 47 b8. 86 1.38. 76 1?7. 30 /7. 07 35. a5 317. 99 ,152. 50 37. 63
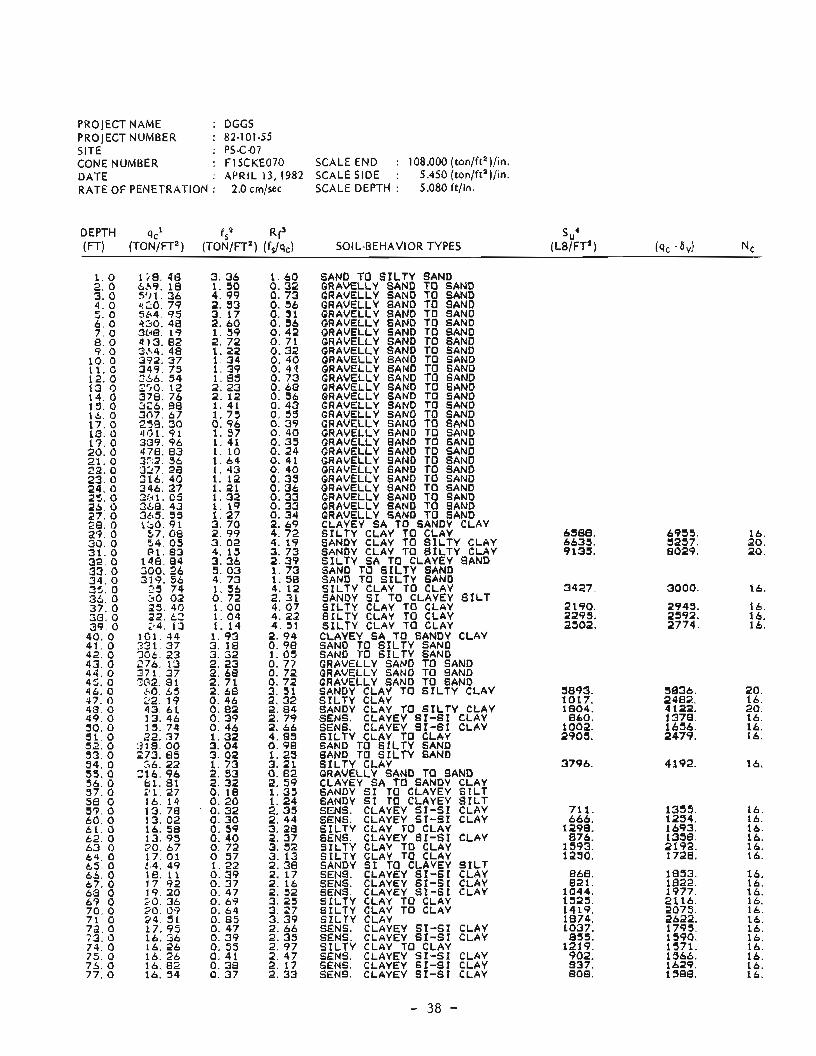
PROJECT NAME : DGGS PROJECT NUMBER : 82-101-55 SITE : PSC-07 CONE NUMBER : F15CKE070 SCALE END : 108.000 (ton/ft2)/in. DATE : APRIL 13, 1982 SCALE SIDE : 5.450 (ton/ft2)/in. RATE OF PENETRATION : 2.0 cmlsec SCALE DEPTH : 5.080 ft/in.
DEPTH qcl fs2 Rf3 Su4 (FT) (TON/FT2) (TON/FT2 ) (fJqc) SOIL-BEHAVIOR TYPES (LB /FT~ ) (qc - 6 , ) Nc
1.0 2. 0 3. 0 4.0 5. 0 6. 0 7. 0 8. 0 $. 0 10. 0 11. 0 12. 0 13. 0 14. 0 15. 0 16. 0 17. 0 13. 0 11.0 20. 0 21. 0 22. 0 23. 0 24. 0 25. 0 26. 0 27. 0 26. 0 29. 0 30. 0 31. 0 32. 0 33. 0 34. 0 35. 0 36. 0 37. 0 33. 0 39. 0 40. 0 41. 0 42. 0 43. 0 44. 0 4';. 0 41. 0 47. 0 43. 0 49. 0 50. 0 51. 0 52. 0 53. 0 94. 0 55. 0 56. 0 57. 0 58. 0 59. 0 to. 0 61. 0 62. 0 63 0 64. 0 65. 0 t b . 0 67. 0 63. 0 67. 0 70. 0 71. 0 !*>. 0 /a, 0 74. 0 75. 0 76. 0 77. 0
DEPTH qcl (FT) (TON/FT2) SOIL-BEHAVIOR TYPES
S I L T Y S I L T Y S I L T Y SENS. S I L T Y SENS. SENS. SENS. SENS. SENS. SEI4S. SENS. SENS. SENS. SENS. SENS. SENS. SENS. SENS. S I L T Y S I L T Y S I L T Y SANDY S I L T Y S I L T Y S I L T Y S I L T Y S I L T Y S I L T Y S I L T Y S I L T Y S I L T Y S I L T Y
CLAY TO CLAY CLAY CLAY TO CLAY CLAYEY S I - S I CLAY TO CLAY CLAYEY S I - S I CLAYEY S I - S I CLAYEY S I - S I CLAYEY G I - S I CLAYEY S I - S I CLAYEY G I - S I CLAYEY S I - S I CLAYEY S I - S I CLAYEY S I - S I CLAYEY S I - S I CLAYEY S I - S I CLAYEY S I - S I CLAYEY S I - S 1 CLAYEY S I - S I CLAY CLAY CLAY S I TO CLAYEY CLAY CLAY CLAY CLAY CLAY CLAY CLAY CLAY CLAY CLAY
CLAY CLAY CLAY CLAY CLAY CLAY CLAY CLAY CLAY CLAY CLAY CLAY CLAY CLAY
S I L T
PROJECT NAME : DGGS PROJECT NUMBER : 82-101-55 SITE : PSC-08 CONE NUMBER : F15CKE070 SCALE END : 108.000 (ton/ft2)/in. DATE : APRIL 13, 1982 SCALE SIDE : 5.450 (ton/ft2)/in. RATE OF PENETRATION : 2.0 cmlsec SCALE DEPTH : 5.080 ft/in.
DEPTH qcl fs2 Rf3 su4 (FT) (TON/FT2) (TON/FT') (fJqc) SO1 L-BEHAVIOR TYPES (LB/FT2) (qc - 6,) Nc
1 . 0 2. 0 3. 0 4. 0 5. 0 J. 0 7. 0 8. 0 9. 0
10. 0 11. 0 12. 0 13. 0 14. 0 is. 0 16. 0 17. 0 13. 0 19. 0 EO. 0 21.0 22. 0 2 3 . 0 2 4 . 0 2 5 . 0 2.5 0 27. 0 26. 0 29. 0 30. 0 3 1 . 0 1 32. 0 33. 0 34 0 : 33. 0 35. o 37 0 33. 0 39. 0 40. 0 41. 0 42. 0 43. 0 44. 0 45. 0 46. 0 47. 0 4 5 . 0 49 0 5G. 0 51. 0 52. 0 33. 0 54. 0 55. 0 56. 0 37 0 5 3 . 0 5 9 . 0 60. 0 C l . 0 62. 0 63. 0 6 4 . 0 L5. 0 66. 0 67. 0 68. O ti?. 0 70. 0 71. 0 72. 0 73. 0 74. 0 73. 0 75 0
104. 5i3 448 . 61 $57. 73 107. 69 541. 8s 5 7 8 . 87 L.?*O. 6b 394. 80 4$7. 43 4 1 3 . 41 4:)2. 15 333. 76 470. 39 .? t 4 . 3 4 4 4 7 . 62 373. 46 318, f!, 3G1. 4, 339. 33 234. 64 263. 86 352. 17 376. 21 3.76. 05 352. l ? 353. 56 3G6. 83 350. 30 372. 68 373. 54 405 . 27 400. 96 202. 00 109. 27
4 2 . 16 106.00
45. 92 37. 0.5 26. 39 37. 58 15. 29 05. 37
279 57 1?4. 19 271. 02 253. 08 278. 84 iF;9. 32 32. 14 56. 39 '74. 95'
. LO. 73 15. 26 11 .39 11.7'7 11. t l 14. 20 12.05 12. a1 13 .33 11. 06 12. 30 13. 05 4 4 . 0.3 14. 54 13. 97 15. 14 14. 68 2 5 . 24 18. 83 15.39 10. 67 15. 75 14. 94 15. 74 16. 93
DEPTH qcl fs2 Rf3 (FT) (TONIFT~ ) (TONIFT~) (f~q,) SOI L-BEHAVIOR TYPES (LBIFT~)
Su4 (qc - 6") Nc
77. 0 76. 0 79. 0 ao. o 81. 0 az. o a3. (5 84. 0 85. 0 86. 0 87. 0 83. 0 69. 0 90. 0 91. 0 42. 0 93. 0 94. 0 95. 0 96. 0 97. 0 98. 0 49. 0
100.0 101.0 102. 0 103. (3 104. 0 105.0 106. 0 107. 0 108.0 109. 0 110.0 111.0 112.0 113. 0 114. 0 11s. 0 116. 0 117. 0 118.0 119. 0 120. 0 121.0 122. 0 123.0 124. 0 125. 0 126. 0 127. 0 1ZB. 0 129. 0 130. 0 131. 0 132. 0 133. 0 134. 0 133. 0 136 0 137 0 1'0 0 139. 0 140. 0 141. 0 142. 0 143. 0 144. 0 145. 0 146. 0 147. 0 148. 0 119. 0 150. 0 1 5 1 . 0 152. 0 153. 0 194. 0
4 1. 33 13. 30 14. $0 14. /5' 15. 20 15. 01 15. 82 16. 79 16. 74 16. 71 18. 32 LO. 03 20.9C 20. 6 5 22. 31 12. 04 21. 08 21.39 a t . 53 20.35 20.00 19. 58 19. 13 18. 11 30. 76 17. 14 18. 2 5 17. 63 17. 93 18. 18 18. 37 18. 31 18. 93 19. 53 19. 2 5 18. 66 18. 32 18. 33 20. 61 19. 95 20.45 20. 60 10. 61 22. 02 21.77 21.26 21. 68 21. 51 21. 80 21. 23 21.85 22. 40 ?3. 19 dl. 53 21. 4L 12. 59 22. 70 23. 01 22.19 23. 79 13. 74 23. 00 24. 32 22. 59 12. OC 23. 98 2 5 . 44 24. 4 3 262. 97 169. 44 R1.74 78. 93
160. 55 37. 17 142. 71 130. 90 124. 73 424. 65
l b . 16. 16. 1 J. 16. 16. 16.