Embed Size (px)
Citation preview

NBER WORKING PAPERS SERIES
GROWTH IN CITIES
Edward L. Glaeser
Hedi D. Kallal
Jose A. Scheinkinan
Andrei Shleifer
Working Paper No. 3787
NATIONAL BUREAU OF ECONOMIC RESEARCH1050 Massachusetts Avenue
Cambridge, MA 02138July 1991
We are grateful to the National Science, Sloan, and BradleyFoundations for financial support; to Robert Barro, Gary Becker,Carol Heim, Vernon Henderson, Lawrence Katz, Robert Lucas,Sherwin Rosen, Julio Roternberg, T.W. Schultz, and George Tolleyfor helpful comments; and to Christopher Kim for researchassistance. This paper is part of NBER's research program inGrowth. Any opinions expressed are those of the authors and notthose of the National Bureau of Economic Research.

NBER Working Paper #3787July 1991
GROWTH IN CITIES
ABSTRACT
Recent theories of economic growth, including Romer (1986),
Porter (1989) and Jacobs (1969), have stressed the role of
technological spillovers in generating growth. Because such
knowledge spillovers are particularly effective in cities, where
communication between people is more extensive, data on the
growth of industries in different cities allows us to test some
of these theories. Using a new data set on the growth of large
industries in 170 U.S. cities between 1956 and 1987, we find that
local competition and urban variety, but not regional
specialization, encourage employment growth in industries. The
evidence suggests that important knowledge spillovers might be
between, rather than within industries, consistent with the
theories of Jacobs (1969).
Edward L. Glaeser Hedi D. KallalDepartment of Economics Department of EconomicsUniversity of Chicago University of Chicago1126 E. 59th Street 1126 E. 59th StreetChicago, IL 60637 Chicago, IL 60637
Jose A. Scheinkman Andrei ShleiferDepartment of Economics Department of EconomicsUniversity of Chicago Harvard University1126 E. 59th Street Littauer Center 315Chicago, IL 60637 Cambridge, MA 02138
and NBER
2
1. INTRODUCTION
Some historians have argued that most innovations are made in cities (Jacobs,
1969; Bairoch, 1988). The cramming of individuals, occupations, and industries into
close quarters provides an environment in which ideas flow quickly from person to
person. Jacobs (1969, 1984) argues that these interactions between people in cities
greatly facilitate technological advance.
Such a dynamic view of cities fits nicely with the recent work on economic
growth, which views externalities (and particularly externalities associated with
knowledge spillovers) as the 'engine of growth' (Romer 1986, Lucas 1988). If
geographical proximity facilitates transmission of ideas, then we should expect
knowledge spillovers to be particularly important in cities. After all, intellectual
breakthroughs must cross hallways and streets more easily than oceans and continents.
This paper uses a new data set on American cities and industries to test the new
growth theories. Because these theories are most compelling in the context of city
growth, our focus on cities gives them the benefit of the doubt.
We focus on three theories. The Marshall-Arrow-Romer (MAR) externality
concerns knowledge spillovers between firms in an industry. Arrow (1962) is an early
formalization; Romer (1986) is a recent and influential statement. Applied to cities
by Marshall (1890), this view says that the concentration of an industry in a city helps
knowledge spillovers between firms, and therefore the growth of that industry and of
that city. A good example would be computer chips in Silicon Valley (Arthur 1990).
Through spying, imitation, and rapid inter-firm movement of highly skilled labor, ideas
are quickly disseminated among neighboring firms. The MAR theory also predicts,
like Schumpeter (1942), that local monopoly is better for growth than local
competition, because local monopoly restricts the flow of ideas to others and so

3
allows externalities to be internalized by the innovator. When externalities are
internalized, innovation and growth speed up.
Porter (1990), like MAR, argues that knowledge spillovers in specialized
geographically-concentrated industries stimulate growth. He insists, however, that
local competition, as opposed to local monopoly, fosters the pursuit and rapid
adoption of innovation. He gives examples of Italian ceramics and gold jeweliy
industries, in which hundreds of firms are located together and fiercely compete to
innovate since the alternative to innovation is demise. Porter's externalities are
maximized in cities with geographically specialized, competitive industries.
Jacobs (1969), unlike MAR and Porter, believes that the most important
knowledge transfers come from outside the core industry. As a result, variety and
diversity of geographically proximate industries rather than geographical specialization
promote innovation and growth. One example is the brassiere industry, which grew
out of dressmakers' innovations, rather than the lingerie industry. Jacobs also favors
local competition because, like Porter, she believes it speeds up the adoption of
technology.
These theories of dynamic externalities are extremely appealing because they try
to explain simultaneously how cities form and why they grow. MAR's and Porter's
theories, in particular, predict that industries should specialize geographically -- to
absorb the knowledge spilling over between firms. In addition, they predict that
regionally specialized industries should grow faster because neighboring firms can
learn from each other much better than geographically isolated firms. In contrast,
Jacobs' theory predicts that industries located in areas that are highly industrially
diversified should grow faster. Despite their differences, all these theories have
implications for growth rates of industries in different cities. In this respect, they are

4
different from the more standard location and urbanization externality theories that
address the formation and specialization of cities (Henderson 1986), but not city
growth. -
We examine the predictions of the various theories of knowledge spillovers and
growth using a new data set on geographic concentration and competition of
industries in 170 of the largest United States cities. We ask which industries in which
cities have grown fastest between 1956 and 1987 and why? All three theories of
dynamic externalities focus on knowledge spillovers but differ in where they believe
the source of externalities is and what makes the capture of these externalities most
effective. The theories are not always mutually exclusive but rather offer different
views of what is most important. By testing empirically in which cities industries grow
faster, as a function of geographic specialization and competition, we can learn which,
if any, externalities are important for growth.
Our results can be briefly summarized. Our findings are based on a cross-
section of city-industries (e.g., New York apparel and textiles, Philadelphia apparel
and textiles, Philadelphia electrical equipment), where knowledge spillovers should be
easier to find than by looking at whole cities. In a cross-section of city-industries, we
find that, as measured by employment, industries grow slower in cities where they are
more heavily overrepresented. For example, the primary metals industry grew rapidly
in Savannah, Georgia, where it was not heavily represented in 1956, and declined in
Fresno, California, where it was heavily overrepresented. These results do not favor
the local within-industry externality theory of MAR and Porter, according to which
industries should grow faster precisely in places where they are overrepresented.
We also find that industries grow faster in cities where firms in those industries
are smaller than the national average size of firms in that industry. If we take the

5
view that spreading the same employment over more firms increases local competition
between these firms and therefore the spread of knowledge, this result supports
Porter's and Jacob's view that local competition promotes growth. One could also
take the view that smaller firms grow faster, which however is not strictly compatible
with the MAR model or with other evidence. Finally, city-industries grow faster when
the rest of the city is less specialized. This result supports Jacobs' view that city
diversity promotes growth as knowledge spills over industries. The evidence is thus
negative on MAR, mixed on Porter and consistent with Jacobs.
If MAR externalities are not important, why are so many cities specialized in a
few industries? There are many other externalities that explain regional specialization
and city formation but that do not specifically focus on knowledge spillovers and
growth. For example, Marshall (1890) has argued that firms in the same industry
often locate next to each other to share various inputs, including specialized labor.
Many other "localization" externalities are discussed by Lichtenberg (1960), Henderson
(1986, 1988), Arthur (1990), and Rotemberg and Saloner (1990), among others.
Henderson (1986) in particular presents empirical evidence indicating that output per
manhour is higher in firms that have other firms from the same industry located
nearby. Static localization externalities can thus easily account for city specialization,
but not for growth.
Finally, there is also some work explaining why firms might want to locate in
places where local demand is high, what Henderson (1986) calls "urbanization"
externalities. These models tend to predict that firms in different industries should
locate next to each other, which suggests that they cannot be the complete story of
cities. Lichtenberg (1960), Murphy, Shleifer and Vishny (1989) and Krugman
(1991a,b) all present models of such externalities. Like localization externalities,
6
urbanization externalities explain patterns of industry location rather than of growth.
We present some evidence strongly pointing to the importance of urbanization
externalities.
The next section of the paper goes through the prediction of different views of
externalities and city growth. Section 3 describes the data. Section 4 presents results
for growth of city-industries. Section 5 deals with localization and urbanization
externalities. Section 6 concludes.
2. THEORIES OF DYNAMIC EXTERNALITIES
The models of city growth we consider stress the role of dynamic externalities,
and more specifically knowledge spillovers, for city growth. According to these
models, cities grow because people in cities interact with other people, either in their
own or in other sectors, and learn from them. Because they pick up this knowledge
without paying for it, these knowledge spillovers are externalities. The frequency of
interaction with other people is ensured by their proximity in a city. Because this
proximity makes externalities particularly large in a city, all the models predict that
cities grow faster than rural areas where externalities are less important because
people interact less.
The theories of city growth that we present differ along two dimensions. First,
they differ in whether knowledge spillovers come from within the industry or from
other industries. Second, they differ in their predictions of how local competition
affects the impact of these knowledge spillovers on growth.
The MAR theory of spillovers focuses on spillovers within industry. Knowledge
accumulated by one firm tends to help other firms' technologies, without appropriate
compensation. In Silicon valley, microchip manufacturers learn from each other
because people talk and gossip, products can be reverse engineered, and employees
7
move between firms. In New York, fashion designers move between firms and take
their knowledge with them. The same was true of the Bangladeshi shirt industry in
the 1980s, where hundreds of firms were founded by people who were initially
employed by Joint venture with a Korean firm. Physical proximity facilitates this
free information transmission. In this case, industries that are regionally specialized
and benefit most from the within industry transmission of knowledge should grow
faster. Cities that have such industries should grow faster as well.
In MAR models of externalities, innovators realize that some of their ideas will
be imitated or improved upon by their neighbors without compensation. This lack of
property rights to ideas causes innovators to slow down their investment in
externality-generating activities, such as R&D. If innovators had monopoly on their
ideas, or at least if they had fewer neighbors who imitated them immediately, the
pace of innovation and growth would rise. The MAR models tend to imply that
whereas local competition is bad for growth, local concentration is good for growth
because innovators internalize the externalities (see Romer 1990).
The effect of local competition is the primary difference between MAR and
Porter's models. In Porter's model, local competition accelerates imitation and
improvement of the innovator's ideas. Although such competition reduces the returns
to the innovator, it also increases pressure to innovate: firms that don't advance
technologically are bankrupted by their innovating competitors. Porter believes that
the second effect is by far the more important. Ruthless competition between local
competitors leads to rapid adoption of the innovations of others and to improvement
upon them, and so generates industry growth. In contrast, local monopolies lead a
quieter life as their managers consume perquisites rather than risk innovation. Porter
gives striking examples of Italian ceramics and gold jewelry industries, the German

8
print making industry and many others which grew through rampant imitation of new
technologies and improvement upon them. All these industries are highly
geographically concentrated--presumably to facilitate the flow of ideas and imitation.
Because MAR and Porter agree that the most important technological
externalities are within industry, they also agree that regional specialization is good for
growth both of the specialized industries and of the cities they are in. However,
MAR would argue that local monopoly is good because it allows internalization of
externalities. In contrast, Porter would argue that local competition is good because it
fosters imitation and innovation. In our empirical work, we will look at the effects of
both specialization and local competition on the growth of industries in cities.
The third theory that stresses knowledge spillovers is that of Jacobs (1969).
Jacobs' idea is that the crucial externality in cities is cross-fertilization of ideas across
different lines of work. New York grain and cotton merchants saw the need for
national and international financial transactions and so the financial services industry
was born. A San Francisco food processor invented equipment leasing when he had
trouble finding financing for his own capital; the industry was not invented by the
bankers. In a more systematic account, Rosenberg (1962) discusses the spread of
machine tools across industries, and describes how an idea is transmitted from one
industry to another. Scherer (1982) presents systematic evidence indicating that
around 70 percent of inventions in a given industry are used outside that industry.
Much evidence thus suggests that knowledge spills over across industries. Because
cities bring together people from different walks of life, they foster transmission of
ideas.
In Jacobs' theory, industrial variety rather than specialization is conducive to
growth, because in diversified cities there is more interchange of different ideas. She
9
contrasts Manchester, a specialized textile city that eventually declined, with broadly
diversified Birmingham, which eventually flourished. Bairoch supports Jacobs by
arguing that ". . . the diversity of urban activities quite naturally encourages attempts
to apply or adopt in one sector (or in one specific problem area) technological
solutions adopted in another sector' (1988, p. 336).
In the debate between local monopoly and competition, Jacobs comes squarely
on the side of competition. She writes: "Monopolies gratuitously harm cities and
suppress what their economies are capable of achieving . . . extortionate prices,
harmful though they most certainly are, are the least of disadvantages of monopolies,
for monopolies forestall alternate methods, products and services" (1984, p. 227).
Like Porter, Jacobs favors local competition because it stimulates innovation.
Figure 1 summarizes the three theories we described. The empty square is the
model that would say that the ideas conducive to growth come from outside the
industry, but monopoly is best able to take advantage of them. The model does not
seem very plausible, and so we leave the square empty. Our next task is to put some
empirical structure on this theoretical outline.
3. THE DATA
Construction of the Data Set
Our data set was constructed from the 1956 and 1987 editions of County
Business Patterns (CBP), produced by the Bureau of the Census. The year 1956 was
chosen because it was the first year with comprehensive data; 1987 was the last year
available. 1956 data was assembled by hand from hard copy; 1987 data are available
on computer tapes.
The data set contains the information on employment, payroll, and number of
10
establishments2 by 2-digit industry for every county in the United States. We
obtained wages by dividing payroll by employment. Since our focus is on cities rather
than counties, we aggregate data across counties into metropolitan area units as
described below. When counties are aggregated, the wage number is total payroll in
a city divided by total employment. Since we run cross-section regressions, we keep
all variables nominal.
Cities were constructed from a list of top 170 Standard Metropolitan Areas
(SMAs) in 1956 America contained in County Business Patterns Book (CBP). In
some cases, an SMA contains several counties; in others (only in New England)
several SMAs split a single county. The problem is to decide which counties should
be included in a given city, since it would be impractical to include all counties in a
SMA. We included in each city the largest counties that cover the SMA until their
combined payroll added up to at least 80 percent of the total payroll of the SMA jn
both 1956 and ]987. This procedure makes sure that if substantial growth of
employment occurred in counties in a SMA that were small or non-existent in 1956,
these counties are included in the city. The multi-county unit arrived at using this
procedure is the city we focus on.4
2We use the 1956 Census definition of an establishment, which is an actual firmrather than a plant. In later years, the Census redefined the establishment to be aplant. For our purposes, a firm is what's appropriate, so the 1956 definition is good.
3lncluding all the counties that are part of the SMA would be extremely timeconsuming because to find out which industries in a SMA are the largest--a procedurewe use to construct the data—we would have to add up by hand employment in all thepotentially largest industries over all the counties. Adding extra counties alsosignificantly worsens missing data problems discussed below. To simplify the firstproblem, and to avoid the second, we have restricted the subset of counties includedin the city.
4This procedure for constructing a city might introduce errors for larger cities,which cover numerous counties. To test whether this problem is responsible for ourresults, we repeated the analysis for the smallest 75 percent of the cities in the
11
For each city constructed through aggregating counties, we use data on the six
largest 2-digit industries, where size is measured by 1956 payroll. We only use six
industries because we are interested in regionally specialized industries, but also hand
collection limits how many industries we can take.
In some cases where an industry in a county has only a few establishments, CBP
for confidentiality reasons does not reveal exact information on employment in that
county-industry. Instead, they typically present the range in which the employment in
a given industry in a given county lies, such as 0 to 20 or 5,000 to 10,000. In a few
cases where the employment in a given county-industry is below 50 CBP presents no
employment number at all. To construct our sample, we had to address this problem
of missing variables, which is particularly severe when a city contains several counties
only one of which has missing data.
We addressed this problem as follows. If exact data were missing for some
county-industry in 1956, we simply omitted that industry from the sample and
replaced it by the next largest industry in that city for which complete data were
available for all counties. The missing data problem was not significant in 1956,
however, since we are selecting the largest city-industries as of 1956.
If exact data were missing for some county-industry in 1987, we estimated the
employment in that county-industry at the midpoint of the range provided by County
Business Patterns. For example, if CBP reported the employment in county-industry
to be between 0 and 20, we used 10; if the report was between 5,000 and 10,000, we
used 7,500. In a multi-county city, we then added these estimates to precise
employment numbers for the counties for which they were available. In the few
sample. The results were very similar to the ones reported below. For this reason,we use the whole sample in the results reported in this paper.
12
county-industries with employment under 50 where CBP did not even provide a range,
we used 25 as the employment number. This procedure enabled us to compute
employment for all but 4 of the 1706 = 1020 city-industries. The reason we had to
drop 4 city-industries is that "ordnance and accessories,' an industry that occurred 4
times in our sample in 1956, was discontinued as a qualified industry by 1987. Of the
1016 city-industries in this sample, employment in 833 was provided exactly, and
employment in the other 183 was estimated as described above.
Although CBP presents ranges of employment by county-industry, it does not
provide any information on payroll in the cases where exact employment numbers are
omitted. As a result, we cannot estimate wages for these observations. Consequently,
the wage regressions we present below are estimated on 834 city-industries for which
we have exact data on employment and payroll.
Description of the Data
Since we are using a new data set, it may be helpful to present a simple
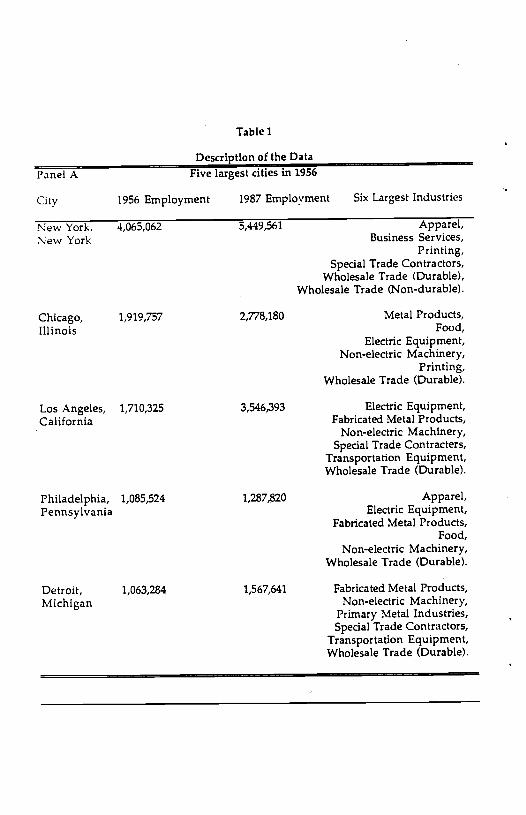
description of the data. This is done in Table 1. The first panel of the Table
describes the five smallest and the five largest cities in our sample as of 1956, their
employment in 1956 and 1987, and the six largest industries in each of them. Note
first that the largest city-New York—has employment of over 4 million, while the
smallest—Laredo, Texas—has only 7,500 employees. Clearly our procedure of looking
at SMAS gets us down to fairly small places. The panel also shows a great variety of
top industries across cities, although wholesale durables and non-durables are big in
many of them.
Panel B describes the ten largest city-industries in our sample. New York City
apparel is the largest city-industry in the U.S. in 1956 with over 350,000 employees.
Transportation equipment in Detroit, which is of course autos, is the third largest.
New York City appears six and Chicago two times on this list.
13
Panel C describes the most common city-industries in the sample. Wholesale
trade in durables is the most common: it appears in 146 cities. A few other service
categories appear as well, but the predominant type of most common sector is
manufacturing. In particular, non-electrical machinery, primary metals, fabricated
metals, transportation equipment, and electric equipment all appear quite often. The
typical stories of externalities apply to many of these industries. In most of our
analysis, we have pooled manufacturing and services, although we discuss below what
happens when wholesale trade is removed from the sample, as well as how services
are different from manufacturing.
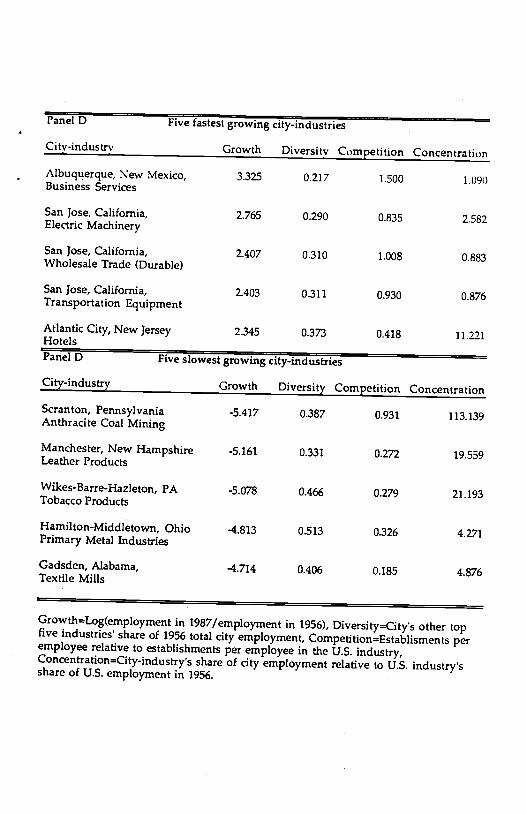
Panel D lists the 5 fastest growing and 5 fastest declining city-industries in terms
of employment. The panel gives three impressions. First, rapidly declining city-
industries were more regionally concentrated than the rapidly growing ones. Second,
industries grew faster in diversified cities than in specialized ones. Third, fast-
growing city-industries were more competitive, as measured by establishments per
employee, than shrinking city-industries. All of these three impressions turn Out to
be our general empirical findings.-
The panel also shows that the fastest growing city-industries tended to be in the
south, west and south-west, whereas the slowest growing city-industries were often in
the east and the midwest. This finding points to some basic economic forces at work,
such as capital moving to low wage areas. A cynic might say that temperature
determined city growth, or that we are only observing the decline of U.S. manufac-
turing. These objections are not valid, since we will be comparing how fast the same
industry grows in different Cities. We will also control for location in the south.
More importantly, the decline in certain industries (notably steel, but possibly
autos as well) may be related to the theories discussed in this paper. Both steel and
14
auto production were regionally concentrated (autos in Michigan and steel in
Pennsylvania). Both industries had only moderate levels of competition. In both
industries, innovation was arguably lacking, particularly in areas where these industries
were concentrated.
The steel industry, according to Reutter (1988), has missed opportunities which
were exploited by their competitors in less sterile environments. Big steel lost market
share not only to foreign competitors, but to American mini-mills located in
non-traditional areas such as Roanoke, Virginia, or Florida. Use of concrete in
construction also badly hurt steel. The first major use of concrete took place in a
Hempstead, Long Island shopping complex, far away from the traditional steel mills.
Both concrete and shopping malls were major post-war innovations coming not from
the established building material centers (such as Pennsylvania) but from smaller,
more diversified areas. The steel industry may have declined not just because of
foreign competition or some exogenous decline in manufacturing, but, in part, due to
forces stressed by Porter and Jacobs. Our statistical work suggests that this stoiy of
steel is a rule rather than an exception.
4. RESULTS ON THE GROWTH OF INDUSTRIES ACROSS CITIES
If externalities are important for growth then the clearest way to find these
effects is by looking at the growth of the same sectors in different cities, and checking
in which cities these sectors grow faster. The unit of observation is then an industry
in a city, and we look at the growth rates of these industries as a function of our
measures of knowledge spillovers.5 The sample includes 1016 observations on the
5We have also performed the analysis using cities as a unit of observation. Theseregressions have not produced any statistically significant coefficients on our measuresof externalities, although these measures tend to be much cruder for cities than theyare for city-industries.

15
top six 2-digit 1956 industries in 170 cities. Table 2 describes the variables. Since we
do not have measures of output, employment growth is our best measure of industry
growth.6 The mean of this variable is zero, indicating that in an average city-industry
in our sample employment did not grow. The standard deviation of this number, 1,
indicates the enormous dispersion of growth records. This dispersion may reflect the
decline of some mining and manufacturing industries and the growth of services.
Our measure of specialization of an industry in a city is the fraction of the city's
employment that this industry represents in that city, relative to the share of the
whole industry in national employment:
industry empl't in city/total empl't in city(1) specialization . ,industry empl t in U.S./total empl t in U.S.
This variable measures how specialized a city is in an industry relative to what one
would expect if employment in that industry was scattered randomly across the U.S.
The variable corrects for situations where a city-industry is large only because the city
is large. Because we are looking at the largest industries and because of regional
specialization, the mean of this variable is 3.37. In our cities, top industries are
overrepresented relative to what one would expect if they were randomly scattered
over the United States. Interestingly, the maximum of this variable is 182.35 for
anthracite mining in the Wilkes-Barre and Hazleton SMA. The prediction of both
MAR andPorter is that high specialization of an industry in a city should speed up
growth of that industry in that city.
Our measure of local competition of an industry in a city is the number of firms
per worker in this industry in this city relative to the number of firms per worker in
this industry in the United States:
6Labor-saving innovations or any growth that mainly affects capital will not headequately represented by this measure.
16
— firms in city-industry/workers in city-industry(2) competition — firms in U.S. industry/workers in U.S. industry
A value greater than 1 means that this industry has more firms relative to its size in
this city than it does in the U.S. One interpretation of the value greater than I is
that the industry in the city in locally more competitive than it is elsewhere in the
U.S. Alternatively, a value of the competition variable greater than I can mean that
firms in that industry in that city are just smaller than they are on average in the
United States. It is very hard to distinguish smaller firms from more competitive
firms using our data. Unfortunately, we do not have data on output of individual
firms, and so cannot construct concentration ratios. Since we are looking at industries
with large employment in their respective cities, we expect the mean of this
competition variable to be below 1; in fact it is .75. Interpreting Porter liberally, a
higher value of this measure of competition should be associated with faster growth.
Finally, to address Jacobs' theory we need a measure of variety of industries in
the city outside the industry in question. The measure we use is what fraction of the
city's employment the largest five industries other than the industry in question
account for in 1956. The mean of this ratio is .35: cities are not well-diversified. The
lower this ratio, the more diverse the city is, the faster should the industry in question
grow according to Jacobs.
Table 3 presents our results for employment growth across city-industries, with
1016 observations. We include the 1956 log of wage and log of employment in city
industry, a dummy variable indicating a southern city, and the national employment
growth in that industry as controls in the regressions. City-industries with high initial
wages might grow slower because the firms pursue cheaper labor elsewhere. High
observed initial employment reduces employment growth because of either
measurement error or more serious economic factors. The MAR view is somewhat
17
incompatible with the presence of real (as opposed to measurement induced) mean
reversion, but since we are not correcting for potential measurement problems we do
not use such mean reversion as evidence against the MAR externalities. We also
include national employment change in the industiy to correct for demand shifts.
This correction is particularly important for traditional manufacturing industries, many
of which have declined in the post-war United States.
The control variables tend to have the expected signs. High initial employment
in an industry in a city leads to slower growth of that industry's employment.
Employment in an industry in a city grows faster when employment in that industry in
the whole country grows faster. Interestingly, the coefficient on national industry
employment growth is above 1. Factors shifting employment in national industries
seem to be more influential in urban than in rural areas. Southern cities also grew
significantly more than cities outside the south. Somewhat surprisingly, initial wages
in a city-industry are uncorrelated with subsequent employment growth.
The results on externalities reveal several interesting findings. Equation (1)
shows that industries that are more heavily concentrated in the city than they are in
the U.S. as a whole grow slower. The effect is statistically significant, but qualitatively
small. As we raise the measure of specialization by one standard deviation (9.02),
cumulative growth of employment over 30 years slows by twelve percent total, which
is about one ninth of a standard deviation. This result is the opposite of the predic-
tion of MAR model. We not only fail to find positive evidence in favor of MAR, but
the data point in the opposite direction: geographic specialization reduces growth.
In equation (2), the coefficient on the competition variable is positive and very
significant. More firms per worker in a city-industry relative to the national average
leads to higher growth of that city-industry, consistent with Porter's and Jacobs'
18
hypothesis. Going from as many to twice as many firms per worker as the national
average (2.5 standard deviations) raises growth of employment in city industry by 59
percent over 30 years, which is almost two thirds of a standard deviation. Of course,
another interpretation of this finding is that smaller firms grow faster. However,
recent evidence (Davis and Haltiwanger 1990) indicates that in fact smaller firms do
not grow faster once one takes account of the fact that they have a higher probability
of death than larger firms. We should also mention that the 'small firms grow faster'
model is inconsistent with the MAR view that monopolies that internalize externalities
are good for growth. So even though the positive evidence in favor of competition is
somewhat ambiguous, the negative evidence on MAR is more clear cut.
Equation (3) shows that industries in cities where other large industries are
relatively small grow faster. As we reduce the share of city employment taken up by
the five largest industries other than the one in question by .1 (a standard deviation),
cumulative employment growth in the city-industry over 30 years falls by 9 percent
(one tenth of a standard deviation). This result suggests that not having dominant
industries as neighbors, or alternatively having a greater variety of neighbors, helps
own growth. This finding is consistent with the importance of knowledge spillovers
from outside the industry stressed by Jacobs.
Equation (4) in Table 3 uses all measures of externalities simultaneously. The
results remain statistically significant. They confirm our finding that industry
overrepresentation hurts its growth. The fact that the coefficient is of the wrong sign
relative to what MAR predicts, and is statistically significant, is evidence against the
importance of permanent within-industry knowledge spillovers for growth.
Competition within the city-industry continues to exert a positive influence on the
growth of its employment, and the coefficient hardly changes from equation (2). The
19
result that concentration of other industries in the city hurts the growth of an
industry's employment continues to be strong. The overall results are not favorable to
MAR, mixed on Porter, and favorable to Jacobs.
We have checked the robustness of these results in a number of ways. First, our
results might be driven by the mining industries, which exhibit extraordinary regional
specialization, and have declined sharply in postwar years in part because prices fell
and in part because mineral stocks were depleted. We have run the regressions in
Table 3 without the mining industries, and the results are similar in terms of sign
patterns and statistical significance.
Second, one could argue that knowledge spillovers are more important in
manufacturingthan in services because technological progress is more rapid in
manufacturing. Without subscribing to this objection, we tested it empirically by
splitting the industries into manufacturing and non-manufacturing. Our results hold
qualitatively for both subsamples. All coefficients on the externality variables remain
significant in the non-manufacturing regression, and all but the coefficient on urban
variety variable are significant for manufacturing. If anything, the results appear to be
stronger for non-manufacturing.
Third, on the suggestion of Professor Henderson, we have divided manufacturing
industries into ubiquitous (fabricated metals, non-metallic metals, non-electrical
machinery etc) and more specialized (electrical equipment, transport equipment,
primary metals, pulp and paper, textiles and apparel, leather products, etc.).4
According to Professor Henderson, externalities should be more pronounced in more
specialized manufacturing industries. We have run our regressions using the two
manufacturing subsamples separately. The negative effect of our specialization
measure on industry growth is stronger and more statistically significant for ubiquitous
20
manufacturing, but the effect remains negative, though insignificant, for more
specialized manufacturing as well. There is certainly no evidence that the coefficient
is positive, as MAR would suggest.
Although we have measured industry growth using employment growth, a better
measure would be productivity growth. As we do not observe output, we can only
measure productivity by wages, which for a variety of reasons are very imperfect.
First, productivity increases might not accrue to labor, especially as migration occurs;
in the long run identical workers must be indifferent between cities. Second, declining
industries might fire their less able and experienced workers first--creating an artificial
rise in wages. Third, certain technological innovations (e.g., the assembly line) might
make it easier to hire less expensive workers. Fourth, rent-sharing might also be a
factor, especially in those industries (steel, coal, autos) with heavy union involvement.
A further problem with the wage data is that we have no estimates of wages for
counties without precisely reported employment numbers. The restriction of the
sample to 834 observations could induce a sample selection bias. Given these
objections, our results on wage growth should be interpreted as at best secondary to
employment growth results.
Table 4 presents the findings in the same format as Table 3. High initial wages
in city-industry reduce wage growth, but high initial employment in a city-industry
helped wage growth, although as we saw before it hurt employment growth. This
result might reflect a selection effect: high employment leads to employment cuts
which for reasons of seniority affect least well-paid workers most, leading to an
increase in the average wage of those who remain employed.
Equation (1) shows that city-industry specialization has no effect on wage growth,
which does not support the MAR view, although the coefficient no longer has the
21
wrong sign. When other measures of externalities are added in equation (4), the
coefficient is insignificant and has the wrong sign. City-industry competition reduces
wage growth (the coefficient is significant), which is inconsistent with the view that
competition contributes to productivity growth that accrues to the workers. We do
not think that the latter position can be ascribed to Porter. Finally, diversity in a city
helps wage growth of the industry, consistent with Jacobs' view that productivity
growth is helped by diversity.
None of the evidence we have presented supports the importance of within-
industry knowledge spillovers for growth. If such spillovers are particularly
pronounced at geographical proximity, the evidence is detrimental to the theories of
MAR and Porter that focus on these spillovers. We end this discussion with a word
of caution, however. We are looking at large mature cities that are not growing very
fast and are in many cases declining--making ours a very special sample. Within-
industry knowledge spillovers may not matter for such mature industries, while being
much more important at the early stages of an industry. For example, these spillovers
might be very important when a new industry is born and organizes itself in one
location, but unimportant as this industry matures and geographical proximity
becomes less important for the transmission of knowledge. Our data, unfortunately,
cannot address this industry life-cycle model. At the least, however, we are rejecting
the strong version of the MAR theory, that predicts that within-industry knowledge
spillovers lead to permanent self-sustaining growth in cities.
5. STATIC EXTERNAL ECONOMIES: LOCALIZATION AND URBANIZATION
Localization
The evidence we have presented suggests that diversity, and not specialization,
22
contributes to growth. This result raises an important problem: if geographical
specialization does not contribute to growth, why is it so prevalent? In this section,
we address this problem. We also look for the evidence of urbanization externalities:
those that make different industries locate next to each other to form a city.
There are several reasons for regional specialization that are not dynamic
externalities that contribute to growth. Most obviously, natural resource or transport
advantages often favor a particular location, and those apply equally to all firms in
the industry. For example, the oil industry at the turn of the century was located in
Ohio, near the discovered oil. Bairoch (1988) reports that during the Industrial
Revolution most new cities located near the supplies of energy. One could also argue
that the auto industry located in the Midwest in part to economize on transport costs.
But, in addition to these natural reasons for specialization, there are several
static externalities that contribute to specialization but not to growth. Perhaps most
important is the idea of saving on moving inputs, suggested by Marshall (1890). A
whole industry might locate near the place of common suppliers to both reduce the
cost of getting supplies and to have a closer flow of information to suppliers. In
addition, many firms producing specialized products that are subject to wildly
fluctuating firm demand but more stable industry demand would locate together. By
doing so, they enable specialized labor to move easily between firms without moving
between cities, as in the previously mentioned case of New York fashion industry.
More generally, when firms share any input that is not costlessly mobile, it pays them
to locate together near that input and so save on moving this input (see Lichtenberg
1960 and Henderson 1986, 1988). More recently, Rotemberg and Saloner (1990)
argued that firms locate together to commit to compete for labor and not pay
monopsony wages. This effective commitment enables firms to attract labor in the
23
first place. There are clearly many reasons for regional specialization other than
knowledge spillovers.
Our findings are consistent with the importance of localization externalities as
long as the location of firms next to each other to take advantage of these
externalities is finished when our sample begins. In this case, there is no reason that
regionally specialized industries should grow faster. If, in contrast, we observed young
industries, where entry of firms to take advantage of localization externalities was still
taking place, we would still expect employment in regionally specialized industries to
grow faster as entry takes place. Our results would then reject the importance of
localization externalities, just as they reject MAR-Porter models.- Since we are
focusing on the largest city-industries, however, the assumption that they are mature
seems reasonable. Our findings do not reject the localization externalities playing a
role in determining regional specialization.
Urbanization
Although cities are usually specialized in a few lines of work, they also typically
pursue many other activities outside the main lines. Many of these activities are
entirely unrelated to each other. This suggests another type of externality operating
in a city. Firms locate in a city because local demand is high there, and so they can
sell some of their output without incurring transport costs. This is obviously most
important for high fixed cost industries. Lichtenberg (1960) argues that this
externality explains why the insurance industry once located in New York City.
Murphy, Shleifer, and Vishny (1990) discuss such pecuniary externalities; Krugman
(1991a,b) models city formation based on local demand. Henderson (1986) refers to
these effects as urbanization externalities and presents empirical evidence suggesting
that they are not important for productivity.

24
These models imply that when an industry grows, it raises local payrolls and
therefore local demand, and so helps the growth of other possibly unrelated industries
in that city which adjust to higher demand. As a result, growth rates of different
industries in a city are positively correlated. This argument is most compelling for
local services, which probably grow when city exports grow.
The argument against urbanization externalities is crowding. When an industry
in a city grows, it raises wages and rents and so makes it more expensive for other
industries to expand in that city. Conversely, when an industry in a city shrinks, it
frees up land and labor and so makes growth of other industries more attractive.
Urbanization externalities and crowding have the opposite implications for the data.
Our data enable us to test these predictions, as is done in Table 5. The
dependent variable in the regression is employment growth in the city outside the four
largest industries, and the key independent variable is employment growth in these
four largest industries. The evidence indicates very strongly that small industries grow
when large industries do. A 1 percent increase in the four industry employment
growth leads to a .5 percent increase in employment growth outside these industries.
We replicated this result for several combinations of dependent and independent
variables. The evidence consistently points in favor of aggregate demand spillovers
and against crowding. Of course, another possible interpretation of this finding is that
there are some city effects that attract all industries to some cities, but recall that we
at least control for the 1956 wage level in our sample. Overall, the results support
the role of urbanization externalities in city growth, consistent with theoretical work of
Murphy, Shleifer, and Vishny (1989) and Krugman (1991a,b).
6. CONCLUSION
The results presented in this paper allow some tentative conclusions. We have
25
shown that at the city-industry level, specialization hurts, competition helps and city
diversity helps employment growth. Our best interpretation of this evidence is that
inter-industry knowledge spillovers are less important for growth than spillovers across
industries, particularly in the case of fairly mature cities. The Jacobs-Rosenberg-
Bairoch model, in which knowledge transmission takes the form of adoption of an
innovation by additional sectors seems to be the most consistent with the evidence.
An important objection to these results that we have mentioned already is that
we are looking at a particular period in the United States history in which traditional
manufacturing industries have faired poorly because of import competition and at
particular very mature cities. Our results may then not be applicable for more
dynamic time periods or places. On this theory, MAR externalities matter the most
when industries grow. We cannot address this objection with our data.
The evidence suggests that cross-fertilization of ideas across industries speeds up
growth. The growth of cities is one manifestation of this phenomenon, but there may
be others. The results would imply, for example, that open societies, with substantial
labor mobility across industries, will exhibit greater spread of ideas and growth.
Similarly, the cross-fertilization perspective argues in favor of such labor flows as
immigration and migration across areas. If Jane Jacobs is right, the research on
growth should change its focus from looking inside industries to looking at the spread
of ideas across sectors.
Although we interpret many of our findings as pointing to cross-fertilization of
ideas across industries, our evidence on this point is indirect. Another view consistent
with many of our findings is that externalities are not particularly important, and that
the standard neoclassical forces drive most of city and industry growth. For example,
we have found that employment grows slower where it is already high, and that wages

26
grow slower where they are already high. Competition for scarce space and labor
may play as large or even larger role in the growth of cities as do the externalities.
In focusing on increasing returns and externalities, it is important to remember that
they often are not strong enough to overcome the more conventional competitive
forces.
27
References
Arrow, Kenneth J. (1962), The Economic Implications of Learning by Doing,'
Review of Economic Studies 29: 155-173.
Arthur, W. Brian (1989), "Silicon Valley Locational Clusters: When Do Increasing
Returns Imply Monopoly?" Working Paper, Santa Fe Institute.
Bairoch, Paul (1988), Cities and Economic Development, Chicago: University of
Chicago Press.
Davis, Steve J. and John Haltiwanger (1990), "Gross Job Creation, Gross Job
Destruction, and Employment Reallocation," Mimeo, University of Chicago.
Diamond, Charles A. and Curtis J. Simon (1990), "Industrial Specialization and the
Returns to Labor," Journal of Labor Economics 8: 175-201.
Henderson, J. Vernon (1986), "Efficiency of Resource Usage and City Size," Journal
of Urban Economics 19: 47-70.
Henderson, J. Vernon (1988), Urban Development: Theory. Fact, and Illusion,
New York: Oxford.
Jacobs, Jane (1969), The Economy of Cities, New York: Vintage Books.
Jacobs, Jane (1984), Cities and the Wealth of Nations, New York: Vintage Books.
Krugman, Paul (1991a), "Increasing Returns and Economic Geography," Journal of
Political Economy, June.
Krugman, Paul (1991b), 'Cities in Space: Three Simple Models,' Mimeo, MIT.
Lichtenberg, Robert M. (1960), One Tenth of a Nation, Cambridge: Harvard
University Press.
Lucas, Robert E., Jr. (1988), "On the Mechanics of Economic Development,"
Journal of Monetary Economics 22: 3-42.
Marshall, Alfred (1890), Principles of Economics, London: Macmillan.

28
Murphy, Kevin M., Andrei Shleifer, and Robert W. Vishny (1989), "industrialization
and the Big Push," Journal of Political Economy 97: 1003-1026.
Porter, Michael E. (1990), The Competitive Advantage of Nations, New York: Free
Press.
Reutter, Mark (1988), Sparrows Point: Making Steel: The Rise and Ruin of
American Industrial Might, New York: Simon & Schuster.
Romer, Paul M. (1986), "Increasing Returns and Long Run Growth.' Journal of
Political Economy 94: 1002-1037.
Romer, Paul M. (1990), "Endogenous Technological Change", Journal of Political
Economy 98: 71-101.
Rosenberg, Nathan (1963), 'Technological Change in the Machine Tool Industiy,
1840-1910," Journal of Economic History 23.
Rotemberg, Julio, and Garth Saloner (1990), "Competition and Human Capital
Accumulation: a Theory of Interregional Specialization and Trade", MIT Mimeo.
Scherer, F.M. (1982), Interindustiy Technology Flows in the United States, Research
Ehy 11: 227-245.
Schumpeter, Joseph A. (1942), Capitalism. Socialism, and Democracy, New York:
Harper.
Apparel,Business Services,
Printing,Special Trade Contractors,
Wholesale Trade (Durable),Wholesale Trade (Non-durable).
Metal Products,Food,
Electric Equipment,Non-electric Machinery,
Printing,Wholesale Trade (Durable).
Los Angeles, 1,710,325California
Philadelphia, 1,085,524Pennsylvania
3,546,393
1,287,820
Electric Equipment,Fabricated Metal Products,
Non-electric Machinery,Special Trade Contracters,
Transportation Equipment,Wholesale Trade (Durable).
Apparel,Electric Equipment,
Fabricated Metal Products,Food,
Non-electric Machinery,Wholesale Trade (Durable).
Fabricated Metal Products,Non-electric Machinery,
Primary Metal Industries,Special Trade Contractors,
Transportation Equipment,Wholesale Trade (Durable).
Table 1
Description of the DataPanel A Five largest cities in 1956
City 1956 Employment 1987 Employment Six Largest Industries
4,065,062 5,449,561New York,New York
Chicago,Illinois
1,919,757 2,778,180
Detroit,Michigan
1,063,284 1,567,641

San Angelo, 12,188California
Fort Smith, 19,089Arkansas
Sioux Falls, 19,096South Dakota
Apparel,Apparel Stores,
Auto Dealers,General Merchandise,
Transport Services,Wholesale Trade (Durable).
Auto Dealers,Communications,
General Contractors,General Merchandise,
Special Trade Contractors,Wholesale Trade (Non-durable).
Auto Dealers,Communications,
General Contractors,General Merchandise,
Special Trade Contractors,Wholesale Trade (Durable).
Auto Dealers,Food,
Food Stores,Special Trade Contractors,
Wholesale Trade (Durable),Wholesale Trade (Non-durable).
Auto Dealers,Food,
Insurance,Trucking,
Wholesale Trade (Durable),Wholesale Trade (Non-durable).
Laredo,Texas
Table 1 (continued)
Panel A(continued) Five smallest cities in 1956
City 1956 Employment 1987 Employment Six Largest Industries
7, 458 25,397
Ogden, 13,958Utah
29,720
40,715
55,057
59,398

Panel BCity
New York , New York
New York, New York
Detroit, Michigan
Los Angeles, California
New York, New York
New York, New York
New York, New York
Chicago, Illinois
Chicago, Illinois
New York, New YorkPanel CIndustry
Wholesale Trade (Durable) 146
Food and kindred products 78
Non-electric Machinery 76
Special trade contractors 70
Transportation equipment 60
Wholesale trade (Non-durable) 59
Automotive dealers & service stations 55
Fabricated metal products 48
Primary metal industries 46
Electrical machinery 38
Table 1 (continued)
Ten largest city-industriesIndustry Employment
23 366,928
50 241,754
37 233,761
37 228,619
51 157,833
27 151,905
73 143,043
36 125,425
35 121,847
17 114,267Most common city-industries
Number of appearances in sample
Panel D Five fastest growing city-industries
City-industry Growth Diversity Concentration
Albuquerque, New Mexico, 3.325 0.217 1.500Business Services 1.090
San Jose, California, 2.765 0.290 0.835Electric Machinery
2.582
San Jose, California, 2.407 0.310 1.008Wholesale Trade (Durable) 0.883
San Jose, California, 2.403 0.311 0.930Transportation Equipment
0.876
Atlantic City, New Jersey 2.345 0.373 0.418Hotels 11.221
Panel D Five slowest growing city-industries
City-industry Growth Diversity Competition Concentration
Scranton, Pennsylvania -5.417 0.387 0.931Anthracite Coal Mining 113.139
Manchester, New Hampshire -5.161 0.331 0.272Leather Products 19.559
Wikes-Barre-Hazleton, PA -5.078 0.466 0.279Tobacco Products 21.193
Hamilton-Middletown, Ohio -4.813 0.513 0.326Primary Metal Industries
4.271
Gadsden, Alabama, -4.714 0.406 0.185Textile Mills 4.876
Growth=Log(employment in l987/employment in 1956), Diversity=City's othertopfive industries' share of 1956 total city employment, Competition=Establjsments peremployee relative to establishments per employee in the U.S. industry,ConcentrationCityindustry's share of city employment relative to U.S. industry'sshare of U.S. employment in 1956.
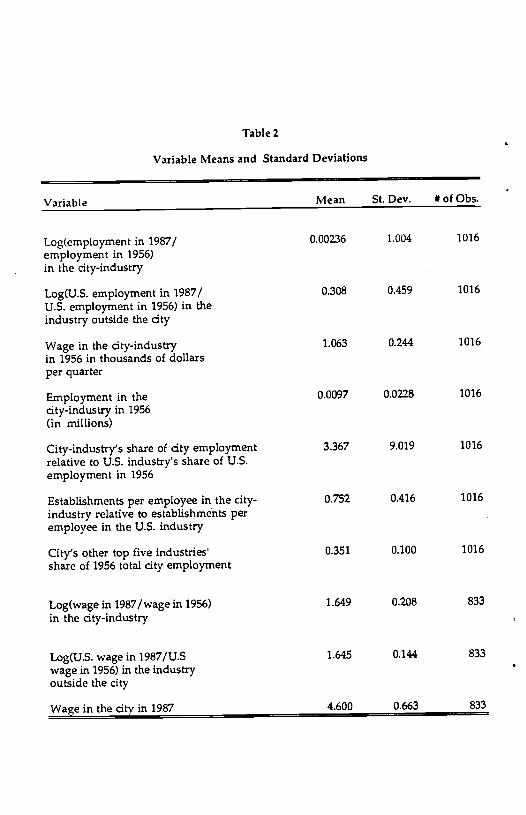
Table 2
Variable Means and Standard Deviations
Variable Mean St. Dev. # of Obs.
Log(employment in 1987/ 0.00236 1.004 1016
employment in 1956)in the city-industry
Log(U.S. employment in 1987/ 0.308 0,459 1016
U.S. employment in 1956) in theindustry outside the city
Wage in the city-industry 1.063 0.244 1016
in 1956 in thousands of dollarsper quarter
Employment in the 0.0097 0.0228 1016
city-industry in 1956(in millions)
City-industry's share of city employment 3.367 9.019 1016
relative to U.S. industrys share of U.S.employment in 1956
Establishments per employee in the city- 0.752 0.416 1016
industry relative to establishments peremployee in the U.S. industry
City's other top five industries 0.351 0.100 1016
share of 1956 total city employment
Log(wage in 1987/wage in 1956) 1.649 0.208 833
in the city-industry
Log(US. wage in 1987/U.S 1.645 0.144 833
wage in 1956) in the industryoutside the city
Wage in the city in 1987 4.600 0.663 833

Table 2 (continued)
Variable Means and Standard Deviations
Variable Mean St. Dev. # of Obs.
Log(employment in 1987/ 0.980 0.424 170employment in 1956) in the city
Wage in the city in 1956 0.864 0.114 170
Employment 0.118 0.298 170in the city in 1956
Employment growth -0.0312 0.648 170in the four biggestindustries

Table 3
City-industry employment growth between 1956 and 1987
Dependent Variable Log(employment in 1987/employment in 1956)in the city-industry
(1) (2) (3) (4)
Constant -0.423 -0.932 -0.181 -0.513(-3.280) (-7.214) (-1.141) (-3.373)
Log (U.S. employment in 1987/ 1.140 1.209 1.237 1.148U.S. employment in 1956) in the (19.282) (23.024) (22.552) (20.418)industry outside the city
Wage in the city-industry in 1956 0.0137 0.0226 0.0379 0.027(0.126) (0.217) (0.347) (0.259)
Employment in the city-industry -2.898 -3.280 -3.91 -4.080in 1956 — in millions (-2.636) (-3.109) (-3.458) (-3.803)
Dummy variable indicating 0.426 0.416 0.370 0.378presence in the South (7.528) (7.678) (6.366) (6.849)
City-industry's share of city -0.0128 . . -0.00799
employment relative to industry's (-4.349) (.) (.) (-2.805)share of U.S. employment in 1956
Establishments per employee in the . 0.587 . 0.561
city-industry relative to establishments (.) (10.330) (.) (9.824)per employee in the U.S. industry in 1956
City's other top five industries share . . -0.894 -0.913
of total city employment in 1956 (.) (.) (-3.458) (-3.725)
Adjusted R2 0.3916 0.4394 0.3874 0.4502
Number of observations 1016 1016 1016 1016
T-statistics of parameter estimates are listed in parentheses beneath these estimates.
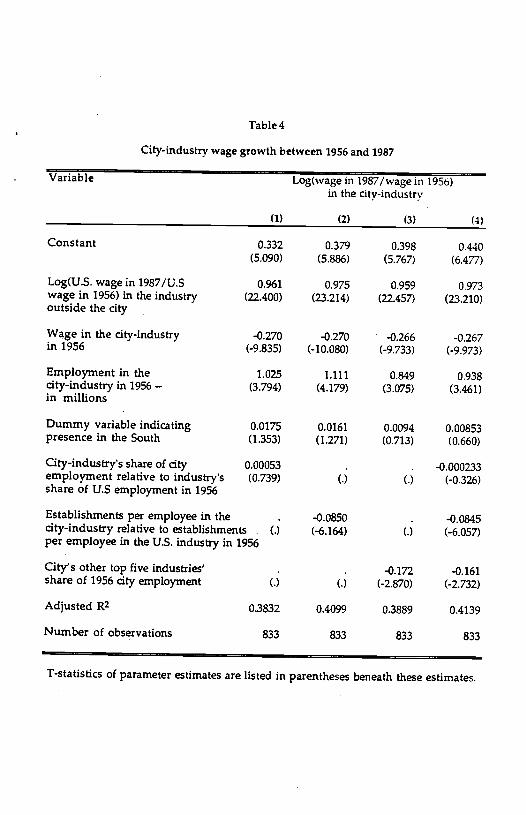
Table 4
City-industry wage growth between 1956 and 1987
Variable Log(wage in 1987/wage in 1956)in the city-industry
(1) (2) (3) (4)
Constant 0.332 0.379 0.398 0.440(5.090) (5.886) (5.767) (6.477)
Log(U.S. wage in 1987/U.S 0.961 0.975 0.959 0.973wage in 1956) in the industry (22.400) (23.214) (22.457) (23.210)outside the city
Wage in the city-industry -0.270 -0.270 -0.266 -0.267in 1956 (-9.835) (-10.080) (-9.733) (-9.973)
Employment in the 1.025 1.111 0.849 0.938city-industry in 1956 — (3.794) (4.179) (3.075) (3.461)in millions
Dummy variable indicating 0.0175 0.0161 0.0094 0.00853presence in the South (1.353) (1.271) (0.713) (0.660)
City-industry's share of city 0.00053 . . -0.000233employment relative to industry's (0.739) (.) (.) (-0.326)share of U.S employment in 1956
Establishments per employee in the . -0.0850 . -0.0845city-industry relative to establishments (.) (-6.164) (.) (-6.057)per employee in the U.S. industry in 1956
City's other top five industries' . . -0.172 -0.161share of 1956 city employment (.) (.) (-2.870) (-2.732)
Adjusted R2 0.3832 0.4099 0.3889 0.4139
Number of observations 833 833 833 833
T-statistics of parameter estimates are listed in parentheses beneath these estimates.
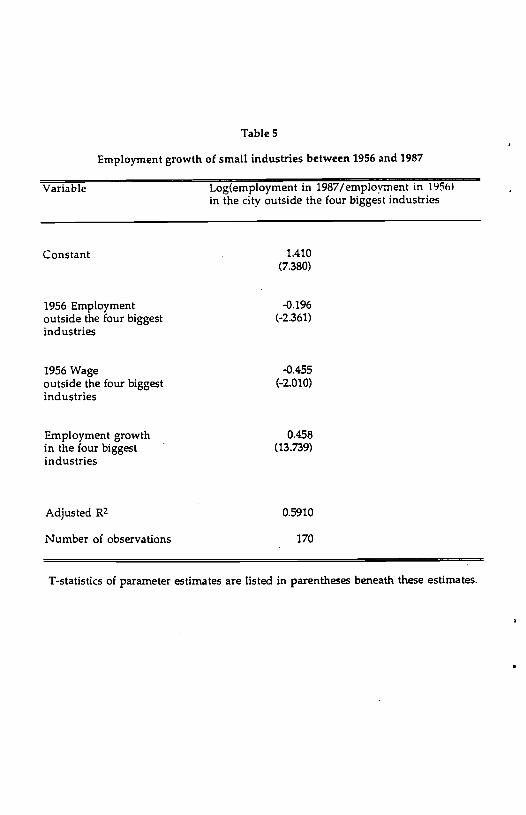
Table 5
Employment growth of small industries between 1956 and 1987
Variable Log(employment in 1987/employment in 1956)in the city outside the four biggest industries
Constant 1.410(7.380)
1956 Employment -0.196outside the four biggest (-2.361)industries
1956 Wage -0.455outside the four biggest (-2.010)industries
Employment growth 0.458in the four biggest (13.739)industries
Adjusted R2 0.5910
Number of observations 170
T-statistics of parameter estimates are listed in parentheses beneath these estimates.