Embed Size (px)
Citation preview
FOUNDATION FOR COMMUNITY HEALTH
Northeast Dutchess County Transit Feasibility Study
Nelson\Nygaard Consulting Associates 121 W. 27th Street, Suite 705
New York, NY 10001
April 2010
N o r t h e a s t D u t c h e s s C o u n t y T r a n s i t F e a s i b i l i t y S t u d y F i n a l R e p o r t F O U N D A T I O N F O R C O M M U N I T Y H E A L T H
Page i • Nelson\Nygaard Consulting Associates Inc.
Table of Contents Page
Executive Summary ................................................................................................................... 1
Background & Existing Conditions .......................................................................................... 2 Dutchess County LOOP ........................................................................................................... 2
Transit Development Plan ....................................................................................................... 5 Current transportation services ................................................................................................ 5 Proposed County Services ....................................................................................................... 8
LOOP Service .......................................................................................................................... 8 Flex .......................................................................................................................................... 8
Inventory of Need ..................................................................................................................... 10 Focus Groups – Potential Customers ..................................................................................... 10
Destinations ........................................................................................................................... 10 Information ............................................................................................................................. 15 Spanish-Speaking Potential Customers ................................................................................ 15 Conclusions/Findings ............................................................................................................. 16
Focus Group – Collaborators & Providers .............................................................................. 16 Collaborators ......................................................................................................................... 16 Providers ................................................................................................................................ 17
Written Survey ........................................................................................................................ 18 Survey Respondent Characteristics ...................................................................................... 19 Destinations ........................................................................................................................... 21 Spanish-Language Respondents .......................................................................................... 28 Conclusions ........................................................................................................................... 28
Task Force Involvement ......................................................................................................... 29
Service Alternatives ................................................................................................................. 30 Flex Options ........................................................................................................................... 31 Service Option #1 ................................................................................................................... 31 Service Option #2 ................................................................................................................... 35
Northeast Zone Point-Deviated Route ................................................................................... 35 Southeast Zone Point-Deviated Route .................................................................................. 36
Service Option #3 ................................................................................................................... 39 Task Force Reaction .............................................................................................................. 39 Potential New Service (Independent Operator) ...................................................................... 41
Independent Operator Option #1: Demand-Response .......................................................... 41 Independent Operator Option #2: Town Day of Service ........................................................ 43 Independent Operator Option #3: Shopping Shuttle .............................................................. 45
Task Force Reaction .............................................................................................................. 47
Recommended Routes (Dutchess County Flex) .................................................................... 48 Backup Option – Point-Deviated ............................................................................................ 56
Northeast Zone ...................................................................................................................... 56 Southeast Zone ..................................................................................................................... 57
Backup Option – Fixed Route ................................................................................................. 60
Selected Alternative (Independent Operator) ........................................................................ 61
N o r t h e a s t D u t c h e s s C o u n t y T r a n s i t F e a s i b i l i t y S t u d y F i n a l R e p o r t F O U N D A T I O N F O R C O M M U N I T Y H E A L T H
Page ii • Nelson\Nygaard Consulting Associates Inc.
Funding Sources .................................................................................................................... 61 Elderly and Disabled Mobility Assistance (Section 5310) ...................................................... 61 Rural and Small Urban Areas (Section 5311) ........................................................................ 61 Job Access and Reverse Commute (JARC) (Section 5316) ................................................. 62 New Freedom Program (Section 5317) ................................................................................. 62
Other State Funds .................................................................................................................. 62 Statewide Transportation Operating Assistance (STOA) ...................................................... 62 Rural Transit Assistance Program ......................................................................................... 63
Technical Assistance .............................................................................................................. 63 National Rural Transit Assistance Program ........................................................................... 63 United We Ride ...................................................................................................................... 63 Community Transportation Association ................................................................................. 63
Mobility Management ............................................................................................................. 63
Implementation Strategies ....................................................................................................... 67 Primary Goals ......................................................................................................................... 67 Strategies ............................................................................................................................... 67
Create a safe and reliable public transportation system ........................................................ 67 Distribute information materials via print and web ................................................................. 68 Conduct marketing and outreach ........................................................................................... 73 Interagency collaboration and coordination ........................................................................... 74 Explore mobility options ......................................................................................................... 74
Phasing ................................................................................................................................... 76 Short-Term (May through October 2010) .............................................................................. 76 Intermediate-Term (November 2010 through April 2011) ...................................................... 76 Long-Term (May 2011 and beyond) ...................................................................................... 77
Appendix A: Kickoff Meeting Notes ........................................................................................ 78 Kickoff Meeting Notes ............................................................................................................ 78 Next Steps ............................................................................................................................. 79
Study Advisory Committee................................................................................................. 79 Stakeholder Interviews....................................................................................................... 79 Focus Groups .................................................................................................................... 80
Appendix B: Focus Groups – Potential Customers ............................................................. 81
Appendix C: Focus Groups – Collaborators & Providers .................................................... 86
Appendix D: Task Force Meeting #1 ...................................................................................... 88
Appendix E: Task Force Meeting #2 ...................................................................................... 90
N o r t h e a s t D u t c h e s s C o u n t y T r a n s i t F e a s i b i l i t y S t u d y F i n a l R e p o r t F O U N D A T I O N F O R C O M M U N I T Y H E A L T H
Page iii • Nelson\Nygaard Consulting Associates Inc.
Table of Figures Page
Figure 1: LOOP services by town ................................................................................................. 3 Figure 2: Northeast Dutchess County route frequencies .............................................................. 3 Figure 3: LOOP service as of 2008 & Productivity ....................................................................... 4 Figure 4: LOOP routes as of January 2009 ................................................................................. 7 Figure 5: LOOP fixed routes and Flex zones .............................................................................. 9 Figure 6: Medical Destinations ................................................................................................... 11 Figure 7: Work Destinations ....................................................................................................... 12 Figure 8: Social, education, services, and religious destinations ............................................... 13 Figure 9: Shopping destinations ................................................................................................. 14 Figure 10: Place of Residence ................................................................................................... 19 Figure 11: Response to question, “Do you have access to a private vehicle?” .......................... 20 Figure 12: Transportation Situation ............................................................................................ 21 Figure 13: Top 15 destinations ................................................................................................... 22 Figure 14: Top 15 Destinations and Distance............................................................................. 23 Figure 15: Amenia Destinations ................................................................................................. 24 Figure 16: Dover Destinations .................................................................................................... 25 Figure 17: Millerton Destinations ................................................................................................ 26 Figure 18: Stanford Destinations ................................................................................................ 27 Figure 19: Towns with destinations people currently cannot get to ............................................ 28 Figure 20: Task Force invites ..................................................................................................... 29 Figure 21: Blue Route (Counterclockwise Route) ...................................................................... 32 Figure 22: Orange Route (Clockwise Route) .............................................................................. 32 Figure 23: Option 1 – Fixed Route ............................................................................................. 34 Figure 24: Northeast zone Flex route ......................................................................................... 36 Figure 25: Southeast Flex zone .................................................................................................. 37 Figure 26: Option 2 – Point-Deviated Route ............................................................................... 38 Figure 27: Option 3 – Demand-Response .................................................................................. 40 Figure 28: Independent Operator Option 1 – Demand-Response .............................................. 42 Figure 29: Independent Operator Option 2 – Town Day of Service ............................................ 44 Figure 30: Independent Operator Option 3 – Regional Destinations .......................................... 46 Figure 31: Flex Deviated Route .................................................................................................. 49 Figure 32: Sample Schedule ...................................................................................................... 50 Figure 33: Deviation sample – Elvin’s to Millbrook ..................................................................... 54 Figure 34: Deviation sample – Millbrook to Dover Plains ........................................................... 55 Figure 35: Northeast Zone Sample Schedule............................................................................. 57 Figure 36: Southeast Zone Sample Schedule ............................................................................ 58 Figure 37: Point-Deviated Option Map ....................................................................................... 59 Figure 38: Fixed Route Backup Option ...................................................................................... 60 Figure 39: Best Practices in Map & Schedule Design ................................................................ 70 Figure 40: Connecticut River Transit Schedule .......................................................................... 71 Figure 41: System map for “The Hop” in Boulder ....................................................................... 72
N o r t h e a s t D u t c h e s s C o u n t y T r a n s i t F e a s i b i l i t y S t u d y F i n a l R e p o r t F O U N D A T I O N F O R C O M M U N I T Y H E A L T H
Page 1 • Nelson\Nygaard Consulting Associates Inc.
Executive Summary Transportation has long been a problem for residents of eastern Dutchess County. Many residents who are older adults or persons with disabilities are cut off from services and friends because they can no longer drive. Others who can still drive understand that as they age, they may lose that ability. Dutchess County is also home to many households who cannot afford a car, or who rely upon one car to serve two or more working family members. At the same time, the area is very rural, with low population density and long distances between destinations. Public transportation in these types of rural communities provides a crucial lifeline connecting people without transportation options to doctors, senior centers, jobs, and grocery stores. The challenge in serving rural areas lies in reaching people living in remote locations while still maintaining good travel time and serving many types of transportation needs with limited resources. Study Purpose Dutchess County provides fixed-route bus service as well as complementary ADA service. Due to budget constraints, the county cut back fixed-route service in January 2009, leaving some of the rural towns with no public transportation. In response, the Foundation for Community Health organized a coalition of around 15 people representing the general public, the towns, and other agencies, forming the Eastern Dutchess Transportation Task Force. By the end of 2009, the county was beginning to finalize a new fixed-route system; however, there were concerns from the Task Force and local residents that the new routes were not taking into account residents’ needs and travel patterns. While the county had undertaken a comprehensive Transit Development Plan in its route planning, there was no need-based effort undertaken by the consulting team who completed the plan. The Foundation for Community Health commissioned and funded this current study that analyzed transportation needs from the residents’ points of view to determine a viable public transportation service. The Foundation serves six towns in Dutchess County, as shown at the right. The input of health agencies, social services, town leaders, and other stakeholders shaped the final service plan. The county and the regional Metropolitan Planning Organization, the Poughkeepsie-Dutchess Transportation Council, worked closely with the study team to create a feasible service plan. The study also sought to determine why LOOP service that used to serve the study area was not successful. One reason was because a major destination for the eastern portion of Dutchess County lies in Connecticut. Sharon Hospital, just over the state border, was not served by Dutchess County LOOP but was called out in focus groups and surveys as a major trip generator. Another reason for the low productivity on LOOP was that the routes were Poughkeepsie-oriented, when in fact the input received during this study showed a significant amount of travel within the study area. While Poughkeepsie is definitely a draw, there is also a need to travel between the towns in the eastern half of Dutchess County. A final service option was created after gathering input on three potential service plans. Given the limitations of the county’s resources, a long-term goal of the Foundation and the Task Force is to expand an existing non-profit or local agency into a transportation provider. This study provides a short and long-term plan for adding a new operator to the study area.
N o r t h e a s t D u t c h e s s C o u n t y T r a n s i t F e a s i b i l i t y S t u d y F i n a l R e p o r t F O U N D A T I O N F O R C O M M U N I T Y H E A L T H
Page 2 • Nelson\Nygaard Consulting Associates Inc.
Background & Existing Conditions The following section describes county-provided transportation in its previous, existing, and proposed forms, as well as other operators in existence.
Dutchess County LOOP Dutchess County has two fixed-route systems: City Bus, which serves Poughkeepsie, and LOOP, serving the rest of the county. LOOP is operated by First Transit with a fleet of 28 vehicles. Before service cuts in January 2009, there were 30 routes. These services included local routes, express routes, and Commuter Train Connection service. Aside from three routes that have departures scheduled every 60 minutes, LOOP routes had low frequencies of approximately 180 minutes. These low headways combined with the high number of routes created a confusing system for passengers and complex driver scheduling relying heavily on interlining, in which the driver operates one bus on different routes. The system became increasingly complex over time as various policy makers added routes with just one or even a half trip per day. Routes also are not coordinated for transfers.
LOOP also operates federally required ADA Paratransit for passengers unable to use regular fixed-route transit. ADA supports travel for these individuals traveling within ¾ mile of a fixed route and during similar operating hours. The county maintains a community-sponsored Dial-A-Ride service, in which participating towns pay a fee for service. Dover was the only town in the study area that paid into the DAR system, but it stopped participating in 2009.
The base fare on LOOP is $1, with no transfers provided. In terms of operating characteristics, in 2006 LOOP provided 663,010 trips, for a productivity of 10.7 passengers per vehicle hour. Farebox recovery, or the percentage of operating costs covered by fares, totaled 11.3 percent. These numbers show an improvement over previous years.
In 2006, the operating cost per vehicle hour was $49.18, revenue brought in $5.55 per hour, and operating cost per passenger was $4.58. Broken down by service mode, fixed route cost $3,033,800 and demand-response service cost $2,068,870. Most of the funding the county receives to cover the service’s operating deficit comes from the state or county. The state provided 42.7 percent, local sources provided 41.4 percent, and the federal government contributed 15.9 percent to the $4,281,600 deficit in 2006. In terms of capital funding, in typical fashion for transit agencies 80 percent of funding is provided federally, with the rest split between state and local contributions.
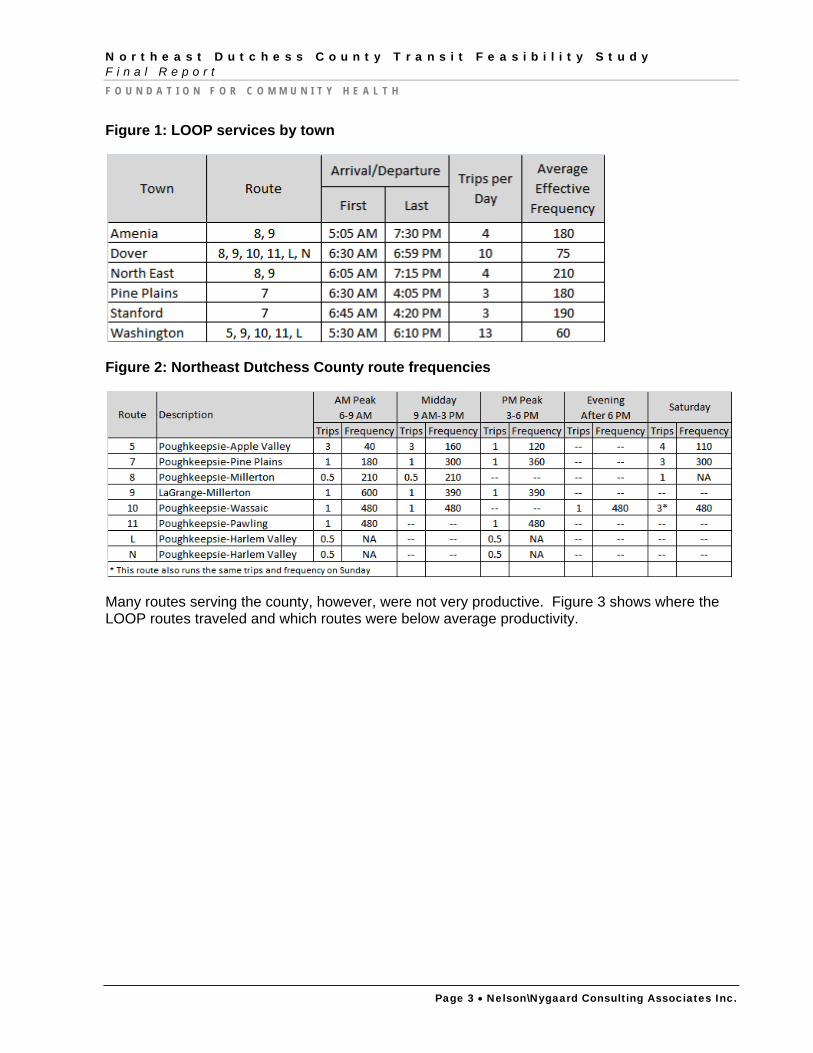
Several LOOP routes served the study area. Dover and Washington (where the village of Millbrook is located) had the most service. Amenia, North East, Pine Plains, and Stanford were served by one or two routes. Figure 1 and Figure 2 show the routes and frequencies of LOOP routes before service cuts.
N o r t h e a s t D u t c h e s s C o u n t y T r a n s i t F e a s i b i l i t y S t u d y F i n a l R e p o r t F O U N D A T I O N F O R C O M M U N I T Y H E A L T H
Page 3 • Nelson\Nygaard Consulting Associates Inc.
Figure 1: LOOP services by town
Figure 2: Northeast Dutchess County route frequencies
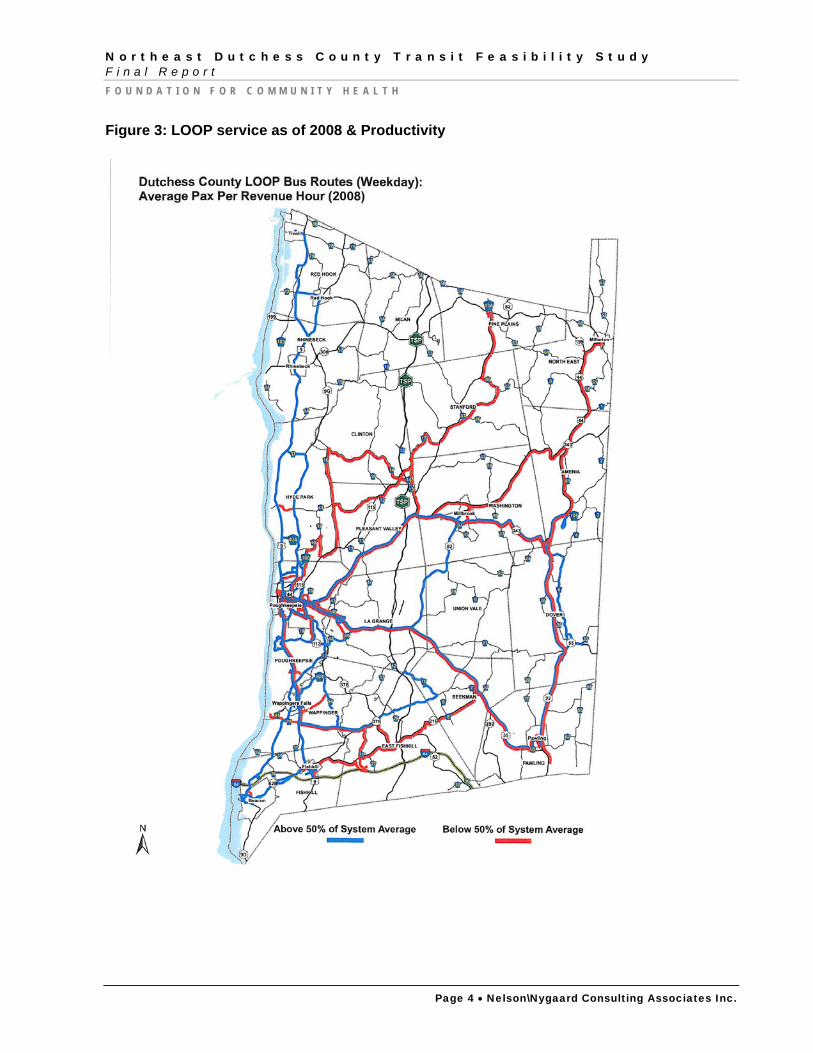
Many routes serving the county, however, were not very productive. Figure 3 shows where the LOOP routes traveled and which routes were below average productivity.
N o r t h e a s t D u t c h e s s C o u n t y T r a n s i t F e a s i b i l i t y S t u d y F i n a l R e p o r t F O U N D A T I O N F O R C O M M U N I T Y H E A L T H
Page 4 • Nelson\Nygaard Consulting Associates Inc.
Figure 3: LOOP service as of 2008 & Productivity
N o r t h e a s t D u t c h e s s C o u n t y T r a n s i t F e a s i b i l i t y S t u d y F i n a l R e p o r t F O U N D A T I O N F O R C O M M U N I T Y H E A L T H
Page 5 • Nelson\Nygaard Consulting Associates Inc.
Transit Development Plan Dutchess County had not analyzed its transit services since 1990. The county undertook a Transit Development Plan, releasing the final version in March 2009. The TDP called for a much simpler version of the LOOP system to improve customer service. Yet while the TDP completed a thorough analysis of routes and operations, it did not go so far as to identify major trip generators and potential transit customers in the county’s rural areas. The county cut fixed-route services at the beginning of 2009, anticipating implementation of a new simplified service. Budget problems, however, stalled implementation and throughout 2009 and into 2010 there was no transit service in areas that used to have service before 2009. This cut of fixed route service means that complementary ADA paratransit has also been cut.
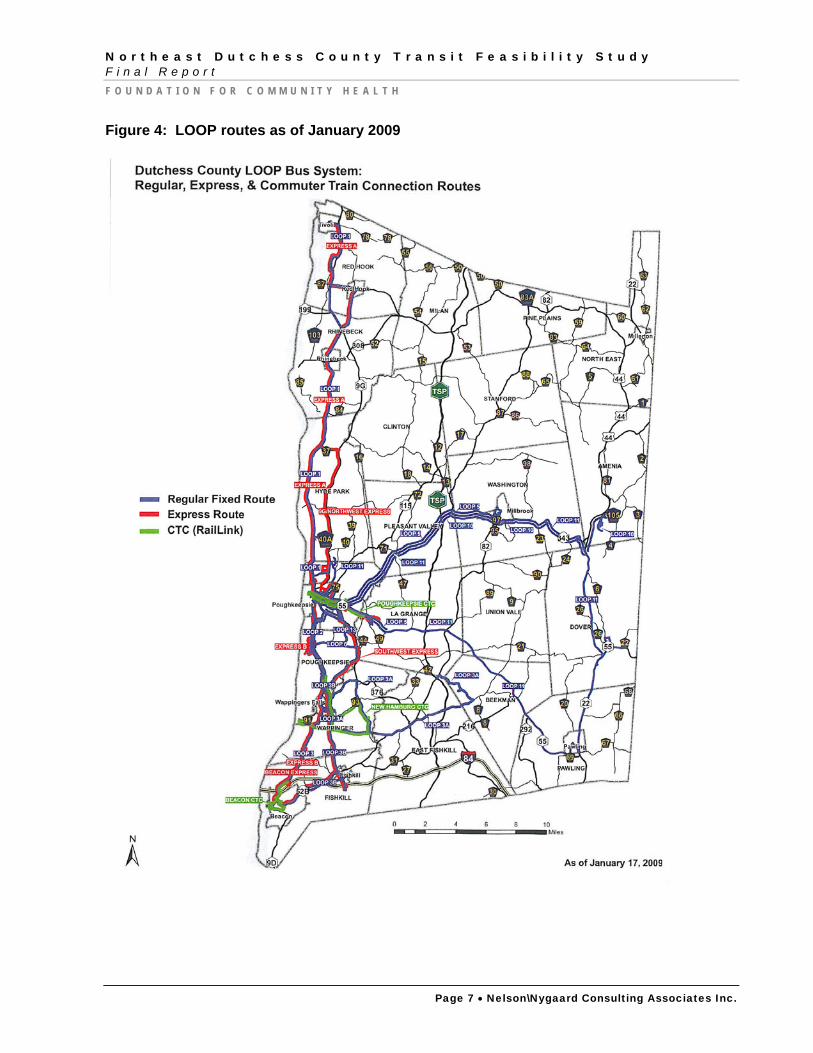
Current transportation services LOOP – As of January 2009, LOOP routes continue to serve Millbrook , Dover, and a small portion of south Amenia, as shown in Figure 4. Fares were raised in July 2009 to $1.75 per one-way trip, with discounts available for seniors, children, students, and persons with disabilities.
Dutchess County Office for the Aging – The Office for the Aging maintains friendship centers in most towns. The office provides a van that picks up people and brings them to the friendship centers, which provide daily lunches as well as social activities. Some friendship center heads also have a vehicle to take people on shopping and medical trips. The friendship center run in Amenia, for example, has such a vehicle. The Millerton vehicle was totaled in 2008 and not replaced. The Center Director uses her personal vehicle to pick-up those who need rides and is reimbursed for mileage.
Friends of Seniors is a volunteer-based nonprofit that supports the basic needs of the older adult community in the form of nonemergency medical transportation, including dialysis, grocery shopping, visiting, telephone reassurance and respite for primary caregivers. It serves 15 cities/towns in Dutchess County, including Beacon, Castle Point, Clinton Corners, Dover, East Fishkill, Fishkill, Hyde Park, Lagrange, Pleasant Valley, both the city and town of Poughkeepsie, Stanford, Wappingers Falls, Washington (Millbrook). Hours of operation are from approximately 5:00 a.m. to 5:00 p.m. Its services are free with a suggested donation of $5 roundtrip. Volunteers drive their own cars. Friends of Seniors does not have a van, thus is not wheelchair accessible. There is a Friends of Seniors four-door sedan also on the road, which has insurance to drive seniors to as far as 250 miles outside Dutchess County in any direction. FoS has 50 volunteers, 37 of whom are drivers. Its main office is in Poughkeepsie with two paid staff member. Plans are in the works to share space with the Dutchess Community Action Agency in Dover Plains, which should be completed by the end of May 2010. Funding sources in 2010 include DC Office for the Aging, the Community Foundation of Dutchess County, the United Way, and the Community Development Block Grant overseen by the DC Department of Planning, as well as fundraisers and donations from the clients and the public. North East Community Center Care Car – Based in Millerton, the NECC provides trips to clients with volunteer drivers. The NECC owns two vehicles: a four-door sedan and a seven-passenger van. Volunteers may use one of the NECC’s vehicles or their personal car for trips. Clients generally live in North East, Amenia, Dover, and Washington; however, if there is availability the center will take on clients living in other towns. Care Car trips are prioritized for medical and social service appointments, although trips are also provided for errands and social
N o r t h e a s t D u t c h e s s C o u n t y T r a n s i t F e a s i b i l i t y S t u d y F i n a l R e p o r t F O U N D A T I O N F O R C O M M U N I T Y H E A L T H
Page 6 • Nelson\Nygaard Consulting Associates Inc.
events pending an available volunteer. Many trips are made to Connecticut, primarily to the Sharon Hospital area. Around five to seven volunteers provide 275 rides per year to 12 individuals per month, or four to five individuals per week. Like FoS, Care Car is a door-through-door service. The service is free, although there is a suggested donation of $5 for a local trip.1 Service is funded by donations and grants from government agencies and the Foundation for Community Health.
1 Senior Transportation Services in Dutchess County: Challenges and Opportunities. Dutchess County Office for the Aging. October 2007. Page 13.
N o r t h e a s t D u t c h e s s C o u n t y T r a n s i t F e a s i b i l i t y S t u d y F i n a l R e p o r t F O U N D A T I O N F O R C O M M U N I T Y H E A L T H
Page 7 • Nelson\Nygaard Consulting Associates Inc.
Figure 4: LOOP routes as of January 2009
N o r t h e a s t D u t c h e s s C o u n t y T r a n s i t F e a s i b i l i t y S t u d y F i n a l R e p o r t F O U N D A T I O N F O R C O M M U N I T Y H E A L T H
Page 8 • Nelson\Nygaard Consulting Associates Inc.
Proposed County Services The county proposes two services for the rural areas of the county outside Poughkeepsie – a simplified LOOP fixed-route system and a “Flex” service.
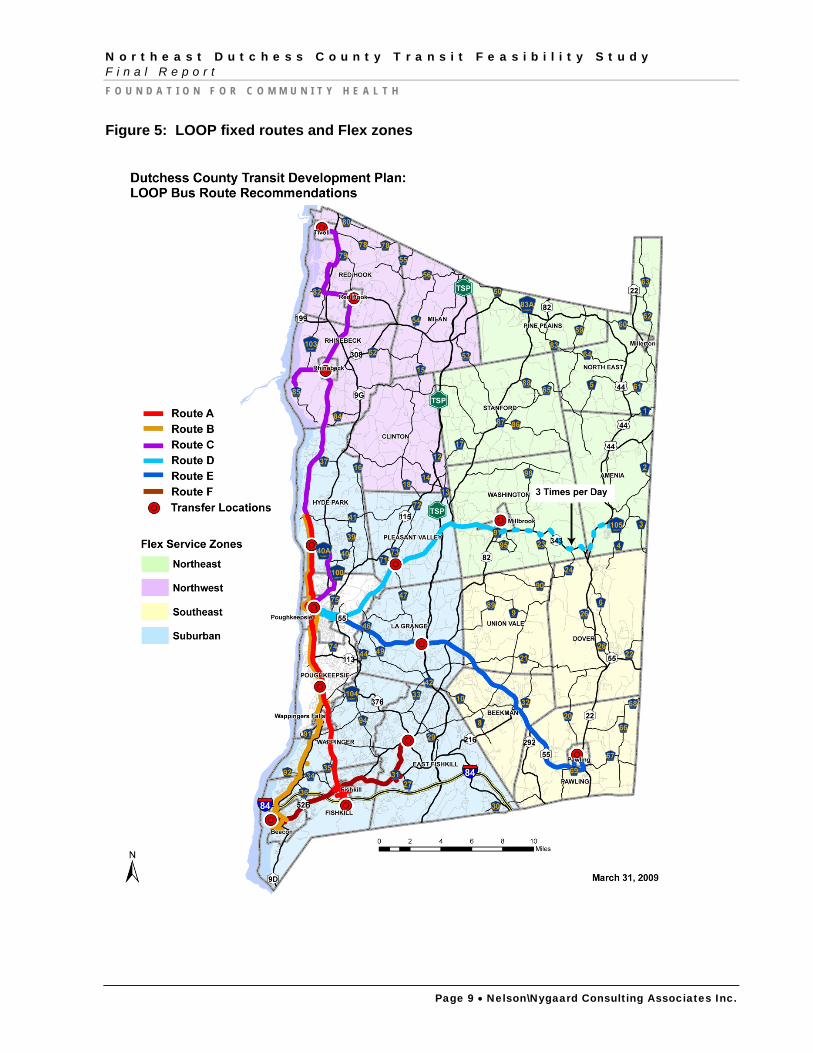
LOOP Service The new LOOP system consists of six fixed routes. The routes operate as a hub and spoke system, with the hub being Poughkeepsie. In general, buses will operate from 6 AM to 12:35 AM, Monday through Saturday. One route serves the study area, and a second serves near the study area.
LOOP Route D will travel from Poughkeepsie, east on Route 44, and to the Millbrook transfer point at the Eastern Dutchess Government Center. Eight buses per day will serve this route. Three of those buses will go out to Wassaic’s Metro-North station, a trip timed for reverse commuting from Poughkeepsie to Wassaic.
LOOP Route E does not directly serve the study area, but it does serve Pawling, the town just south of Dover. The route travels from downtown Poughkeepsie eastbound on Route 55, through Union Vale and Beekman, and terminates at the Pawling Chamber of Commerce. Seven buses per day will serve this route. Due to interest from local apartment residents, the bus will have a 30-minute deviation time built into its end point at Pawling to pick up those who call ahead to ask for a pick-up. A map of the proposed LOOP system is shown in Figure 5.
Flex To complement the fixed route, the county has been divided into four service areas as shown in Figure 5. The entire Northeast Zone is within this study’s analysis area. One town in the Southeast Zone, Dover, is part of the study area. Thus the transportation needs of Union Vale, Beekman, and Pawling were not analyzed in this study. Each zone will receive service on one vehicle, one day per week. The type of service Flex will become is a core focus of this study.
The parameters surrounding the design of Flex include:
Six hours of service per day broken into two three-hour shifts with an hour lunch break
Schedules can include unpaid breaks during the three-hour shifts for up to one hour
Service one day per week per zone
One bus per zone
Vehicle type: 20-passenger, lift-equipped
Service costs $72 per hour. Towns may purchase more days of service if they wish – service must be purchased for a full day, not for just an additional hour
For travel outside the zone, like to Poughkeepsie, customers are taken to a designated transfer point to switch to LOOP (for the northeast zone, the transfer point is Millbrook; for the Southeast, it is Pawling)
Passengers pay a $1.75 fare for each bus they board – thus if someone takes Flex from the Northeast zone to Millbrook to catch Route D, they pay $1.75 x 2
N o r t h e a s t D u t c h e s s C o u n t y T r a n s i t F e a s i b i l i t y S t u d y F i n a l R e p o r t F O U N D A T I O N F O R C O M M U N I T Y H E A L T H
Page 9 • Nelson\Nygaard Consulting Associates Inc.
Figure 5: LOOP fixed routes and Flex zones
N o r t h e a s t D u t c h e s s C o u n t y T r a n s i t F e a s i b i l i t y S t u d y F i n a l R e p o r t F O U N D A T I O N F O R C O M M U N I T Y H E A L T H
Page 10 • Nelson\Nygaard Consulting Associates Inc.
Inventory of Need In order to create a transportation service for the study area, an inventory of where and how people travel was undertaken. The inventory took two approaches – first, focus groups were conducted with potential customers as well as with human service agency representatives and non-profits who have clients who need transportation. At each focus group, participants were asked to describe where they commonly travel to, how they travel today, and where they wish they could go. Human service agencies were asked to describe the programs they provide, how clients get to programs today, and where transportation gaps exist.
Second, a written survey was distributed to reach out to those people who could not attend or did not know about the focus groups. We utilized project stakeholders and Task Force members to widely distribute the survey. The written survey asked people to list their top three destinations, how they get there, how often they go there, the day of week they travel, and places they wish they could go.
Through these two main channels, a significant amount of input was gathered that showed peoples’ travel patterns, as detailed below.
Focus Groups – Potential Customers Five focus groups were held on February 17 and 18, 2010, with potential riders of the new service. Older adults made up the majority of participants, as phone conversations with local agencies and town supervisors revealed that the senior population has the most need for transportation. Primary findings from the focus group included destinations people go to today, places they wish they could go, how they currently get around, and experiences traveling in the region. The full set of notes from the focus groups is located in Appendix B. Focus groups were held at the following locations:
Millerton nutrition site/friendship center (4 participants)
Amenia nutrition site/friendship center (3 participants)
Wingdale senior group held at the American Legion (30 participants)
GED class for English speakers held at Millerton Elementary (13 participants)
GED class for Spanish speakers held at Millerton Elementary (11 participants)
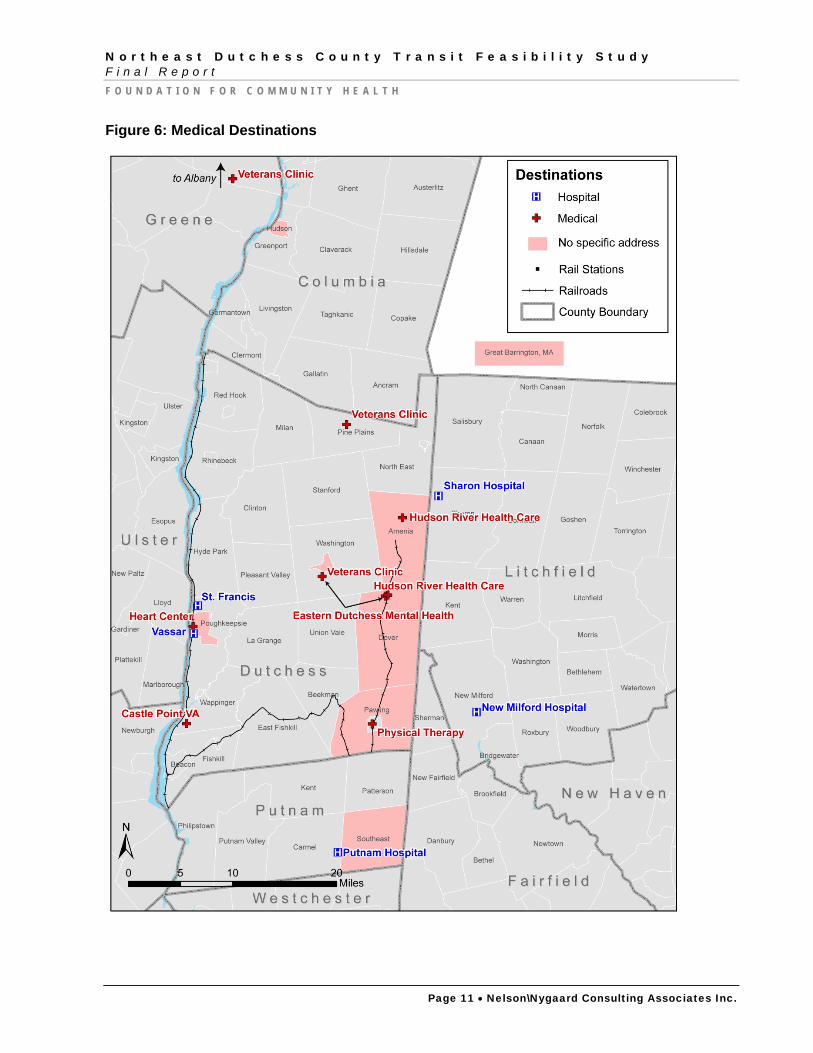
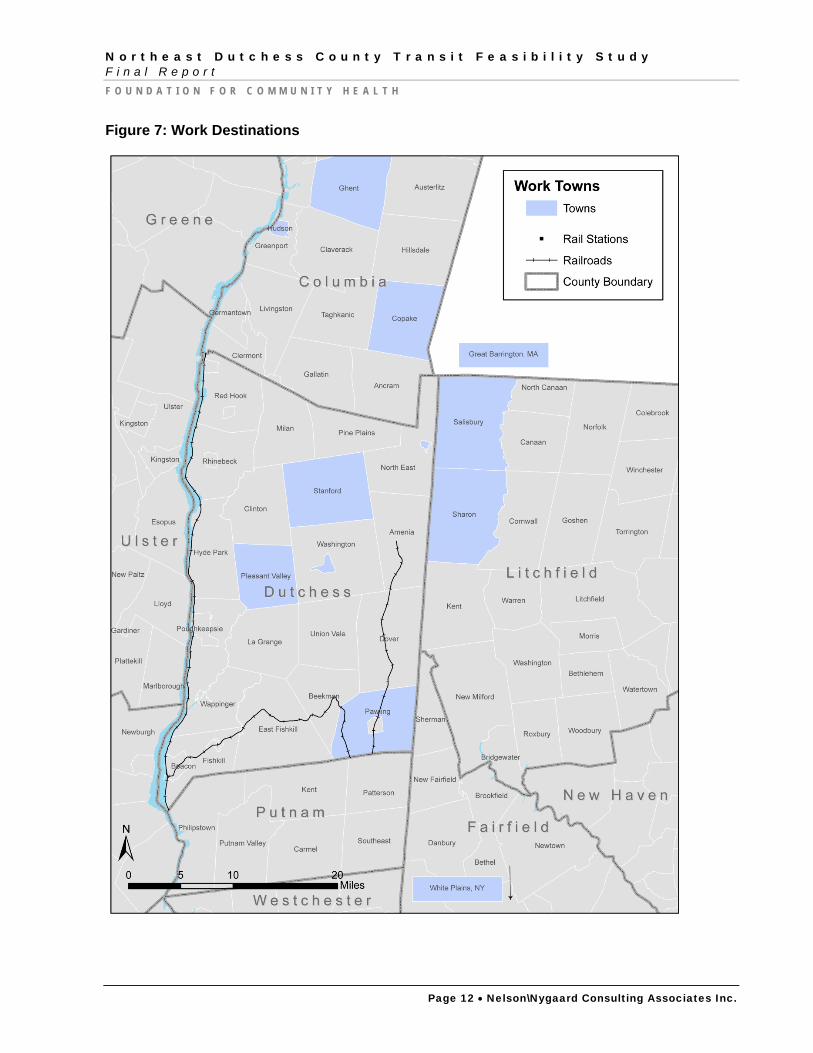
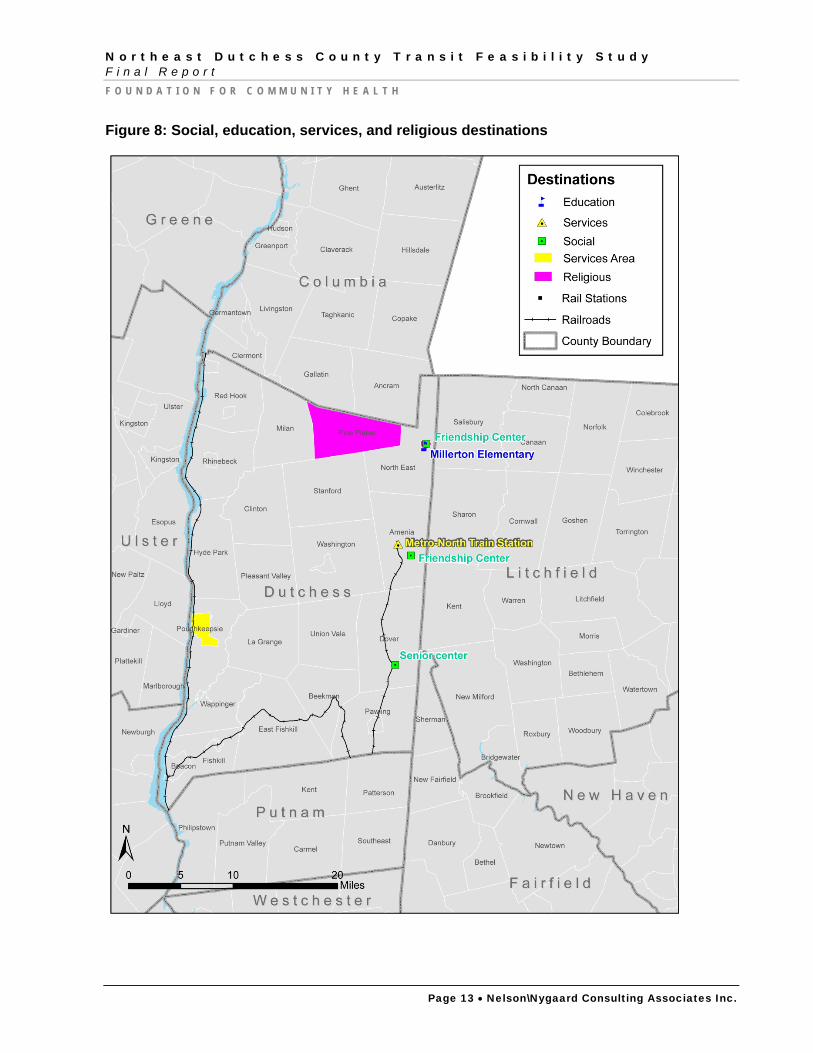
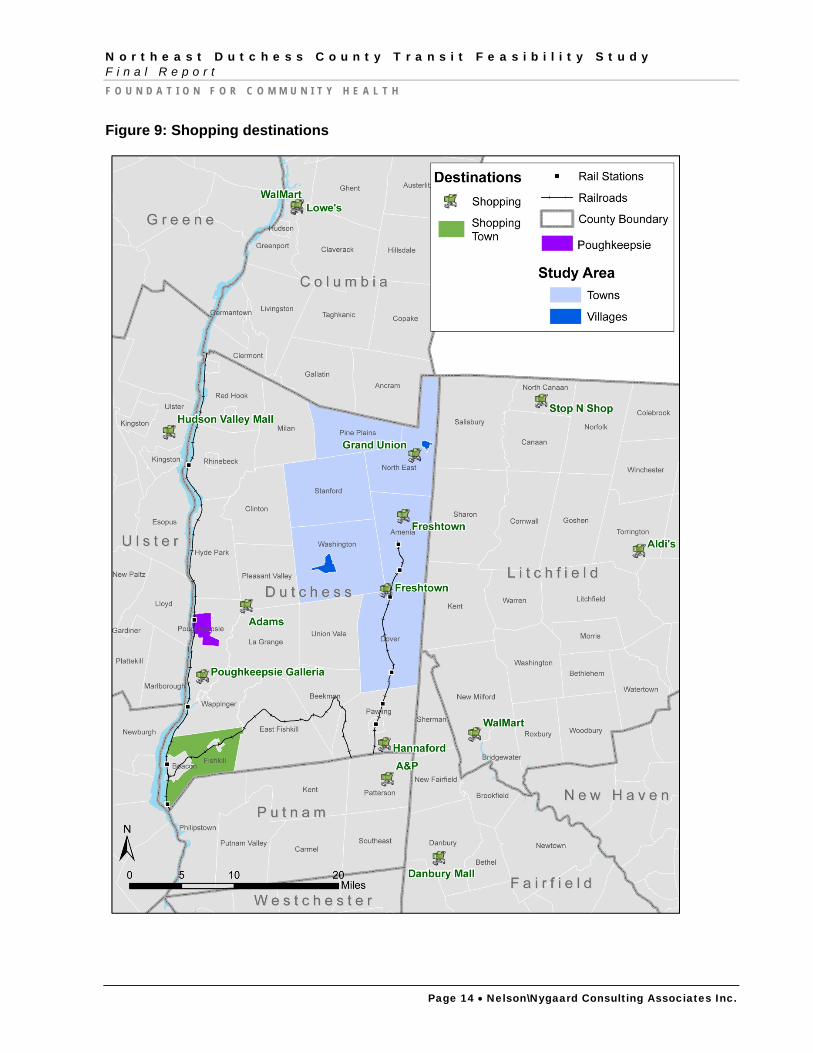
Destinations The following series of maps shows the destinations called out in the focus groups. In cases where people named a town, rather than a specific destination, the whole town has been highlighted. The work destinations came from the GED class participants. Shopping trips were called out the most after medical appointments as the most common destinations. Nearly all participants still drive today, although all knew a friend or family member who cannot drive and relies upon others to get around.
N o r t h e a s t D u t c h e s s C o u n t y T r a n s i t F e a s i b i l i t y S t u d y F i n a l R e p o r t F O U N D A T I O N F O R C O M M U N I T Y H E A L T H
Page 11 • Nelson\Nygaard Consulting Associates Inc.
Figure 6: Medical Destinations
N o r t h e a s t D u t c h e s s C o u n t y T r a n s i t F e a s i b i l i t y S t u d y F i n a l R e p o r t F O U N D A T I O N F O R C O M M U N I T Y H E A L T H
Page 12 • Nelson\Nygaard Consulting Associates Inc.
Figure 7: Work Destinations
N o r t h e a s t D u t c h e s s C o u n t y T r a n s i t F e a s i b i l i t y S t u d y F i n a l R e p o r t F O U N D A T I O N F O R C O M M U N I T Y H E A L T H
Page 13 • Nelson\Nygaard Consulting Associates Inc.
Figure 8: Social, education, services, and religious destinations
N o r t h e a s t D u t c h e s s C o u n t y T r a n s i t F e a s i b i l i t y S t u d y F i n a l R e p o r t F O U N D A T I O N F O R C O M M U N I T Y H E A L T H
Page 14 • Nelson\Nygaard Consulting Associates Inc.
Figure 9: Shopping destinations
N o r t h e a s t D u t c h e s s C o u n t y T r a n s i t F e a s i b i l i t y S t u d y F i n a l R e p o r t F O U N D A T I O N F O R C O M M U N I T Y H E A L T H
Page 15 • Nelson\Nygaard Consulting Associates Inc.
Information Marketing the new service will be a critical piece of making it a success. Participants were asked the channels they use to get information. Some popular answers were the Millerton News and Channel 22 on Cablevision. The complete list includes:
Newspapers
– Poughkeepsie Journal
– Millerton News
– La Voz
Television
– Channel 22 Cablevision serves Dover, Amenia
Churches
Office for the Aging
Penny Saver
North East Community Center
Town Bulletins & Newsletters
Radio
– Robin Hood FM Sharon
– 103.3 Lakeville
Word of Mouth
Town Hall
Post Office
Internet (mostly GED participants)
Promotores (local leaders)
GED/ESL classes
CVS/Grand Union
Four Brothers
Spanish-Speaking Potential Customers This group had the lowest vehicle ownership of the focus groups – half said they do not own a car. Their places of work were varied – some worked in the study area while others worked in farther off places like Great Barrington, MA and White Plains. The best day for travel varied between men and women – men said midweek would work because most work in the restaurant industry; on the other hand, women typically work in day care or custodial services, so weekends work better. The old LOOP system was difficult to understand because materials were printed only in English and the routes were long and circuitous. This group emphasized the need to get to Wassaic train station. All the participants knew of someone who lost a job or could not take a job due to lack of transportation.
N o r t h e a s t D u t c h e s s C o u n t y T r a n s i t F e a s i b i l i t y S t u d y F i n a l R e p o r t F O U N D A T I O N F O R C O M M U N I T Y H E A L T H
Page 16 • Nelson\Nygaard Consulting Associates Inc.
Conclusions/Findings People are aware that, while they may be able to drive at the present, they may lose that
ability as they age, and driving is really the only way to get around the study area.
Some people are comfortable driving locally but not on longer trips, like to Poughkeepsie.
Some participants had used LOOP before and liked it – people are willing to take public transportation.
The volunteer driver services provided by the North East Community Center and Friends of Seniors are excellent – the problem is that there are not enough volunteers to handle need.
The Office for the Aging drivers take people to more than just the nutrition sites – they also take people shopping.
Generally any day during the week is a good time to travel.
Doctors are a major destination, but they are also very spread out, meaning it would be hard to serve those trips with a fixed route.
People live quite far from the main roads, meaning a curb-to-curb service would reach the more remote residents.
Some trips, such as to popular shopping destinations, could be scheduled in advance.
While medical trips are extremely important, providing social and shopping trips is also needed.
Focus Group – Collaborators & Providers Social service and health agencies have clients who sometimes have issues making appointments because of lack of transportation. The full set of notes is provided in Appendix C.
Collaborators Several agencies that have clients who need transportation gave input as to transportation needs in the community.
Veterans Clinic, Pine Plains: This clinic is available on Tuesdays and Thursdays in downtown Pine Plains. Everyone today drives themselves or is dropped off at the clinic. The clinic in Fishkill has a volunteer driver program, but in Pine Plains they have had trouble getting volunteers.
Eastern Dutchess Mental Health, Dover Plains & Millbrook: The two clinics together have 130 outpatients. Of those people, 25-30 have trouble meeting appointments due to lack of transportation. Clinics meet twice per week and clients are seen at least once a month. Since clients usually see a social worker and a psychologist, that means they go to the clinic twice per month. The Dover Plains clinic has the higher no-show rate.
Dover Recreation Department: Two senior groups meet at the American Legion, which is located in the basement of the Dover Plains Library. One group meets Mondays from 10 AM-2:30 PM and the other meets Thursdays from 9:30 AM-2:30 PM. The Thursday group is much larger. Many more would go but cannot get there, and there is a problem getting volunteer drivers.
N o r t h e a s t D u t c h e s s C o u n t y T r a n s i t F e a s i b i l i t y S t u d y F i n a l R e p o r t F O U N D A T I O N F O R C O M M U N I T Y H E A L T H
Page 17 • Nelson\Nygaard Consulting Associates Inc.
Department of Health: Provides transportation via taxi to those who are not on Medicaid. In a year, the department typically serves 45 people, mostly taking people from home to Poughkeepsie or Albany. A handful of those 45 people, maybe six or seven, are from eastern Dutchess County.
Dutchess Community Action Partnership, Dover Plains: DCAP helps people apply for social services, provides translations, and runs a food pantry and gift shop. DCAP’s senior client advocate represents Millerton and Amenia. The social services hub is in Millbrook, but many cannot make it there. DCAP meets with people Monday and Thursday at the North East Community Center and Tuesday and Wednesday at the Amenia town hall. DCAP can make home visits if necessary.
Providers Local agencies who already provide transportation were asked to describe their services.
Pawling Community Resources & Service Center: This organization has been providing transportation for 34 years, and is open to anyone who lives, works, worships, or has a child attending school in Pawling. The biggest destinations are Danbury Hospital, New Milford Hospital, and Putnam Hospital. The service is free, although donations are accepted, and trips are provided by volunteers driving their own cars. The center serves around 12 individuals per week. Clients must reserve three days in advance. They are funded by Dyson, the United Way, and the Office for the Aging.
Steuben County ARC: Steuben County had been providing transportation for its clients for decades, but around 13 years ago, the agency began working to open its route to the general public. ARC serves an area that is rural in nature and underserved by the local transit agency, Hornell Area Transit. Since ARC was able to show that they were not duplicating services, they were able to enter into a third-party agreement with First Transit, who operates Hornell Area Transit. At the time of expansion to general public service, ARC was providing 80,000 trips per year. ARC is now able to collect 5311 monies, or rural operating funds, by calculating the number of general public passengers they serve each year. In 2009, there were 5,200 general public riders, which earned the agency $73,000 in 5311 money. The system is a fixed route and runs seven days per week from 6-9 AM and 2-5 PM. The fare is $1.50. ARC has a transportation staff of 25 people: a dispatcher, scheduler, driving coordinator, head mechanic, two full-time mechanics, bus cleaner, customer service representative, and 15 drivers. ARC opened its garage to the general public to earn more revenue. They recently applied for 5317 and 5316 funds for mobility management, software purchases, and for creating a call center. ARC receives funds from for-hire services, meaning contracts with other state and local agencies like mental health, to provide trips for certain clients. In order to enter into for-hire agreements, ARC had to receive operating authority from the state.
Geer Adult Day Care: This organization, based in Canaan, CT, runs a transportation program open to the general public. The service is a dial-a-ride, operated with small lift-equipped buses. Minivans are also used. There is no fare, although donations are accepted. The service began in 2001 at 20 hours per week. Today service is provided 40 hours per week due to a grant from the Foundation for Community Health. Since the service has grown slowly and yet is still fairly small, Geer is able to be very flexible and accommodating in its service. There is no set time that people need to call in advance; if someone calls the day they need service and there is availability, Geer will provide the trip. Similarly, there is no restriction on distance. If someone
N o r t h e a s t D u t c h e s s C o u n t y T r a n s i t F e a s i b i l i t y S t u d y F i n a l R e p o r t F O U N D A T I O N F O R C O M M U N I T Y H E A L T H
Page 18 • Nelson\Nygaard Consulting Associates Inc.
needs to get to Hartford, Geer will take them. Geer staff custom-built a scheduling software program used by the dispatcher. Last year Geer provided 5,700 trips. It runs the service six days per week. Monday through Thursday the bus runs from 9 AM-5 PM, while on Friday and Saturday the hours are 11 AM-7 PM to accommodate clients wishing to go out to dinner or to town hall meetings or other events. Geer promoted its service through fliers, radio spots, and television ads. The slogan, “Just One Call,” was very popular; basically, a client would call Geer, tell the dispatcher where they wanted to go and when, and the dispatcher would handle all details, including confirming the appointment with the doctor and calling the client to remind them of their upcoming trip. Geer transportation staff includes a transportation director, an assistant, a full-time dispatcher, and two drivers. Geer also coordinates with the Northwest Transit District, the local public transit agency, to help coordinate rides.
Columbia County Community Health Consortium: This non-profit organization has been providing medical transportation to residents of Columbia County since 1999. Service is provided with seven vehicles (sedans and minivans) plus one minibus with a wheelchair lift acquired through a 5310 application. The transportation service staff includes a transportation director and two part-time staffers, plus 12 part-time paid drivers. The hours of operation are 8 AM-4 PM Monday through Friday. The service is free, although donations are accepted. During the past year, the consortium provided 8,500 trips to approximately 850 individuals. Passengers are generally heading to destinations within Columbia County, although the drivers do also take people to Sharon Hospital, Northern Dutchess Hospital, and Albany. Passengers must call one to two weeks in advance to schedule a trip. Funding sources include donations, legislative grants, a contract with social services, the rural health network of New York State, and Medicaid reimbursements. The consortium has experienced problems with no-shows on Medicaid trips.
Written Survey In order to gather more input from those who either did not know about or could not attend the focus groups, a written survey was distributed to study area residents. The survey asked people their top three destinations, the day of week they required transportation the most, and places they currently cannot access due to transportation limitations. In order to increase the response rate, a stamped return envelope was attached to each survey. In addition, the chance to enter a drawing for a $25 gift card to Freshtown incentivized the survey. The survey questionnaire can be viewed in Appendix F.
The survey was distributed to collaborators, providers, and members of the task force. Approximately 850 surveys were distributed through the following channels, in both English and Spanish:
Amenia nutrition site
Dutchess Community Action Partnership
Tally-Ho mobile homes
Wassaic senior group
Sharon Hospital
Rennia Real Estate – mobile home parks
Department of Health
N o r t h e a s t D u t c h e s s C o u n t y T r a n s i t F e a s i b i l i t y S t u d y F i n a l R e p o r t F O U N D A T I O N F O R C O M M U N I T Y H E A L T H
Page 19 • Nelson\Nygaard Consulting Associates Inc.
Veterans Agency
Eastern Dutchess Mental Health
Wingdale senior group
Millerton GED classes
Former Dover Dial-a-Ride customers
Department of Probation
American Cancer Society – while conducting door-to-door health surveys in the study area
Hudson River Health Care
Gayle Hendrickson – posted 150 surveys in grocery stores, post office, etc.
Wassaic Train Station
Survey Respondent Characteristics A total of 167 surveys were returned by the deadline of March 24. Respondent place of residence is shown in Figure 10. Of the responses, 16 percent were Spanish-language respondents. Just over half of respondents either do not own a vehicle or only have access to a vehicle sometimes (Figure 11). Three-quarters of respondents said they are not working or are retired.
Figure 10: Place of Residence
N o r t h e a s t D u t c h e s s C o u n t y T r a n s i t F e a s i b i l i t y S t u d y F i n a l R e p o r t F O U N D A T I O N F O R C O M M U N I T Y H E A L T H
Page 20 • Nelson\Nygaard Consulting Associates Inc.
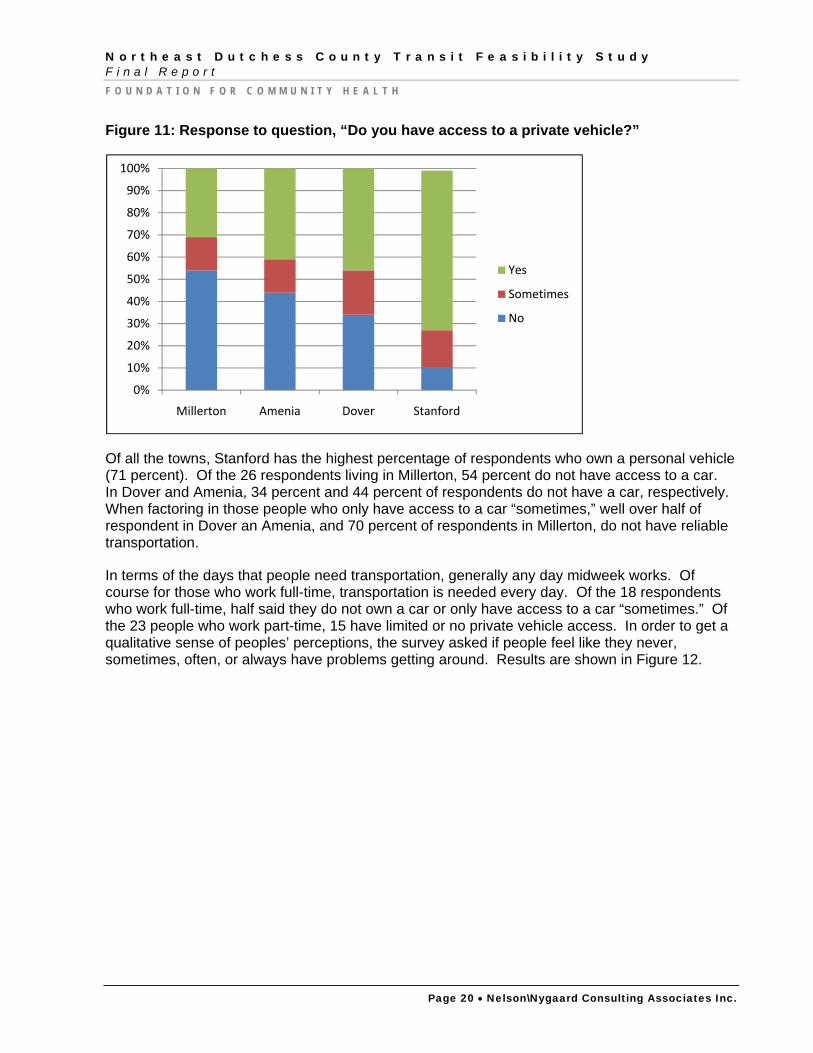
Figure 11: Response to question, “Do you have access to a private vehicle?”
Of all the towns, Stanford has the highest percentage of respondents who own a personal vehicle (71 percent). Of the 26 respondents living in Millerton, 54 percent do not have access to a car. In Dover and Amenia, 34 percent and 44 percent of respondents do not have a car, respectively. When factoring in those people who only have access to a car “sometimes,” well over half of respondent in Dover an Amenia, and 70 percent of respondents in Millerton, do not have reliable transportation.
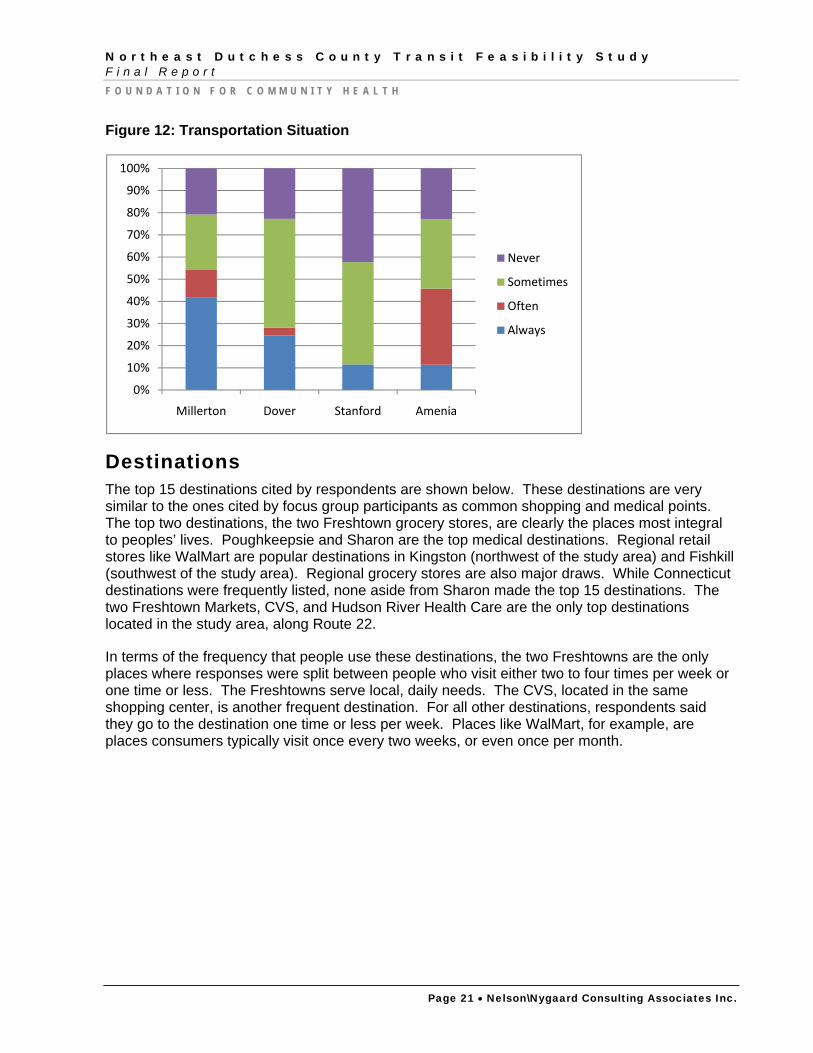
In terms of the days that people need transportation, generally any day midweek works. Of course for those who work full-time, transportation is needed every day. Of the 18 respondents who work full-time, half said they do not own a car or only have access to a car “sometimes.” Of the 23 people who work part-time, 15 have limited or no private vehicle access. In order to get a qualitative sense of peoples’ perceptions, the survey asked if people feel like they never, sometimes, often, or always have problems getting around. Results are shown in Figure 12.
0%
10%
20%
30%
40%
50%
60%
70%
80%
90%
100%
Millerton Amenia Dover Stanford
Yes
Sometimes
No
N o r t h e a s t D u t c h e s s C o u n t y T r a n s i t F e a s i b i l i t y S t u d y F i n a l R e p o r t F O U N D A T I O N F O R C O M M U N I T Y H E A L T H
Page 21 • Nelson\Nygaard Consulting Associates Inc.
Figure 12: Transportation Situation
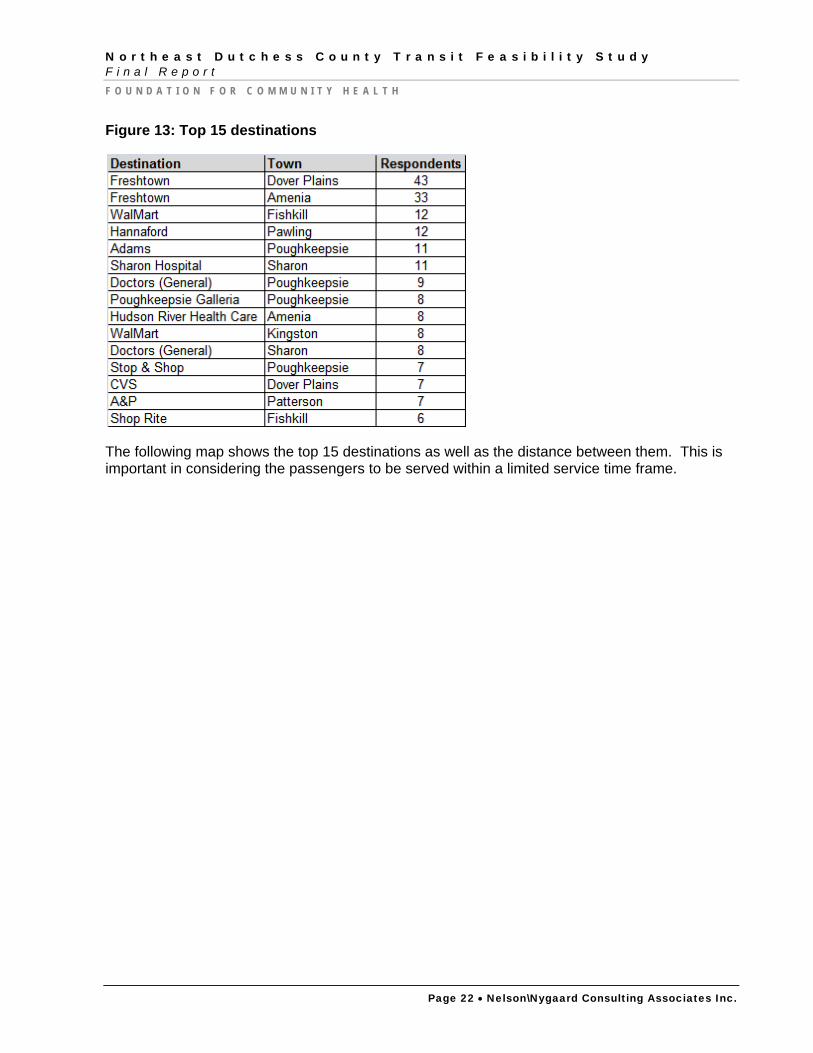
Destinations The top 15 destinations cited by respondents are shown below. These destinations are very similar to the ones cited by focus group participants as common shopping and medical points. The top two destinations, the two Freshtown grocery stores, are clearly the places most integral to peoples’ lives. Poughkeepsie and Sharon are the top medical destinations. Regional retail stores like WalMart are popular destinations in Kingston (northwest of the study area) and Fishkill (southwest of the study area). Regional grocery stores are also major draws. While Connecticut destinations were frequently listed, none aside from Sharon made the top 15 destinations. The two Freshtown Markets, CVS, and Hudson River Health Care are the only top destinations located in the study area, along Route 22.
In terms of the frequency that people use these destinations, the two Freshtowns are the only places where responses were split between people who visit either two to four times per week or one time or less. The Freshtowns serve local, daily needs. The CVS, located in the same shopping center, is another frequent destination. For all other destinations, respondents said they go to the destination one time or less per week. Places like WalMart, for example, are places consumers typically visit once every two weeks, or even once per month.
0%
10%
20%
30%
40%
50%
60%
70%
80%
90%
100%
Millerton Dover Stanford Amenia
Never
Sometimes
Often
Always
N o r t h e a s t D u t c h e s s C o u n t y T r a n s i t F e a s i b i l i t y S t u d y F i n a l R e p o r t F O U N D A T I O N F O R C O M M U N I T Y H E A L T H
Page 22 • Nelson\Nygaard Consulting Associates Inc.
Figure 13: Top 15 destinations
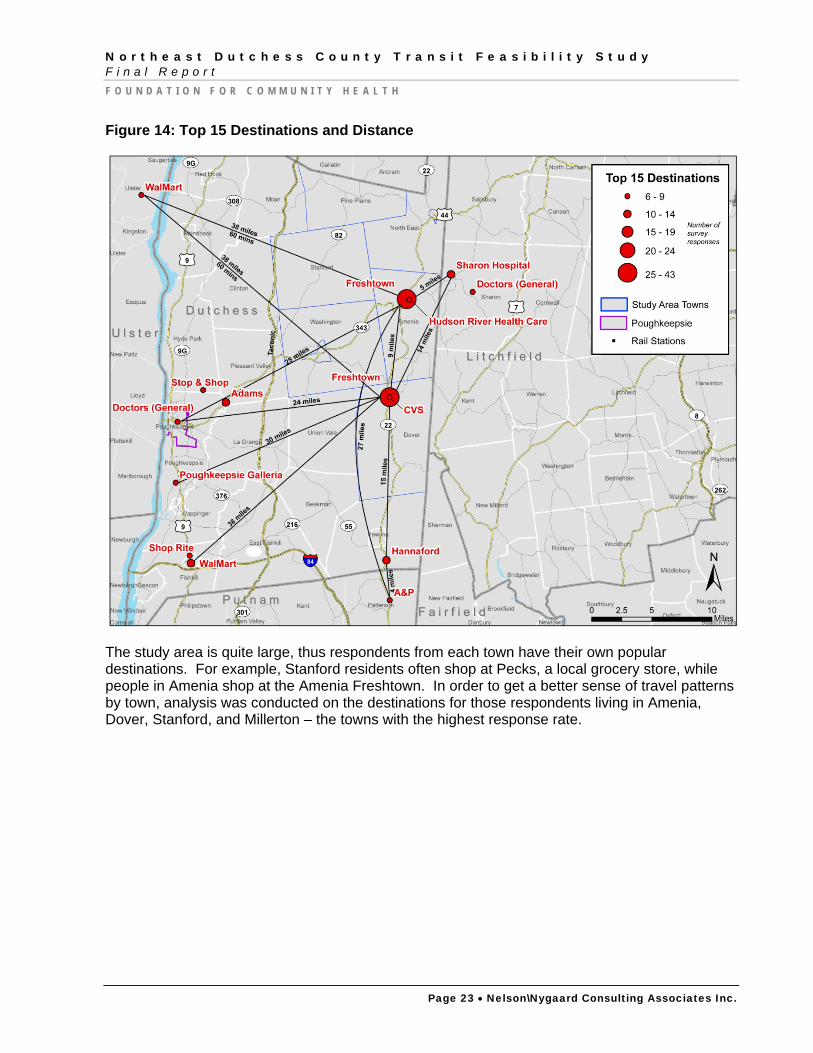
The following map shows the top 15 destinations as well as the distance between them. This is important in considering the passengers to be served within a limited service time frame.
N o r t h e a s t D u t c h e s s C o u n t y T r a n s i t F e a s i b i l i t y S t u d y F i n a l R e p o r t F O U N D A T I O N F O R C O M M U N I T Y H E A L T H
Page 23 • Nelson\Nygaard Consulting Associates Inc.
Figure 14: Top 15 Destinations and Distance
The study area is quite large, thus respondents from each town have their own popular destinations. For example, Stanford residents often shop at Pecks, a local grocery store, while people in Amenia shop at the Amenia Freshtown. In order to get a better sense of travel patterns by town, analysis was conducted on the destinations for those respondents living in Amenia, Dover, Stanford, and Millerton – the towns with the highest response rate.
N o r t h e a s t D u t c h e s s C o u n t y T r a n s i t F e a s i b i l i t y S t u d y F i n a l R e p o r t F O U N D A T I O N F O R C O M M U N I T Y H E A L T H
Page 24 • Nelson\Nygaard Consulting Associates Inc.
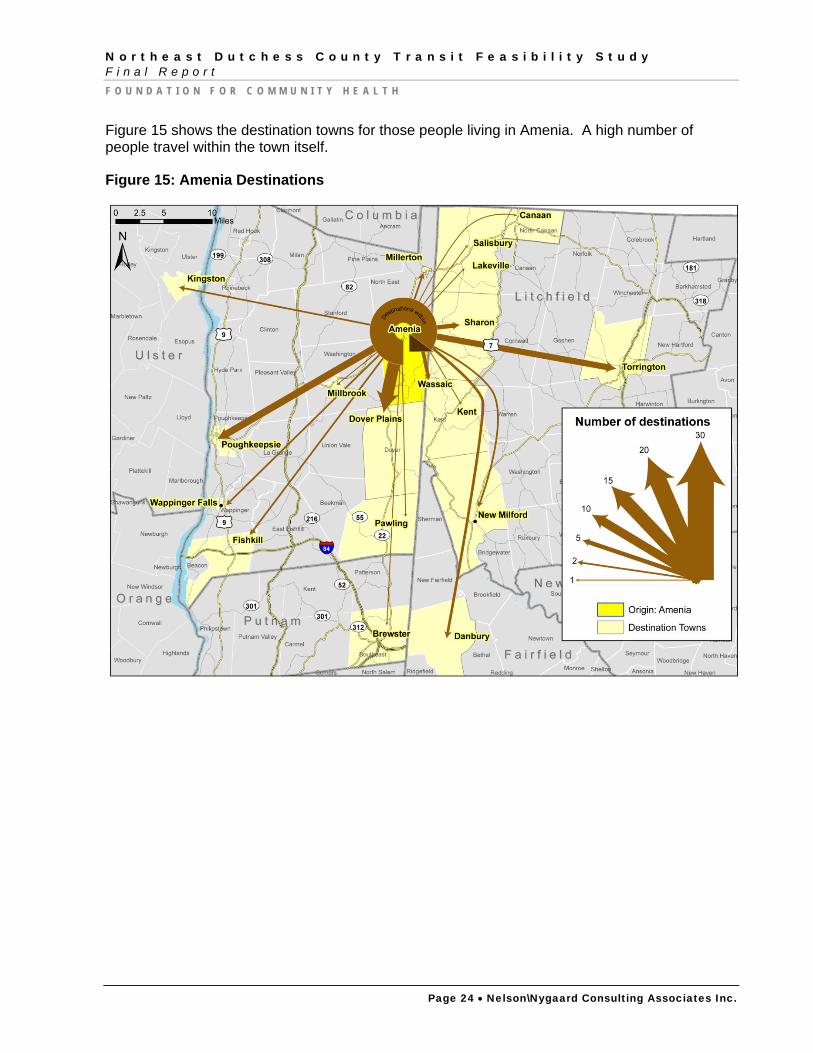
Figure 15 shows the destination towns for those people living in Amenia. A high number of people travel within the town itself.
Figure 15: Amenia Destinations
N o r t h e a s t D u t c h e s s C o u n t y T r a n s i t F e a s i b i l i t y S t u d y F i n a l R e p o r t F O U N D A T I O N F O R C O M M U N I T Y H E A L T H
Page 25 • Nelson\Nygaard Consulting Associates Inc.
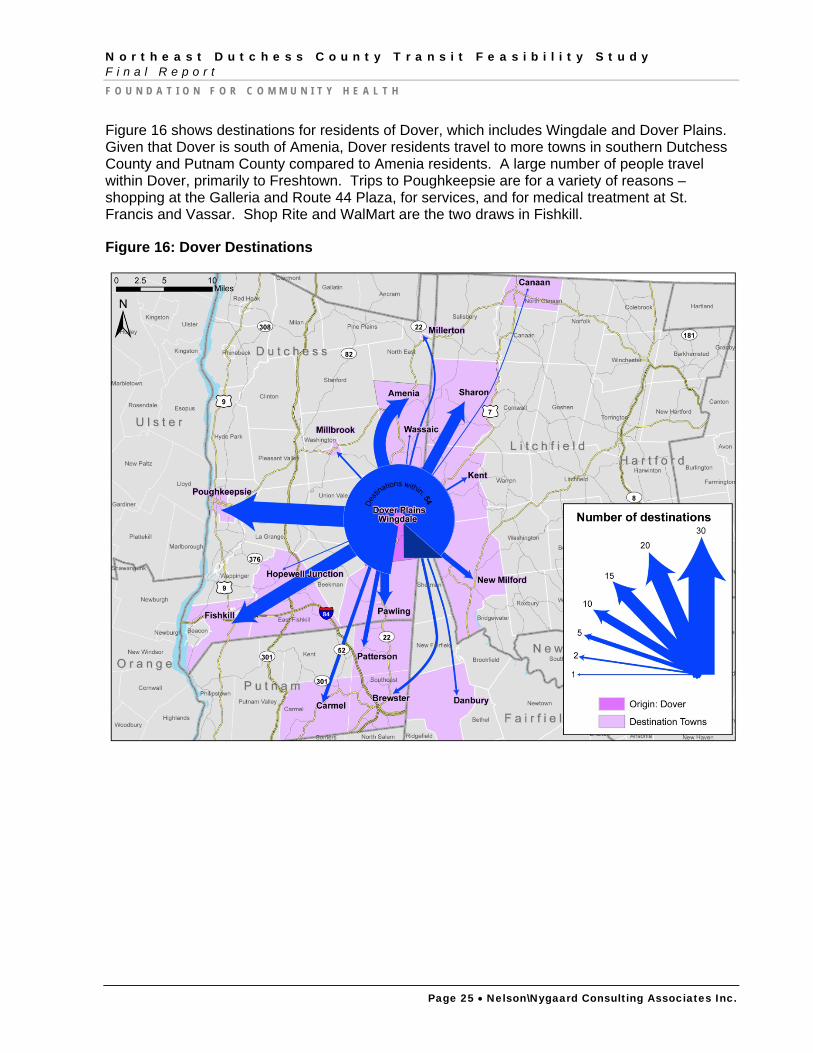
Figure 16 shows destinations for residents of Dover, which includes Wingdale and Dover Plains. Given that Dover is south of Amenia, Dover residents travel to more towns in southern Dutchess County and Putnam County compared to Amenia residents. A large number of people travel within Dover, primarily to Freshtown. Trips to Poughkeepsie are for a variety of reasons – shopping at the Galleria and Route 44 Plaza, for services, and for medical treatment at St. Francis and Vassar. Shop Rite and WalMart are the two draws in Fishkill.
Figure 16: Dover Destinations
N o r t h e a s t D u t c h e s s C o u n t y T r a n s i t F e a s i b i l i t y S t u d y F i n a l R e p o r t F O U N D A T I O N F O R C O M M U N I T Y H E A L T H
Page 26 • Nelson\Nygaard Consulting Associates Inc.
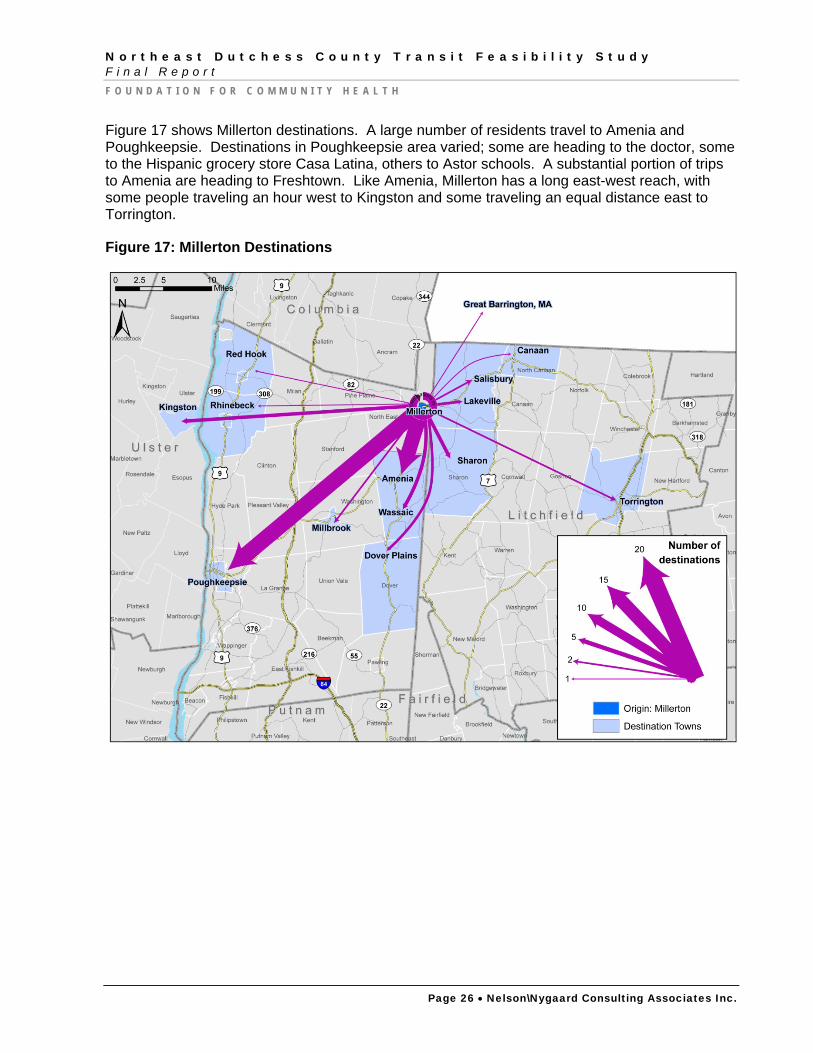
Figure 17 shows Millerton destinations. A large number of residents travel to Amenia and Poughkeepsie. Destinations in Poughkeepsie area varied; some are heading to the doctor, some to the Hispanic grocery store Casa Latina, others to Astor schools. A substantial portion of trips to Amenia are heading to Freshtown. Like Amenia, Millerton has a long east-west reach, with some people traveling an hour west to Kingston and some traveling an equal distance east to Torrington.
Figure 17: Millerton Destinations
N o r t h e a s t D u t c h e s s C o u n t y T r a n s i t F e a s i b i l i t y S t u d y F i n a l R e p o r t F O U N D A T I O N F O R C O M M U N I T Y H E A L T H
Page 27 • Nelson\Nygaard Consulting Associates Inc.
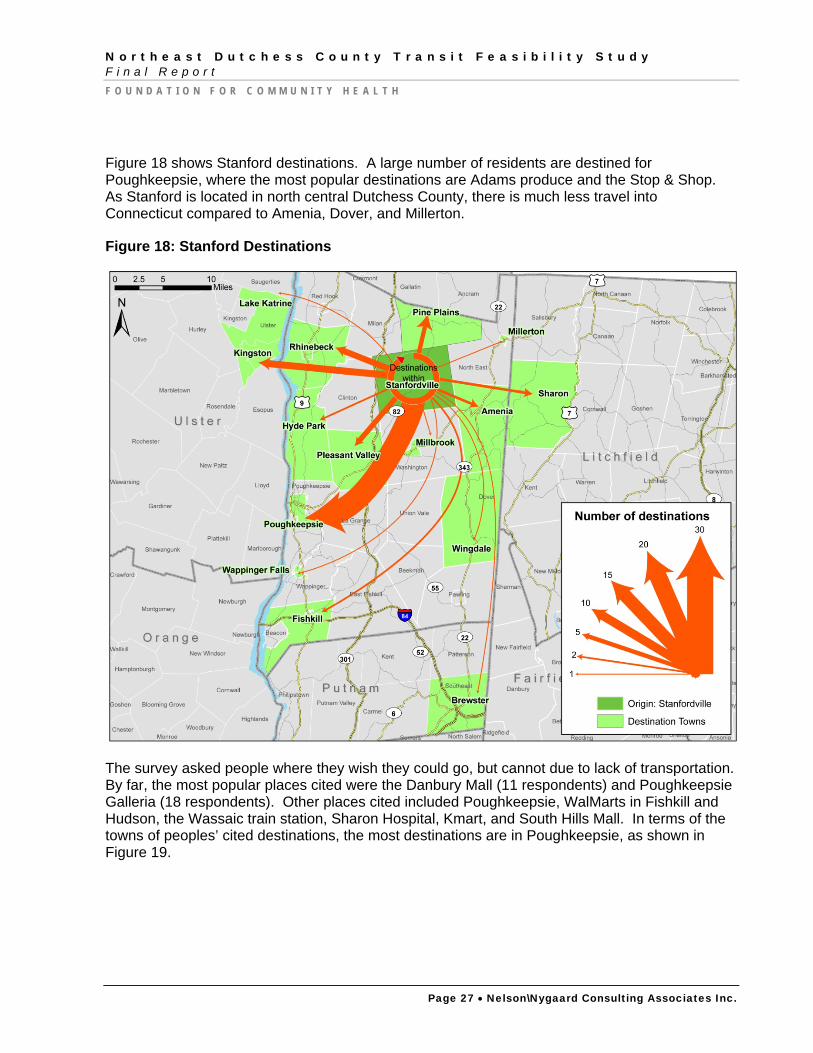
Figure 18 shows Stanford destinations. A large number of residents are destined for Poughkeepsie, where the most popular destinations are Adams produce and the Stop & Shop. As Stanford is located in north central Dutchess County, there is much less travel into Connecticut compared to Amenia, Dover, and Millerton.
Figure 18: Stanford Destinations
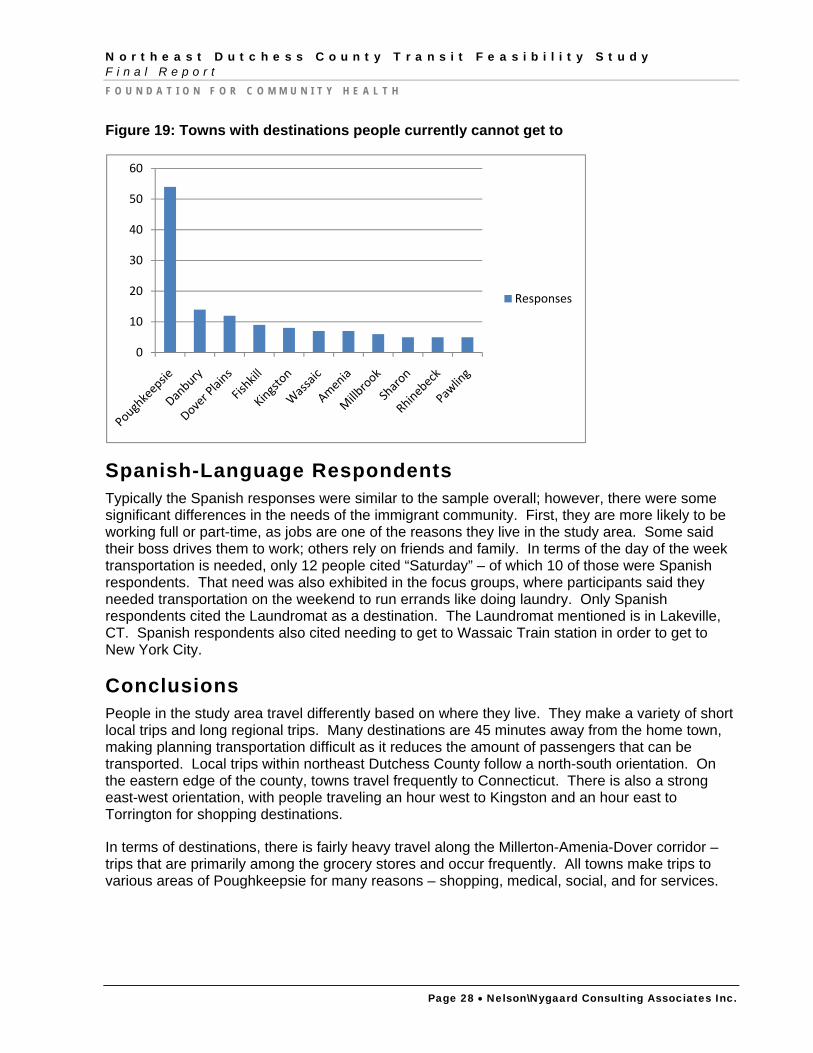
The survey asked people where they wish they could go, but cannot due to lack of transportation. By far, the most popular places cited were the Danbury Mall (11 respondents) and Poughkeepsie Galleria (18 respondents). Other places cited included Poughkeepsie, WalMarts in Fishkill and Hudson, the Wassaic train station, Sharon Hospital, Kmart, and South Hills Mall. In terms of the towns of peoples’ cited destinations, the most destinations are in Poughkeepsie, as shown in Figure 19.
N o r t h e a s t D u t c h e s s C o u n t y T r a n s i t F e a s i b i l i t y S t u d y F i n a l R e p o r t F O U N D A T I O N F O R C O M M U N I T Y H E A L T H
Page 28 • Nelson\Nygaard Consulting Associates Inc.
Figure 19: Towns with destinations people currently cannot get to
Spanish-Language Respondents Typically the Spanish responses were similar to the sample overall; however, there were some significant differences in the needs of the immigrant community. First, they are more likely to be working full or part-time, as jobs are one of the reasons they live in the study area. Some said their boss drives them to work; others rely on friends and family. In terms of the day of the week transportation is needed, only 12 people cited “Saturday” – of which 10 of those were Spanish respondents. That need was also exhibited in the focus groups, where participants said they needed transportation on the weekend to run errands like doing laundry. Only Spanish respondents cited the Laundromat as a destination. The Laundromat mentioned is in Lakeville, CT. Spanish respondents also cited needing to get to Wassaic Train station in order to get to New York City.
Conclusions People in the study area travel differently based on where they live. They make a variety of short local trips and long regional trips. Many destinations are 45 minutes away from the home town, making planning transportation difficult as it reduces the amount of passengers that can be transported. Local trips within northeast Dutchess County follow a north-south orientation. On the eastern edge of the county, towns travel frequently to Connecticut. There is also a strong east-west orientation, with people traveling an hour west to Kingston and an hour east to Torrington for shopping destinations.
In terms of destinations, there is fairly heavy travel along the Millerton-Amenia-Dover corridor – trips that are primarily among the grocery stores and occur frequently. All towns make trips to various areas of Poughkeepsie for many reasons – shopping, medical, social, and for services.
0
10
20
30
40
50
60
Responses


![Woodbury Transit Hub Feasibility [Analysis]](https://img.pdfslide.net/doc/110x75/5868e77a1a28aba27d8b9882/woodbury-transit-hub-feasibility-analysis.jpg)